Article

Do Ecotourism Demonstration Areas Mitigate Tourism Carbon Emissions in China?—A Perspective Based on Quasi-Natural Experimentation

Lancang-Mekong International Cooperation Research Institute, Yunnan Minzu University, Kunming 650500, China
*
Author to whom correspondence should be addressed.
Reg. Sci. Environ. Econ. 2025, 2(2), 9; https://doi.org/10.3390/rsee2020009
Submission received: 26 December 2024 / Revised: 24 March 2025 / Accepted: 25 March 2025 / Published: 15 April 2025

Abstract

:
The close association between policy deployment in ecotourism demonstration areas and low-carbon tourism makes it imperative to explore whether such policies can effectively curb carbon emissions in the tourism sector. This study utilizes an evolutionary game model to theoretically analyze the mechanisms of stakeholders’ strategic tendencies following policy deployment in ecotourism. Empirically, using panel data from 276 prefecture-level cities across China from 2010 to 2019, the establishment of ecotourism demonstration areas was treated as a “quasi-natural experiment”. A multi-period difference-in-differences model was employed to evaluate the inhibitory effects of the policy on tourism carbon emissions and its underlying pathways in the establishment of ecological tourism demonstration zones. The theoretical mechanism reveals that, after the deployment of ecotourism demonstration area policies, local governments, tourism enterprises, and tourists tend to choose low-carbon strategic behaviors. Empirical analysis reveals that ecotourism demonstration areas effectively curb carbon emissions in the tourism industry. The inhibitory effect of the policy exhibits regional heterogeneity, with a significant impact on carbon emission reduction in eastern cities. The policy exerts its inhibitory effects on tourism carbon emissions through increased ecological tourism investment by local governments and self-scaling cointegration by tourism enterprises.

1. Introduction

The goals of peaking carbon emissions and achieving carbon neutrality are crucial strategic initiatives in China’s pursuit of a low-carbon socioeconomic transformation [1]. Attaining the “Dual Carbon” targets is currently a top priority. As a major contributor to the carbon footprint, the tourism industry urgently requires measures to curb emissions from tourism transportation, activities, and accommodation methods.
Simultaneously aligning with the objectives outlined in the “14th Five-Year Plan for the Tourism Industry” and accelerating the promotion of green development in tourism is imperative. Reducing carbon emissions in the tourism industry through supply-side reforms in the ecological aspect is both an urgent task and an essential component of promoting high-quality transformation and achieving the “Dual Carbon” targets.
Ecotourism demonstration areas, established by the National Tourism Administration in 2001 as pilot regions for environmental protection and sustainable tourism development, have become instrumental in this regard. By the end of 2019, 110 national ecotourism demonstration areas were established in three batches (i.e., 2013, 2014, and 2015). According to the “National Ecotourism Demonstration Area Construction and Operation Standards”, these areas are defined as regions relying on natural and cultural ecology, emphasizing educating tourists on nature and ecology to enhance their sense of responsibility toward the environment, ultimately forming sustainable tourism regions. Considering this definition and the background for the “Dual Carbon” initiative, ecotourism demonstration areas bear the responsibility of aiding China in achieving carbon neutrality.
Thus, it is essential to explore whether policies that establish ecotourism demonstration areas have the potential to reduce urban tourism-related carbon emissions. If such an effect exists, what pathways would facilitate this suppression? Is there regional heterogeneity in the policies’ inhibitory effects on tourism-related carbon emissions? Clarifying these questions serves as a scientific basis for evaluating and planning ecotourism demonstration areas, providing practical theoretical support for energy conservation, emissions reduction, and sustainable development in the tourism industry. Therefore, this study uses the establishment of national urban ecotourism demonstration areas as a “quasi-natural experiment”. It employs a multi-period difference-in-differences model for empirical research to examine the inhibitory effects of this policy on tourism-related carbon emissions.
This study contributes primarily to the following aspects. (1) It serves as a crucial link between provincial and county-level regions, and cities play a pivotal role in the spatial organization of economic and social activities. In the context of rapid urbanization, cities are increasingly recognized as major contributors to environmental pollution [2] and serve as primary sources of carbon emissions in the tourism sector. This study examines the establishment of eco-tourism demonstration zones at the national urban level as a policy intervention to mitigate tourism-related carbon emissions. By addressing this issue at its root, the study not only seeks to alleviate the challenges associated with tourism carbon emissions but also fills a critical gap in existing research on tourism-related carbon emissions at the urban scale in China. (2) Analyzing the heterogeneity of the inhibitory effects of the establishment of ecotourism demonstration areas on tourism-related carbon emissions can offer insights into selecting suitable points for establishing tourism ecological demonstration areas. (3) Examining the impact pathways through which the establishment of eco-tourism demonstration zones contributes to the mitigation of tourism-related carbon emissions can provide a theoretical foundation for the high-quality development of urban tourism. Furthermore, this research supports the national “dual carbon” strategy, ultimately facilitating the achievement of sustainable development goals [3].

2. Literature Review

Ecotourism demonstration areas aim to promote sustainable development in the tourism industry and a harmonious coexistence between humans and nature. Establishing these areas to curb tourism-related carbon emissions is necessary. Due to various factors, such as tourism policies, foreign scholars have mainly focused on aspects such as the connotation of ecotourism [4], stakeholders in ecotourism [5], the source market for ecotourism [6], and the impacts of ecotourism [7]. However, domestic scholars have primarily explored the effects of ecotourism demonstration areas and carbon emissions from the tourism industry, with limited studies evaluating the effects of tourism policies. Considering this, this study discusses three aspects of research progress.
The literature on the effects of ecotourism demonstration areas is not predominant. Some scholars [8] used the Poyang Lake Ecotourism Demonstration Area in Jiangxi Province as an example, highlighting that ecotourism can coordinate regional development in aspects such as the economy, environment, and society. Other scholars [9] found a significant positive correlation between ecotourism and economic growth in 69 key tourist cities, indicating its potential to drive regional economic development.
As tourism is a major producer of carbon dioxide [10], its environmental impact has garnered increasing attention from scholars. Research on tourism carbon emissions is rich, with studies such as that of Tang et al. [11], who found that tourist scale and energy intensity positively influence tourism carbon emissions, whereas energy structure and output scale inhibit them. Beyond micro-level studies, many scholars have focused on macro-level discussions of the carbon emissions of the tourism industry in Chinese provinces. Ma et al. [12] found that industrial scale and energy consumption lead to an increase in carbon emissions from the tourism industry. Factors such as tourism carbon emission intensity, energy consumption intensity, investment efficiency, and energy intensity can suppress tourism carbon emissions, as suggested by Chen et al. [13]. Environmental regulations have also been identified as inhibitors of tourism industry carbon emissions, according to Pan et al. [14], who discovered an ideal coupling trend between tourism carbon emissions, economic development, and regional innovation. The efficiency of measuring tourism carbon emissions as an undesired output was also explored. For example, Liu et al. [15] studied the efficiency of tourism carbon emissions in Chinese provinces using methods such as tourism value added, and identified factors such as environmental regulation intensity, urbanization level, economic development level, tourism industry environment, and tourism infrastructure as driving forces for tourism carbon emissions.
The implementation of tourism policies is crucial for regional development, and the effects of tourism-related policies have been gaining academic attention. Zhao et al. [16] indicated that intangible cultural heritage tourism policies could effectively promote the development of regional green services. Liu et al. [15] treated the pilot policy of national urban all-region tourism demonstration areas as a quasi-natural experiment and demonstrated its effectiveness in promoting high-quality development of the tourism industry through network infrastructure and the aggregation of tourism talents. Yun and Li [17] and Huang et al. [18] used a multi-period difference-in-differences model to assess the effects of ecotourism demonstration area establishment policies, revealing their ability to increase residents’ environmental awareness and reduce per capita regional carbon emissions.
The first and second categories of the literature explored the correlation between the role of ecotourism demonstration areas and tourism industry carbon emissions, whereas the third category investigated the impact of tourism policies. However, a comprehensive exploration of the mechanisms through which ecotourism demonstration areas affect tourism carbon emissions in urban areas nationwide requires further investigation. To contribute to the enrichment of the relevant theories in this academic field and to support the country’s achievement of the “Dual Carbon” goals, this study takes the national policy of constructing ecotourism demonstration areas as a quasi-natural experiment. Using panel data from 276 cities from 2010 to 2019, a multi-period difference-in-differences model was employed to analyze the inhibitory effects of establishing ecotourism demonstration areas on tourism industry carbon emissions, examine the heterogeneity of the inhibitory effects, and explore the mechanisms of these effects.

3. Theoretical Mechanism and Research Hypotheses

The suppression of tourism carbon emissions is a necessary condition for the sustainable development of ecotourism, with ecotourism stakeholders being an unavoidable subject of study. From a systemic perspective, a balance-and-constraint mechanism exists among stakeholders. The policy of establishing ecotourism demonstration areas undoubtedly impacts this equilibrium, leading stakeholders to adjust their strategies to maximize their interests in response to the policy. Analyzing the internal game evolution of the stakeholder system is crucial for understanding the equilibrium state of all parties and the role of policy establishment. Building on this, this study draws inspiration from relevant scholars [19] and explores the impact of demonstration area construction policies on the strategic choices of stakeholders from the perspective of the evolutionary game of ecotourism stakeholders. This theoretical exploration provides the basis for the research hypotheses and subsequent empirical analysis.

3.1. Government–Tourism Enterprise Evolutionary Game Analysis

Local governments, as high-level decision-makers in the system, influence the strategic choices of various stakeholders. When establishing ecotourism demonstration areas, the government should adopt adaptive coordination measures for the relevant stakeholders. High-carbon emission tourism enterprises are the subjects of coordination. The government regulates tourism enterprises [20] to achieve low-carbon operations. This study first analyzes the impact of the establishment policy on the strategic choices of the government and the related high-carbon enterprises.

3.1.1. Model Assumptions

The government and high-carbon tourism enterprises form an evolutionary game system. The government’s strategy toward high-carbon enterprises has two options: regulation and non-regulation. The probability of regulation is denoted as y (0 ≤ y ≤ 1), and the probability of non-regulation is 1 − y. High-carbon enterprises also have two choices: adopting low-carbon operations, with a probability denoted as x (0 ≤ x ≤ 1), or not adopting low-carbon operations, with a probability of 1 − x.
D1 and D2 represent the comprehensive benefits for tourism enterprises engaged in low-carbon and traditional operations, respectively. L is the environmental benefit obtained by the government when enterprises engage in low-carbon operations (increasing over time). The government provides relevant subsidies A to enterprises during low-carbon operations. S represents the short-term benefits to the government when tourism enterprises choose traditional operational modes (decreasing over time). If the government chooses supervision, there are supervision costs K. During the supervision period, if an enterprise continues to emit carbon, it faces government penalties denoted by F1.
Public opinion is one of the driving forces of government supervision. If the government turns a blind eye, it incurs reputational loss P1.
When the local government of the ecotourism demonstration area adopts a coordination strategy toward high-carbon tourism enterprises, it may receive key support from central finance, publicity, and other aspects, denoted as W.

3.1.2. Model Establishment and Solution

Based on the assumptions above, the payoff matrix is obtained, as shown in Table 1.
For strategy selection based on the matrix, the expected payoffs for the enterprises choosing emissions control (Ux1) and not choosing emissions control (Ux2), as well as the average expected payoff (Ux), can be calculated as follows:
Ux1 = y ∗ (D1 + A) + (1 − y) ∗ (D1)
Ux2 = y ∗ (D2 + AF1) + (1 − y) ∗ (D2)
Ux = xUx1 + (1 − x) ∗ Ux2
Similarly, the government’s expected payoffs for choosing ecological regulation (Uy1) and not choosing regulation (Uy2), as well as the average expected payoff (Uy), can be calculated as follows:
Uy1 = x ∗ (LK + WA) + (1 − x) ∗ (SK + W + F1A)
Uy2 = x ∗ (LP1) + (1 − x) ∗ (SP1)
Uy = yUy1 + (1 − y) ∗ Uy2
The replicator dynamics equations for the system can be expressed as:
F ( x ) = d x d t = x ( x 1 ) ( D 1 D 2 + F 1 y )
F ( y ) = d y d t = y y 1 ( A F 1 + K P 1 W + F 1 x )
The local equilibrium points were determined by solving F(x) = 0 and F(y) = 0. The equilibrium points are D1 (0, 0), D2 (0, 1), D3 (1, 0), D4 (1, 1), and D5 ( F 1 A K + P 1 + W F 1 , D 1 D 2 F 1 ).
Only the first four equilibrium points are discussed because D5 is not an asymptotically stable state [21]. The corresponding characteristic values are calculated for these equilibrium points.
For local governments, the establishment of ecological tourism demonstration zones led to a significant increase in the central government’s support (W) for environmental protection. According to data from the Central Committee of the China National Democratic Construction Association, in 2018, nearly CNY 32.4 billion of special funds for energy conservation and emission reduction were allocated by the central government to local governments. With the gradual improvement in ecological and environmental public opinion mechanisms, municipal governments that show negligence in air quality governance after establishing demonstration zones face greater public opinion pressure [22]. In other words, the government incurs a higher reputational loss (P1) when adopting a non-regulatory approach, and because the supervision cost (K) is relatively low due to central subsidies, condition A + K < P1 + W holds. Therefore, after establishing ecological tourism demonstration zones, the government tended to adopt ecological supervision measures for high-carbon tourism enterprises.
From the perspective of tourism enterprises, owing to the steady progress of national economic and social low-carbon transformation, policies supporting green development are gradually being implemented. For instance, according to relevant government documents, such as the “Catalog of Value-Added Tax Preferential Policies for Comprehensive Utilization of Resources Products and Services” (Finance and Taxation [2015] No. 78), enterprises meeting these criteria enjoy certain preferential treatments in terms of value-added tax, corporate income tax, and environmental tax. In this scenario, the comprehensive benefits of relevant tourism enterprises in low-carbon operation mode are far higher than those in the traditional mode. That is, D1 is higher than D2. Simultaneously, with the gradual implementation of environmental policies, the government demands that enterprises comply with the relevant environmental laws and regulations [23]. The government intensifies penalties for businesses violating mandatory regulations, compelling tourism enterprises to adjust their scale and adopt low-carbon strategies to reduce their carbon emissions. The results are summarized in Table 2:
This table shows that (1, 1) is the strategy’s equilibrium point. After policy deployment, owing to increased central subsidies for local emission reduction, the implementation of tax incentives for low-carbon operations by businesses, and the gradual improvement of public opinion supervision mechanisms, the government adopted strategies to regulate high-carbon-emitting tourism enterprises. In response, enterprises in the tourism industry have chosen low-carbon operational modes to suppress carbon emissions.

3.2. Dynamic Evolutionary Game Analysis Between Government and Tourists

Tourists, as central stakeholders in low-carbon tourism, play a crucial role in carbon reduction and the implementation of low-carbon ecological tourism. Local governments can actively guide tourists by intensifying investments in eco-tourism, such as enhancing eco-education and promotion efforts, raising awareness [24] and enhancing the willingness to engage in low-carbon tourism. The following analysis focuses on a dynamic evolutionary game between the government and tourists.

3.2.1. Model Assumptions

The government and tourists developed an evolutionary game system. The government’s strategy for investing in low-carbon tourism had two options, namely investing and not investing, with the probability of investment being y (0 ≤ y ≤ 1) and the opposite being 1 − y. Tourists also had two choices: adopting low-carbon travel or not. The probability of choosing low-carbon travel is x (0 ≤ x ≤ 1), and the opposite is 1 − x.
The government’s investment in low-carbon tourism is denoted as M. When the government invests, tourists gain an additional eco-tourism experience, R1. If tourists do not choose low-carbon travel, their experience is R2. Simultaneously, if tourists violate low-carbon travel requirements, they incur a fine, denoted as R3. When tourists choose low-carbon travel, they incur a cost, C. L represents the long-term environmental benefits that the government receives from investing in eco-tourism (increasing over time), and S is the short-term revenue when not investing (decreasing over time).
Based on the social opinion mechanism, the government incurs reputational loss P1 if it ignores the construction of eco-tourism facilities.
For the local government where the eco-tourism demonstration area is located, actively investing in the construction of eco-tourism facilities can cause the reception of key support from central finances, denoted as W.

3.2.2. Model Establishment and Solution

① Based on the assumptions above, the payoff matrix is derived as shown in Table 3.
Based on the matrix, we calculate the expected payoffs for the strategic choices. Let the expected payoff for tourists choosing to control emissions be Ux1, not controlling emissions be Ux2, and the average expected payoff be Ux:
Ux1 = y ∗ (R1C) + (1 − y) ∗ (−C)
Ux2 = y ∗ (R2R3 + R1) + (1 − y) ∗ (R2)
Ux = xUx1 + (1 − x) ∗ Ux2
Let the expected payoff for the government choosing ecological regulation be Uy1, not controlling for emissions be Uy2, and the average expected payoff be Uy:
Uy1 = x ∗ (LM + W) + (1 − x) ∗ (−M + W + S + R3)
Uy2 = x ∗ (LP1) + (1 − x) ∗ (SP1)
Uy = yUy1 + (1 − y) ∗ Uy2
Based on the system of Equations, the replicator dynamic equations are obtained as follows:
F ( x ) = d x d t = x x 1 ( C + R 2 R 3 y )
F ( y ) = d y d t =   y y 1 ( P 1 M + R 3 + W R 3 x )
The equilibrium points were obtained from these dynamic equations, including E1 (0, 0), E2 (0, 1), E3 (1, 0), E4 (1, 1), and E5 ( P 1 M + R 3 + W R 3 , C + R 2 R 3 ). Only the equilibrium points are discussed, and the corresponding eigenvalues are calculated.
As the ecological opinion mechanism becomes more perfect for the government, the local government of the demonstration area will face a significant reputational loss, P1, if it does not take action on the relevant ecological tourism construction. In this case, the government is pressured to adopt measures to develop low-carbon tourism. The investment M by the local government’s investment in ecological environment construction, ecological tourism promotion, and low-carbon facilities was relatively low because of high support (W) from the central government. Therefore, P1 + W is significantly higher than M. In this scenario, the government tends to increase investments in ecological tourism to actively guide tourists to engage in low-carbon tourism.
The supply of ecological tourism is becoming increasingly abundant in designated cities with the establishment of ecological tourism demonstration areas. Compared to traditional tourism, the ecological tourism model provides additional “green” experiences for tourists [25]. In this scenario, the accuracy obtained from using the traditional methods, R2, was relatively low. Additionally, low-carbon travelers tend to choose lower-cost accommodation and transportation facilities, resulting in lower costs, C. The implementation of ecological tourism demonstration area construction policies prompts the government and the relevant environmental departments to increase the severity of penalties, R3, for tourists engaging in environmentally harmful behavior. It can be inferred that R3 was slightly higher than C + R2. Tourists tend to engage in ecological, low-carbon tourism. The results are summarized in Table 4 below.
From the (1,1) equilibrium point, it can be concluded that, in the context of constructing an ecological tourism demonstration area, the government tends to strengthen investment in low-carbon tourism, and tourists tend to choose low-carbon travel strategies. The central government’s support for low-carbon initiatives in the demonstration area and the increased intensity of ecological environmental supervision are important factors contributing to the government’s increased investment in ecological tourism. Improved ecological conditions, upgrades to ecological tourism facilities, effective low-carbon tourism promotion, and rigorous penalties imposed by government departments are the key drivers for tourists to choose low-carbon travel. The theoretical mechanism of the policy establishing an ecological tourism demonstration area that produces an inhibitory effect on the tourism industry’s carbon emissions is illustrated in Figure 1.

3.3. Research Hypotheses

Based on an evolutionary game analysis of ecotourism stakeholders, it is evident that the policy establishment of an ecotourism demonstration area will prompt the government to regulate the relevant high-carbon enterprises and enhance investments in ecotourism infrastructure. Through low-carbon operations, tourism enterprises contribute to the suppression of carbon emissions in the tourism industry. Simultaneously, government investments in ecotourism guide tourists toward low-carbon travel, achieving energy savings and emission reductions in the tourism sector. The equilibrium adjustment of ecotourism stakeholders’ mechanisms is the main factor in generating the effect of suppressing carbon emissions in the tourism industry, with policy establishment in the demonstration area serving as the root of the guiding mechanism of cointegration. Based on this, the following hypotheses are proposed:
H1. 
Establishing an ecotourism demonstration area policy can reduce carbon emissions from the tourism industry;
H2. 
The deployment of policies in the ecotourism demonstration area first stimulates the government to regulate high-carbon enterprises and strengthen the ecotourism infrastructure. Consequently, tourism enterprises and tourists have adopted low-carbon strategic behaviors to produce the effect of suppressing carbon emissions in the tourism industry.
China’s national ecotourism demonstration areas are densely distributed in the Yangtze River Delta and the Beijing–Tianjin–Hebei region, with a relatively low regional distribution balance. Owing to factors such as the scale of tourism transportation, carbon emissions in the eastern coastal areas were slightly higher than those in the central and western cities. Policy establishment in ecotourism demonstration areas will undoubtedly attract significant attention from municipal governments in the eastern regions. Eastern cities, with advantageous economic systems, have greater potential for investing in ecotourism capital. Therefore, policy establishment may have a more significant impact on carbon emission suppression in the tourism industry in the eastern regional cities.
A discussion on the carbon emission suppression effect on resource-based cities is crucial for the smooth implementation of energy-saving and emission-reduction efforts in the tourism industry. Resource-based cities, which are heavily dependent upon mineral development, face increasing conflicts between socioeconomics and the environment [26]. In the context of social low-carbon transformation, policy establishment influences carbon emission suppression in different types of resource-based cities in various ways. In summary, the following hypothesis is proposed.
H3. 
The carbon emission suppression effect of policy establishment in ecotourism demonstration areas exhibits regional heterogeneity, with a significant impact on eastern cities. Moreover, the suppression effect varied for different types of resource-based cities.

4. Research Design

4.1. Sample Selection and Data Sources

To advance the construction of ecological civilization, the National Tourism Administration, the National Development and Reform Commission, and the National Environmental Protection Agency jointly proposed the initiative to establish “Ecotourism Demonstration Zones” in 2001. They collaboratively formulated recognition standards and assessed honorary titles using relevant procedures. The first demonstration zone was the East Overseas Chinese Town National Ecotourism Demonstration Zone established in Shenzhen, Guangdong Province, in 2007. In 2008, the National Tourism Administration established the “National Ecotourism Demonstration Zone Standards” during the National Ecotourism Development Conference. In 2012, the National Tourism Administration and the Ministry of Environmental Protection jointly issued national policy documents such as the “Regulations on the Management of National Tourism Ecotourism Demonstration Zones” and the “Implementation Rules for the Scoring of Construction and Operation Standards for National Ecotourism Demonstration Zones”. They officially launched national ecotourism demonstration zones. Subsequently, three batches of ecotourism demonstration zones were established in 2013, 2014, and 2015.
Due to the earlier establishment of the East Overseas Chinese Town National Ecotourism Demonstration Zone, it was not included in the experimental group in the analysis. This study selected prefecture-level cities in which three batches of ecotourism demonstration zones were established between 2013 and 2015 as the research areas. To ensure the accuracy and scientific validity of the results, the Tibet Autonomous Region, relevant provincial autonomous prefectures, and cities with missing data were excluded. After selection and processing, the experimental group comprised 69 cities, with the remaining 207 prefecture-level cities serving as an experimental control group for the analysis.
Owing to the sudden outbreak of the pandemic, this study defined the research period as 2010–2019. During this period, panel data from 276 prefecture-level cities were used for analysis. The relevant data were sourced from the “China City Statistical Yearbook”, statistical bulletins of prefecture-level cities, and official government websites. Linear interpolation was applied to fill in the missing values, and 1% two-tailed trimming was conducted on the dependent variable to mitigate the impact of outliers.

4.2. Model Setup and Variable Definitions

Given the establishment of national ecotourism demonstration zones in different batches, this study refers to relevant scholars [27,28] and adopts a multi-period differences-in-differences model for empirical research to explore whether the establishment of national ecotourism demonstration zones inhibits carbon emissions from the tourism industry. The model is expressed as follows:
L T C E i t = φ 0 + φ 1 C i t y i × Y e a r t + φ 2 C o n t r o l s i t + u i + γ t + ε i t
Equation (1) i (=1, 2, 3, …, 276) represents cities, and t (=1, 2, 3, …, 10) denotes years. L T C E i t represents the logarithm of carbon emissions from the tourism industry. C i t y i × Y e a r i represents the double-difference estimator. If the i-th prefecture-level city establishes an ecotourism demonstration zone, the dummy variable C i t y i is set to one. Otherwise, it is set to zero. If the ecotourism demonstration zone policy is implemented starting from the t-th year, the dummy variable Y e a r t is set to one. Otherwise, it is set to zero. The coefficient φ 1 represents the impact of the national ecotourism demonstration zone on carbon emissions in the tourism industry. If significant and positive, this indicates that the establishment of demonstration zones increases carbon emissions from the tourism industry. If it is significantly negative, it suggests that the policy has an inhibitory effect on carbon emissions in the tourism industry. C o n t r o l s i t represents the control variables, and u i and γ t are city fixed effects and year fixed effects, respectively. ε i t is the random disturbance term.

4.2.1. Dependent Variable

In this study, carbon emissions from the tourism industry are chosen as the dependent variable. Given the absence of direct statistical data on tourism industry carbon emissions at the city level, this study follows the methodology proposed by Liu et al. (2021) [29] to estimate tourism industry carbon emissions. The calculation formula is as follows:
T C E = C E × ( T T R / G R P )
In Equation (2), T C E represents the tourism industry’s carbon emissions, while C E , T T R , and G R P denote regional carbon emissions, total tourism revenue, and regional gross domestic product (GDP), respectively.

4.2.2. Key Explanatory Variable

Virtual variables were assigned to three batches of national ecotourism demonstration zones established between 2013 and 2015. The 69 cities with demonstration zones were designated as the experimental group, and the remaining 207 prefecture-level cities served as the control group. The first batch was established in 2013. For the experimental group, the dummy variable C i t y i is set to one, and for the control group, C i t y i is set to zero. Simultaneously, the dummy variable Y e a r t   is set to one for the year of policy promulgation and subsequent years. The same logic applies to the second and third batches of demonstration zones. The interaction term between C i t y i and Y e a r t is considered the key explanatory variable.

4.2.3. Control Variables

Accurate selection of control variables is crucial for scientifically exploring the impact of the demonstration zone establishment policy. Drawing references from relevant studies [29,30,31,32] and based on a comprehensive analysis of the factors influencing carbon emissions in the tourism industry, the chosen control variables are explained as follows. (1) For regional education level (LREL), the educational level of a region is considered a pathway to enhance residents’ ecological awareness. Regional education expenditure, expressed in logarithmic form, is used to represent education level. (2) For economic development level (Lpgdp), the economic level serves as a material guarantee of low-carbon infrastructure and directly influences regional carbon emissions. The logarithm of per capita GDP is used to measure the economic development level. (3) For tourism scale effect (LTSE), the expansion of tourism scale indicates an increase in the frequency of related tourism activities, further exacerbating industrial carbon emissions. The logarithm of total tourism revenue is used to represent the scale effect. (4) For technological effect (TE), technological level is one of the factors influencing the transformation of production methods, thereby intensifying or inhibiting carbon emissions. Energy intensity (energy consumption per 10,000 GDP) is used as an indicator of technological effect. (5) For industrial structure effect (ISE), changes in the industrial structure are key factors that influence carbon emissions. The three-industry proportion indicator expresses the effect of the industrial structure. (6) For expenditure level (LEL), the level of fiscal expenditure is the economic support for facilities such as educational services. Increasing the expenditure levels of relevant enterprises can promote carbon emissions efficiency. The logarithm of public budget expenditure is used for the measurement. (7) For transportation service level (LTSL), high-level tourism transportation services can be a double-edged sword, enhancing the tourist experience and simultaneously expanding the tourist scale, thereby increasing tourism-related carbon emissions. The logarithm of the annual number of taxis is used to represent the transportation service level. Descriptive statistics for the data are presented in Table 5.

5. Empirical Results Analysis

5.1. Baseline Regression Test

First, the variance inflation factor (VIF) test was conducted for the control variables, yielding an average value of 2.67, indicating the absence of multicollinearity (Table 6).
The study employs a multi-period differences-in-differences model to investigate the inhibitory effect of the establishment of ecological tourism demonstration zones on carbon emissions in the tourism industry. The baseline regression results are presented in Table 7. In column (1), which includes city and year fixed effects, the coefficient is significant at −0.078, indicating that the establishment of ecological tourism demonstration zones has a significant inhibitory effect on carbon emissions in the tourism industry. In column (2), with the inclusion of control variables and bidirectional fixed effects, the significance level further increases, and the coefficient remains negative. This suggests that, even after controlling for the relevant factors, cities with the establishment of ecological tourism demonstration zones exhibit a 3% higher inhibitory effect on carbon emissions in the tourism industry compared to control cities. Thus, the results provide preliminary validation for Hypothesis 1.

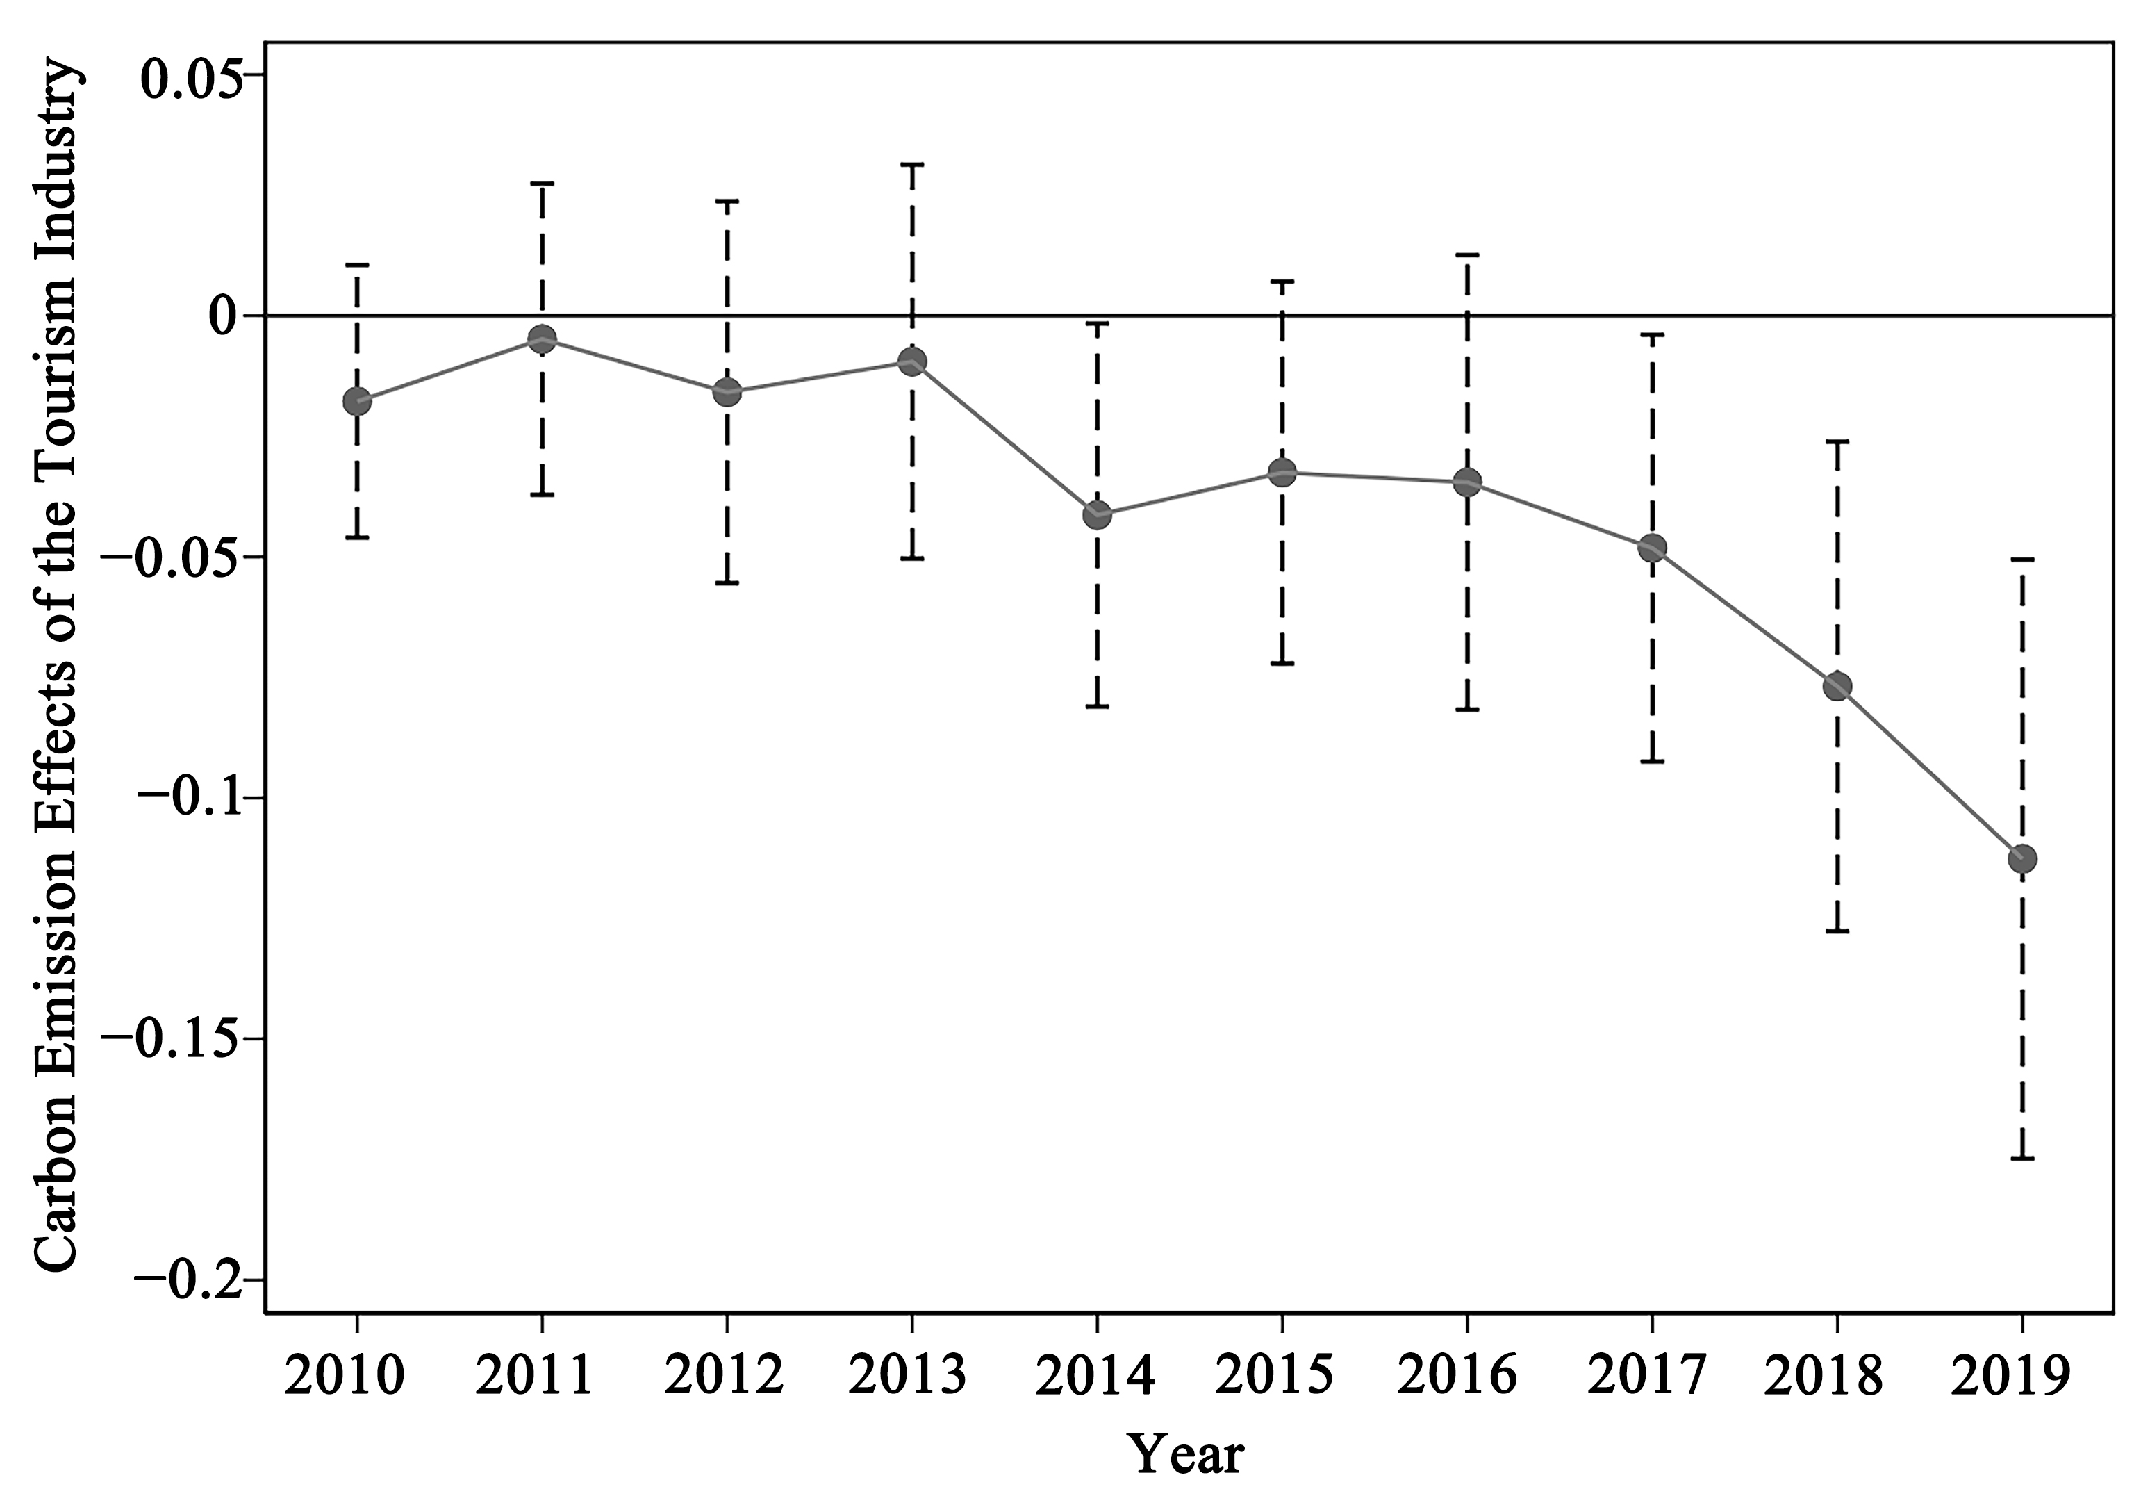
5.2. Parallel Trends Test

To further substantiate whether the effect on carbon emissions in the tourism industry is attributable to the establishment of ecological tourism demonstration zones, a parallel trends test was conducted between the experimental and control groups. The conditions for a successful test are as follows. In the years before the policy deployment, the experimental group cities and control group cities must exhibit consistent and minimal differences in their trend, as indicated by nonsignificant coefficients for the interaction terms during this period. After the establishment of ecological tourism demonstration zones, cities in the experimental group with demonstration areas and cities in the control group without such areas should demonstrate certain developmental differences, with gradually significant coefficients for the interaction terms. Using the establishment year of the first batch of demonstration zones in 2013 as the baseline, if the coefficients for the years 2010–2013 are nonsignificant and become significant in subsequent years, it suggests that the inhibitory effect is a result of the policy implementation (see Figure 2).
From the parallel trends test chart, it is evident that the coefficients for the years 2010 to 2013 are consistently nonsignificant. This indicates that, during this period, there were no significant differences between the experimental group cities and the control group cities. Before the establishment of ecological tourism demonstration zones, both groups were employing alternative methods to suppress carbon emissions in the tourism industry. For a majority of years from 2014 to 2019, the coefficients are significant, suggesting that the implementation of the policy has indeed resulted in the inhibition of carbon emissions in the tourism industry in the experimental group cities. Thus, the parallel trends test is deemed successful.
Examining the degree of change in the curves from the chart, the curves exhibit a downward trend since the construction of ecological tourism demonstration zones. This indicates that the policy’s inhibitory effect on carbon emissions in the urban tourism industry is strengthening each year. This validates the results of evolutionary game simulation analysis, showing that the inhibitory effect in the experimental group’s cities is approximately 12% higher than that in the control group’s cities, and the effect is statistically significant. The lag in the inhibitory effect is attributed to the adjustment of time costs consumed by stakeholders such as the government after policy deployment, explaining the nonsignificant coefficient for the interaction term in 2013 in the chart.

5.3. Robustness Test
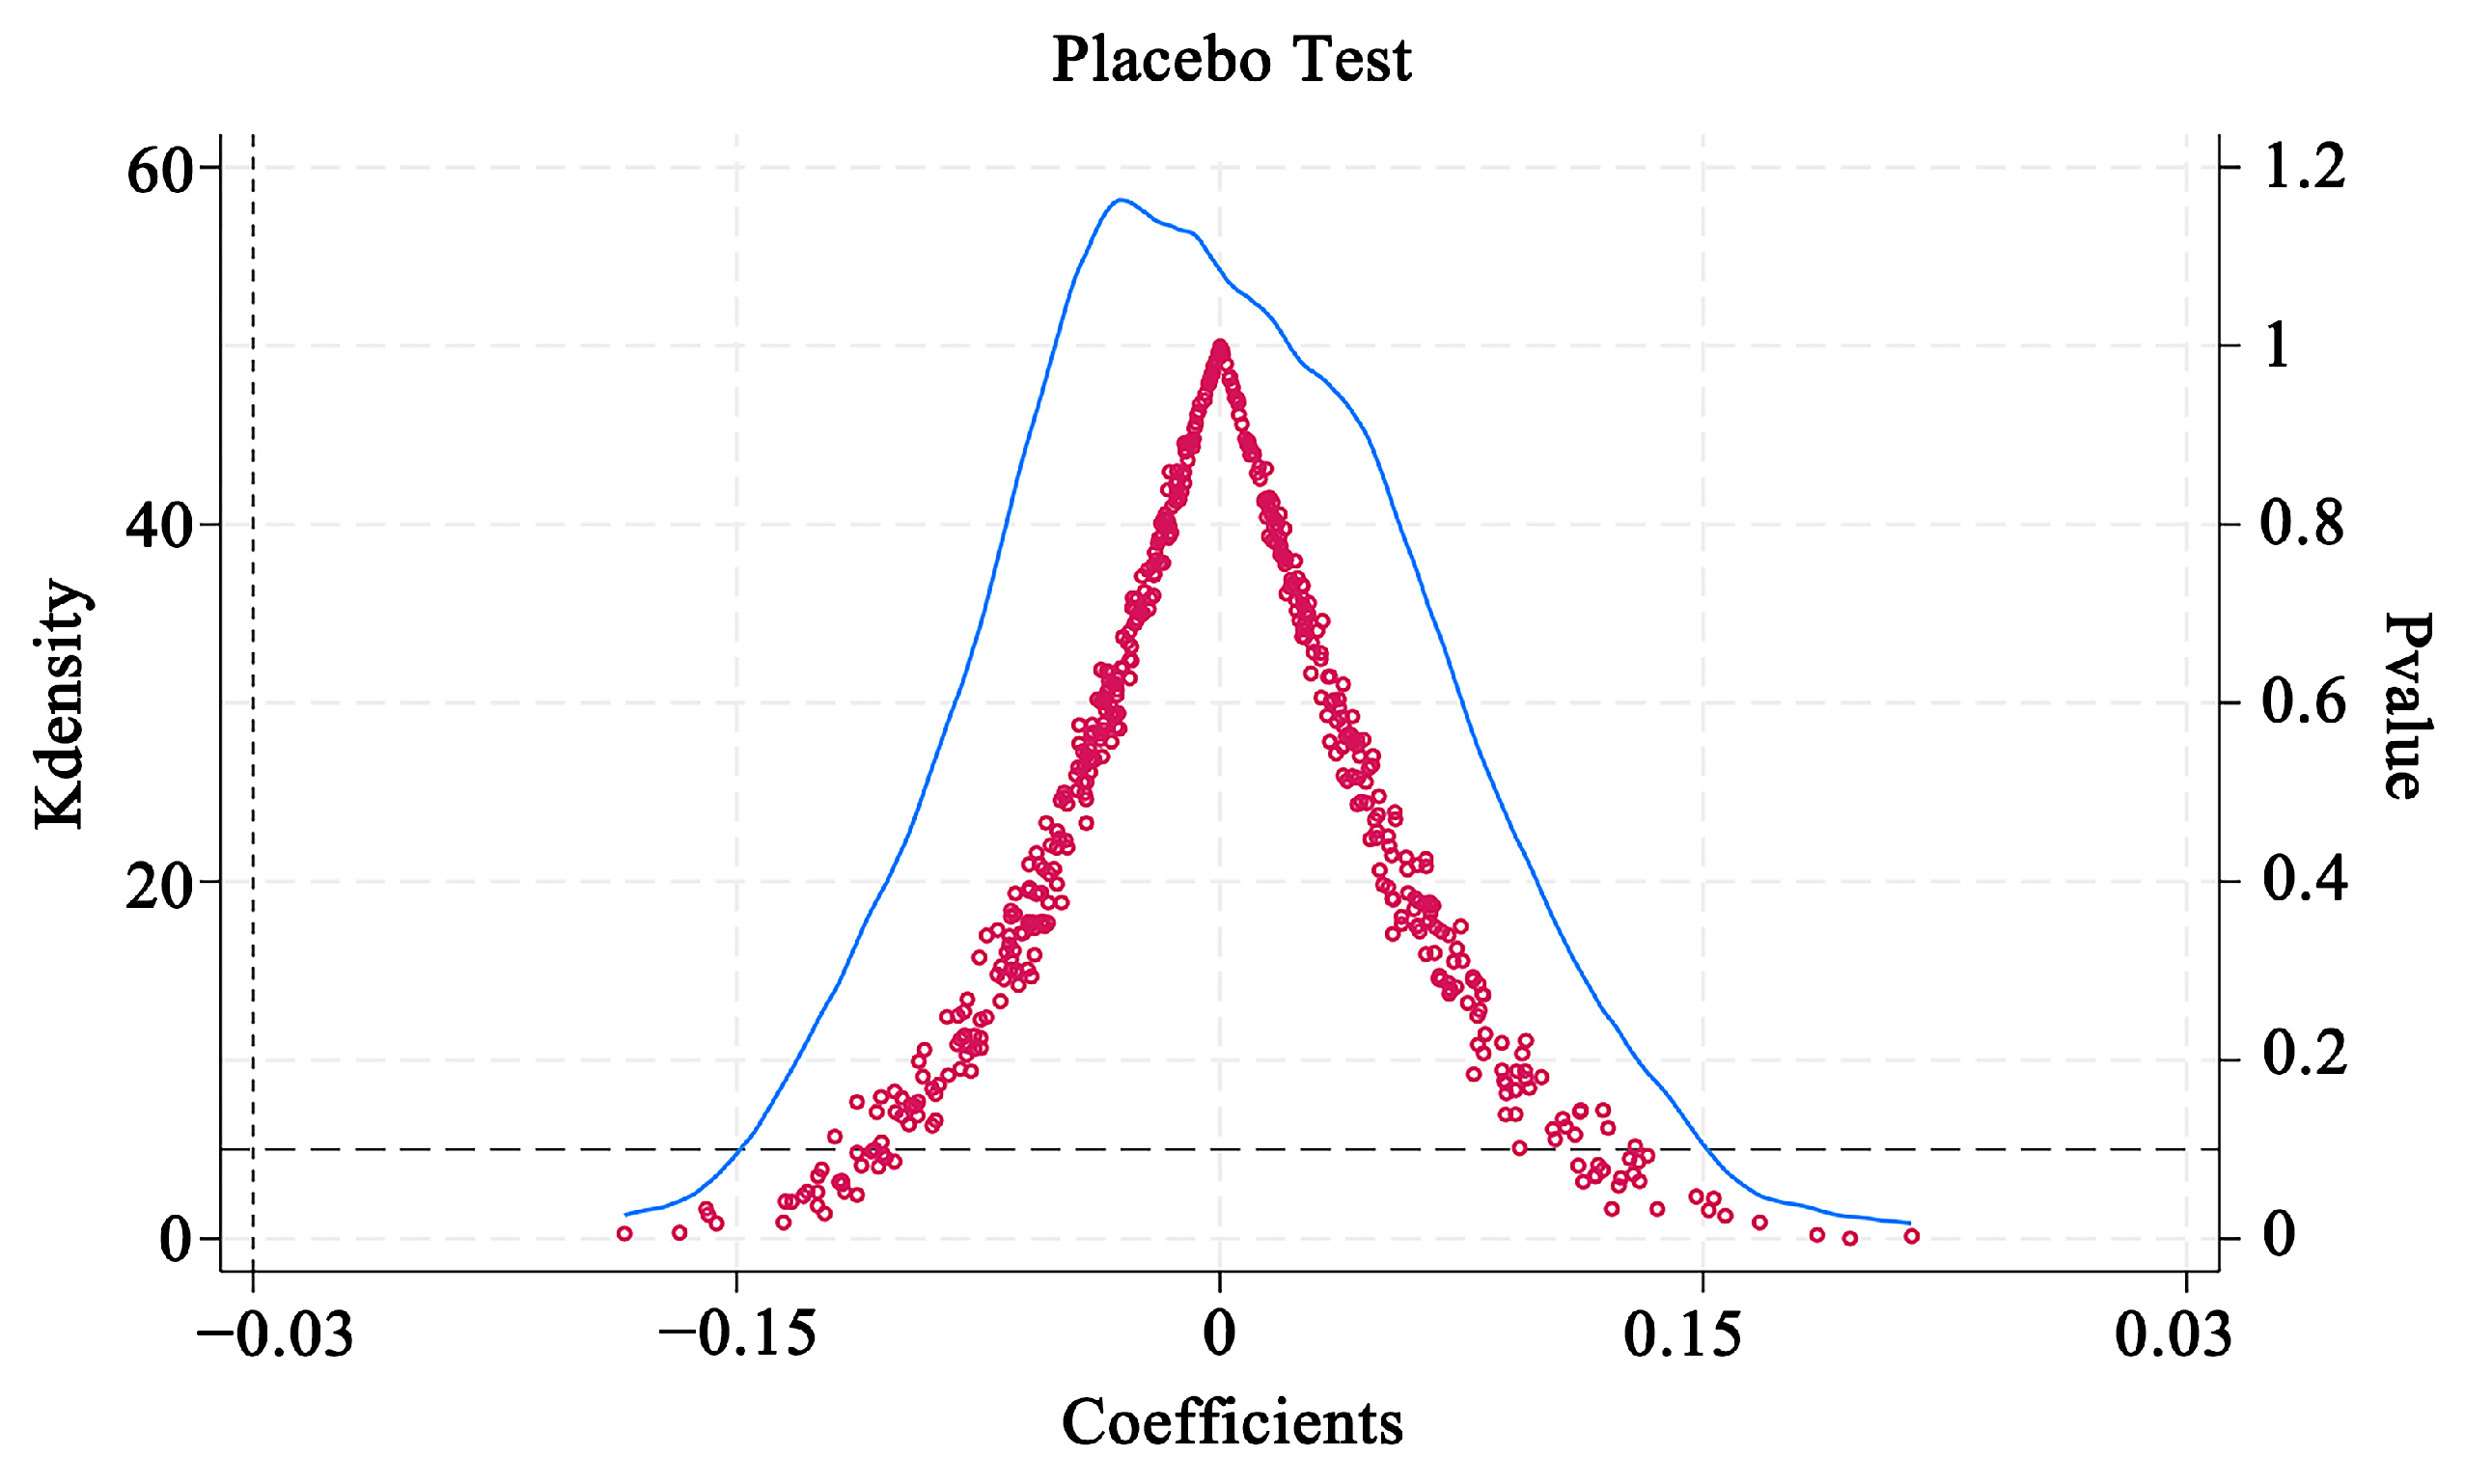
5.3.1. Placebo Test

In order to avoid attributing the effects of carbon emissions in the experimental group cities and control group cities to temporal changes, this study conducts a placebo test by advancing the policy implementation period by two to three years. The regression results are presented in Table 8, where (1) represents the results of advancing the policy by two years, and the coefficient of the interaction term is not significant at the 10% level. Here, (2) represents the results of advancing the establishment of the demonstration area by three years, and the coefficient remains statistically insignificant. It can be inferred that the changing trend over time does not lead to a significant difference in the carbon emission suppression effects of tourism between the experimental and control cities. This further demonstrates that the establishment of the policy plays a role in suppressing carbon emissions in the tourism industry.
To further eliminate the influence of omitted variables and random factors on the results mentioned above, this study employs a non-parametric permutation test method [33,34,35] for the city–time placebo test. This involves conducting 500 non-repetitive random samples on the 276 sample cities from 2010 to 2019. In each iteration, 69 cities are randomly selected as the virtual experimental group, with the remaining 207 cities serving as the virtual control group. A baseline regression is performed for each sample, generating 500 virtual interaction term coefficients. The placebo effect of policy implementation is then tested based on the virtual results. The graph illustrates the kernel density distribution of the virtual regression coefficients.
Based on the kernel density distribution of virtual coefficient estimates (see Figure 3), it is observed that the majority of virtual p-values are higher than 0.1. This indicates that, in randomly selected samples, most baseline regression results are not significant at the 10% level. Additionally, virtual regression coefficients are predominantly distributed around zero, suggesting that the establishment of ecological tourism demonstration areas does not significantly affect the carbon emission reduction in the virtual regression results. The actual regression coefficient of −0.03 is situated in the left tail of the kernel density distribution, significantly deviating from the virtual regression coefficients. This implies that the real regression result is a highly improbable event in random sampling. Therefore, the conclusions drawn in the study remain robust and are not influenced by omitted variables or random factors.

5.3.2. Propensity Score Matching Test

Potential selection bias in the sample could introduce errors into empirical results. To address this concern, a 1:4 nearest-neighbor matching method was employed for robustness testing. The specific steps involved selecting cities with conditions similar to the experimental group as the control group. Baseline regression was then conducted using the matched experimental and control group cities as the sample. This aimed to eliminate interference from the carbon emission effects of the tourism industry, influenced by the city’s own conditions. The regression results are presented in Table 9 below, showing that the coefficient remains significant at −0.036 after matching. This indicates that, within the city samples where conditions are comparable, the establishment of ecological tourism demonstration areas can still effectively suppress carbon emissions from urban tourism.

5.3.3. Excluding Policy Interference

This section focuses on the suppressive effect of carbon emissions in the tourism industry. Carbon emissions from tourism constitute a portion of the total emissions. In the efforts to control greenhouse gases like carbon dioxide, the government initiated two batches of low-carbon pilot cities in 2010. Research by Huo et al. [36] has confirmed the effective reduction of carbon emissions in these low-carbon pilot cities. To discern whether the suppression of tourism industry carbon emissions is attributed to the establishment of ecological tourism demonstration areas or the policies of low-carbon pilot cities, this study conducts a baseline regression that controls for the impact of low-carbon pilot cities on tourism industry carbon emissions. The coefficient, shown to be significantly negative, indicates that, even with the acknowledged carbon reduction achieved through low-carbon pilot city initiatives, the suppression of carbon emissions in the tourism industry is still primarily attributed to the targeted effects of ecological tourism demonstration area establishment. This conclusion reinforces the robustness of the findings (Table 10).

6. Heterogeneity Test and Mechanism Analysis

6.1. Regional Heterogeneity Test

To examine the regional heterogeneity in the impact of ecological tourism demonstration areas on carbon emissions from tourism, the sample cities are categorized into eastern, central, and western regions. The baseline regression results are presented in Table 11. In column (1), representing the eastern cities, the regression coefficient is significant at the 1% level (−0.053), indicating a notable carbon emission suppression effect due to the construction of ecological tourism demonstration areas. However, in columns (2) and (3), representing the central and western cities, the regression coefficients are not significant. This suggests that, in regions with weaker economic foundations, the pursuit of economic benefits from ecological tourism might overshadow environmental considerations, leading to a less-pronounced suppression effect on carbon emissions from the tourism industry.
Figure 4 displays the spatial pattern of tourism carbon emissions in sample cities in 2010 and 2019. Prior to policy implementation, cities with high carbon emissions from tourism were mainly distributed in the eastern coastal areas. By 2019, the phenomenon of high carbon emissions from tourism had shifted from the east to the central and western regions, forming a spatial pattern of “high in the middle and low in the east”. Cities in the east, represented by the Suzhou–Zhuhai–Huzhou city cluster, showed a significant suppression of carbon emissions. The establishment of ecological tourism demonstration areas, such as the Taihu Wetland Park and Suzhou Embroidery Town, has contributed to low-carbon tourism practices, such as cycling along scenic routes and achieving a balance between tourist experience and ecological benefits. In the central cities, substantial tourism traffic intensified carbon emissions, while the western cities, benefiting from a richer ecological foundation, exhibited slightly lower tourism-related carbon emissions. The combination of the regional heterogeneity test and spatial pattern analysis indicates that ecological tourism demonstration areas have the strongest suppression effect in the east, followed by the west, and the weakest in the central region.

6.2. Heterogeneity Test of Resource-Based City Types

The majority of resource-based cities achieve development through methods such as mineral resource extraction, and the high emission characteristics of resource-based industries contradict the ongoing promotion of “dual carbon” initiatives. The implementation of relevant ecological policies has valuable implications for the effectiveness of resource-based cities. Following the guidelines of the “National Sustainable Development Plan for Resource-Based Cities (2013–2020)”, this study categorizes resource-based cities into growth-oriented, mature-oriented, decline-oriented, and regeneration-oriented types, comparing these four types with non-resource-based cities to explore the impact of establishing ecological tourism demonstration zones on their tourism carbon emissions. Table 12 presents the results of the baseline regression for the five city types.
The table indicates that the establishment of ecological tourism demonstration zones effectively restrains tourism carbon emissions in growth-oriented, decline-oriented, and non-resource-based cities. Growth-oriented cities are in the ascending phase of resource development, and their undefined development models make the transition of production methods challenging. External penetration of environmental policies facilitates the effective suppression of tourism carbon emissions in growth-oriented cities. Taking Hulunbuir City as an example, since being designated as an ecological tourism demonstration zone along with the Heyuan Wetland Park, the park has prioritized natural education, fostered public awareness of wetland conservation, and established sustainable relationships between the public and wetland development, resulting in a significant reduction in tourism carbon emissions.
Cities experiencing decline face immense ecological pressures and represent focal areas for accelerating the transformation of economic development patterns. The policy deployment of ecological environments injects confidence into these cities. Government and scenic-area entities actively respond to policy implementation, leading to a reduction in carbon emissions from the tourism industry. For instance, the Danxia Mountain Scenic Area in Shaoguan City, given the emphasis on environmental policies by the government, has implemented measures such as legislation and investments for relic protection and environmental remediation, significantly suppressing the city’s tourism carbon emissions and driving local economic transformation.
Mature-oriented cities, with fixed resource development models, face higher difficulties in the green transformation of production methods. The development characteristic of “a large ship resisting the wind and waves” substantially weakens the inhibitory effects of ecological policies on tourism carbon emissions in these cities.
Regeneration-oriented cities, characterized by a benign optimization of development models, have become a batch of eco-friendly and livable cities. Luoyang City, as a typical regeneration-oriented resource city and a key tourist destination, has proactively implemented a comprehensive set of measures in response to government environmental policy demands to inject green vitality into its development. The establishment of ecological tourism demonstration zones has shown minimal impact on tourism carbon emissions in Luoyang City, indicating that policies have an insignificant effect on these types of cities.
For resource-based cities not relying on mineral development, the effectiveness of ecological tourism demonstration zone policies is significantly apparent at the 10% level, with a notable suppression effect approaching the average level within the national urban scope.

6.3. Mechanism Verification

The preceding sections have confirmed that the establishment of ecological tourism demonstration zones can effectively curb urban tourism carbon emissions, with inhibitory effects exhibiting regional and typological heterogeneity. To delve deeper into the ways in which policy establishment mitigates tourism carbon emissions, understanding the underlying mechanisms is crucial for achieving sustained energy conservation and emission reduction in the tourism industry. This article’s theoretical framework relies on the dynamic evolution game among stakeholders in the ecological tourism sector. It posits that the restraint on tourism carbon emissions is a result of internal adjustments within the stakeholder system. Specifically, the inhibitory effects arise from the low-carbon strategic behaviors of the government, tourism enterprises, and tourists.
To begin with, the government, as the decision-maker within the stakeholder system, is directly influenced by policies. It seeks to balance and adjust secondary stakeholders to ensure that local-level cities fully acquire ecological benefits. This article categorizes government actions primarily as regulating tourism enterprises and strengthening the development of ecological low-carbon tourism.
Next, high-carbon tourism enterprises are one of the main sources of tourism carbon emissions, and their low-carbon operations are essential for achieving green tourism. As a representative tourism enterprise, the scale of star-rated hotels positively influences carbon emissions in the hotel industry. Controlling the scale is an effective measure assisted by the government to facilitate low-carbon operations [37]. In this study, the number of star-rated hotels, a typical high-carbon tourism enterprise, was used as a proxy for the degree of scale control. It was employed as the dependent variable in the baseline regression (see Table 13), as shown in Equation (1). The regression coefficient is significantly negative at the 5% level, indicating that the establishment of ecological tourism demonstration zones led star-rated hotels to reduce their scale and adopt low-carbon operational modes. Consequently, this effectively reduces tourism carbon emissions, thus validating the theoretical perspective of strategic choices in the evolution game of tourism enterprises.
Tourists, who are directly linked to tourism carbon emissions, play a crucial role in determining these emissions through their ecological awareness and choice of travel activities. Tourism-related ecological investments are a potent means of guiding tourists toward low-carbon tourism. In this study, ecological tourism-related investments were divided into two categories: environmental construction and ecological tourism promotion and low-carbon infrastructure construction. Environmental construction is represented by green space areas within a city’s jurisdiction, indicating the government’s efforts to provide a better external environment for tourists. The expansion of a city’s jurisdictional area is an effective means of addressing air quality in urban areas and improving the ecological environment. The second category involves investments in ecological tourism promotion and the construction of low-carbon infrastructure. This directly stimulates low-carbon tourism among tourists. The study uses tourism fixed-asset investment as an indicator, calculating it in the same manner as tourism carbon emissions. The results of the baseline regression using green-space area within the city jurisdiction as the dependent variable are presented in Equation (2). The coefficient is significantly positive at the 5% level, confirming that the establishment of ecological tourism demonstration zones prompts local governments to enhance ecological environment construction, creating a favorable environment for tourists to engage in low-carbon tourism. Equation (3) represents the baseline regression results using tourism fixed-asset investment as the dependent variable. The regression coefficient is significantly positive at the 1% level, indicating that the establishment of ecological tourism demonstration zones encourages the government to increase related investments. This further improves and perfects ecological infrastructure to guide key groups, including tourists, toward engaging in ecological low-carbon tourism activities, thereby restraining carbon emissions in the tourism industry. This also confirms the strategic tendencies and choices between the government and tourists in the evolutionary game.

7. Conclusions, Recommendations, and Discussion

7.1. Conclusions

Energy savings and emission reduction in the tourism industry are crucial for the overall high-quality development of the industry and are closely linked to the successful implementation of the national “dual-carbon” goals. This study, grounded in the microanalysis of the evolutionary game of ecological tourism stakeholders, focuses on the ecological tourism demonstration zones established from 2013 to 2015. Using a multi-period difference-in-differences model based on data from 276 prefecture-level cities across China from 2010 to 2019, this study explores the inhibitory effects of ecological tourism demonstration zone establishment policies on carbon emissions in the tourism industry.
Theoretically, in the dynamic evolutionary game between the government and high-carbon enterprises, and the government and tourists, the establishment of ecological tourism demonstration zones prompts both parties to tend toward strategies related to low-carbon initiatives. The carbon emission inhibition effect is the result of multi-party strategic adjustments. Empirically, the establishment of ecological tourism demonstration zones effectively inhibits carbon emissions in the tourism industry, and the inhibitory effect exhibits a certain time lag, becoming more pronounced over time. The inhibitory effect of carbon emissions from tourism, owing to the establishment of ecological tourism demonstration zones, exhibits regional heterogeneity, with a more significant effect in eastern cities than in central and western cities. Moreover, the inhibitory effect of the policy on different types of cities, such as resource- and non-resource-based cities, also varies, significantly inhibiting carbon emissions in growth-oriented, declining, and non-resource-based cities. Mechanism tests indicate that, after the establishment of ecological tourism demonstration zones, the government achieves carbon emissions control in the tourism industry by increasing ecological tourism-related investments, and high-carbon enterprises adjust to low-carbon operations, creating conditions for the inhibition of carbon emissions in the tourism industry.

7.2. Recommendations

Based on the above conclusions, this study proposes the following policy recommendations to continuously curb tourism-related carbon emissions and facilitate the implementation of the “dual carbon” strategy. (1) Strengthen the construction of ETDZs and optimize carbon emission reduction mechanisms. Policymakers should leverage the policy effects of ETDZs by encouraging more regions to establish such zones while improving corresponding management and incentive mechanisms. Given the time-lagged effect of carbon reduction, long-term and sustainable planning should be implemented to ensure continuity and stability in ETDZ development. Within these zones, low-carbon tourism models should be promoted, such as green transportation, low-carbon accommodations, and carbon compensation mechanisms, to further consolidate the emission reduction effect. (2) Implement region-specific and city-type-differentiated policies. Policy optimization should account for differences between eastern, central, and western cities. While eastern regions may continue leveraging existing advantages, central and western regions should prioritize the development of a low-carbon tourism infrastructure to enhance policy effectiveness. For resource-based cities, particularly growing and declining resource-dependent cities, targeted industrial transition policies should be introduced to guide high-carbon industries toward green and low-carbon development. Meanwhile, non-resource-based cities should be supported in innovating low-carbon tourism products and establishing green tourism brands to enhance sustainable tourism competitiveness. (3) Enhance government guidance and promote corporate low-carbon transformation. Governments should increase investment in ecological tourism infrastructure and technological innovation while encouraging enterprises to adopt low-carbon technologies to improve energy efficiency. Establishing carbon emission monitoring and incentive mechanisms can promote self-regulation among high-carbon enterprises and enforce green production and operational standards. Furthermore, policies should encourage tourism enterprises and visitors to participate in carbon compensation initiatives, such as carbon trading and carbon neutrality programs, to achieve sustainable tourism development.

7.3. Discussion

This study focuses on the national urban-level policy of establishing ETDZs, addressing the previous research gap that primarily concentrated on provincial or county-level analyses. By identifying cities as the primary source areas of tourism-related carbon emissions, the study deepens the understanding of the relationship between rapid urbanization and carbon emissions. It examines the suppressive effects of ETDZ establishment on tourism-related carbon emissions, particularly emphasizing its time-lagged effect and regional disparities, thereby supplementing prior studies that lacked dynamic evaluations of policy effectiveness. Moreover, by conducting mechanism testing, this study unveils the pathways through which policy interventions influence tourism-related carbon emissions, offering a new perspective on government regulatory roles in sustainable tourism development.

7.4. Limitations and Future Research Directions

Despite its contributions, this study has several limitations. The theoretical analysis, which applies the evolutionary game theory of ecological tourism stakeholders, includes a relatively small number of stakeholders. Future research could expand the scope to incorporate more stakeholder types, such as local community residents, for a more comprehensive assessment of the impact of ETDZ establishment on low-carbon strategic preferences. Additionally, while this study provides theoretical insights, a deeper exploration of the mechanisms involved is necessary.
From an empirical perspective, the number of control variables should be expanded to enhance the scientific rigor and comprehensiveness of the study. The measurement of urban tourism-related carbon emissions is constrained by data availability, which may limit the completeness of the analysis. Future research should focus on improving the accuracy of carbon emission measurements by incorporating advanced techniques such as remote-sensing data and big data analytics.
Future studies could deepen and expand research in the following areas. First, in a theoretical analysis, the inclusion of a broader range of ecological tourism stakeholders would provide a more detailed understanding of the strategic decision-making processes. Additionally, methods such as dynamic evolutionary games and complex system modeling could be employed to further explore the interactions between different stakeholders, enhancing the depth and applicability of the theoretical research. Second, in empirical research, increasing the number of control variables would improve the robustness of the findings. Furthermore, in carbon emission measurement, leveraging remote sensing and big data analytics could help develop a more refined and accurate measurement system, thereby providing more precise empirical support for policy formulation.
Overall, future research should focus on expanding the theoretical frameworks, optimizing empirical methodologies, and improving data measurement accuracy to further enrich the understanding of the impact of ETDZs on tourism-related carbon emissions. These efforts will provide stronger scientific evidence to support sustainable and low-carbon development in the tourism industry.

Author Contributions

All authors contributed to the study conception and design. Conceptualization, S.Q. and F.W.; Methods and software, S.Q.; Validation, S.Q. and F.W.; Analysis, S.Q. and F.W.; Data Management, S.Q.; Writing—Initial Draft Preparation, S.Q. and F.W.; Visualization, F.W.; Project Management, F.W. All authors have read and agreed to the published version of the manuscript.

Funding

This study was supported by the General Project of the National Social Science Fund of China, “The Historical Evolution and People-to-People Connectivity of Border Trade between China and Vietnam since the Founding of the People’s Republic of China” (Project number: 20BMZ112), hosted by Associate Professor Wang Feng.

Data Availability Statement

No new data were created or analyzed in this study. Data sharing is not applicable to this article.

Conflicts of Interest

The authors declare no conflicts of interest.

References

  1. Zhao, Y.; Wang, P. The Digital Economy, R&D Investments, and CO2 Emissions: Unraveling Reduction Potentials in China. Reg. Sci. Environ. Econ. 2025, 2, 4. [Google Scholar] [CrossRef]
  2. Das, R.C.; Ivaldi, E. Is pollution a cost to health? Theoretical and empirical inquiry for the world’s leading polluting economies. Int. J. Environ. Res. Public Health 2021, 18, 6624. [Google Scholar] [CrossRef] [PubMed]
  3. Das, R.C.; Chatterjee, T.; Ivaldi, E. Sustainability of urbanization, non-agricultural output and air pollution in the world’s top 20 polluting countries. Data 2021, 6, 65. [Google Scholar] [CrossRef]
  4. Bluwstein, J. Creating ecotourism territories: Environmentalities in Tanzania’s community-based conservation. Geoforum 2017, 83, 101–113. [Google Scholar]
  5. Lee, J.H.; Choi, H.O. Stakeholders’ views on reducing financial support in government-led ecotourism areas. Ocean. Coast. Manag. 2017, 144, 7–15. [Google Scholar]
  6. Buckley, R.; Mossaz, A. Private conservation funding from wildlife tourism enterprises in sub-Saharan Africa: Conservation marketing beliefs and practices. Biol. Conserv. 2018, 218, 57–63. [Google Scholar]
  7. Bateman, P.W.; Fleming, P.A. Are negative effects of tourist activities on wildlife over-reported? A review of assessment methods and empirical results. Biol. Conserv. 2017, 211, 10–19. [Google Scholar] [CrossRef]
  8. Li, C.; Liu, H. On the coordinated development of ecotourism and regional economy: A case study of Poyang Lake Ecotourism Demonstration Zone in Jiangxi Province. Qius Shi. 2012, 2012, 62–65. [Google Scholar]
  9. Guo, T.; Wu, W.; Hu, F. A study on the spatial spillover effects of the impact of ecotourism on economic growth: Based on data from 60 key tourist cities in China. Ecol. Econ. 2023, 1, 1–18. [Google Scholar]
  10. Higham, J.; Cohen, S.A.; Cavaliere, C.T.; Reis, A.; Finkler, W. Climate change, tourist air travel and radical emissions reduction. J. Clean. Prod. 2016, 111, 336–347. [Google Scholar] [CrossRef]
  11. Tang, C.; Zhong, L.; Ng, P. Factors that influence the tourism industry’s carbon emissions: A tourism area life cycle model perspective. Energy Policy 2017, 109, 704–718. [Google Scholar]
  12. Ma, X.; Han, M.; Luo, J.; Song, Y.; Chen, R.; Sun, X. The empirical decomposition and peak path of China’s tourism carbon emissions. Environ. Sci. Pollut. Res. 2021, 28, 66448–66463. [Google Scholar]
  13. Chen, Q.; Mao, Y.; Morrison, A.M. Impacts of environmental regulations on tourism carbon emissions. Int. J. Environ. Res. Public Health 2021, 18, 12850. [Google Scholar] [CrossRef] [PubMed]
  14. Pan, Y.; Weng, G.; Li, C.; Li, J. Coupling coordination and influencing factors among tourism carbon emission, tourism economy and tourism innovation. Int. J. Environ. Res. Public Health 2021, 18, 1601. [Google Scholar] [PubMed]
  15. Liu, J.; Wang, Z.; Li, C. All-for-One Tourism Demonstration Zones and high-quality development of tourism: Evidence from the quasi-natural experiment in China. Sustainability 2023, 15, 11626. [Google Scholar] [CrossRef]
  16. Zhao, H.; Zhao, X.; Elahi, E.; Wang, F. Policy evaluation of drama-related intangible cultural heritage tourism for boosting green industry: An empirical analysis based on quasi-natural experiment. Sustainability 2022, 14, 5380. [Google Scholar] [CrossRef]
  17. Tong, Y.; Pang, L. Can ecotourism development promote residents’ environmental concern? A quasi-natural experiment from China. Curr. Issues Tour. 2023, 27, 864–872. [Google Scholar]
  18. Huang, X.; Song, J.; Yang, L.; Zhong, L.; Yan, K. Ecotourism certification and regional low-carbon sustainable development: A quasi-experimental study based on the prototype-zone of national ecotourism attractions in China. J. Clean. Prod. 2023, 423, 138731. [Google Scholar]
  19. Sun, Y.; Liu, B.; Fan, J.; Qiao, Q. The multi-player evolutionary game analysis for the protective development of ecotourism. Environ. Sci. Policy 2021, 126, 111–121. [Google Scholar]
  20. Zheng, S.; Kahn, M.E.; Sun, W.; Luo, D. Incentives for China’s urban mayors to mitigate pollution externalities: The role of the central government and public environmentalism. Reg. Sci. Urban Econ. 2014, 47, 61–71. [Google Scholar]
  21. He, P.; He, Y.; Xu, F. Evolutionary analysis of sustainable tourism. Ann. Tour. Res. 2018, 69, 76–89. [Google Scholar]
  22. Zhang, S.; Li, Y.; Hao, Y.; Zhang, Y. Does public opinion affect air quality? Evidence based on the monthly data of 109 prefecture-level cities in China. Energy Policy 2018, 116, 299–311. [Google Scholar]
  23. Aragòn-Correa, J.A.; Marcus, A.A.; Vogel, D. The effects of mandatory and voluntary regulatory pressures on firms’ environmental strategies: A review and recommendations for future research. Acad. Manag. Ann. 2020, 14, 339–365. [Google Scholar] [CrossRef]
  24. Kopnina, H. Neoliberalism, pluralism and environmental education: The call for radical re-orientation. Environ. Dev. 2015, 15, 120–130. [Google Scholar]
  25. Li, T.T.; Liu, F.; Soutar, G.N. Experiences, post-trip destination image, satisfaction and loyalty: A study in an ecotourism context. J. Mark. Manag. 2021, 19, 100547. [Google Scholar]
  26. Li, W.; Yi, P.; Zhang, D.; Zhou, Y. Assessment of coordinated development between social economy and ecological environment: Case study of resource-based cities in Northeastern China. Sustain. Cities Soc. 2020, 59, 102208. [Google Scholar]
  27. Beck, T.; Levine, R.; Levkov, A. Big bad banks? The winners and losers from bank deregulation in the United States. J. Financ. 2010, 65, 1637–1667. [Google Scholar]
  28. Wang, J. The economic impact of special economic zones: Evidence from Chinese municipalities. J. Dev. Econ. 2013, 101, 133–147. [Google Scholar]
  29. Liu, Z.; Lu, C.; Mao, J.; Sun, D.; Li, H.; Lu, C. Spatial–temporal heterogeneity and the related influencing factors of tourism efficiency in China. Sustainability 2021, 13, 5825. [Google Scholar] [CrossRef]
  30. Lu, C.; Liu TM, Z. Spatial-temporal evolution and its influencing factors of tourism eco-efficiency in China. J. Geogr. Res. 2022, 5, 1067835. [Google Scholar]
  31. Li, S.; Ren, T.; Jia, B.; Zhong, Y. The spatial pattern and spillover effect of the eco-efficiency of regional tourism from the perspective of green development: An empirical study in China. Forests 2022, 13, 1324. [Google Scholar] [CrossRef]
  32. Fan, F.; Song, T.; Zhai, X. Education, science and technology, and talent integrated development: Evidence from China. Reg. Sci. Environ. Econ. 2024, 1, 60–77. [Google Scholar] [CrossRef]
  33. Chetty, R.; Looney, A.; Kroft, K. Salience and taxation: Theory and evidence. Am. Econ. Rev. 2009, 99, 1145–1177. [Google Scholar]
  34. Ferrara, E.L.; Chong, A.; Duryea, S. Soap operas and fertility: Evidence from Brazil. Am. Econ.J. Appl. Econ. 2012, 4, 1–31. [Google Scholar]
  35. Xu, E.; Xiao, Z.; Wang, Z. Has the pilot project of innovative cities increased economic growth? An empirical study based on Chinese cities. Reg. Sci. Environ. Econ. 2024, 1, 31–45. [Google Scholar] [CrossRef]
  36. Huo, W.; Qi, J.; Yang, T.; Liu, J.; Liu, M.; Zhou, Z. Effects of China’s pilot low-carbon city policy on carbon emission reduction: A quasi-natural experiment based on satellite data. Technol. Forecast. Soc. Change 2022, 175, 121422. [Google Scholar] [CrossRef]
  37. Witte, J.C.; Schoeberl, M.R.; Douglass, A.R.; Gleason, J.F.; Krotkov, N.A.; Gille, J.C.; Pickering, K.E.; Livesey, N. Satellite observations of changes in air quality during the 2008 Beijing Olympics and Paralympics. Geophys. Res. Lett. 2009, 36, 17. [Google Scholar]
Figure 1. Theoretical mechanism diagram.
Rsee 02 00009 g001
Figure 2. Parallel trend test.
Rsee 02 00009 g002
Figure 3. City–time placebo test.
Rsee 02 00009 g003
Figure 4. Carbon emissions from China’s urban tourism industry in 2010 and 2019.
Rsee 02 00009 g004
Table 1. Revenue matrix of local government and tourism enterprises.
Strategic ChoiceTourism Enterprises
Control xNot Control 1 − x
GovernmentSupervision
y
LKA + W, D1 + ASKA + W + F1, D2 + AF1
No supervision 1 − yLP1, D1SP1, D2
Table 2. Stability analysis of the equilibrium point.
Equilibrium PointEigenvalueSymbolStability
(0, 0)σ1 = D1D2
σ2 = F1AK + P1+W
σ1 > 0
σ2 > 0
Not stable
(1, 0)σ1 = D2D1
σ2 = P1KA + W
σ1 < 0
σ2 > 0
Not stable
(0, 1)σ1 = D1D2 + F1
σ2 = AF1 + KP1W
σ1 > 0
σ2 < 0
Not stable
(1, 1)σ1 = D2D1F1
σ2 = A + KP1W
σ1 < 0
σ2 < 0
Stable
Table 3. Revenue matrix of local government and tourists.
Strategic ChoiceTourists
Choosing xNot Choosing 1 − x
GovernmentInvesting
y
LM + W, R1CS + W + R3M, R1 + R2R3
Not investing 1 − yLP1, −CSP1, R3
Table 4. Stability analysis of the equilibrium point.
Equilibrium PointEigenvalueSymbolStability
(0, 0)σ1 = −CR2
σ2 = P1M + R3 + W
σ1 < 0
σ2 > 0
Not stable
(1, 0)σ1 = C + R2
σ2 = P1M + W
σ1 > 0
σ2 > 0
Not stable
(0, 1)σ1 = R3R2C
σ2 = MP1R3W
σ1 > 0
σ2 < 0
Not stable
(1, 1)σ1 = C + R2R3
σ2 = MP1W
σ1 < 0
σ2 < 0
Stable
Table 5. Summary statistics.
CategoryTitleObs.MeanStd. Dev.MinMax
Dependent VariableLTCE27606.0180.9823.4449.215
Core Explanatory VariableCity × Year27600.1550.36201
Control VariableLREL2760121.0648.42416.246
Lpgdp276010.6630.5908.57612.579
LTSE27605.3311.1720.8118.736
TE27600.2287.0940.003372.742
ISE276040.5489.9999.7683.52
LEL276014.8120.76811.71118.241
LTSL27607.4171.072−0.35411.178
Table 6. Collinearity test of control variables.
Control VariableVIF1/VIF
LREL4.250.235
Lpgdp1.850.542
LTSE3.620.277
TE1.000.999
ISE1.750.572
LEL4.290.233
LPSL1.960.509
Mean VIF2.67
Table 7. Benchmark regression results.
Variable(1)(2)
LTCELTCE
City × Year−0.078 *
(0.046)
−0.03 **
(0.014)
LREL −0.025 **
(0.01)
Lpgdp −0.657 ***
(0.057)
LTSE 0.941 ***
(0.016)
TE 0.008 ***
(0)
ISE 0.006 ***
(0.001)
LEL −0.088 **
(0.039)
LTSL −0.009
(0.01)
Constant5.368 ***
(0.019)
9.369 ***
(0.518)
City Fixed EffectControlControl
Year Fixed EffectControlControl
N27602760
R20.7560.953
Notes: Robust standard errors clustered at the city level are in parentheses; *, **, and *** indicate significance at the 10%, 5%, and 1% level, respectively.
Table 8. Time placebo test.
Variable(1)(2)
LTCE (Two Years in Advance)LTCE (Three Years in Advance)
City × Year−0.019
(0.015)
−0.024
(0.019)
Constant9.37 ***
(0.521)
9.383 ***
(0.519)
Control VariableControlControl
City Fixed EffectControlControl
Year Fixed EffectControlControl
N27602760
R20.9530.953
Notes: Robust standard errors clustered at the city level are in parentheses; *** indicate significance at the 1% level.
Table 9. Propensity score matching test.
VariableLTCE
City × Year−0.036 *
(0.02)
Constant8.295 ***
(0.65)
Control VariableControl
City Fixed EffectControl
Year Fixed EffectControl
N1317
R20.937
Note: Robust standard errors clustered at the city level are in parentheses; * and *** indicate significance at the 10% and 1% level, respectively.
Table 10. Test for excluding policy interference.
VariableLTCE
City × Year−0.029 **
(0.014)
Low-Carbon Pilot Cities−0.003
(0.01)
Constant9.371 ***
(0.518)
Control VariableControl
City Fixed EffectControl
Year Fixed EffectControl
N2760
R20.953
Note: Robust standard errors clustered at the city level are in parentheses; ** and *** indicate significance at the 5% and 1% level, respectively.
Table 11. Regional heterogeneity test.
Variable(1)(2)(3)
LTCE (Eastern)LTCE (Central)LTCE (Western)
City × Year−0.053 ***
(0.018)
0.01
(0.02)
−0.035
(0.027)
Constant8.719 ***
(1.129)
10.337 ***
(0.975)
8.072 ***
(0.758)
Control VariableControlControlControl
City Fixed EffectControlControlControl
Year Fixed EffectControlControlControl
N1000950810
R20.9610.9620.948
Note: Robust standard errors clustered at the city level are in parentheses; *** indicate significance at the 1% level.
Table 12. Heterogeneity test of resource-based city types.
Variable(1)(2)(3)(4)(5)
LTCE
Growth
Oriented
LTCE
Mature
Oriented
LTCE
Decline
Oriented
LTCE
Regeneration
Oriented
LTCE
Non-Resource
Based
City × Year−0.105 ***
(0.032)
0.007
(0.0334)
−0.147 *
(0.084)
0.007
(0.065)
−0.03 *
(0.016)
Constant1.757
(4.356)
10.36 ***
(0.613)
11.619 ***
(1.636)
12.191 ***
(1.772)
8.211 ***
(0.845)
Control VariableControlControlControlControlControl
City Fixed EffectControlControlControlControlControl
Year Fixed EffectControlControlControlControlControl
N1206002001401700
R20.9550.9640.9480.9610.953
Note: Robust standard errors clustered at the city level are in parentheses; * and *** indicate significance at the 10% and 1% level, respectively.
Table 13. Mechanism test results.
Variable(1)(2)(3)
Hotel ScaleEnvironmental RegulationLow-Carbon Tourism Investment
City × Year−5.618 **
(2.181)
0.12 **
(0.052)
124.106 ***
(46.33)
Constant74.556 *
(43.016)
1.483
(1.857)
−7899.024 ***
(1081.812)
Control VariableControlControlControl
City Fixed EffectControlControlControl
Year Fixed EffectControlControlControl
N276027602760
R20.2610.1860.999
Note: Robust standard errors clustered at the city level are in parentheses; *, **, and *** indicate significance at the 10%, 5%, and 1% level, respectively.
Disclaimer/Publisher’s Note: The statements, opinions and data contained in all publications are solely those of the individual author(s) and contributor(s) and not of MDPI and/or the editor(s). MDPI and/or the editor(s) disclaim responsibility for any injury to people or property resulting from any ideas, methods, instructions or products referred to in the content.

