Evolution and Drivers of Embodied Energy in Intermediate and Final Fishery Trade Between China and Maritime Silk Road Countries

Abstract
1. Introduction
2. Material and Methods
2.1. Study Area
2.2. Method
2.2.1. Multi-Regional Input–Output Model
2.2.2. LMDI Decomposition Method
2.3. Data Sources
3. Results
3.1. Embodied Energy in China’s Foreign Fishery Trade
3.2. Regional and Sectoral Characteristics of China’s Embodied Energy Trade
3.3. Drivers of Embodied Energy in China’s Foreign Fishery Trade
4. Discussion
4.1. Energy Savings in the Fishery Trade
4.2. Embodied Energy Trade Imbalances Behind the Fishery Trade
4.3. Comparisons with Previous Studies
4.4. Limitations
5. Conclusions and Policy Implications
5.1. Conclusions
- (1)
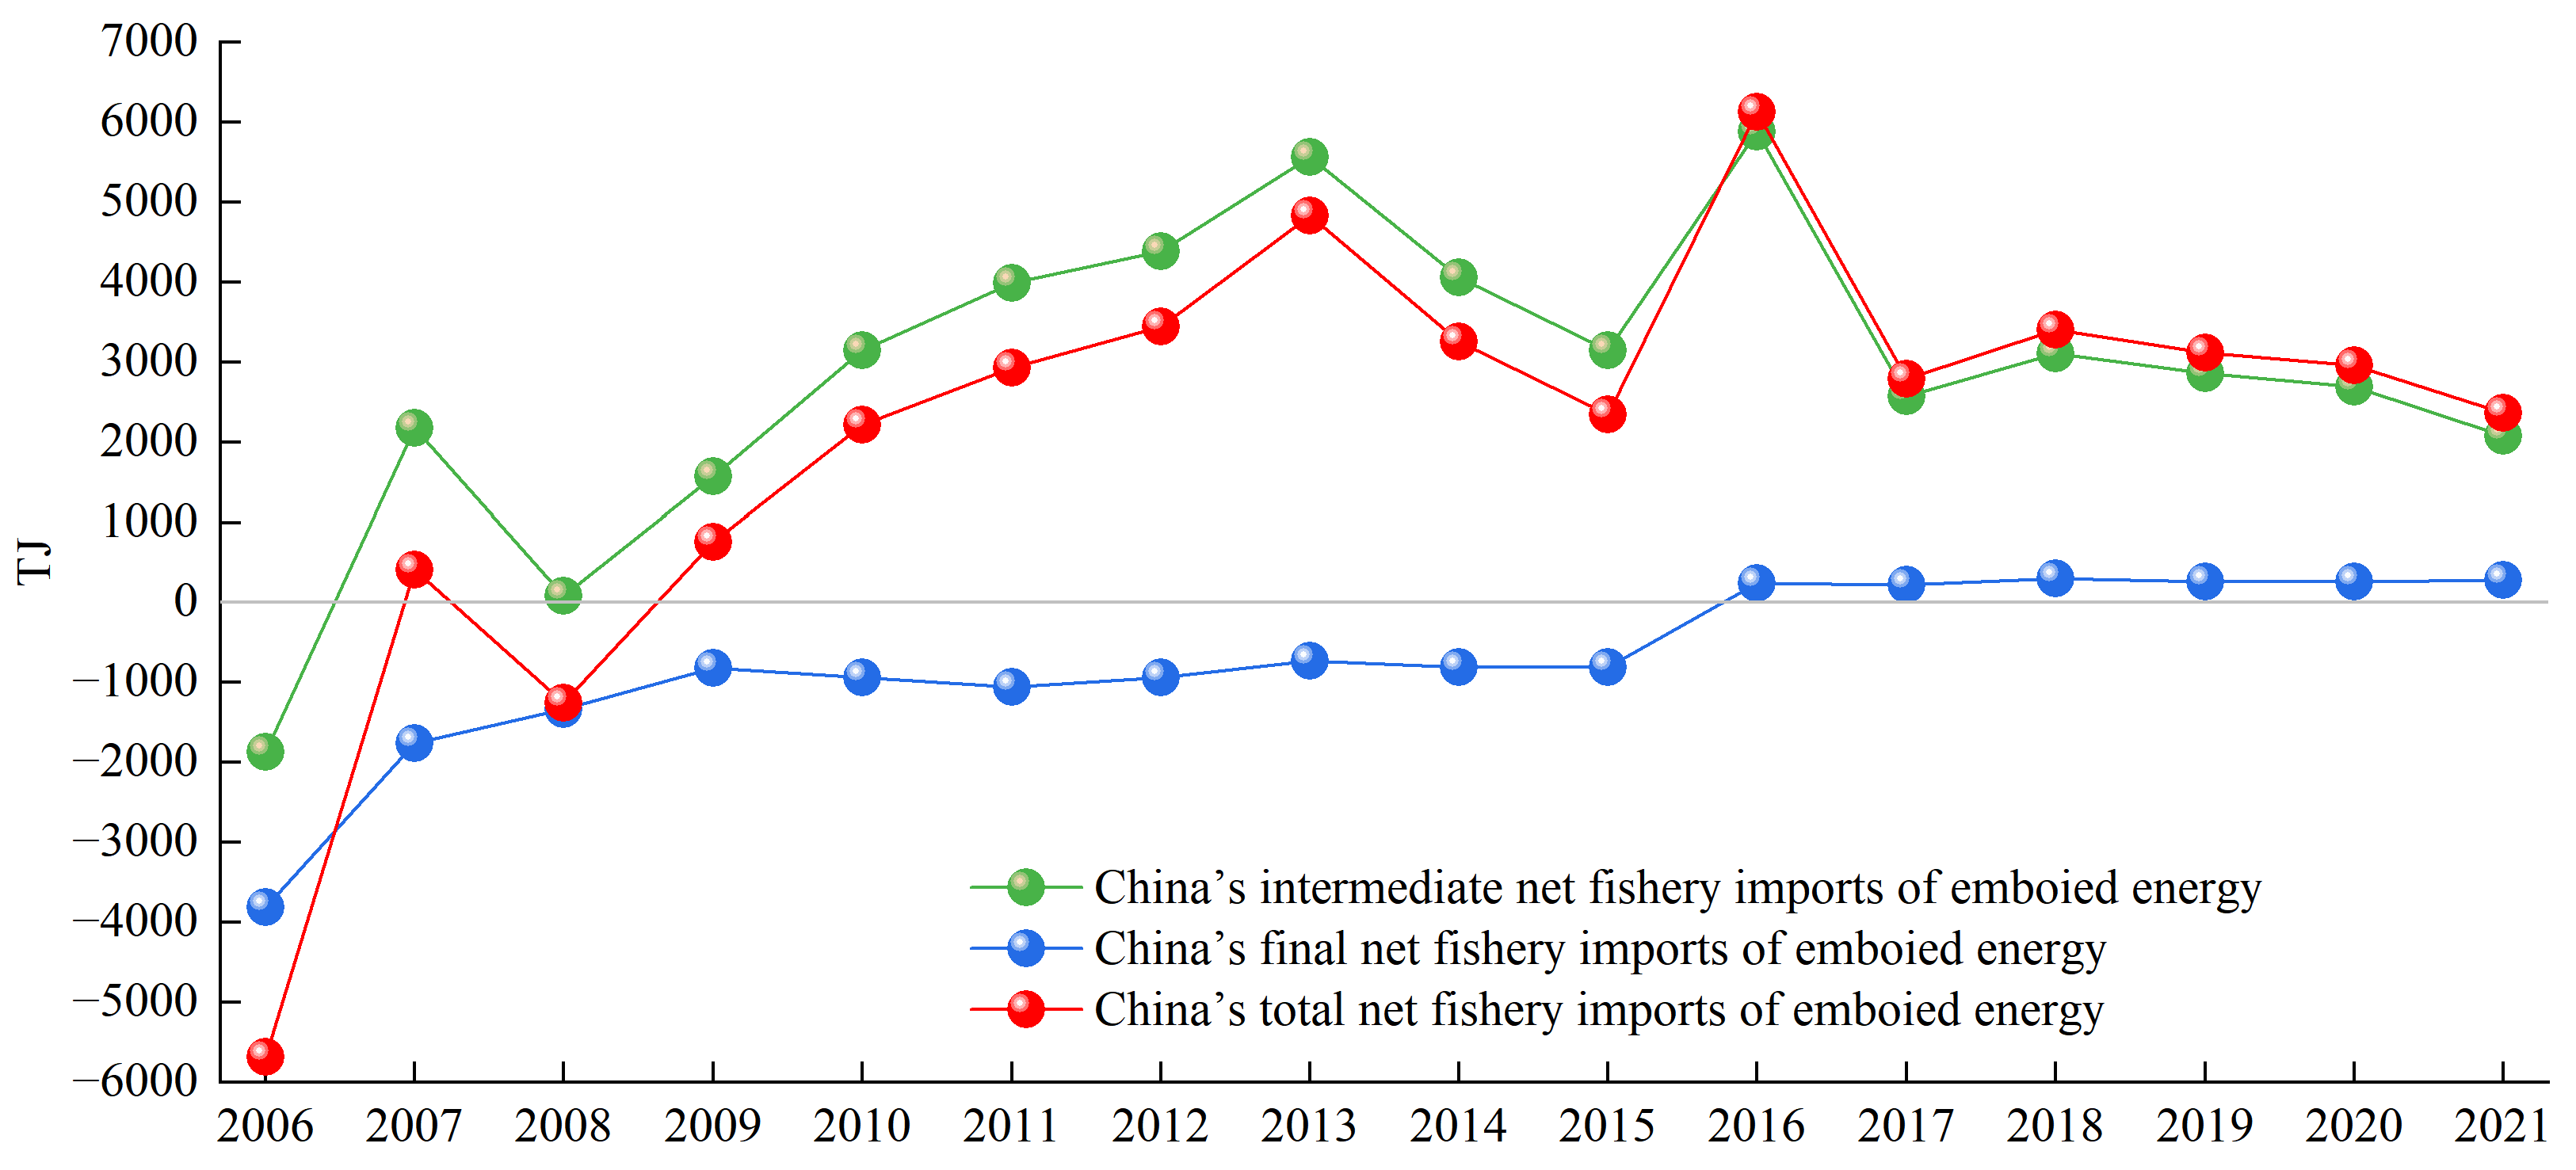
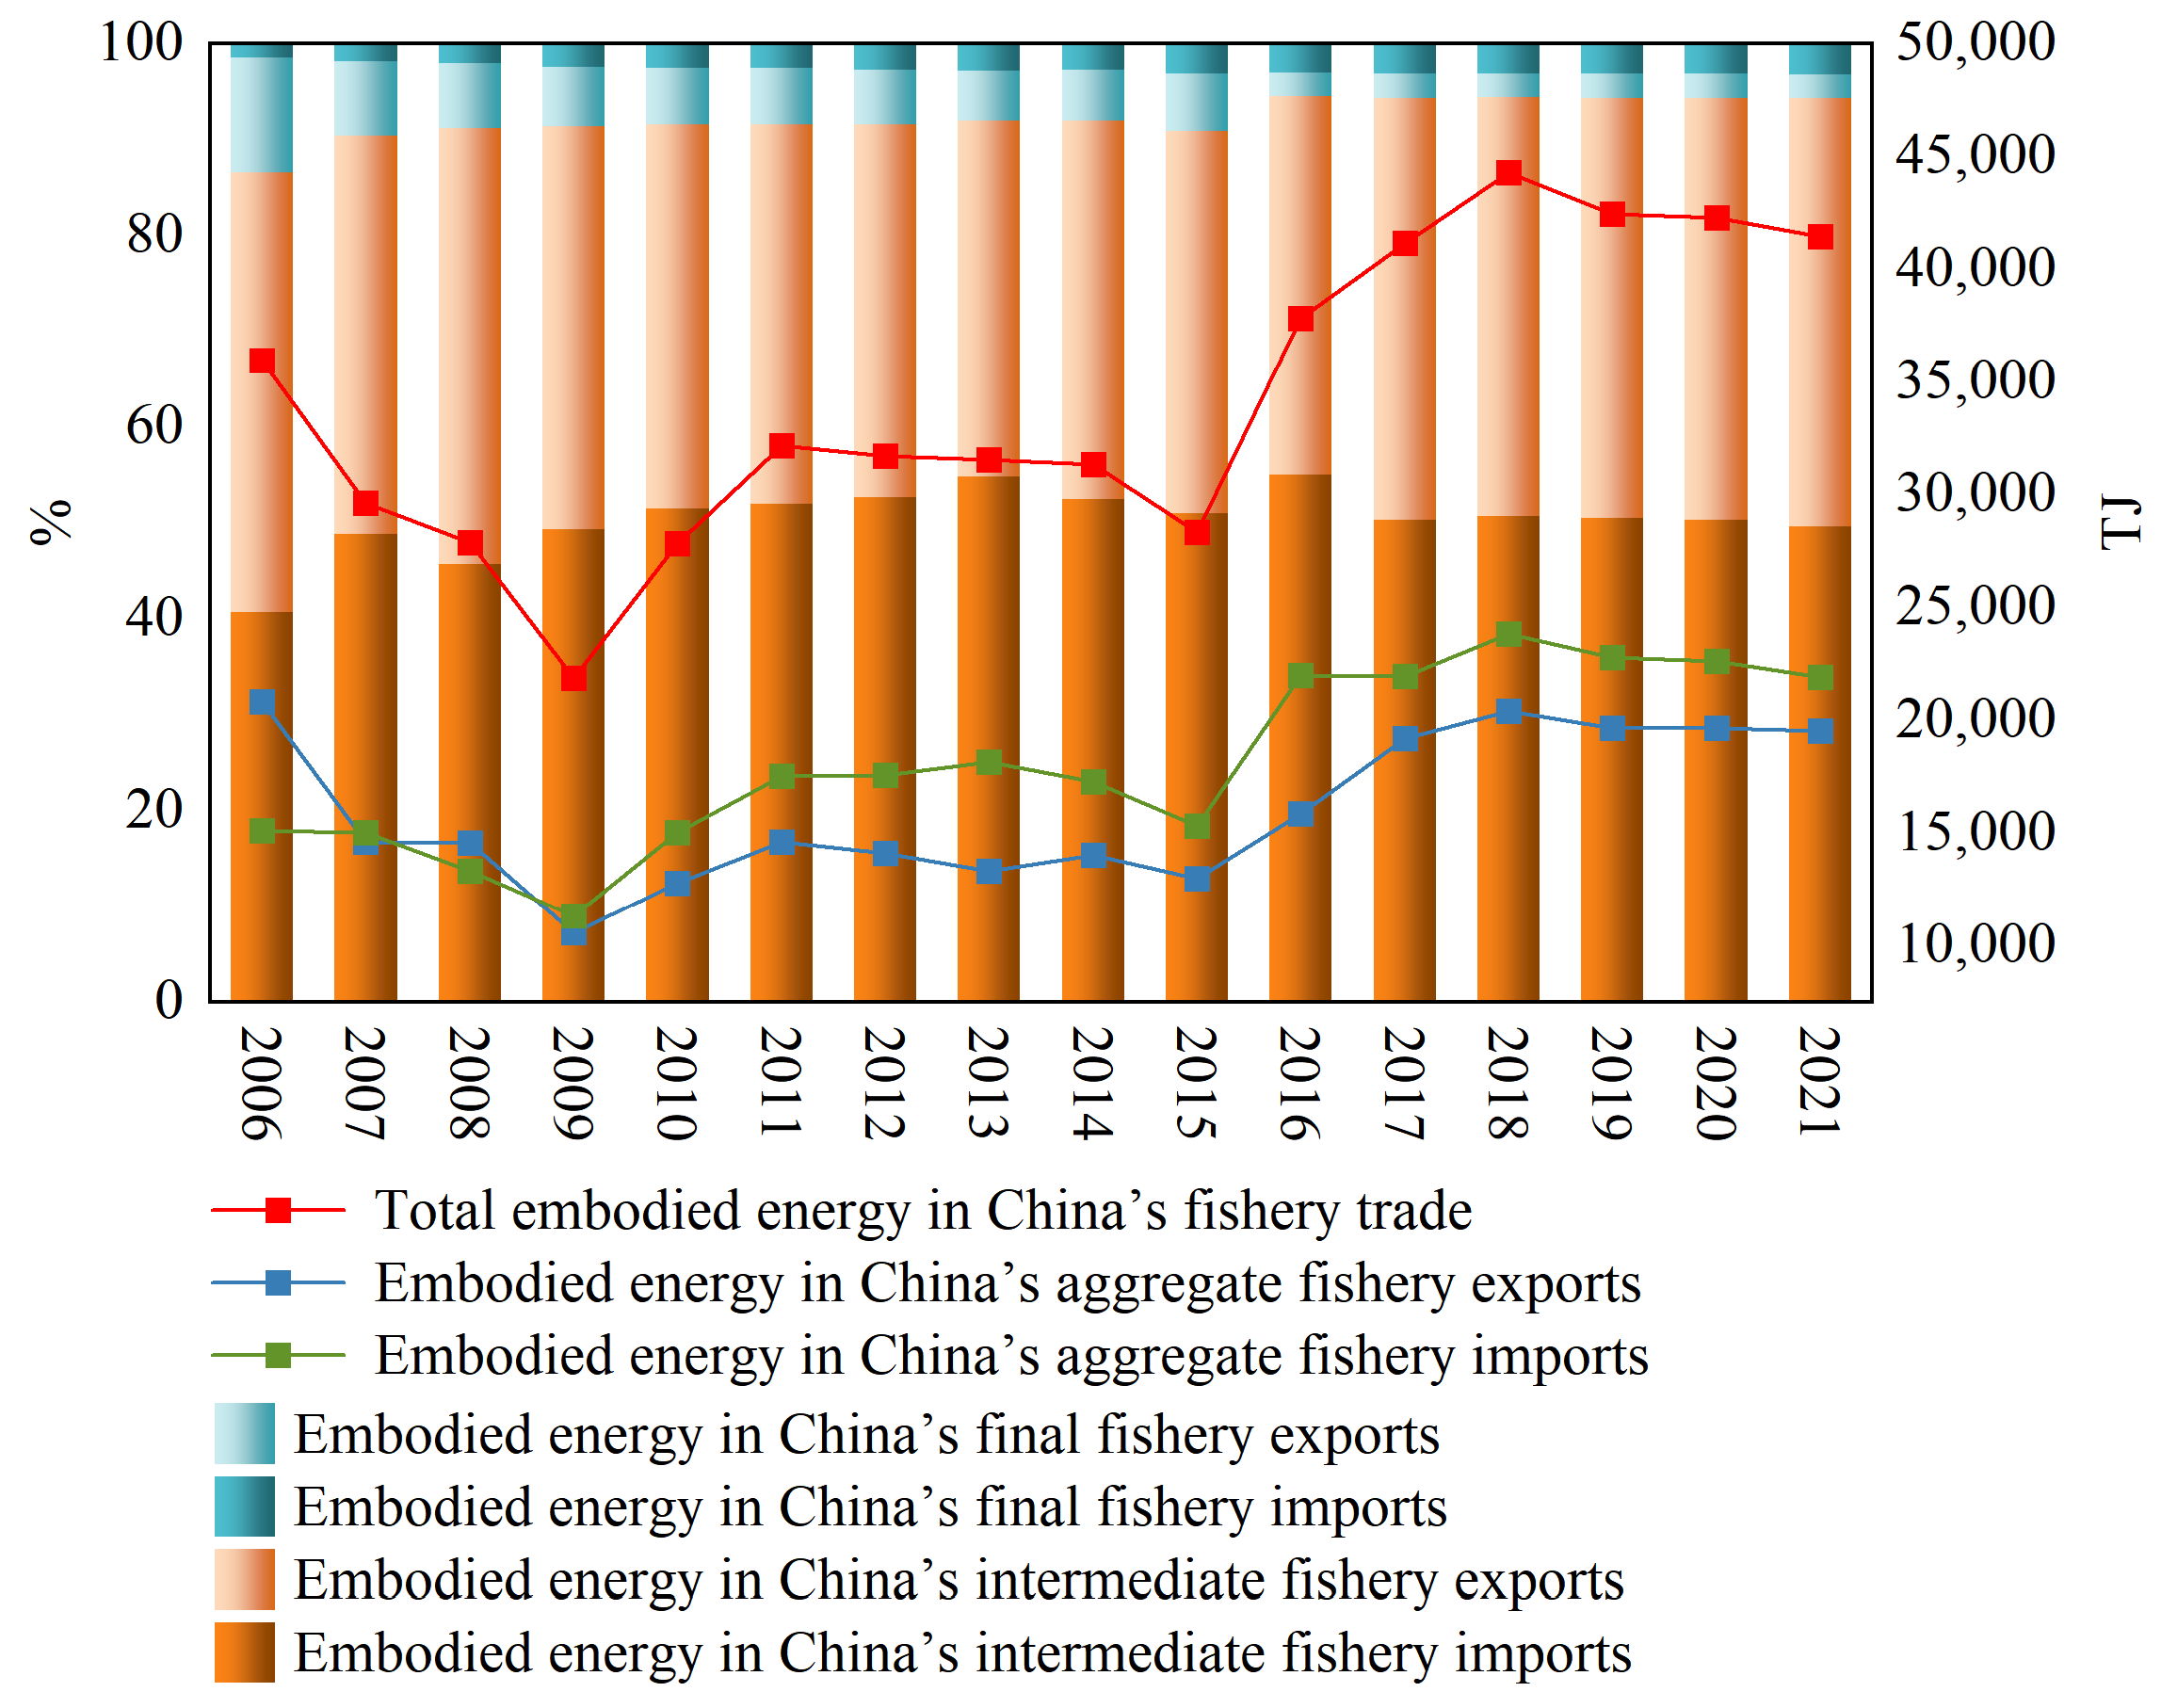
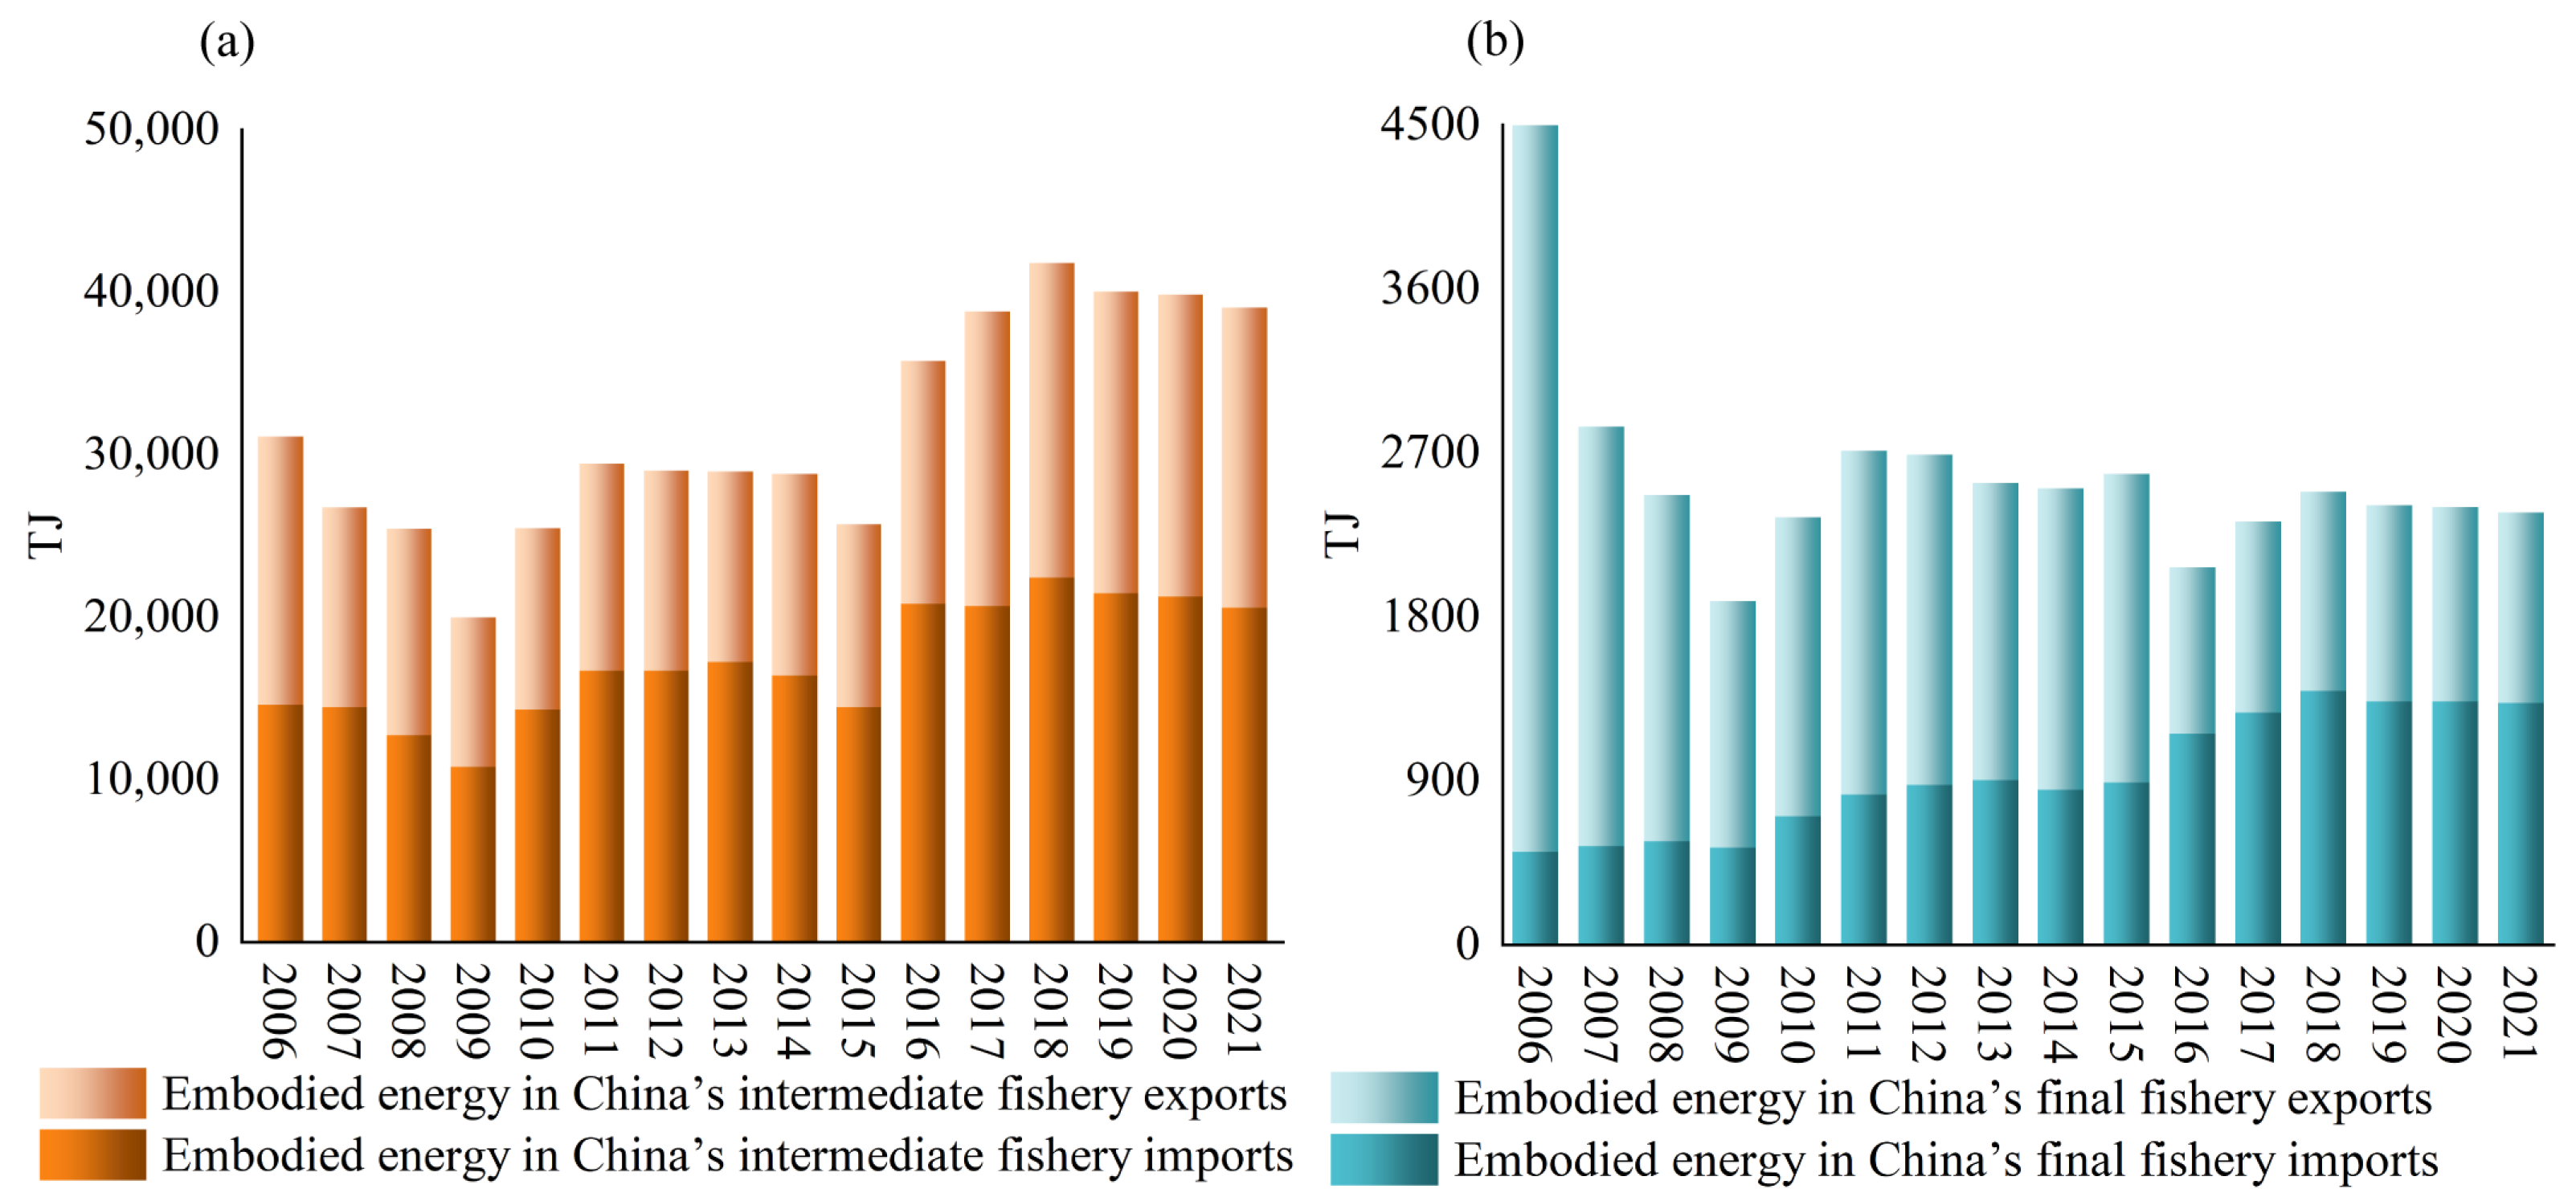
- From 2006 to 2021, the evolutionary trends in embodied energy in the total fishery trade, fishery import and export trade, intermediate fishery trade, and final fishery trade between China and the countries along the MSR were generally similar, and all showed an increase with fluctuations. Embodied energy in the intermediate fishery trade was the major component (92.2%) of embodied energy in China’s fishery trade. China gradually changed from a net exporter to a net importer of embodied energy in intermediate, final, and total fishery trades with countries along the MSR.
- (2)
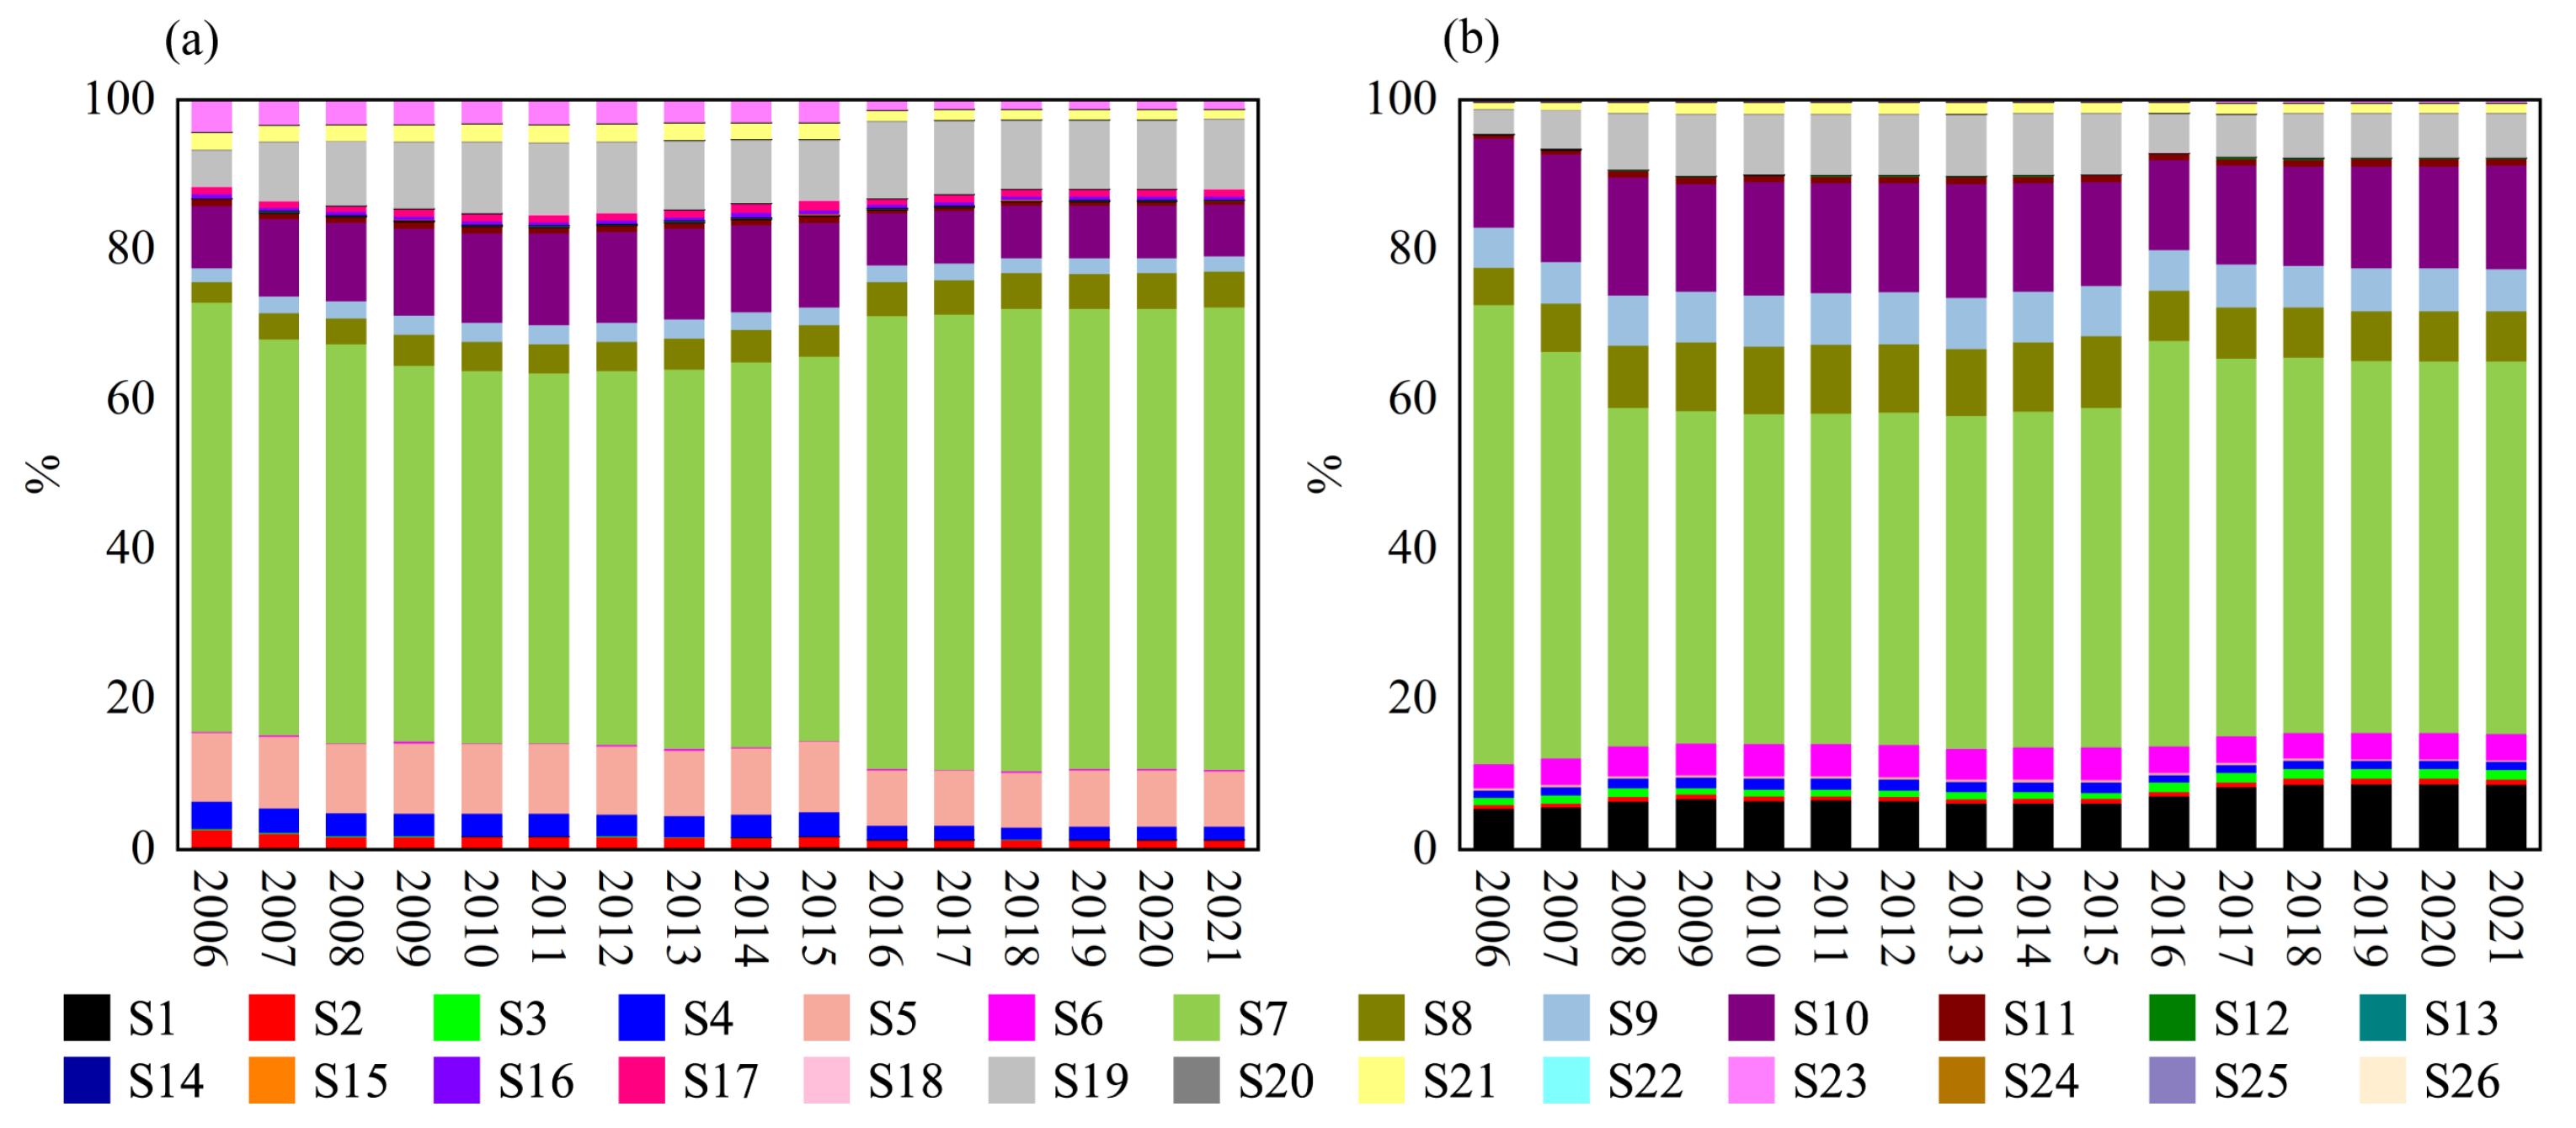
- From a regional perspective, the embodied energy in China’s fishery trade with Japan, South Korea, and Southeast Asia is the major part of the embodied energy in China’s fishery trade with countries along the MSR. Southeast Asia has gradually become the main region for China’s intermediate fishery exports and final fishery imports in terms of embodied energy. Japan and South Korea were major destinations for China’s final fishery exports in terms of embodied energy. Japan, South Korea, Southeast Asia, and West Asia were the leading sources of embodied energy in China’s intermediate fishery imports. From a sectoral perspective, petroleum, chemical, and non-metallic mineral products and transport equipment were the primary components (64.0%) of embodied energy in China’s intermediate fishery trade.
- (3)
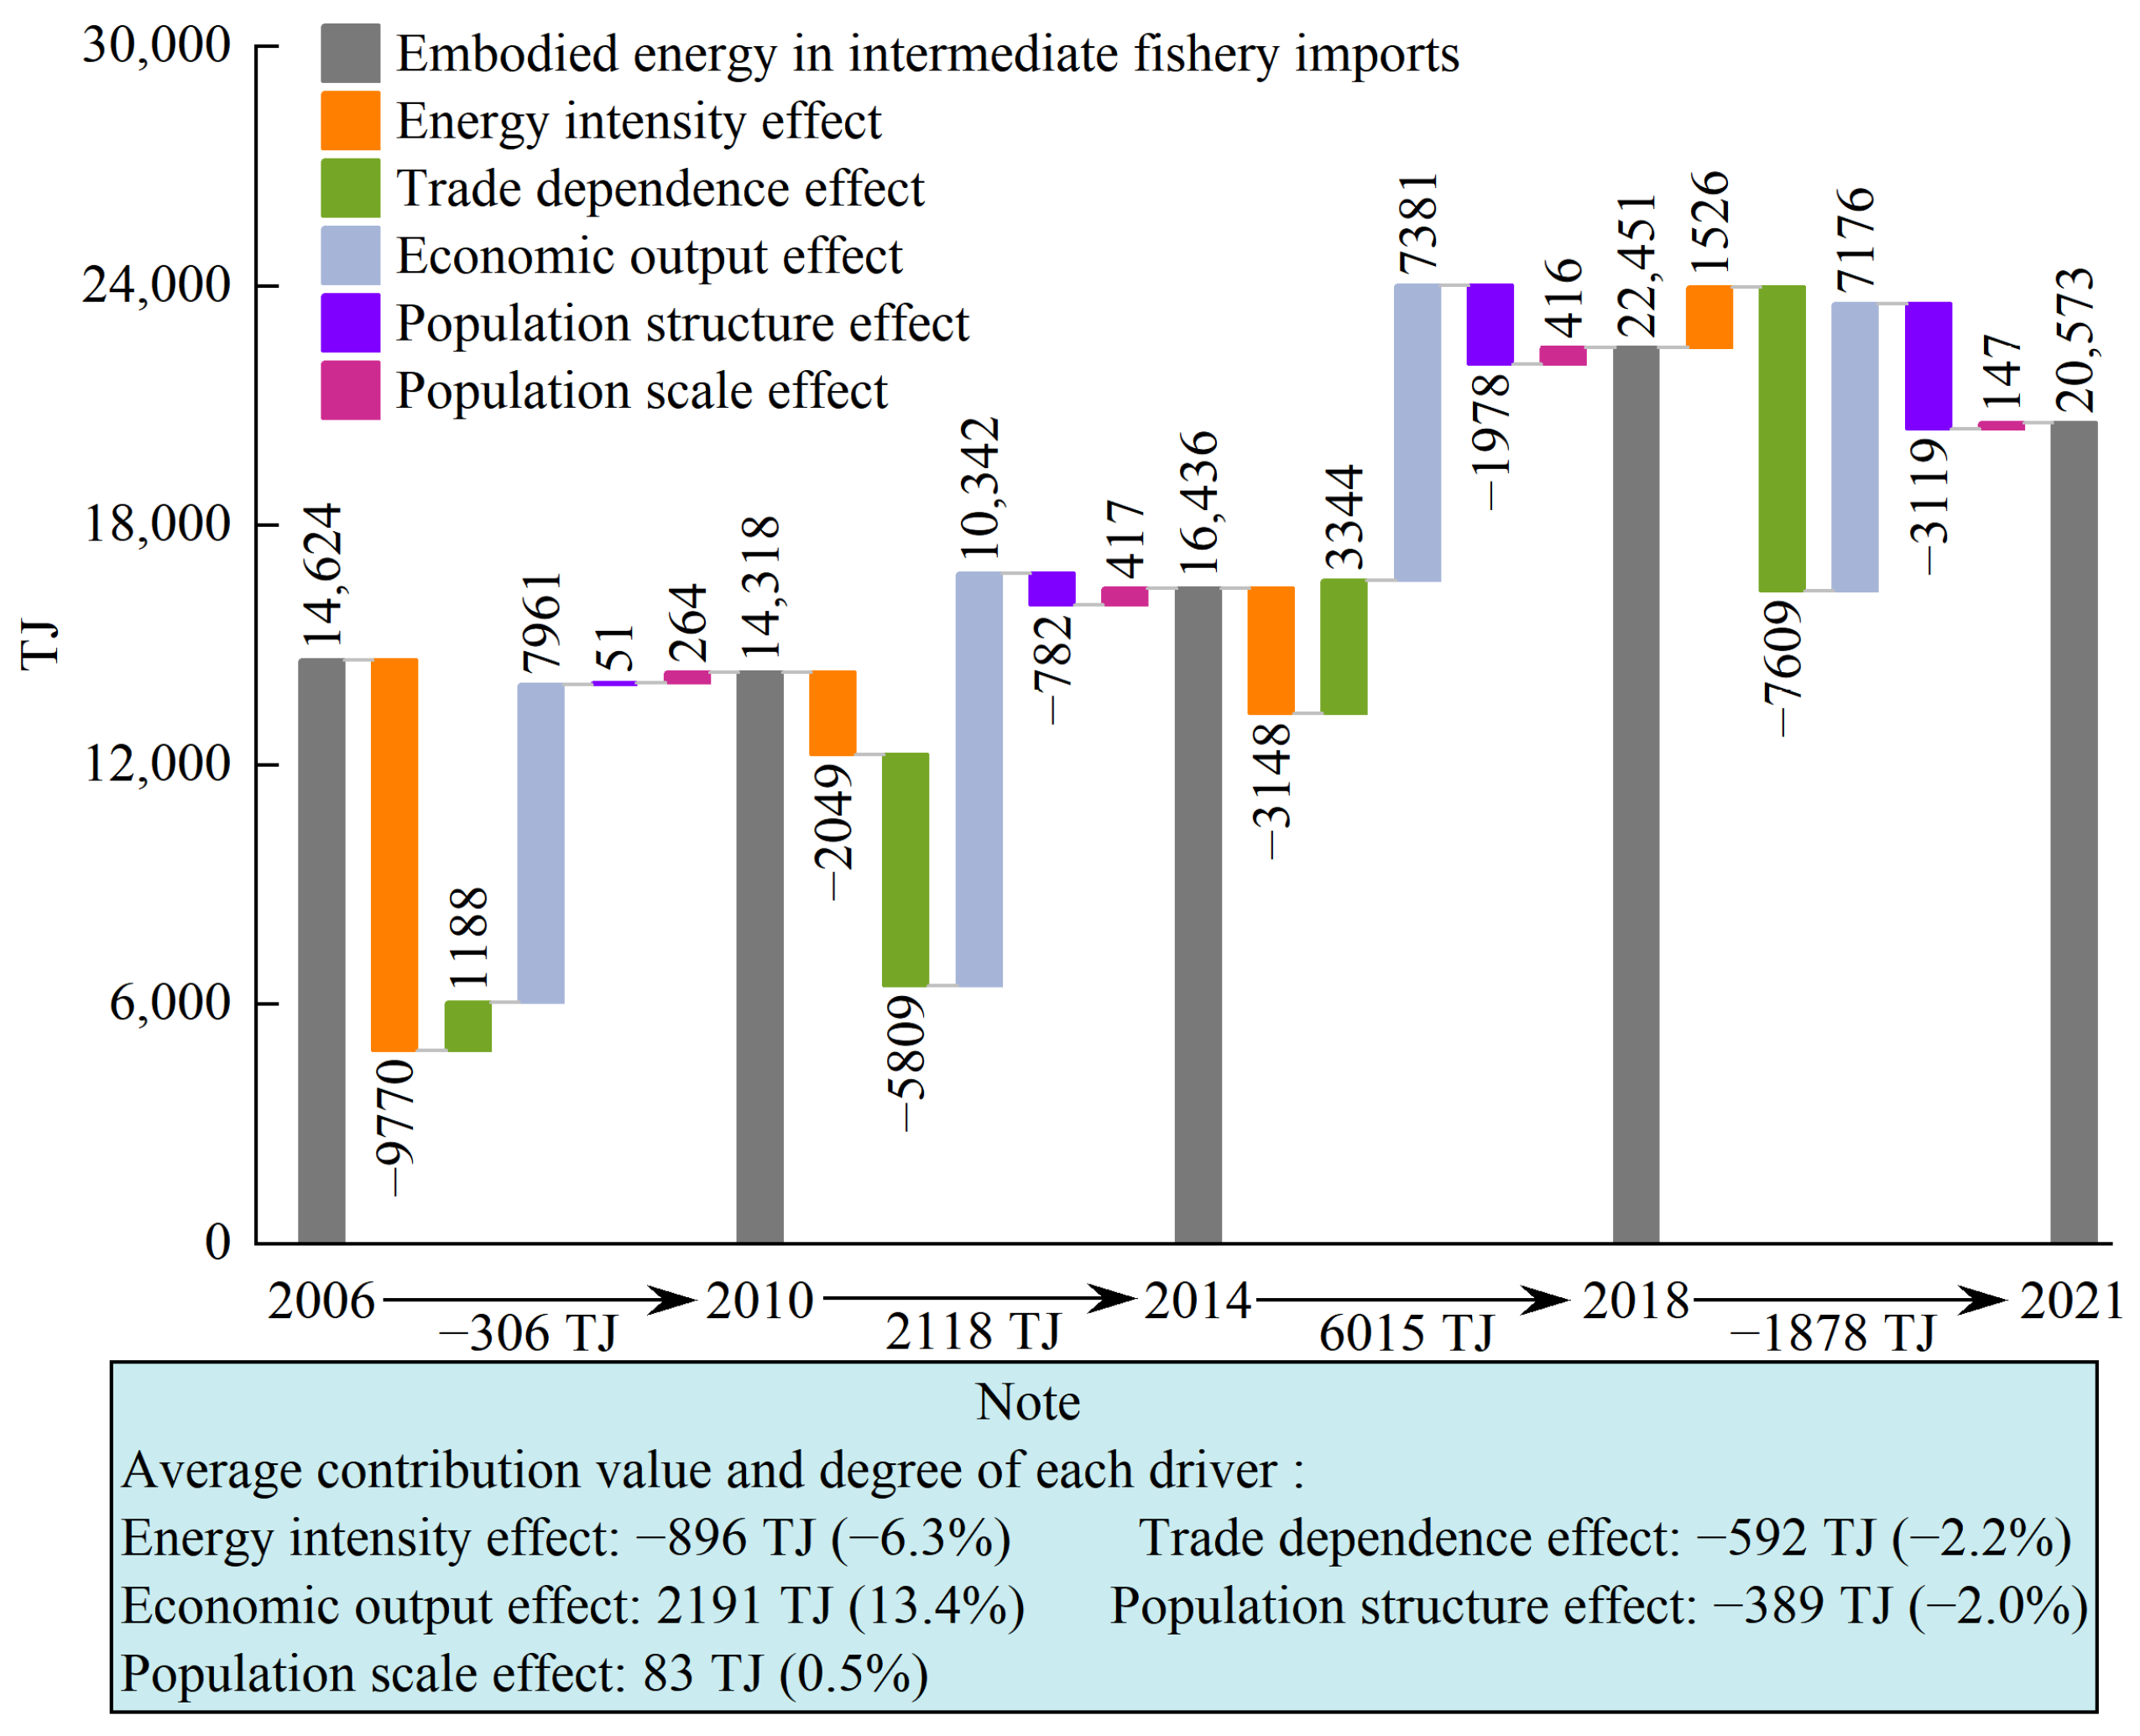
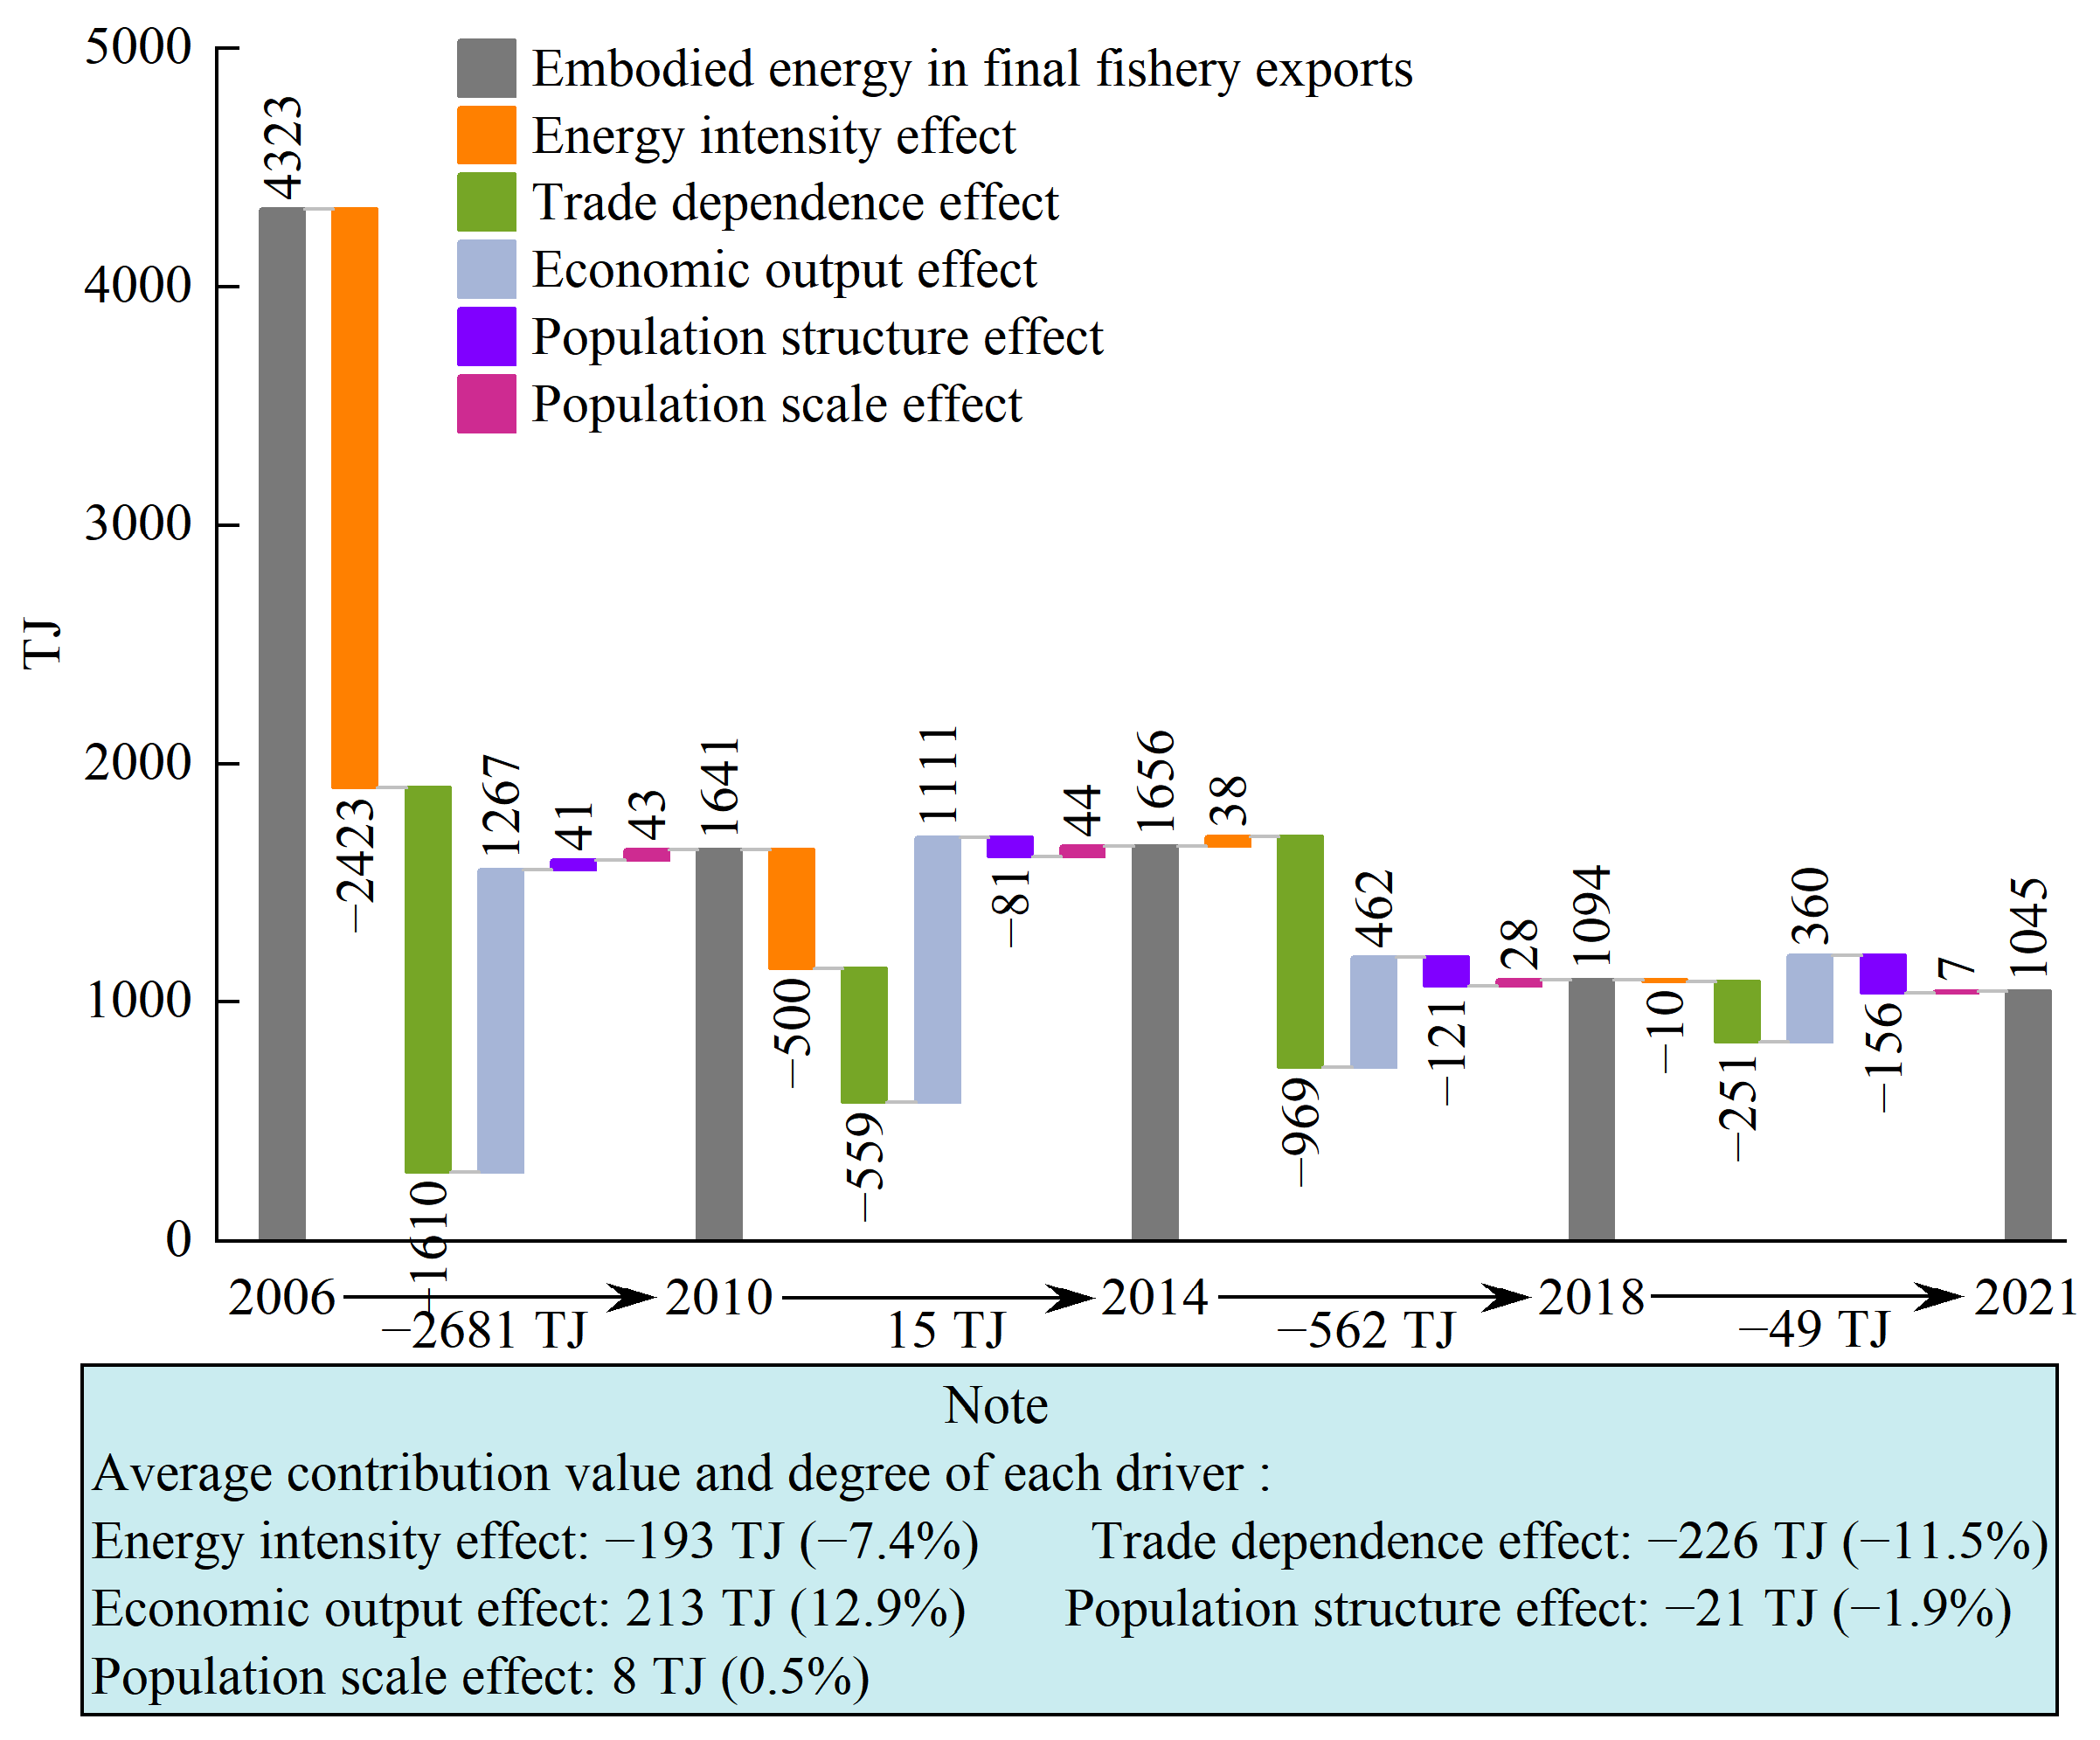
- The results of the LMDI decomposition showed that economic growth was the major cause of increase in embodied energy in all types of fishery trade in China, and the positive driving force of the economic output effect gradually increased with time. Improvements in energy efficiency substantially reduced the embodied energy in all types of China’s fishery trade during the study period; however, as the improvement in energy efficiency slowed down, the negative driving force of the energy intensity effect gradually reduced. The trade effect showed a strong negative impact only on the embodied energy in China’s final fishery export trade and a weak impact on embodied energy in the remaining types of fishery trade. A decrease in the proportion of the Chinese fishery population had an inhibitory effect on the growth of embodied energy in all types of fishery trade in China. A decrease in population growth rate led to a decrease in the population effect on embodied energy in all types of fishery trade.
5.2. Policy Implications
Supplementary Materials
Author Contributions
Funding
Data Availability Statement
Conflicts of Interest
Appendix A

| Sector Code | Meaning | Sector Code | Meaning |
|---|---|---|---|
| S1 | Agriculture | S14 | Construction |
| S2 | Fishing | S15 | Maintenance and Repair |
| S3 | Mining and Quarrying | S16 | Wholesale Trade |
| S4 | Food and Beverages | S17 | Retail Trade |
| S5 | Textiles and Wearing Apparel | S18 | Hotels and Restraurants |
| S6 | Wood and Paper | S19 | Transport |
| S7 | Petroleum, Chemical, and Non-Metallic Mineral Products | S20 | Post and Telecommunications |
| S8 | Metal Products | S21 | Finacial Intermediation and Business Activities |
| S9 | Electrical and Machinery | S22 | Public Administration |
| S10 | Transport Equipment | S23 | Education, Health, and Other Services |
| S11 | Other Manufacturing | S24 | Private Households |
| S12 | Recycling | S25 | Others |
| S13 | Electricity, Gas, and Water | S26 | Re-export and Re-import |
| Years | China | Countries Along the MSR | ||
|---|---|---|---|---|
| CIFI | CFFI | CIFE | CFFE | |
| 2006 | 9318 | 136 | −6204 | −990 |
| 2007 | 4305 | −61 | −1683 | 427 |
| 2008 | 6222 | −134 | −78 | 602 |
| 2009 | 4075 | −168 | 2312 | 496 |
| 2010 | 5570 | −200 | 3268 | 600 |
| 2011 | 6605 | −216 | 3846 | 664 |
| 2012 | 6225 | −245 | 3791 | 717 |
| 2013 | 3463 | −317 | 4984 | 1118 |
| 2014 | 3724 | −254 | 3915 | 1051 |
| 2015 | 2311 | −288 | 4540 | 1033 |
| 2016 | 1202 | −32 | 4686 | 1177 |
| 2017 | 4681 | 71 | 5311 | 985 |
| 2018 | 4208 | 94 | 4372 | 1038 |
| 2019 | 3026 | 118 | 4916 | 991 |
| 2020 | 2751 | 104 | 5068 | 1020 |
| 2021 | 1711 | 48 | 5776 | 1141 |
| TEST | 69,395 | 570 | 56,784 | 13,059 |
| TESD | 0 | −1914 | −7964 | −990 |

References
- BP. Statistical Review of World Energy 2022. 2022. Available online: https://www.bp.com/en/global/corporate/energy-economics/statistical-review-of-world-energy.html (accessed on 5 August 2023).
- Ma, X.; Wang, C.; Dong, B.; Gu, G.; Chen, R.; Li, Y.; Zou, H.; Zhang, W.; Li, Q. Carbon emissions from energy consumption in China: Its measurement and driving factors. Sci. Total Environ. 2019, 648, 1411–1420. [Google Scholar] [CrossRef] [PubMed]
- World Bank. World Development Indicators. 2023. Available online: https://databank.worldbank.org/source/world-development-indicators (accessed on 12 August 2023).
- Liu, Z.; Geng, Y.; Lindner, S.; Zhao, H.; Fujita, T.; Guan, D. Embodied energy use in China’s industrial sectors. Energy Policy 2012, 49, 751–758. [Google Scholar] [CrossRef]
- Costanza, R. Embodied energy and economic valuation. Science 1980, 210, 1219–1224. [Google Scholar] [CrossRef] [PubMed]
- Chen, Z.M.; Chen, G.Q. Demand-driven energy requirement of world economy 2007: A multi-region input-output network simulation, Commun. Nonlinear Sci. Numer. Simul. 2013, 18, 1757–1774. [Google Scholar] [CrossRef]
- Xu, Z.; Li, Y.; Chau, S.N.; Dietz, T.; Li, C.; Wan, L.; Zhang, J.; Zhang, L.; Li, Y.; Chung, M.G.; et al. Impacts of international trade on global sustainable development. Nat. Sustain. 2020, 3, 964–971. [Google Scholar] [CrossRef]
- Lee, T.-M.; Chi, P.-Y.; Chang, K.-I. Duration and determinants of fishery trade patterns: Evidence from OECD countries. Mar. Policy 2020, 118, 103977. [Google Scholar] [CrossRef]
- UNCD. UN Comtrade Database. 2022. Available online: https://comtradeplus.un.org/ (accessed on 3 September 2023).
- Pan, W.L.; Hu, C.; Huang, G.; Dai, W.Q.; Pan, W. Energy footprint: Concept, application and modeling. Ecol. Indic. 2024, 158, 111459. [Google Scholar] [CrossRef]
- Akizu-Gardoki, O.; Wakiyama, T.; Wiedmann, T.; Bueno, G.; Arto, I.; Lenzen, M.; Lopez-Guede, J.M. Hidden Energy Flow indicator to reflect the outsourced energy requirements of countries. J. Clean Prod. 2021, 278, 123827. [Google Scholar] [CrossRef]
- Zhao, Y.; Xu, Y.N.; Yu, M. An approach for measuring and analyzing embodied carbon in the construction industry chain based on emergy accounting. Ecol. Indic. 2024, 158, 111481. [Google Scholar] [CrossRef]
- Estelaji, F.; Ghaderi, N.; Ghorbani, M.; Naseri, A.; Zahedi, R.; Pourezzat, A.; Keshavarzzadeh, M.; Yousefi, H.J.J.I.A. Efficiency Evaluation of Surface Water Collection Infrastructure during Floods: Information Analysis and Zoning Management. J. Inform. Anal. 2024, 2, 2. [Google Scholar] [CrossRef]
- Zahedi, R.; Yousefi, H.; Aslani, A.; Ahmadi, R. System dynamic model of water, energy and food nexus for policy implementation. Appl. Water Sci. 2024, 14, 213. [Google Scholar] [CrossRef]
- Zhang, L.; Wang, H.R.; Liu, X.; Li, Y.Y.; Jiang, X. An integrated analysis framework towards identifying circulation relationship of water-energy-carbon in complex system: A case study in Shandong Province. Ecol. Indic. 2024, 158, 111493. [Google Scholar] [CrossRef]
- Yu, N.; Sun, R.J.; Yang, S. Multi-dimensional factor coupling-driven mechanism of spatio-temporal evolution of energy ecological footprint: Evidence from China. Ecol. Indic. 2024, 159, 111701. [Google Scholar] [CrossRef]
- Shi, J.; Li, H.; Guan, J.; Sun, X.; Guan, Q.; Liu, X. Evolutionary features of global embodied energy flow between sectors: A complex network approach. Energy 2017, 140, 395–405. [Google Scholar] [CrossRef]
- Tang, M.; Hong, J.; Liu, G.; Shen, G.Q. Exploring energy flows embodied in China’s economy from the regional and sectoral perspectives via combination of multi-regional input-output analysis and a complex network approach. Energy 2019, 170, 1191–1201. [Google Scholar] [CrossRef]
- Guo, S.; Zheng, S.; Hu, Y.; Hong, J.; Wu, X.; Tang, M. Embodied energy use in the global construction industry. Appl. Energy 2019, 256, 113838. [Google Scholar] [CrossRef]
- Liu, B.; Gao, Q.; Jin, H.; Lei, Y.; Liu, C. System indeterminacy analysis in the embodied energy network of global construction industries. Energy 2022, 261, 125216. [Google Scholar] [CrossRef]
- Liu, B.; Wang, D.; Xu, Y.; Liu, C.; Luther, M. A multi-regional input-output analysis of energy embodied in international trade of construction goods and services. J. Clean Prod. 2018, 201, 439–451. [Google Scholar] [CrossRef]
- Li, J.; Fang, H.; Fang, S.; Zhang, Z.; Zhang, P. Embodied energy use in China’s transportation sector: A multi-regional input–output analysis. Int.J. Environ. Res. Public Health 2021, 18, 7873. [Google Scholar] [CrossRef]
- Shi, J.; Li, C.; Li, H. Energy consumption in China’s ICT sectors: From the embodied energy perspective. Renew. Sust. Energ. Rev. 2022, 160, 112313. [Google Scholar] [CrossRef]
- Cao, S.; Xie, G.; Zhen, L. Total embodied energy requirements and its decomposition in China’s agricultural sector. Ecol. Econ. 2010, 69, 1396–1404. [Google Scholar] [CrossRef]
- Wang, Z.; Zhang, H.; Li, H.; Wang, S.; Wang, Z. Identifying the key factors to China’s unsustainable external circulation through the accounting of the flow of embodied energy and virtual water. Renew. Sust. Energ. Rev. 2023, 173, 113115. [Google Scholar] [CrossRef]
- Jiang, L.; He, S.; Tian, X.; Zhang, B.; Zhou, H. Energy use embodied in international trade of 39 countries: Spatial transfer patterns and driving factors. Energy 2020, 195, 116988. [Google Scholar] [CrossRef]
- Dai, Y.; Gao, H.O. Energy consumption in China’s logistics industry: A decomposition analysis using the LMDI approach. Transport. Res. Part D-Transport. Environ. 2016, 46, 69–80. [Google Scholar] [CrossRef]
- Zhu, C.; Chang, Y.; Li, X.; Shan, M. Factors influencing embodied carbon emissions of China’s building sector: An analysis based on extended STIRPAT modeling. Energy Build. 2022, 255, 111607. [Google Scholar] [CrossRef]
- Luo, F.; Guo, Y.; Yao, M.; Cai, W.; Wang, M.; Wei, W. Carbon emissions and driving forces of China’s power sector: Input-output model based on the disaggregated power sector. J. Clean Prod. 2020, 268, 121925. [Google Scholar] [CrossRef]
- Dong, K.; Wang, J.; Taghizadeh-Hesary, F. Assessing the embodied CO2 emissions of ICT industry and its mitigation pathways under sustainable development: A global case. Appl. Soft. Comput. 2022, 131, 109760. [Google Scholar] [CrossRef]
- Johnson, R.C.; Noguera, G. Accounting for intermediates: Production sharing and trade in value added. J. Int. Econ. 2012, 86, 224–236. [Google Scholar] [CrossRef]
- Meng, J.; Hu, X.; Chen, P.; Coffman, D.M.; Han, M. The unequal contribution to global energy consumption along the supply chain. J. Environ. Manag. 2020, 268, 110701. [Google Scholar] [CrossRef]
- Xu, H.; Zhao, G.; Xie, R.; Zhu, K. A trade-related CO2 emissions and its composition: Evidence from China. J. Environ. Manag. 2020, 270, 110893. [Google Scholar] [CrossRef]
- Wu, X.D.; Guo, J.L.; Li, C.; Chen, G.Q.; Ji, X. Carbon emissions embodied in the global supply chain: Intermediate and final trade imbalances. Sci. Total Environ. 2020, 707, 134670. [Google Scholar] [CrossRef] [PubMed]
- Chen, G.Q.; Han, M.Y. Global supply chain of arable land use: Production-based and consumption-based trade imbalance. Land Use Policy 2015, 49, 118–130. [Google Scholar] [CrossRef]
- Xia, Q.; Han, M.; Wu, X. Evolution and drivers of energy embodied in intermediate and final trade between China and the world. Earth’s Future 2022, 10, e2022EF002968. [Google Scholar] [CrossRef]
- Wu, X.; Guo, J.; Chen, G.; Wu, X.; Meng, J.; Alhodaly, M.; Wakeel, M. Energy use flows in the supply chains of the world economy: A full account of both primary and intermediate inputs. J. Clean Prod. 2021, 320, 128621. [Google Scholar] [CrossRef]
- Wiedmann, T.; Minx, J.; Barrett, J.; Wackernagel, M. Allocating ecological footprints to final consumption categories with input-output analysis. Ecol. Econ. 2006, 56, 28–48. [Google Scholar] [CrossRef]
- Cornaro, A.; Rizzini, G. Environmentally extended input-output analysis in complex networks: A multilayer approach. Ann. Oper. Res. 2022, 1–28. [Google Scholar] [CrossRef]
- Mubako, S.; Lahiri, S.; Lant, C. Input-output analysis of virtual water transfers: Case study of California and Illinois. Ecol. Econ. 2013, 93, 230–238. [Google Scholar] [CrossRef]
- Schau, E.M.; Ellingsen, H.; Endal, A.; Aanondsen, S.A. Energy consumption in the Norwegian fisheries. J. Clean Prod. 2009, 17, 325–334. [Google Scholar] [CrossRef]
- Chen, X.; Di, Q.; Hou, Z.; Yu, Z. Measurement of carbon emissions from marine fisheries and system dynamics simulation analysis: China’s northern marine economic zone case. Mar. Policy 2022, 145, 105279. [Google Scholar] [CrossRef]
- Guan, H.; Chen, Y.; Zhao, A. Carbon neutrality assessment and driving factor analysis of China’s offshore fishing industry. Water 2022, 14, 4112. [Google Scholar] [CrossRef]
- Guzman-Luna, P.; Gerbens-Leenes, P.W.; Vaca-Jimenez, S.D. The water, energy, and land footprint of tilapia aquaculture in mexico, a comparison of the footprints of fish and meat. Resour. Conserv. Recycl. 2021, 165, 105224. [Google Scholar] [CrossRef]
- Jiang, Q.; Bhattarai, N.; Pahlow, M.; Xu, Z. Environmental sustainability and footprints of global aquaculture. Resour. Conserv. Recycl. 2022, 180, 106183. [Google Scholar] [CrossRef]
- Xu, C.; Su, G.; Zhao, K.; Wang, H.; Xu, X.; Li, Z.; Hu, Q.; Xu, J. Assessment of greenhouse gases emissions and intensity from Chinese marine aquaculture in the past three decades. J. Environ. Manag. 2023, 329, 117025. [Google Scholar] [CrossRef] [PubMed]
- Xu, X.; Yang, Z. Does aquatic products trade waste or save water resources? An analysis of virtual water trade. Water Policy 2022, 24, 305–323. [Google Scholar] [CrossRef]
- Liu, W.; Dunford, M.; Gao, B. A discursive construction of the Belt and Road Initiative: From neo-liberal to inclusive globalization. J. Geogr. Sci. 2018, 28, 1199–1214. [Google Scholar] [CrossRef]
- Usubiaga-Liano, A.; Arto, I.; Acosta-Fernandez, J. Double accounting in energy footprint and related assessments: How common is it and what are the consequences? Energy 2021, 222, 119891. [Google Scholar] [CrossRef]
- Ang, B.W.; Zhang, F.Q.; Choi, K.H. Factorizing changes in energy and environmental indicators through decomposition. Energy 1998, 23, 489–495. [Google Scholar] [CrossRef]
- Ang, B.W. The LMDI approach to decomposition analysis: A practical guide. Energy Policy 2005, 33, 867–871. [Google Scholar] [CrossRef]
- Lenzen, M.; Kanemoto, K.; Moran, D.; Geschke, A. Mapping the structure of the world economy. Environ. Sci. Technol. 2012, 46, 8374–8381. [Google Scholar] [CrossRef]
- Lenzen, M.; Moran, D.; Kanemoto, K.; Geschke, A. Building Eora: A global multi-region input–output database at high country and sector resolution. Econ. Syst. Res. 2013, 25, 20–49. [Google Scholar] [CrossRef]
- Shao, L.; Guan, D.; Wu, Z.; Wang, P.; Chen, G.Q. Multi-scale input-output analysis of consumption-based water resources: Method and application. J. Clean Prod. 2017, 164, 338–346. [Google Scholar] [CrossRef]
- Cheng, M.; Wu, J.; Li, C.; Jia, Y.; Xia, X. Tele-connection of global agricultural land network: Incorporating complex network approach with multi-regional input-output analysis. Land Use Policy 2023, 125, 106464. [Google Scholar] [CrossRef]
- Chen, B.; Li, J.S.; Wu, X.F.; Han, M.Y.; Zeng, L.; Li, Z.; Chen, G.Q. Global energy flows embodied in international trade: A combination of environmentally extended input-output analysis and complex network analysis. Appl. Energy 2018, 210, 98–107. [Google Scholar] [CrossRef]
- Eora26. The Eora Global Supply Chain Database. 2023. Available online: https://worldmrio.com/eora26/ (accessed on 20 July 2023).
- CFSY. China Fishery Statistical Yearbook 2006–2022; China Agriculture Press: Beijing, China.
- Li, J.; Huang, K.; Yu, Y.; Qu, S.; Xu, M. Telecoupling China’s city-level water withdrawal with distant consumption. Environ. Sci. Technol. 2023, 57, 4332–4341. [Google Scholar] [CrossRef] [PubMed]
- Lan, J.; Malik, A.; Lenzen, M.; McBain, D.; Kanemoto, K. A structural decomposition analysis of global energy footprints. Appl. Energy 2016, 163, 436–451. [Google Scholar] [CrossRef]
- Yan, J.; Li, Y.; Su, B.; Ng, T.S. Contributors and drivers of Chinese energy use and intensity from regional and demand perspectives, 2012–2015–2017. Energy Econ. 2022, 115, 106357. [Google Scholar] [CrossRef]
- Yang, Y. Energy globalization of China: Trade, investment, and embedded energy flows. J. Geogr. Sci. 2022, 32, 377–400. [Google Scholar] [CrossRef]
- Sun, X.; Shi, Q. Factors influencing embodied energy trade between the Belt and Road countries: A gravity approach. Environ. Sci. Pollut. Res. 2021, 29, 11574–11589. [Google Scholar] [CrossRef]
- Feng, Z.; Zhou, W.; Ming, Q. Embodied energy flow patterns of the internal and external industries of manufacturing in China. Sustainability 2019, 11, 438. [Google Scholar] [CrossRef]
- Dawkins, E.; Moran, D.; Palm, V.; Wood, R.; Bjork, I. The Swedish footprint: A multi-model comparison. J. Clean Prod. 2019, 209, 1578–1592. [Google Scholar] [CrossRef]
- Tarne, P.; Lehmann, A.; Finkbeiner, M. A comparison of Multi-Regional Input-Output databases regarding transaction structure and supply chain analysis. J. Clean Prod. 2018, 196, 1486–1500. [Google Scholar] [CrossRef]
- Liu, Z.; Huang, X.; Li, M.; Ma, X. The role of intermediate products in the changes of China’s energy use: Index decomposition of the MRIO model. Environ. Sci. Pollut. Res. 2021, 28, 48481–48493. [Google Scholar] [CrossRef] [PubMed]


| No. | Country | Abbreviation | Aggregate Region |
|---|---|---|---|
| 1 | China | CHN | China |
| 2 | Japan | JPN | Japan and South Korea |
| 3 | South Korea | KOR | |
| 4 | Brunei | BRN | Southeast Asia |
| 5 | Cambodia | KHM | |
| 6 | Indonesia | IDN | |
| 7 | Malaysia | MYS | |
| 8 | Myanmar | MMR | |
| 9 | Philippines | PHL | |
| 10 | Singapore | SGP | |
| 11 | Thailand | THA | |
| 12 | Vietnam | VNM | |
| 13 | Bangladesh | BGD | South Asia |
| 14 | India | IND | |
| 15 | Pakistan | PAK | |
| 16 | Sri Lanka | LKA | |
| 17 | Iran | IRN | West Asia |
| 18 | Iraq | IRQ | |
| 19 | Kuwait | KWT | |
| 20 | Lebanon | LBN | |
| 21 | Oman | OMN | |
| 22 | Qatar | QAT | |
| 23 | Saudi Arabia | SAU | |
| 24 | Turkey | TUR | |
| 25 | United Arab Emirates | ARE | |
| 26 | Yemen | YEM | |
| 27 | Albania | ALB | Mediterranean Europe |
| 28 | Bosnia and Herzegovina | BIH | |
| 29 | Croatia | HRV | |
| 30 | Cyprus | CYP | |
| 31 | Greece | GRC | |
| 32 | Italy | ITA | |
| 33 | Malta | MLT | |
| 34 | Montenegro | MNE | |
| 35 | Slovenia | SVN | |
| 36 | Algeria | DZA | North and East Africa |
| 37 | Egypt | EGY | |
| 38 | Kenya | KEN | |
| 39 | Libya | LBY | |
| 40 | Morocco | MAR | |
| 41 | Mozambique | MOZ | |
| 42 | South Africa | ZAF | |
| 43 | Tunisia | TUN | |
| 44 | Tanzania | TZA |
| Output | Intermediate Use | Final Demand | Total Output | ||||||||||
|---|---|---|---|---|---|---|---|---|---|---|---|---|---|
| Region 1 | … | Region n | Region 1 | … | Region n | ||||||||
| Input | 1 | … | n | 1 | … | n | |||||||
| Intermediate input | Region 1 | 1 | |||||||||||
| … | |||||||||||||
| n | |||||||||||||
| … | … | ||||||||||||
| Region n | 1 | ||||||||||||
| … | |||||||||||||
| n | |||||||||||||
| Value added | |||||||||||||
| Total input | |||||||||||||
| Energy use | |||||||||||||
| Type | Reference and Period | Focus | Method | Trade Pattern |
|---|---|---|---|---|
| Regional | Xia et al. [36] | China’s foreign trade | IOA | Intermediate trade |
| 1995–2018 | Energy flows and drivers | SDA | Final trade | |
| Sun and Shi [63] | China’s foreign trade | IOA | Intermediate trade | |
| 2002–2015 | Energy flows and drivers | Gravity model | Final trade | |
| Lan et al. [60] | International trade | IOA | Final trade | |
| 1990–2010 | Drivers | SDA | ||
| Jiang et al. [26] | International trade | IOA | Total trade | |
| 1995–2011 | Energy flows and drivers | LMDI | ||
| Yan et al. [61] | China’s domestic trade | IOA | Final trade | |
| 2012, 2015, 2017 | Drivers | SDA | ||
| Yang [62] | China’s foreign trade | IOA | Final trade | |
| 1995–2015 | Energy flows | Network analysis | ||
| Sectoral | Tang et al. [18] | All sectors | IOA | Intermediate trade |
| 2010 | China’s domestic trade | Network analysis | ||
| Energy flows | ||||
| Shi et al. [17] | All sectors | IOA | Intermediate trade | |
| 1995–2009 | International trade | Network analysis | ||
| Energy flows | ||||
| Liu et al. [20] | Construction sector | IOA | Intermediate trade | |
| 2000–2014 | International trade | Network analysis | ||
| Energy flows | ||||
| Liu et al. [21] | Construction sector | IOA | Intermediate trade | |
| 1995–2009 | International trade | Final trade | ||
| Energy flows | ||||
| Li et al. [22] | Transportation sector | IOA | Intermediate trade | |
| 2012 | China’s domestic trade | |||
| Energy flows | ||||
| Shi et al. [23] | ICT sector | IOA | Final trade | |
| 2018 | China’s domestic trade | |||
| Energy flows | ||||
| Feng et al. [64] | Manufacturing sector | IOA | Intermediate trade | |
| 2002, 2005, 2007, 2010, 2012 | China’s domestic trade | Network analysis | ||
| Energy flows | ||||
| This study | Fishery | IOA | Intermediate trade | |
| 2006–2021 | China’s foreign trade | LMDI | Final trade | |
| Energy flows and drivers |
Disclaimer/Publisher’s Note: The statements, opinions and data contained in all publications are solely those of the individual author(s) and contributor(s) and not of MDPI and/or the editor(s). MDPI and/or the editor(s) disclaim responsibility for any injury to people or property resulting from any ideas, methods, instructions or products referred to in the content. |
© 2024 by the authors. Licensee MDPI, Basel, Switzerland. This article is an open access article distributed under the terms and conditions of the Creative Commons Attribution (CC BY) license (https://creativecommons.org/licenses/by/4.0/).
Share and Cite
Zhao, L.; Jiang, J. Evolution and Drivers of Embodied Energy in Intermediate and Final Fishery Trade Between China and Maritime Silk Road Countries. Reg. Sci. Environ. Econ. 2024, 1, 104-127. https://doi.org/10.3390/rsee1010007
Zhao L, Jiang J. Evolution and Drivers of Embodied Energy in Intermediate and Final Fishery Trade Between China and Maritime Silk Road Countries. Regional Science and Environmental Economics. 2024; 1(1):104-127. https://doi.org/10.3390/rsee1010007
Chicago/Turabian StyleZhao, Liangshi, and Jiaxi Jiang. 2024. "Evolution and Drivers of Embodied Energy in Intermediate and Final Fishery Trade Between China and Maritime Silk Road Countries" Regional Science and Environmental Economics 1, no. 1: 104-127. https://doi.org/10.3390/rsee1010007
APA StyleZhao, L., & Jiang, J. (2024). Evolution and Drivers of Embodied Energy in Intermediate and Final Fishery Trade Between China and Maritime Silk Road Countries. Regional Science and Environmental Economics, 1(1), 104-127. https://doi.org/10.3390/rsee1010007