
Renesting Propensity of Reintroduced Eastern Migratory Whooping Cranes


Simple Summary
Abstract
1. Introduction
2. Materials and Methods
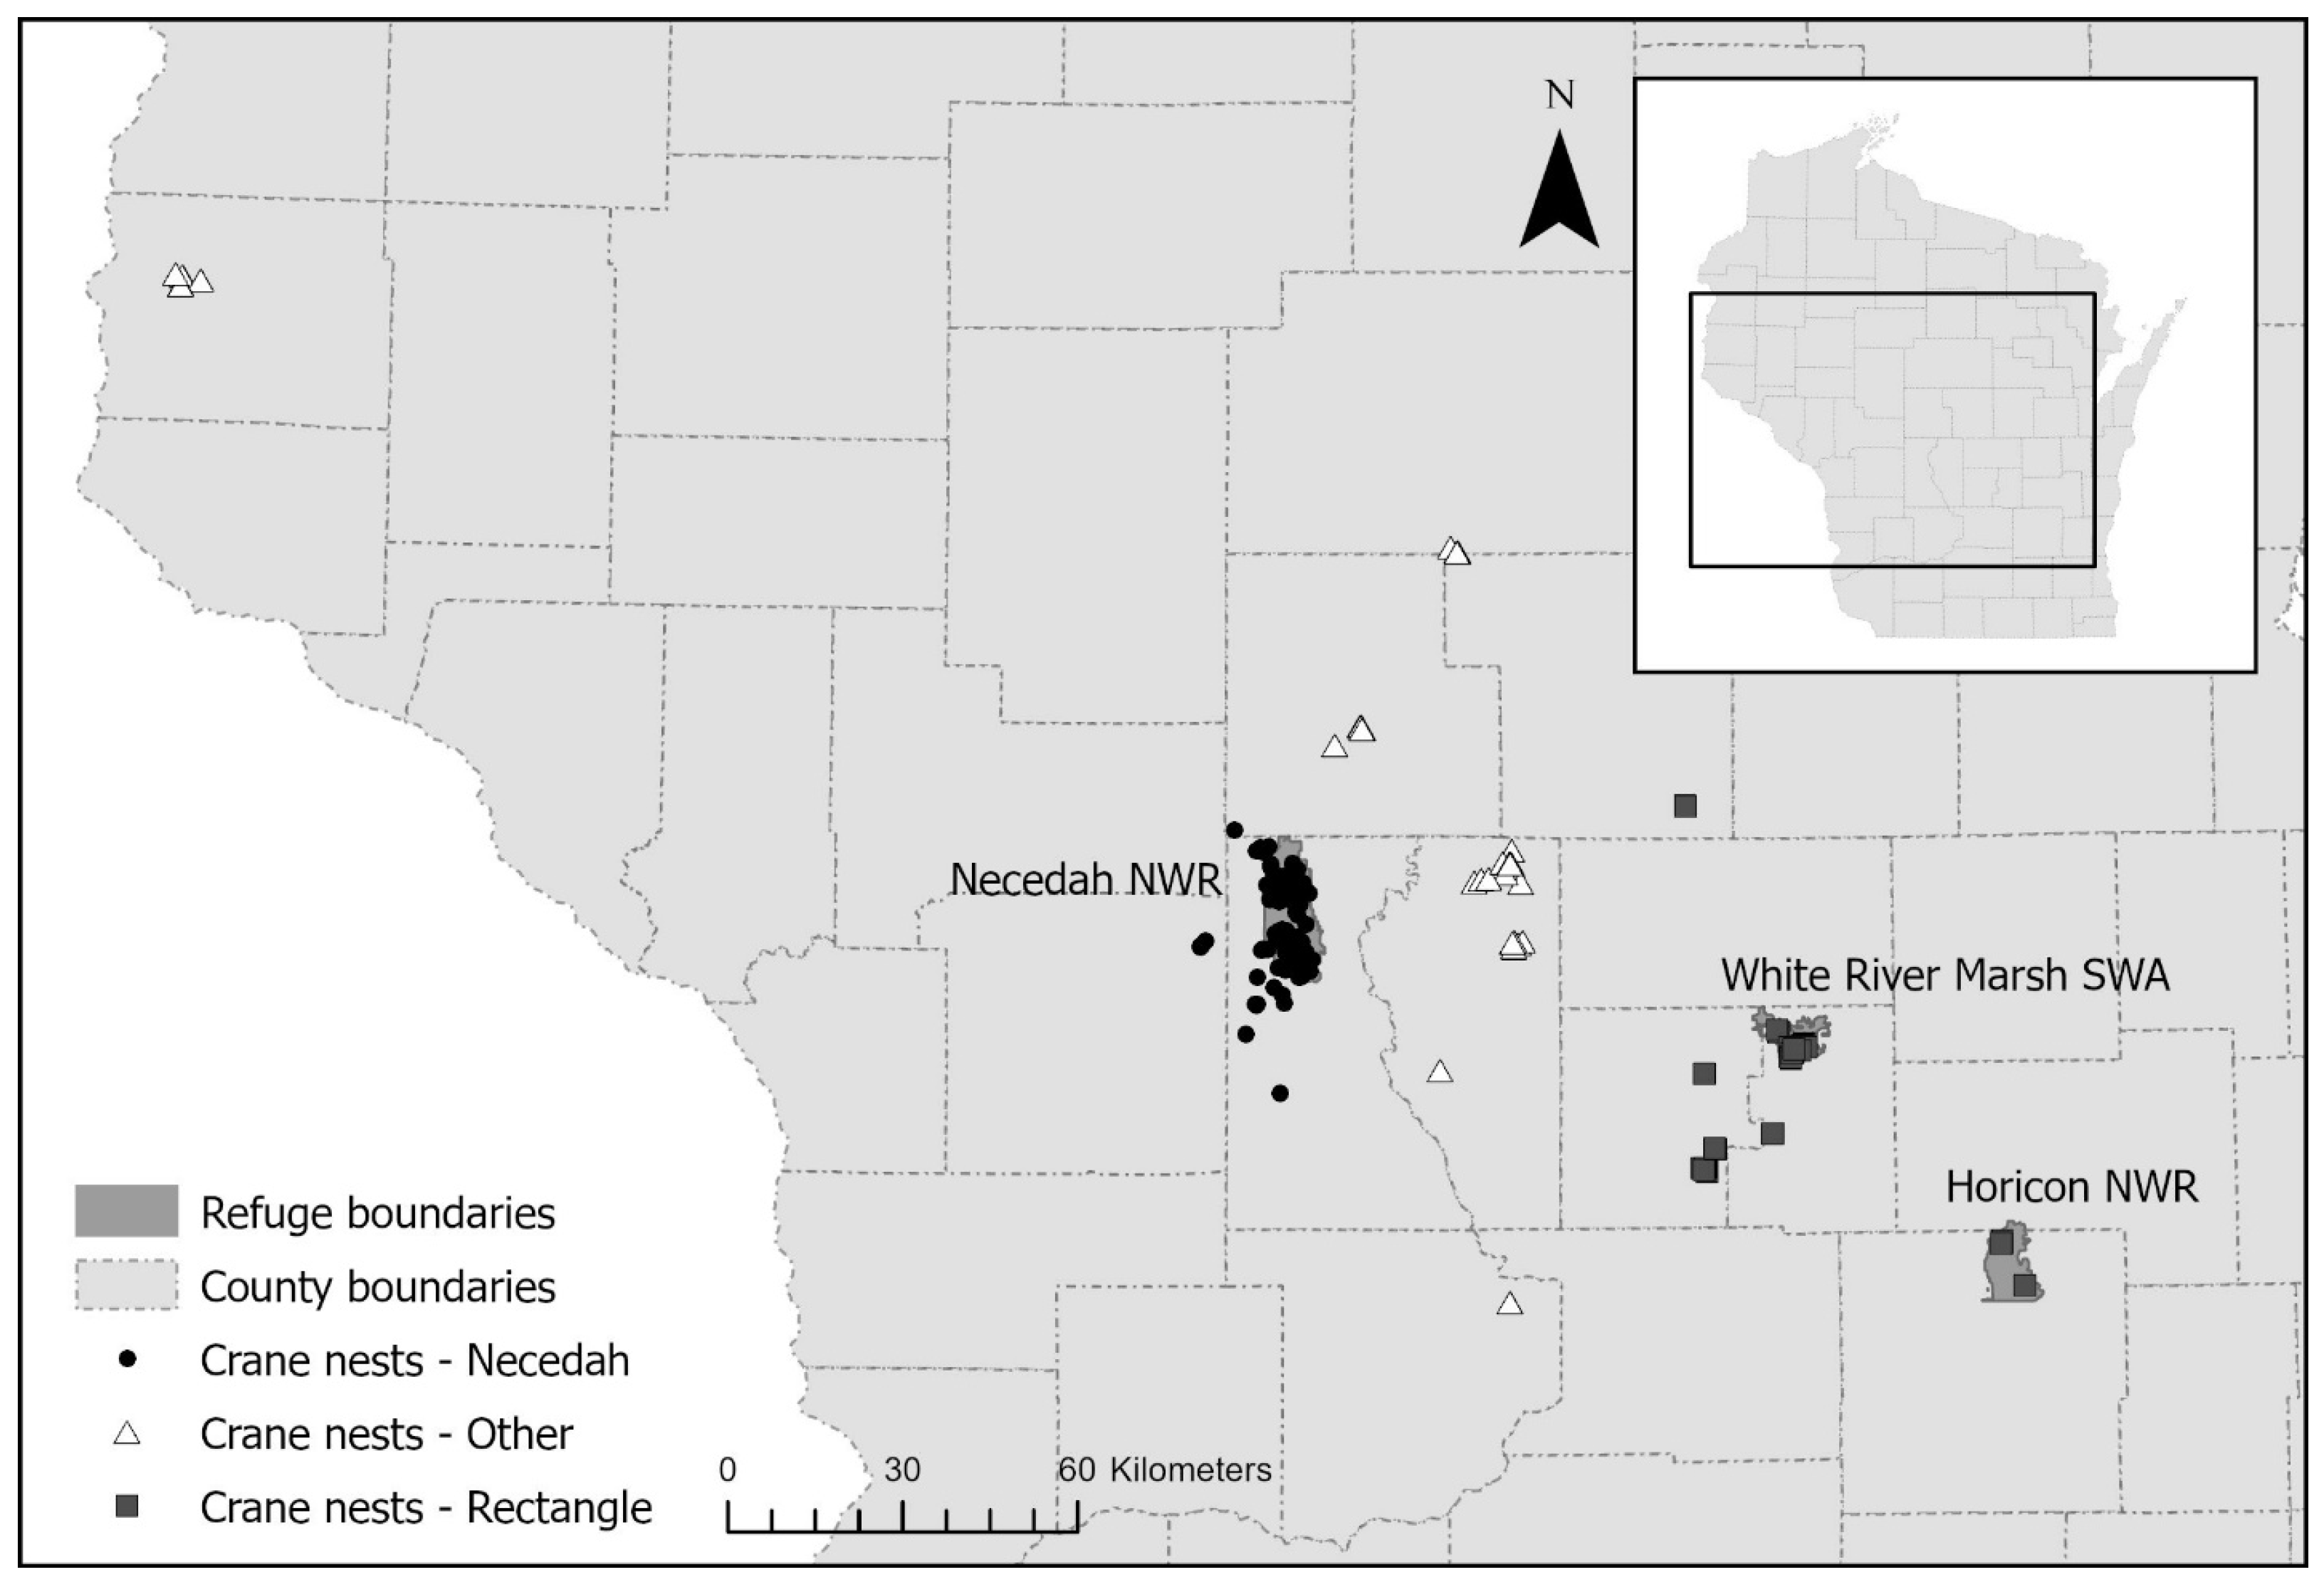
2.1. Study Area
2.2. Reintroduction Techniques and Long-Term Monitoring
2.3. Data Analysis
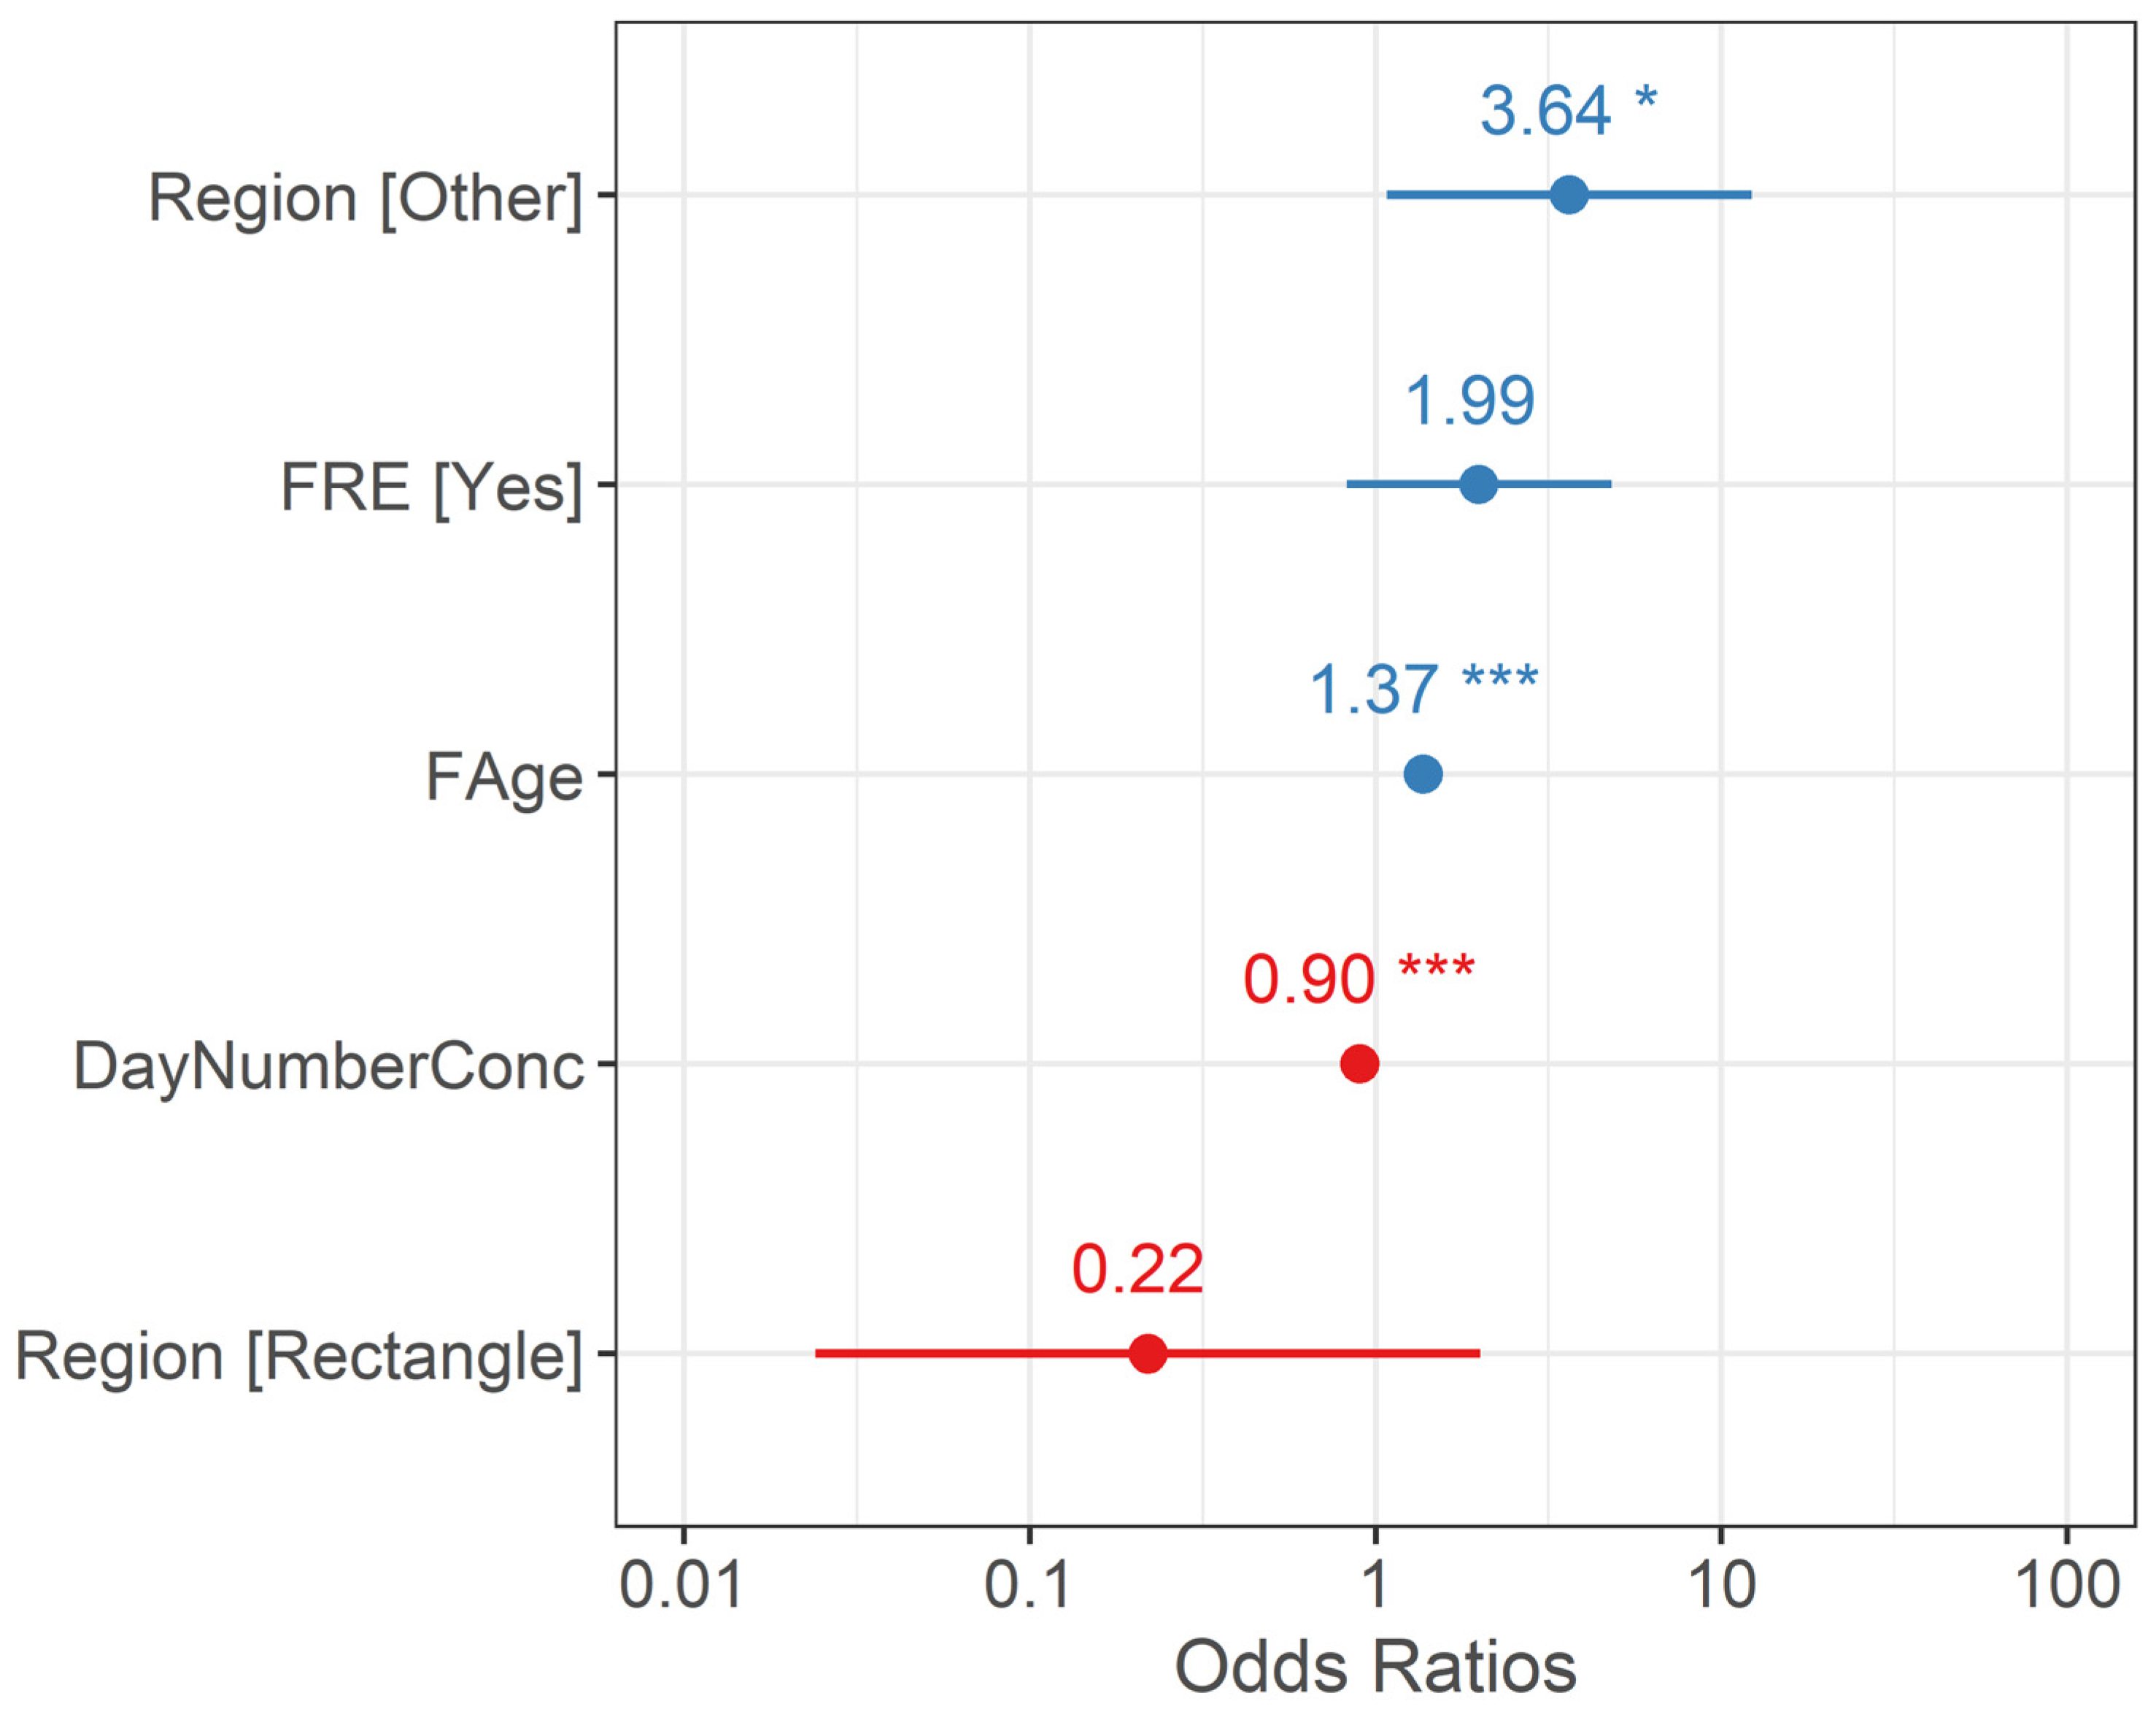
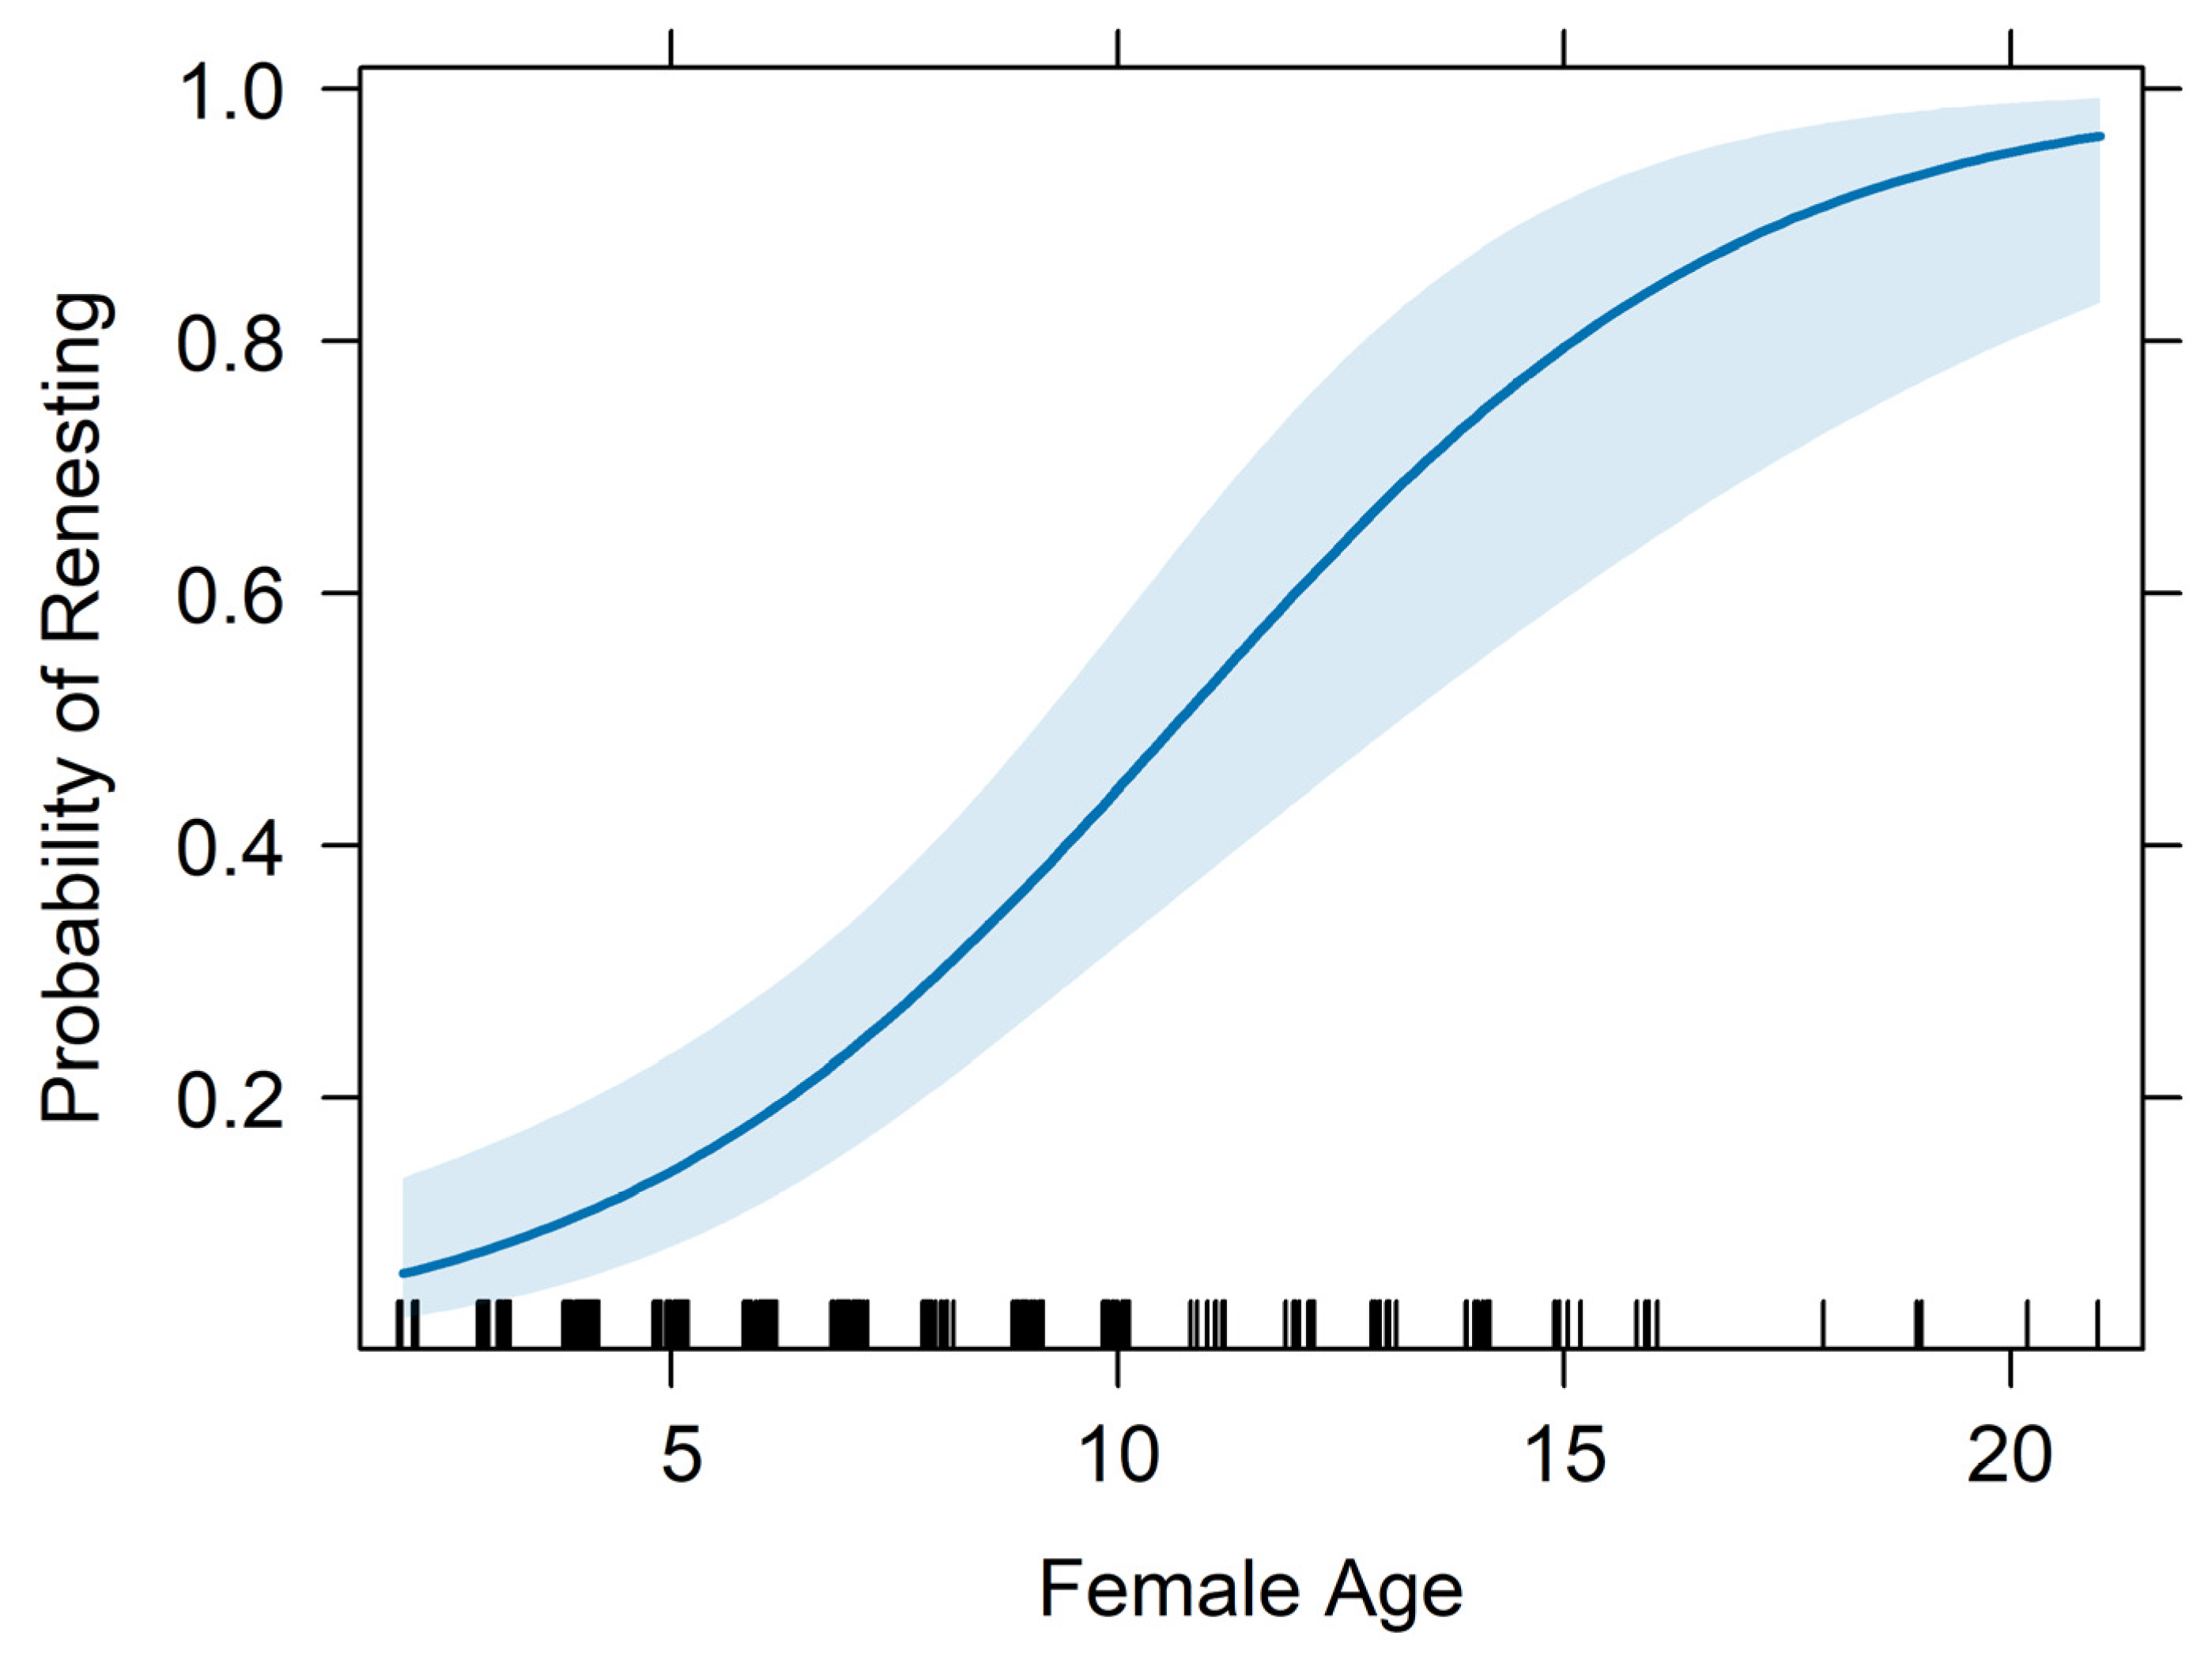
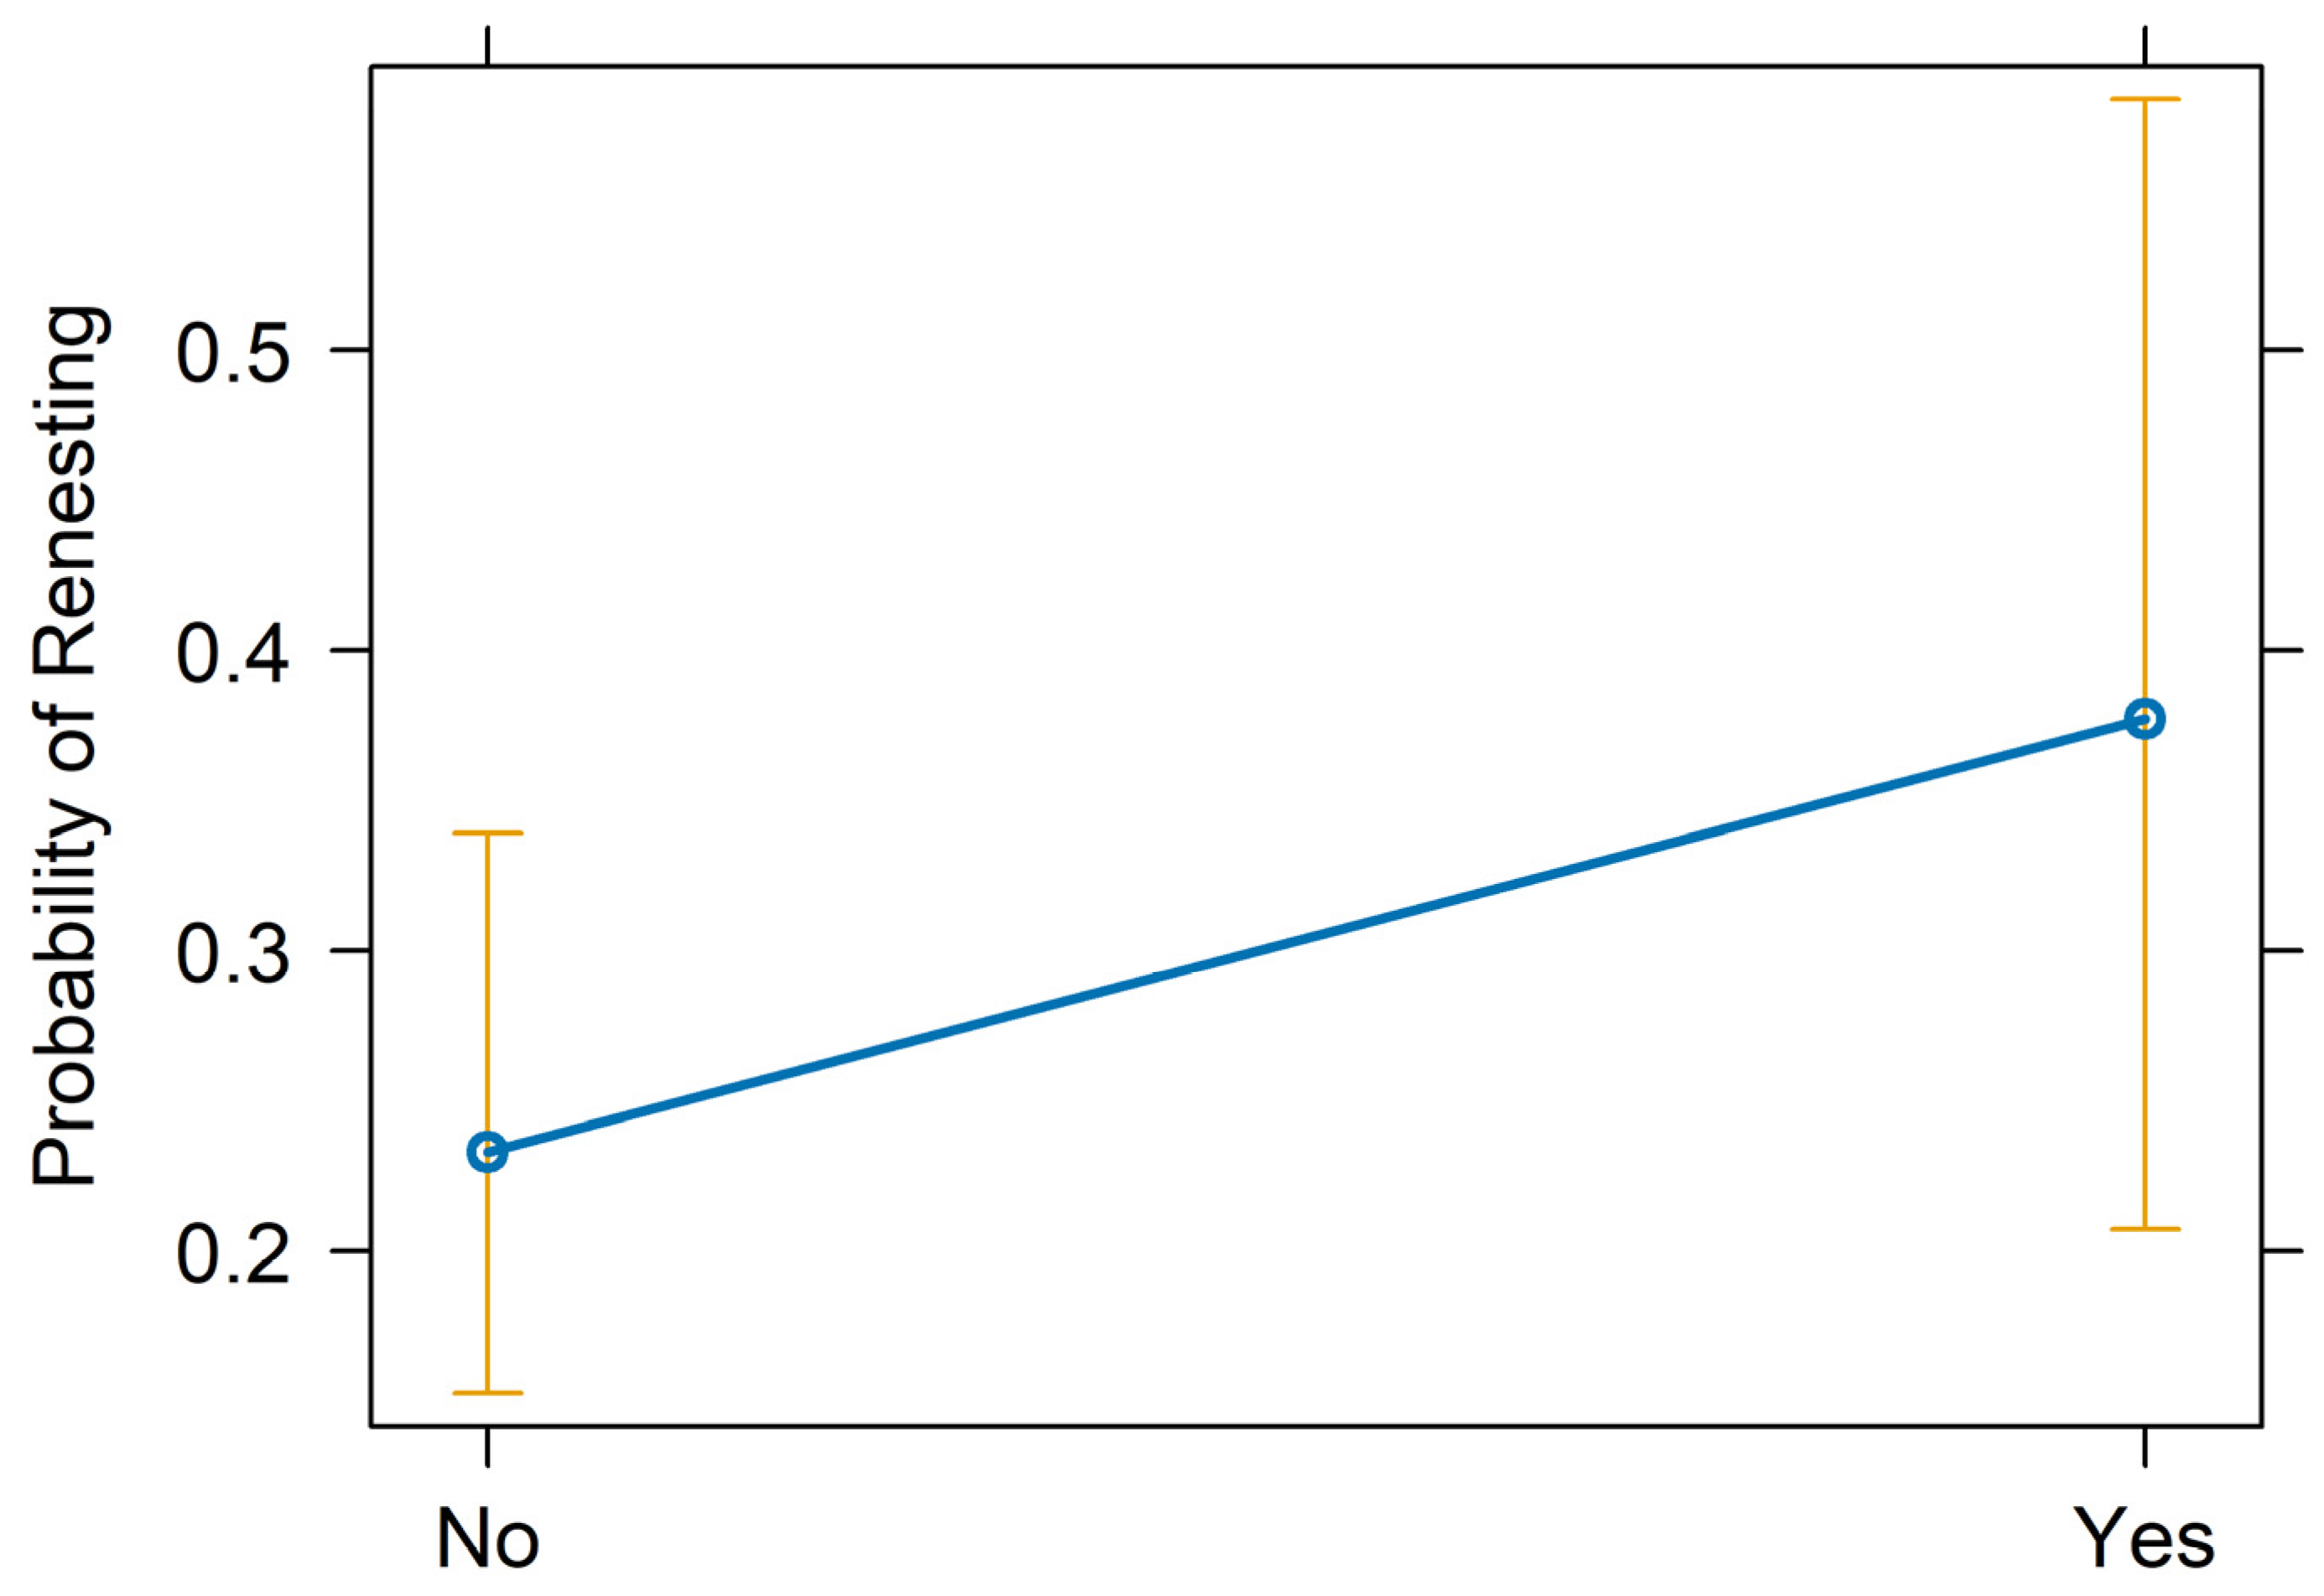
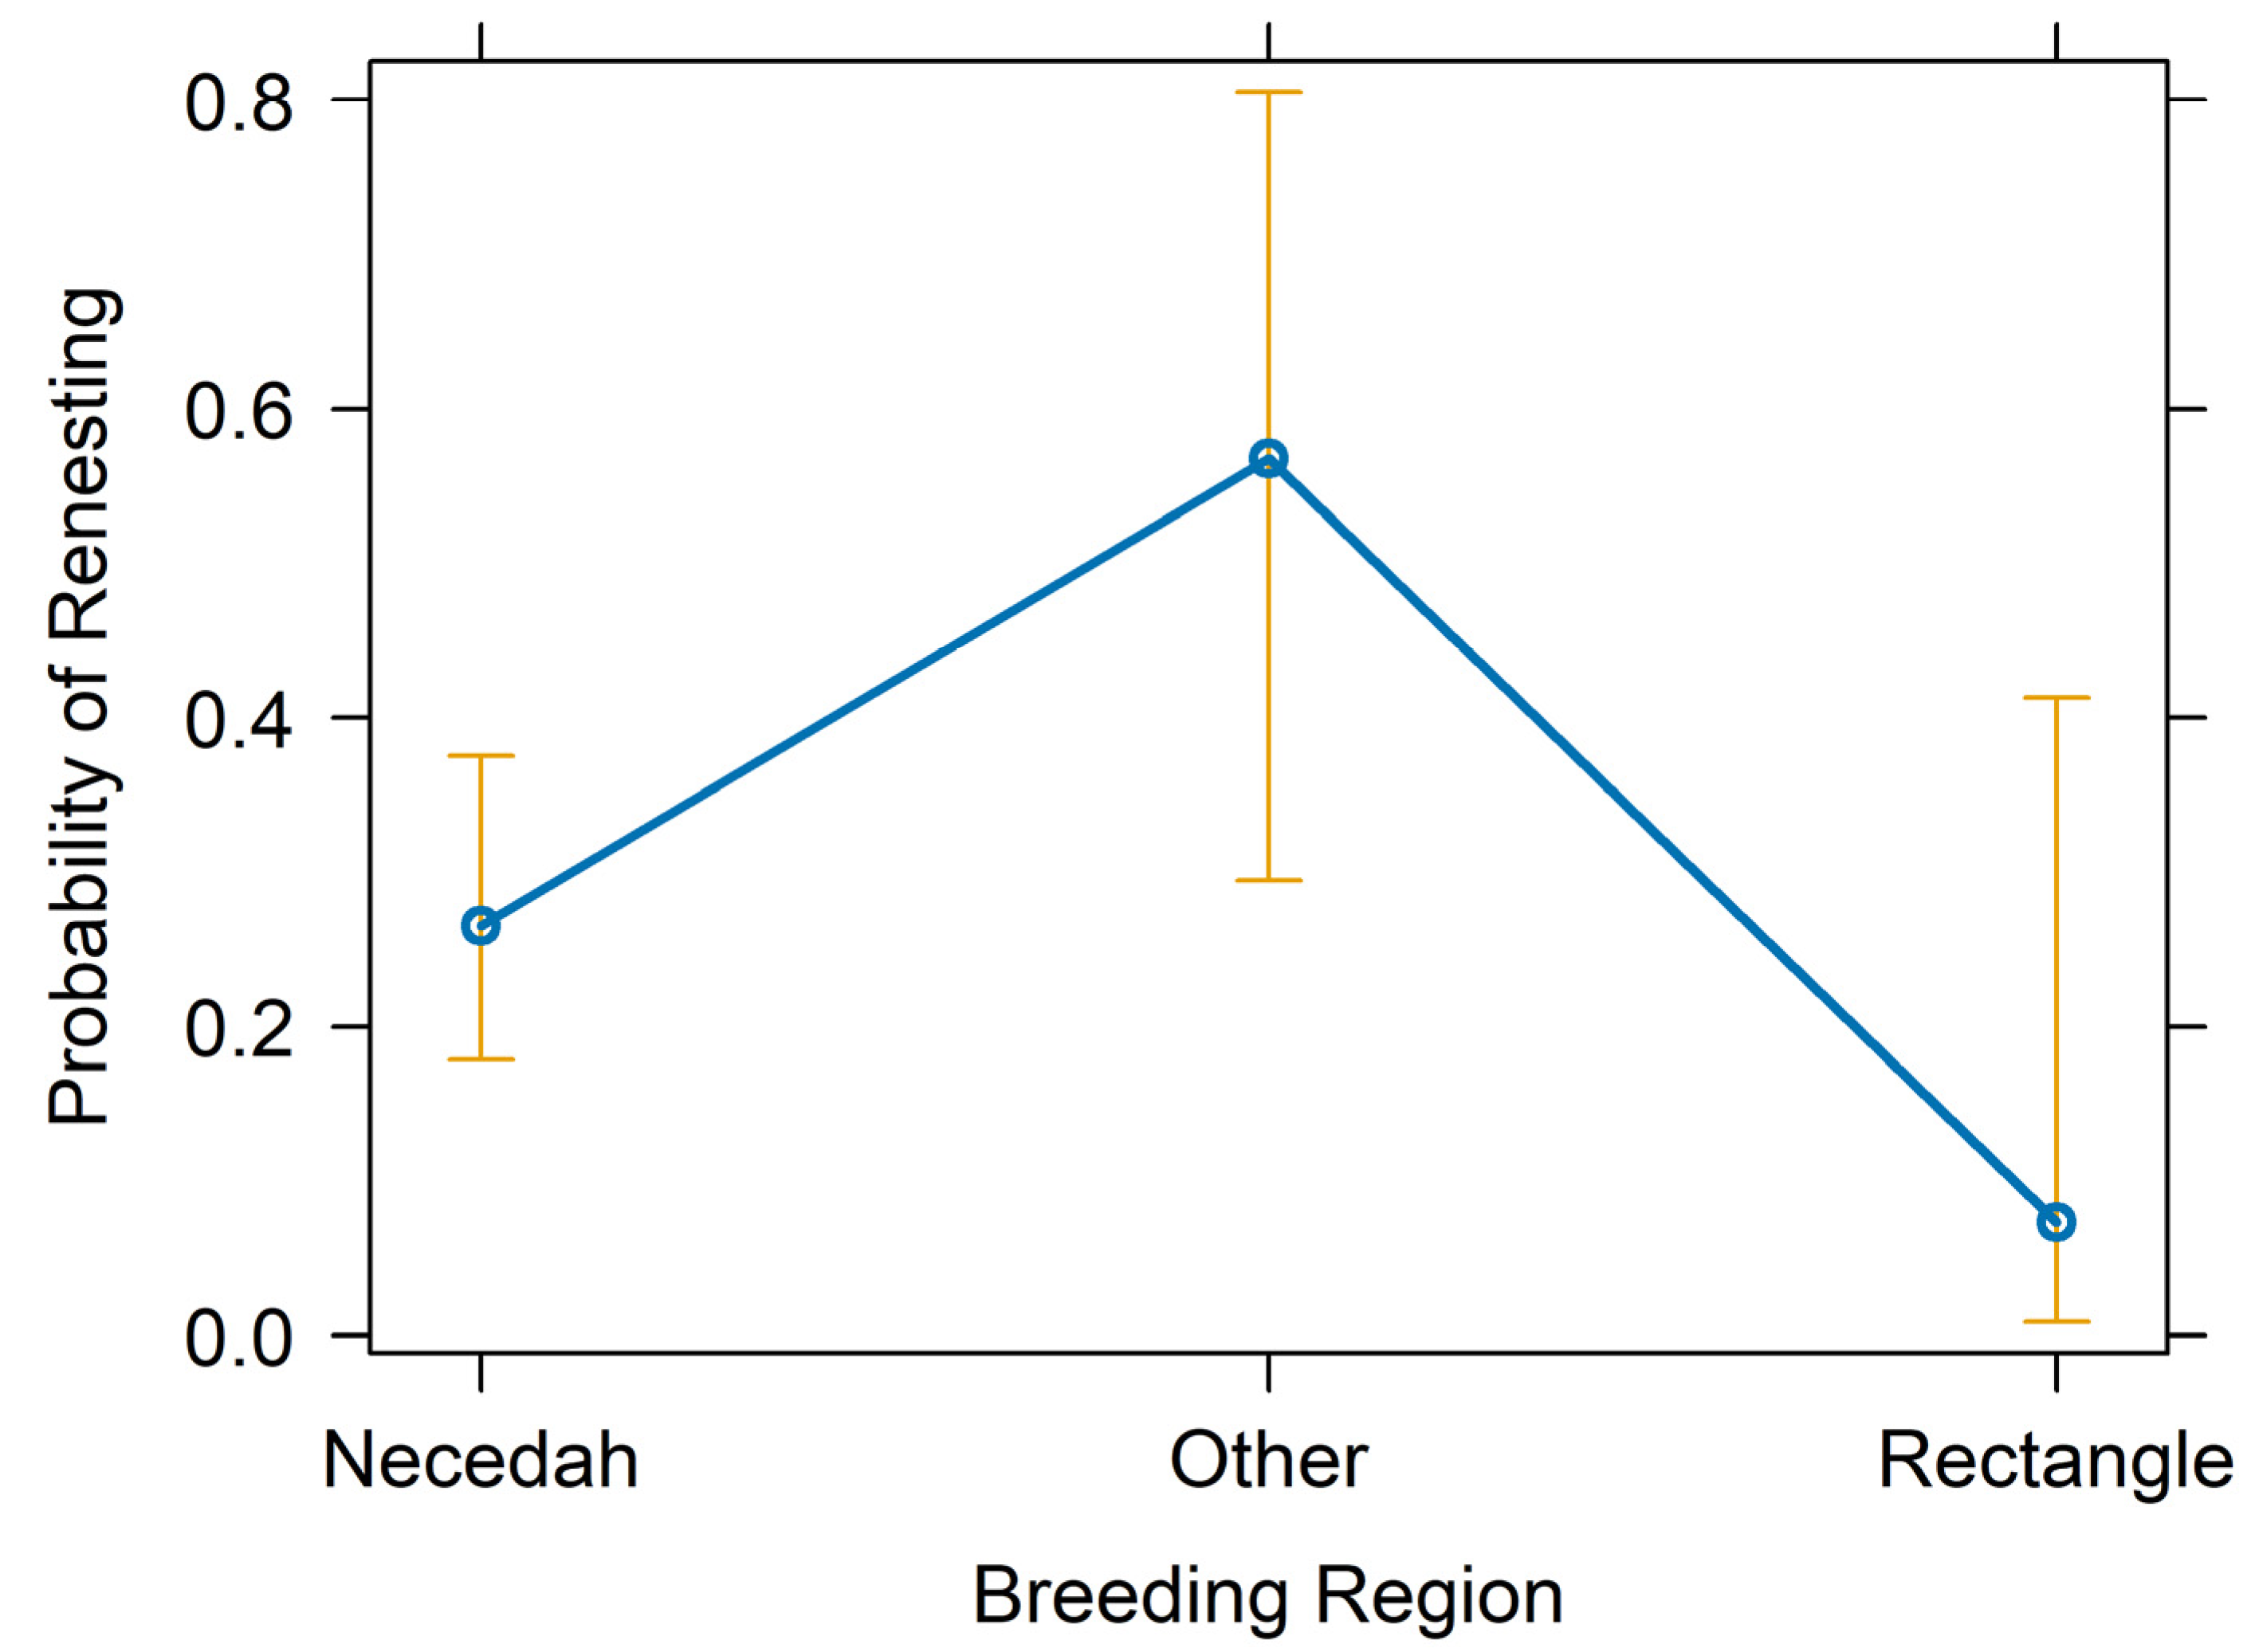
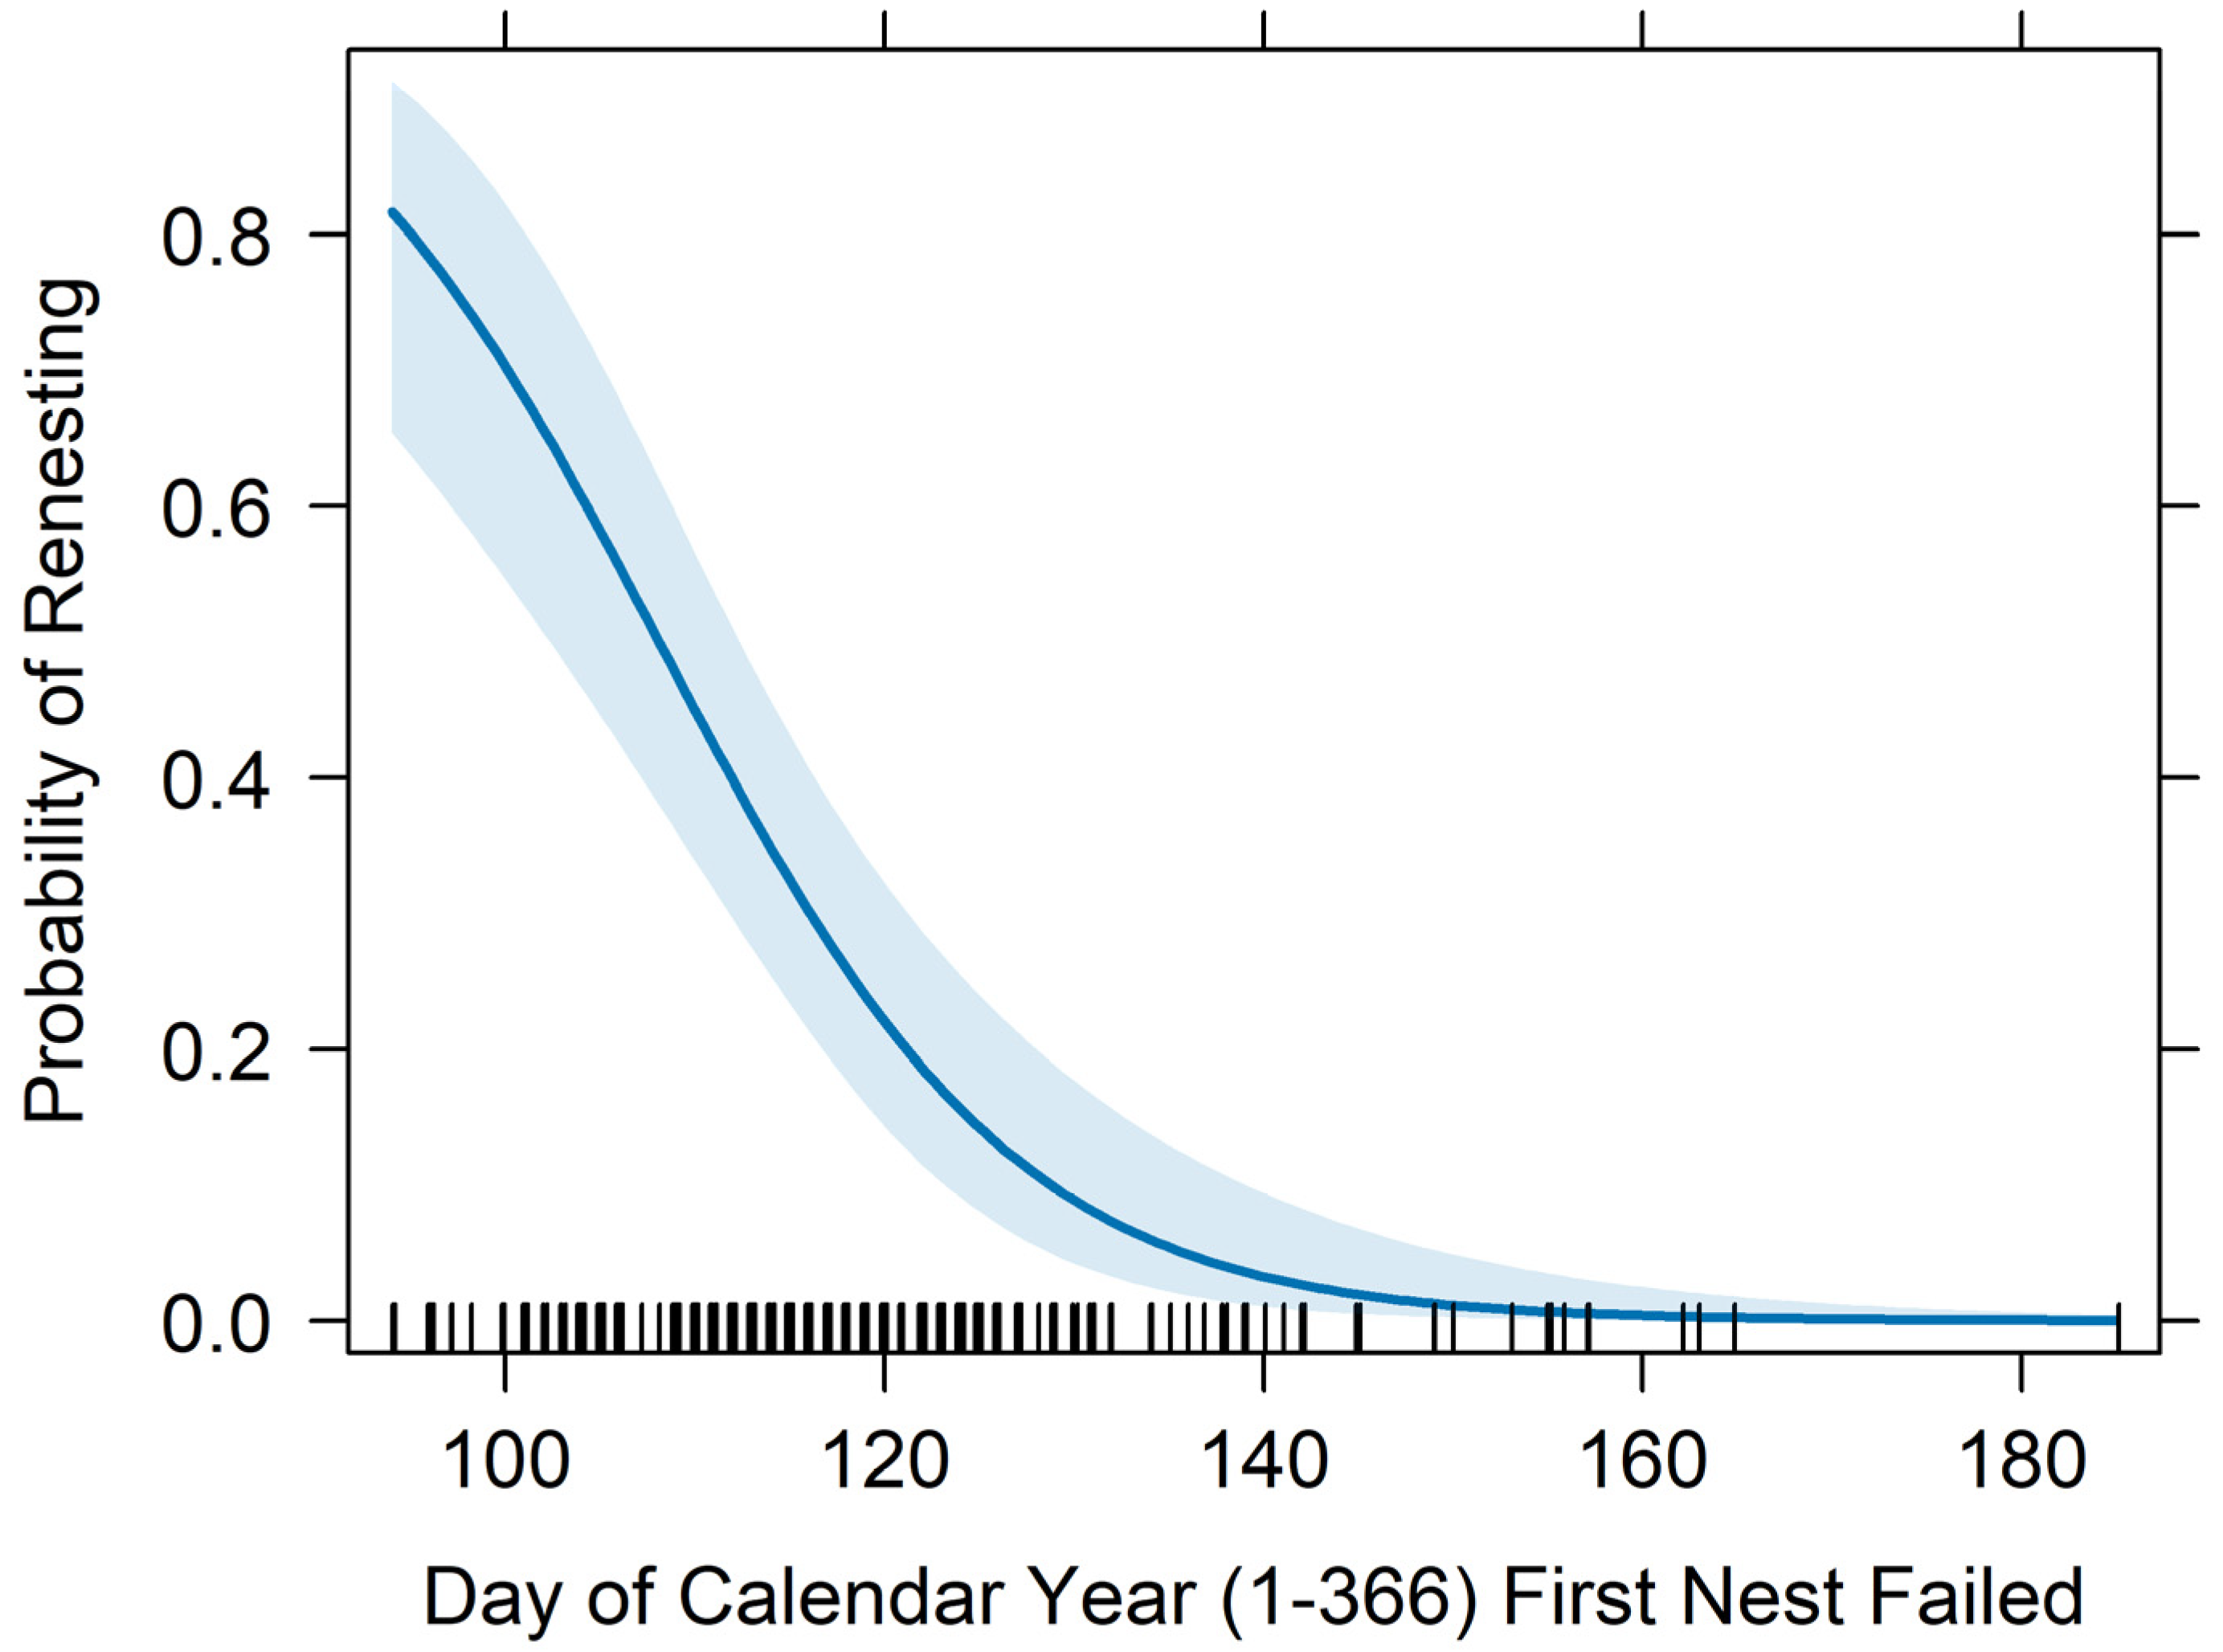
3. Results
4. Discussion
5. Conclusions
Author Contributions
Funding
Institutional Review Board Statement
Informed Consent Statement
Data Availability Statement
Acknowledgments
Conflicts of Interest
Appendix A

| Bivariate Predictor | Theme | Int. | B | Link | df | Log Lik. | AICc | Delta | Weight |
|---|---|---|---|---|---|---|---|---|---|
| Nest Fail Dt. | Chronology | 7.89 | −9.01 | cloglog | 2 | −138.5 | 281.1 | 0.0 | 0.996 |
| Female Age | Parental Age | −2.66 | 2.34 | logit | 2 | −144.1 | 292.3 | 11.2 | 0.004 |
| Yrs. Nest Female | Parental Exp. | −1.58 | 1.43 | logit | 2 | −145.9 | 295.8 | 14.7 | 0.001 |
| Years Nesting Total | Parental Exp. | −1.67 | 1.45 | logit | 2 | −148.3 | 300.7 | 19.6 | 0.000 |
| Total Age | Parental Age | −2.71 | 2.33 | logit | 2 | −149.1 | 302.3 | 21.2 | 0.000 |
| Forced Renest-Yes | Nest Mgmt. | −0.98 | 2.34 | logit | 2 | −154.2 | 312.5 | 31.4 | 0.000 |
| Nest Initiate Dt. | Chronology | 6.09 | −7.01 | cloglog | 2 | −155.8 | 315.7 | 34.6 | 0.000 |
| Yrs. Nest Together | Parental Exp. | −1.20 | 0.99 | logit | 2 | −156.8 | 317.5 | 36.4 | 0.000 |
| Duration Nested | Chronology | 0.04 | −1.81 | cloglog | 2 | −156.8 | 317.7 | 36.6 | 0.000 |
| Yrs. Nest Male | Parental Exp. | −1.26 | 0.98 | logit | 2 | −157.9 | 319.9 | 38.8 | 0.000 |
| Male Age | Parental Age | −1.79 | 1.38 | logit | 2 | −161.2 | 326.4 | 45.3 | 0.000 |
| Region | Geography | −0.37 | + | logit | 3 | −164.9 | 335.8 | 54.7 | 0.000 |
| Year | Chronology | −125.70 | 0.06 | logit | 2 | −169.1 | 342.2 | 61.7 | 0.000 |
| Part. Clutch Col.-Yes | Nest Mgmt. | −0.49 | −1.46 | logit | 2 | −170.5 | 345.0 | 63.9 | 0.000 |
| null | - | −0.52 | - | logit | 1 | −171.7 | 345.5 | 64.4 | 0.000 |
| Location | Geography | −0.41 | + | logit | 15 | −158.5 | 349.0 | 67.9 | 0.000 |
Appendix B
| Model ID | Int. | Black Flies | Female Age | Forced Renest-Y | Region | Male Age | Total Age | Nest Fail Dt. | Part. Clutch Col.-Y | Yrs Nest Tog. | Nest Initiate Dt. | Duration Nested | Yrs. Nest Female | Yrs. Nest Tot. | Yrs. Nest Male | Class | df | Log Lik. | AICc | Delta | Weight |
|---|---|---|---|---|---|---|---|---|---|---|---|---|---|---|---|---|---|---|---|---|---|
| g33 | 8.96 | 2.65 | 0.69 | + | −12.62 | GLMM | 7 | −108.0 | 230.5 | 0.00 | 0.504 | ||||||||||
| g60 | 9.52 | 0.99 | + | −12.13 | 1.67 | GLMM | 7 | −109.1 | 232.7 | 2.17 | 0.170 | ||||||||||
| g23 | 9.06 | 2.60 | 0.52 | −12.58 | GLMM | 5 | −111.7 | 233.7 | 3.24 | 0.100 | |||||||||||
| g58 | 9.66 | 0.86 | + | −11.95 | 1.45 | GLMM | 7 | −110.0 | 234.5 | 4.04 | 0.067 | ||||||||||
| g28 | 8.07 | 0.93 | + | 2.86 | −12.05 | GLMM | 7 | −110.2 | 234.7 | 4.26 | 0.060 | ||||||||||
| g61 | 9.54 | 0.83 | −12.07 | 1.67 | GLMM | 5 | −112.5 | 235.3 | 4.82 | 0.045 | |||||||||||
| g59 | 9.80 | 0.73 | −12.08 | 1.47 | GLMM | 5 | −113.5 | 237.2 | 6.76 | 0.017 | |||||||||||
| g10 | 8.36 | 2.67 | 0.47 | −12.24 | GLMM | 7 | −111.4 | 237.3 | 6.77 | 0.017 | |||||||||||
| g29 | 8.09 | 0.74 | 2.79 | −11.88 | GLMM | 5 | −113.7 | 237.7 | 7.19 | 0.014 | |||||||||||
| g27 | 7.21 | + | 0.65 | 2.92 | −11.54 | GLMM | 7 | −113.0 | 240.5 | 10.02 | 0.003 | ||||||||||
| g62 | 9.58 | 1.31 | + | −11.83 | 1.19 | GLMM | 7 | −113.3 | 241.1 | 10.66 | 0.002 | ||||||||||
| g63 | 9.60 | 1.15 | −11.80 | 1.20 | GLMM | 5 | −117.0 | 244.2 | 13.77 | 0.001 | |||||||||||
| g31 | 9.17 | 1.28 | + | −11.09 | 1.00 | GLMM | 7 | −115.6 | 245.7 | 15.18 | 0.000 | ||||||||||
| g32 | 9.45 | 1.19 | −11.40 | 0.99 | GLMM | 5 | −119.8 | 249.9 | 19.37 | 0.000 | |||||||||||
| g25 | 8.71 | 1.23 | + | 1.53 | −11.41 | GLMM | 7 | −118.1 | 250.7 | 20.25 | 0.000 | ||||||||||
| g26 | 8.78 | 1.09 | 1.56 | −11.46 | GLMM | 5 | −121.7 | 253.5 | 23.07 | 0.000 | |||||||||||
| g30 | 9.07 | + | 1.16 | −11.28 | 1.01 | GLMM | 7 | −119.7 | 253.8 | 23.32 | 0.000 | ||||||||||
| g35 | 5.58 | 2.35 | 1.01 | + | −8.70 | GLMM | 7 | −120.2 | 254.8 | 24.27 | 0.000 | ||||||||||
| g41 | 5.45 | 1.06 | + | 2.77 | −9.10 | GLMM | 7 | −120.4 | 255.2 | 24.74 | 0.000 | ||||||||||
| g47 | −2.04 | 2.41 | 1.16 | + | −2.45 | GLMM | 7 | −120.6 | 255.6 | 25.14 | 0.000 | ||||||||||
| g24 | 8.34 | + | 1.05 | 1.64 | −11.27 | GLMM | 7 | −121.4 | 257.2 | 26.73 | 0.000 | ||||||||||
| g42 | 5.25 | 1.06 | 2.94 | −9.04 | GLMM | 5 | −123.5 | 257.2 | 26.77 | 0.000 | |||||||||||
| g36 | 5.31 | 2.45 | 0.91 | −8.54 | GLMM | 5 | −124.0 | 258.3 | 27.82 | 0.000 | |||||||||||
| g48 | −1.99 | 2.36 | 1.01 | −2.28 | GLMM | 5 | −124.6 | 259.4 | 28.91 | 0.000 | |||||||||||
| g40 | 4.38 | + | 0.94 | 3.08 | −8.90 | GLMM | 7 | −122.8 | 260.0 | 29.54 | 0.000 | ||||||||||
| g53 | −2.61 | 1.46 | + | 2.70 | −2.19 | GLMM | 7 | −123.2 | 260.8 | 30.28 | 0.000 | ||||||||||
| g34 | 4.75 | + | 2.53 | 0.84 | −8.40 | GLMM | 7 | −123.7 | 261.8 | 31.36 | 0.000 | ||||||||||
| g46 | −2.31 | + | 2.44 | 0.94 | −2.32 | GLMM | 7 | −123.8 | 262.0 | 31.49 | 0.000 | ||||||||||
| g54 | −2.52 | 1.27 | 2.62 | −1.98 | GLMM | 5 | −126.9 | 264.0 | 33.51 | 0.000 | |||||||||||
| g52 | −3.02 | + | 1.18 | 2.74 | −2.02 | GLMM | 7 | −125.9 | 266.2 | 35.73 | 0.000 | ||||||||||
| g56 | −0.65 | 1.64 | + | 1.00 | −2.21 | GLMM | 7 | −126.1 | 266.7 | 36.20 | 0.000 | ||||||||||
| g44 | 6.01 | 1.50 | + | 0.96 | −7.65 | GLMM | 7 | −126.2 | 266.8 | 36.30 | 0.000 | ||||||||||
| g38 | 6.42 | 1.44 | + | 1.60 | −8.94 | GLMM | 7 | −127.8 | 270.1 | 39.64 | 0.000 | ||||||||||
| g57 | −0.68 | 1.57 | 1.00 | −2.19 | GLMM | 5 | −130.4 | 271.1 | 40.58 | 0.000 | |||||||||||
| g2 | −2.95 | 2.21 | 1.34 | + | GLMM | 6 | −130.3 | 272.9 | 42.42 | 0.000 | |||||||||||
| g39 | 6.10 | 1.41 | 1.80 | −8.86 | GLMM | 5 | −131.6 | 273.4 | 42.95 | 0.000 | |||||||||||
| g45 | 5.50 | 1.54 | 0.97 | −7.27 | GLMM | 5 | −131.9 | 274.0 | 43.56 | 0.000 | |||||||||||
| g55 | −0.90 | + | 1.54 | 1.04 | −2.23 | GLMM | 7 | −129.9 | 274.3 | 43.78 | 0.000 | ||||||||||
| g12 | −3.06 | 2.81 | + | −3.09 | GLMM | 6 | −131.3 | 274.9 | 44.38 | 0.000 | |||||||||||
| g8 | −3.54 | 1.59 | + | 2.66 | GLMM | 6 | −131.3 | 274.9 | 44.45 | 0.000 | |||||||||||
| g3 | −3.03 | 2.29 | 1.24 | GLMM | 4 | −133.7 | 275.5 | 44.98 | 0.000 | ||||||||||||
| g9 | −3.59 | 1.47 | 2.75 | GLMM | 4 | −134.1 | 276.3 | 45.81 | 0.000 | ||||||||||||
| g13 | −3.19 | 2.90 | −3.01 | GLMM | 4 | −134.2 | 276.6 | 46.14 | 0.000 | ||||||||||||
| g37 | 5.66 | + | 1.35 | 1.86 | −8.78 | GLMM | 7 | −131.4 | 277.2 | 46.73 | 0.000 | ||||||||||
| g50 | −1.33 | 1.70 | + | 1.30 | −1.99 | GLMM | 7 | −131.6 | 277.6 | 47.12 | 0.000 | ||||||||||
| g43 | 5.18 | + | 1.51 | 1.00 | −7.22 | GLMM | 7 | −131.8 | 278.0 | 47.54 | 0.000 | ||||||||||
| g1 | −3.41 | + | 2.36 | 1.18 | GLMM | 6 | −133.2 | 278.8 | 48.28 | 0.000 | |||||||||||
| g7 | −4.26 | + | 1.36 | 2.86 | GLMM | 6 | −133.3 | 278.9 | 48.44 | 0.000 | |||||||||||
| g11 | −3.39 | + | 2.96 | −2.98 | GLMM | 6 | −133.8 | 279.9 | 49.45 | 0.000 | |||||||||||
| g51 | −1.41 | 1.58 | 1.37 | −1.88 | GLMM | 5 | −135.3 | 280.8 | 50.34 | 0.000 | |||||||||||
| g21 | −1.61 | 1.78 | + | 0.97 | GLMM | 6 | −134.6 | 281.6 | 51.15 | 0.000 | |||||||||||
| g19 | −3.65 | 3.27 | −2.65 | GLMM | 4 | −137.4 | 282.9 | 52.42 | 0.000 | ||||||||||||
| g18 | −3.46 | + | 3.10 | −2.69 | GLMM | 6 | −135.3 | 283.0 | 52.47 | 0.000 | |||||||||||
| g49 | −1.66 | + | 1.54 | 1.44 | −1.91 | GLMM | 7 | −134.8 | 284.1 | 53.57 | 0.000 | ||||||||||
| g17 | −4.27 | + | 3.35 | −2.41 | GLMM | 6 | −136.5 | 285.4 | 54.92 | 0.000 | |||||||||||
| g22 | −1.73 | 1.80 | 0.99 | GLMM | 4 | −139.6 | 287.4 | 56.95 | 0.000 | ||||||||||||
| g5 | −2.27 | 1.82 | + | 1.35 | GLMM | 6 | −139.3 | 290.9 | 60.38 | 0.000 | |||||||||||
| g20 | −2.07 | + | 1.76 | 1.02 | GLMM | 6 | −139.4 | 291.1 | 60.60 | 0.000 | |||||||||||
| g6 | −2.49 | 1.79 | 1.54 | GLMM | 4 | −142.6 | 293.4 | 62.96 | 0.000 | ||||||||||||
| g4 | −2.89 | + | 1.73 | 1.61 | GLMM | 6 | −142.3 | 297.0 | 66.51 | 0.000 | |||||||||||
| g15 | −1.85 | + | 1.47 | −2.07 | GLMM | 6 | −148.4 | 309.0 | 78.56 | 0.000 | |||||||||||
| g16 | −2.23 | 1.78 | −2.06 | GLMM | 4 | −152.0 | 312.1 | 81.66 | 0.000 | ||||||||||||
| g14 | −2.76 | + | 1.85 | −1.79 | GLMM | 6 | −151.6 | 315.5 | 85.03 | 0.000 | |||||||||||
| nullMM | −0.67 | GLMM | 2 | −165.0 | 334.0 1 | 03.48 | 0.000 | ||||||||||||||
| null | −0.52 | GLM | 1 | −171.7 | 345.5 1 | 15.03 | 0.000 |
References
- Canadian Wildlife Service [CWS]; U.S. Fish and Wildlife Service [USFWS]. International Recovery Plan for the Whooping Crane; Recovery of Nationally Endangered Wildlife (RENEW): Ottawa, ON, Canada; U.S. Fish and Wildlife Service: Albuquerque, NM, USA, 2007. [Google Scholar]
- U.S. Fish and Wildlife Service [USFWS]. Endangered Species List. Fed. Regist. 1967, 22, 4001–4002. [Google Scholar]
- U.S. Fish and Wildlife Service [USFWS]. Endangered Species Act of 1973, as Amended Through the 108th Congress; U.S. Department of the Interior: Washington, DC, USA; U.S. Fish and Wildlife Service: Washington, DC, USA, 1973; 44p. [Google Scholar]
- Thompson, H.L.; Gordon, N.M.; Bolt, D.P.; Lee, J.R.; Szyszkoski, E.K. Twenty-year status of the eastern migratory whooping crane reintroduction. Proc. N. Am. Crane Workshop 2022, 15, 34–52. [Google Scholar]
- Thompson, H.L. EMP Field Team Annual Report 2023; International Crane Foundation: Baraboo, WI, USA, 2024; Available online: https://savingcranes.org/whooping-crane-reintroduction-annual-reports/ (accessed on 6 April 2024).
- U.S. Fish and Wildlife Service [USFWS]. Whooping Crane Recovery Activities: 2022 Breeding Season to 2023 Spring Migration. 2024. Available online: https://www.fws.gov/media/whooping-crane-recovery-activities-2022-breeding-season-2023-spring-migration (accessed on 6 April 2024).
- Szyszkoski, E.K.; Zimorski, S.E.; Thompson, H.L. Thirteen-year status of the Louisiana nonmigratory whooping crane reintroduction. Proc. N. Am. Crane Workshop 2025, 16, 133–145. [Google Scholar]
- Urbanek, R.P.; Zimorski, S.E.; Fasoli, A.M.; Szyszkoski, E.K. Nest desertion in a reintroduced population of migratory whooping cranes. Proc. N. Am. Crane Workshop 2010, 11, 133–141. [Google Scholar]
- Barzen, J.A.; Converse, S.J.; Adler, P.H.; Lacy, A.; Gray, E.; Gossens, A. Examination of multiple working hypotheses to address reproductive failure in reintroduced whooping cranes. Condor Ornithol. Appl. 2018, 120, 632–649. [Google Scholar] [CrossRef]
- Van Schmidt, N.D.; Barzen, J.A.; Engels, M.J.; Lacy, A.E. Refining reintroduction of whooping cranes with habitat use and suitability analysis. J. Wildl. Manag. 2014, 78, 1404–1414. [Google Scholar] [CrossRef]
- Adler, P.H.; Barzen, J.; Gray, E.; Lacy, A.; Urbanek, R.P.; Converse, S.J. The dilemma of pest suppression in the conservation of endangered species. Conserv. Biol. 2019, 33, 788–796. [Google Scholar] [CrossRef]
- Jaworski, J.A. Factors Influencing Nest Success of Reintroduced Whooping Cranes (Grus americana) in Wisconsin. Master’s Thesis, University of Wisconsin, Stevens Point, WI, USA, 2016. [Google Scholar]
- Amat, J.A.; Fraga, R.M.; Arroyo, G.M. Replacement clutches by Kentish Plovers. Condor Ornithol. Appl. 1999, 101, 746–751. [Google Scholar] [CrossRef]
- Arnold, T.W.; Devries, J.H.; Howerter, D.W. Factors that affect renesting in Mallards (Anas platyrhynchos). Auk 2010, 127, 212–221. [Google Scholar] [CrossRef]
- McNew, L.B.; Gregory, A.J.; Wisely, S.M.; Sandercock, B.K. Reproductive biology of a southern population of Greater Prairie-Chickens. In Ecology, Conservation, and Management of Grouse; Studies in Avian Biology; Sandercock, B.K., Martin, L., Segelbacher, G., Eds.; University of California Press: Berkeley, CA, USA, 2011; Volume 39, pp. 209–221. [Google Scholar]
- Gates, H.R.; Lanctot, R.B.; Powell, A.N. High renesting rates in arctic-breeding Dunlin (Calidris alpina): A clutch-removal experiment. Auk 2013, 130, 372–380. [Google Scholar] [CrossRef]
- Claassen, A.H.; Arnold, T.W.; Roche, E.A.; Saunders, S.P.; Cuthbert, F.J. Factors influencing nest survival and renesting by Piping Plovers in the Great Lakes region. Condor Ornithol. Appl. 2014, 116, 394–407. [Google Scholar] [CrossRef]
- Swift, R.J.; Anteau, M.J.; Ring, M.M.; Toy, D.L.; Sherfy, M.H. Low renesting propensity and reproductive success make renesting unproductive for threatened Piping Plover (Charadrius melodus). Condor Ornithol. Appl. 2020, 122, duz066. [Google Scholar] [CrossRef]
- Martin, K.; Wilson, S.; Hannon, S.J. Mechanisms underlying variation in renesting ability of Willow Ptarmigan. In Ecology, Conservation, and Management of Grouse; Studies in Avian Biology; Sandercock, B.K., Martin, K., Segelbacher, G., Eds.; University of California Press: Berkeley, CA, USA, 2011; Volume 39, pp. 233–246. [Google Scholar]
- U.S. Fish and Wildlife Service [USFWS]. Necedah National Wildlife Refuges Comprehensive Conservation Plan and Environmental Assessment; U.S. Fish and Wildlife Service: Necedah, WI, USA, 2004. [Google Scholar]
- Wisoconsin Department of Natural Resources [WDNR]. White River Marsh Wildlife Area. 2023. Available online: https://dnr.wisconsin.gov/topic/Lands/WildlifeAreas/whiteriver.html (accessed on 17 April 2024).
- U.S. Fish and Wildlife Service [USFWS]. Horicon and Fox River National Wildlife Refuges Comprehensive Conservation Plan; U.S. Fish and Wildlife Service: Mayville, WI, USA, 2007. [Google Scholar]
- Wellington, M.; Burke, A.; Nicolich, J.M.; O’Malley, K. Chick rearing. In Cranes: Their Biology, Husbandry, and Conservation; Ellis, D.H., Gee, G.F., Mirande, C.M., Eds.; Department of the Interior National Biological Service: Washington, DC, USA; International Crane Foundation: Baraboo, WI, USA, 1996; pp. 77–104. [Google Scholar]
- Hartup, B.K. Rearing and release methods for reintroduction of captive-reared whooping cranes. In Whooping Cranes: Biology and Conservation; French, J.B., Converse, S.J., Austin, J.E., Eds.; Academic Press: San Diego, CA, USA, 2019; pp. 433–447. [Google Scholar]
- Griffiths, R.; Double, M.C.; Orr, K.; Dawson, R.J.G. A DNA test to sex most birds. Mol. Ecol. 1998, 7, 1071–1075. [Google Scholar] [CrossRef]
- Duan, W.; Fuerst, P.A. Isolation of a sex-linked DNA sequence in cranes. J. Hered. 2001, 92, 392–397. [Google Scholar] [CrossRef] [PubMed]
- Urbanek, R.P. Color-band identification system of the reintroduced Eastern Migratory Whooping Crane Population. Proc. N. Am. Crane Workshop 2018, 14, 101–109. [Google Scholar]
- McKinney, L.F. Conservation Challenges for Whooping Cranes (Grus americana) and Greater Sandhill Cranes (Grus canadensis) in Wisconsin. Master’s Thesis, University of Wisconsin, Stevens Point, WI, USA, 2014. [Google Scholar]
- Thompson, H.L.; Gordon, N.M. First description of nesting behavior of a same-sex pair of whooping cranes (Grus americana) in the reintroduced Eastern Migratory Population. Waterbirds 2020, 3, 326–332. [Google Scholar] [CrossRef]
- Gordon, N.M.; Bolt, D.P.; Thompson, H.L. Vigilance of nesting whooping cranes in Juneau County, Wisconsin. Proc. N. Am. Crane Workshop 2022, 15, 81–89. [Google Scholar]
- Fair, J.; Paul, E.; Jones, J.; Bies, L. (Eds.) Guidelines to the Use of Wild Birds in Research; Ornithological Council: Washington, DC, USA, 2023. [Google Scholar]
- R Core Team. R: A Language and Environment for Statistical Computing; R Foundation for Statistical Computing: Vienna, Austria, 2023; Available online: https://www.R-project.org/ (accessed on 4 November 2024).
- Nelder, J.A.; Wedderburn, R.W.M. Generalized linear models. J. R. Stat. Soc. Ser. A (Gen.) 1972, 135, 370–384. [Google Scholar] [CrossRef]
- Venables, W.N.; Ripley, B.D. Modern Applied Statistics with S; Springer: New York, NY, USA, 2002. [Google Scholar]
- Dobson, A.J.; Barnett, A.G. An Introduction to Generalized Linear Models; Chapman and Hall/CRC: Boca Raton, FL, USA, 2018. [Google Scholar]
- Burnham, K.P.; Anderson, D.R. Model Selection and Multimodel Inference: A Practical Information-Theoretic Approach, 2nd ed.; Springer: New York, NY, USA, 2002. [Google Scholar]
- Bartoń, K.; MuMIn: Multi-Model Inference. R Package Version 1.47.5. 2023. Available online: https://CRAN.R-project.org/package=MuMIn (accessed on 4 November 2024).
- Dean, C.B.; Nielsen, J.D. Generalized linear mixed models: A review and some extensions. Lifetime Data Anal. 2007, 13, 497–512. [Google Scholar] [CrossRef]
- Bates, D.; Maechler, M.; Bolker, B.; Walker, S. Fitting Linear Mixed-Effects Models Using lme4. J. Stat. Softw. 2015, 67, 1–48. [Google Scholar] [CrossRef]
- Bates, D.; Maechler, M.; Bolker, B.; Walker, S.; Christensen, R.H.B.; Singmann, H.; Dai, B.; Scheipl, F.; Grothendieck, G.; Green, P.; et al. Package ‘lme4’: Linear Mixed-Effects Models Using ‘Eigen’ and S4. CRAN, R Package Version 1.1-27.1. 2021. Available online: https://cran.r-project.org/web/packages/lme4/index.html (accessed on 4 November 2024).
- Harrell, F.E., Jr. Hmisc: Harrell Miscellaneous. R Package Version 4.5-0. 2021. Available online: https://CRAN.R-project.org/package=Hmisc (accessed on 4 November 2024).
- Dormann, C.F.; Elith, J.; Bacher, S.; Buchmann, C.; Carl, G.; Carré, G.; Marquéz, J.R.G.; Gruber, B.; Lafourcade, B.; Leitão, P.J.; et al. Collinearity: A review of methods to deal with it and a simulation study evaluating their performance. Ecography 2013, 36, 27–46. [Google Scholar] [CrossRef]
- Cramer, H. Mathematical Methods of Statistics, 19th ed.; Princeton University Press: Princeton, NJ, USA, 1999. [Google Scholar]
- Ben-Shachar, M.; Lüdecke, D.; Makowski, D. effectsize: Estimation of Effect Size Indices and Standardized Parameters. J. Open Source Softw. 2020, 5, 2815. [Google Scholar] [CrossRef]
- Rizopoulos, D. ltm: An R package for Latent Variable Modelling and Item Response Theory Analyses. J. Stat. Softw. 2006, 17, 1–25. [Google Scholar] [CrossRef]
- Cohen, J. Statistical Power Analysis for the Behavioral Sciences, 2nd ed.; Lawrence Erlbaum Associates: Hillsdale, NJ, USA, 1988. [Google Scholar]
- Fox, J.; Weisberg, S. An R Companion to Applied Regression, 3rd ed; Sage: Thousand Oaks, CA, USA, 2019. [Google Scholar]
- Powell, M.J.D. The BOBYQA Algorithm for Bound Constrained Optimization Without Derivatives; Report No. DAMTP 2009/NA06; Centre for Mathematical Sciences, University of Cambridge: Cambridge, UK, 2009. [Google Scholar]
- Afifi, A.; May, S.; Donatello, R.A.; Clark, V.A. Practical Multivariate Analysis, 6th ed.; Chapman and Hall/CRC: Boca Raton, FL, USA, 2020. [Google Scholar]
- Nakagawa, S.; Johnson, P.C.; Schielzeth, H. The coefficient of determination R2 and intra-class correlation coefficient from generalized linear mixed-effects models revisited and expanded. J. R. Soc. Interface 2017, 14, 20170213. [Google Scholar] [CrossRef] [PubMed]
- Fox, J.; Weisberg, S. Visualizing fit and lack of fit in complex regression models with Predictor Effect Plots and Partial Residuals. J. Stat. Softw. 2018, 87, 1–27. [Google Scholar] [CrossRef]
- Becker, P.H.; Zhang, H. Renesting of Common Terns in the life history perspective. J. Ornithol. 2010, 152, 213–225. [Google Scholar] [CrossRef]
- Forslund, P.; Pärt, T. Age and reproduction in birds: Hypotheses and tests. Trends Ecol. Evol. 1995, 10, 374–378. [Google Scholar] [CrossRef]
- Devries, J.H.; Brook, R.W.; Howerter, D.W.; Anderson, M.G. Effects of spring body condition and age on reproduction in mallards (Anas platyrhynchos). Auk 2008, 125, 618–628. [Google Scholar] [CrossRef]
- Nagy, L.R.; Holmes, R.T. Factors influencing fecundity in migratory songbirds: Is nest predation the most important? J. Avian Biol. 2004, 35, 487–491. [Google Scholar] [CrossRef]
- Lacy, A.; McElwee, D. Observations of molt in reintroduced whooping cranes. Proc. N. Am. Crane Workshop 2014, 12, 75. [Google Scholar]
- Edwards, H.A.; Bidwell, M.T.; Moehrenschlager, A. A call for structured decision making in conservation programs considering wild egg collection. Biol. Conserv. 2019, 238, 108226. [Google Scholar] [CrossRef]
| Covariate | Theme | Type | Description |
|---|---|---|---|
| Female Age | Parental Age | Integer | Female years lived |
| Male Age | Parental Age | Integer | Male years lived |
| Total Age | Parental Age | Integer | Breeding pair cumulative years lived |
| Years Nesting Female | Parental Experience | Integer | Number of years the female has nested with any partner |
| Years Nesting Male | Parental Experience | Integer | Number of years the male has nested with any partner |
| Years Nesting Together | Parental Experience | Integer | Total number of years the pair has nested together |
| Years Nesting Total | Parental Experience | Integer | Breeding pair cumulative years nesting experience |
| Forced Renesting | Nest Management | Factor | Complete clutch collection to facilitate renesting (yes-no) |
| Partial Clutch Collection | Nest Management | Factor | Partial clutch collection to facilitate captive rearing (yes-no) |
| Region | Geography | Factor | Region where nesting occurred (3-level factor) |
| Location | Geography | Factor | More specific location where nesting occurred (16-level factor) |
| Nest Initiation Date | Chronology | Integer | Day of the year a pair began incubating the first clutch of eggs (range = 85–149) |
| Nest Failure Date | Chronology | Integer | Day of the year a pair’s first nest failed (range = 94–185) |
| Duration Nesting | Chronology | Integer | Total number of days that the first nest was active (range = 0–68) |
| Year | Chronology | Integer | Calendar year of nesting (range = 2005–2024) |
| Variable | B | LCL | UCL |
|---|---|---|---|
| Female Age | 1.371 | 1.211 | 1.553 |
| Forced Renesting | 1.992 | 0.823 | 4.820 |
| Region—Other | 3.640 | 1.080 | 12.261 |
| Region—Rectangle | 0.221 | 0.024 | 2.026 |
| Nest Fail Date | 0.899 | 0.866 | 0.934 |
Disclaimer/Publisher’s Note: The statements, opinions and data contained in all publications are solely those of the individual author(s) and contributor(s) and not of MDPI and/or the editor(s). MDPI and/or the editor(s) disclaim responsibility for any injury to people or property resulting from any ideas, methods, instructions or products referred to in the content. |
© 2025 by the authors. Licensee MDPI, Basel, Switzerland. This article is an open access article distributed under the terms and conditions of the Creative Commons Attribution (CC BY) license (https://creativecommons.org/licenses/by/4.0/).
Share and Cite
Thompson, H.L.; Caven, A.J.; Gordon, N.M. Renesting Propensity of Reintroduced Eastern Migratory Whooping Cranes. Wild 2025, 2, 19. https://doi.org/10.3390/wild2020019
Thompson HL, Caven AJ, Gordon NM. Renesting Propensity of Reintroduced Eastern Migratory Whooping Cranes. Wild. 2025; 2(2):19. https://doi.org/10.3390/wild2020019
Chicago/Turabian StyleThompson, Hillary L., Andrew J. Caven, and Nicole M. Gordon. 2025. "Renesting Propensity of Reintroduced Eastern Migratory Whooping Cranes" Wild 2, no. 2: 19. https://doi.org/10.3390/wild2020019
APA StyleThompson, H. L., Caven, A. J., & Gordon, N. M. (2025). Renesting Propensity of Reintroduced Eastern Migratory Whooping Cranes. Wild, 2(2), 19. https://doi.org/10.3390/wild2020019