
Fusion-Based Approaches and Machine Learning Algorithms for Forest Monitoring: A Systematic Review

Simple Summary
Abstract
1. Introduction
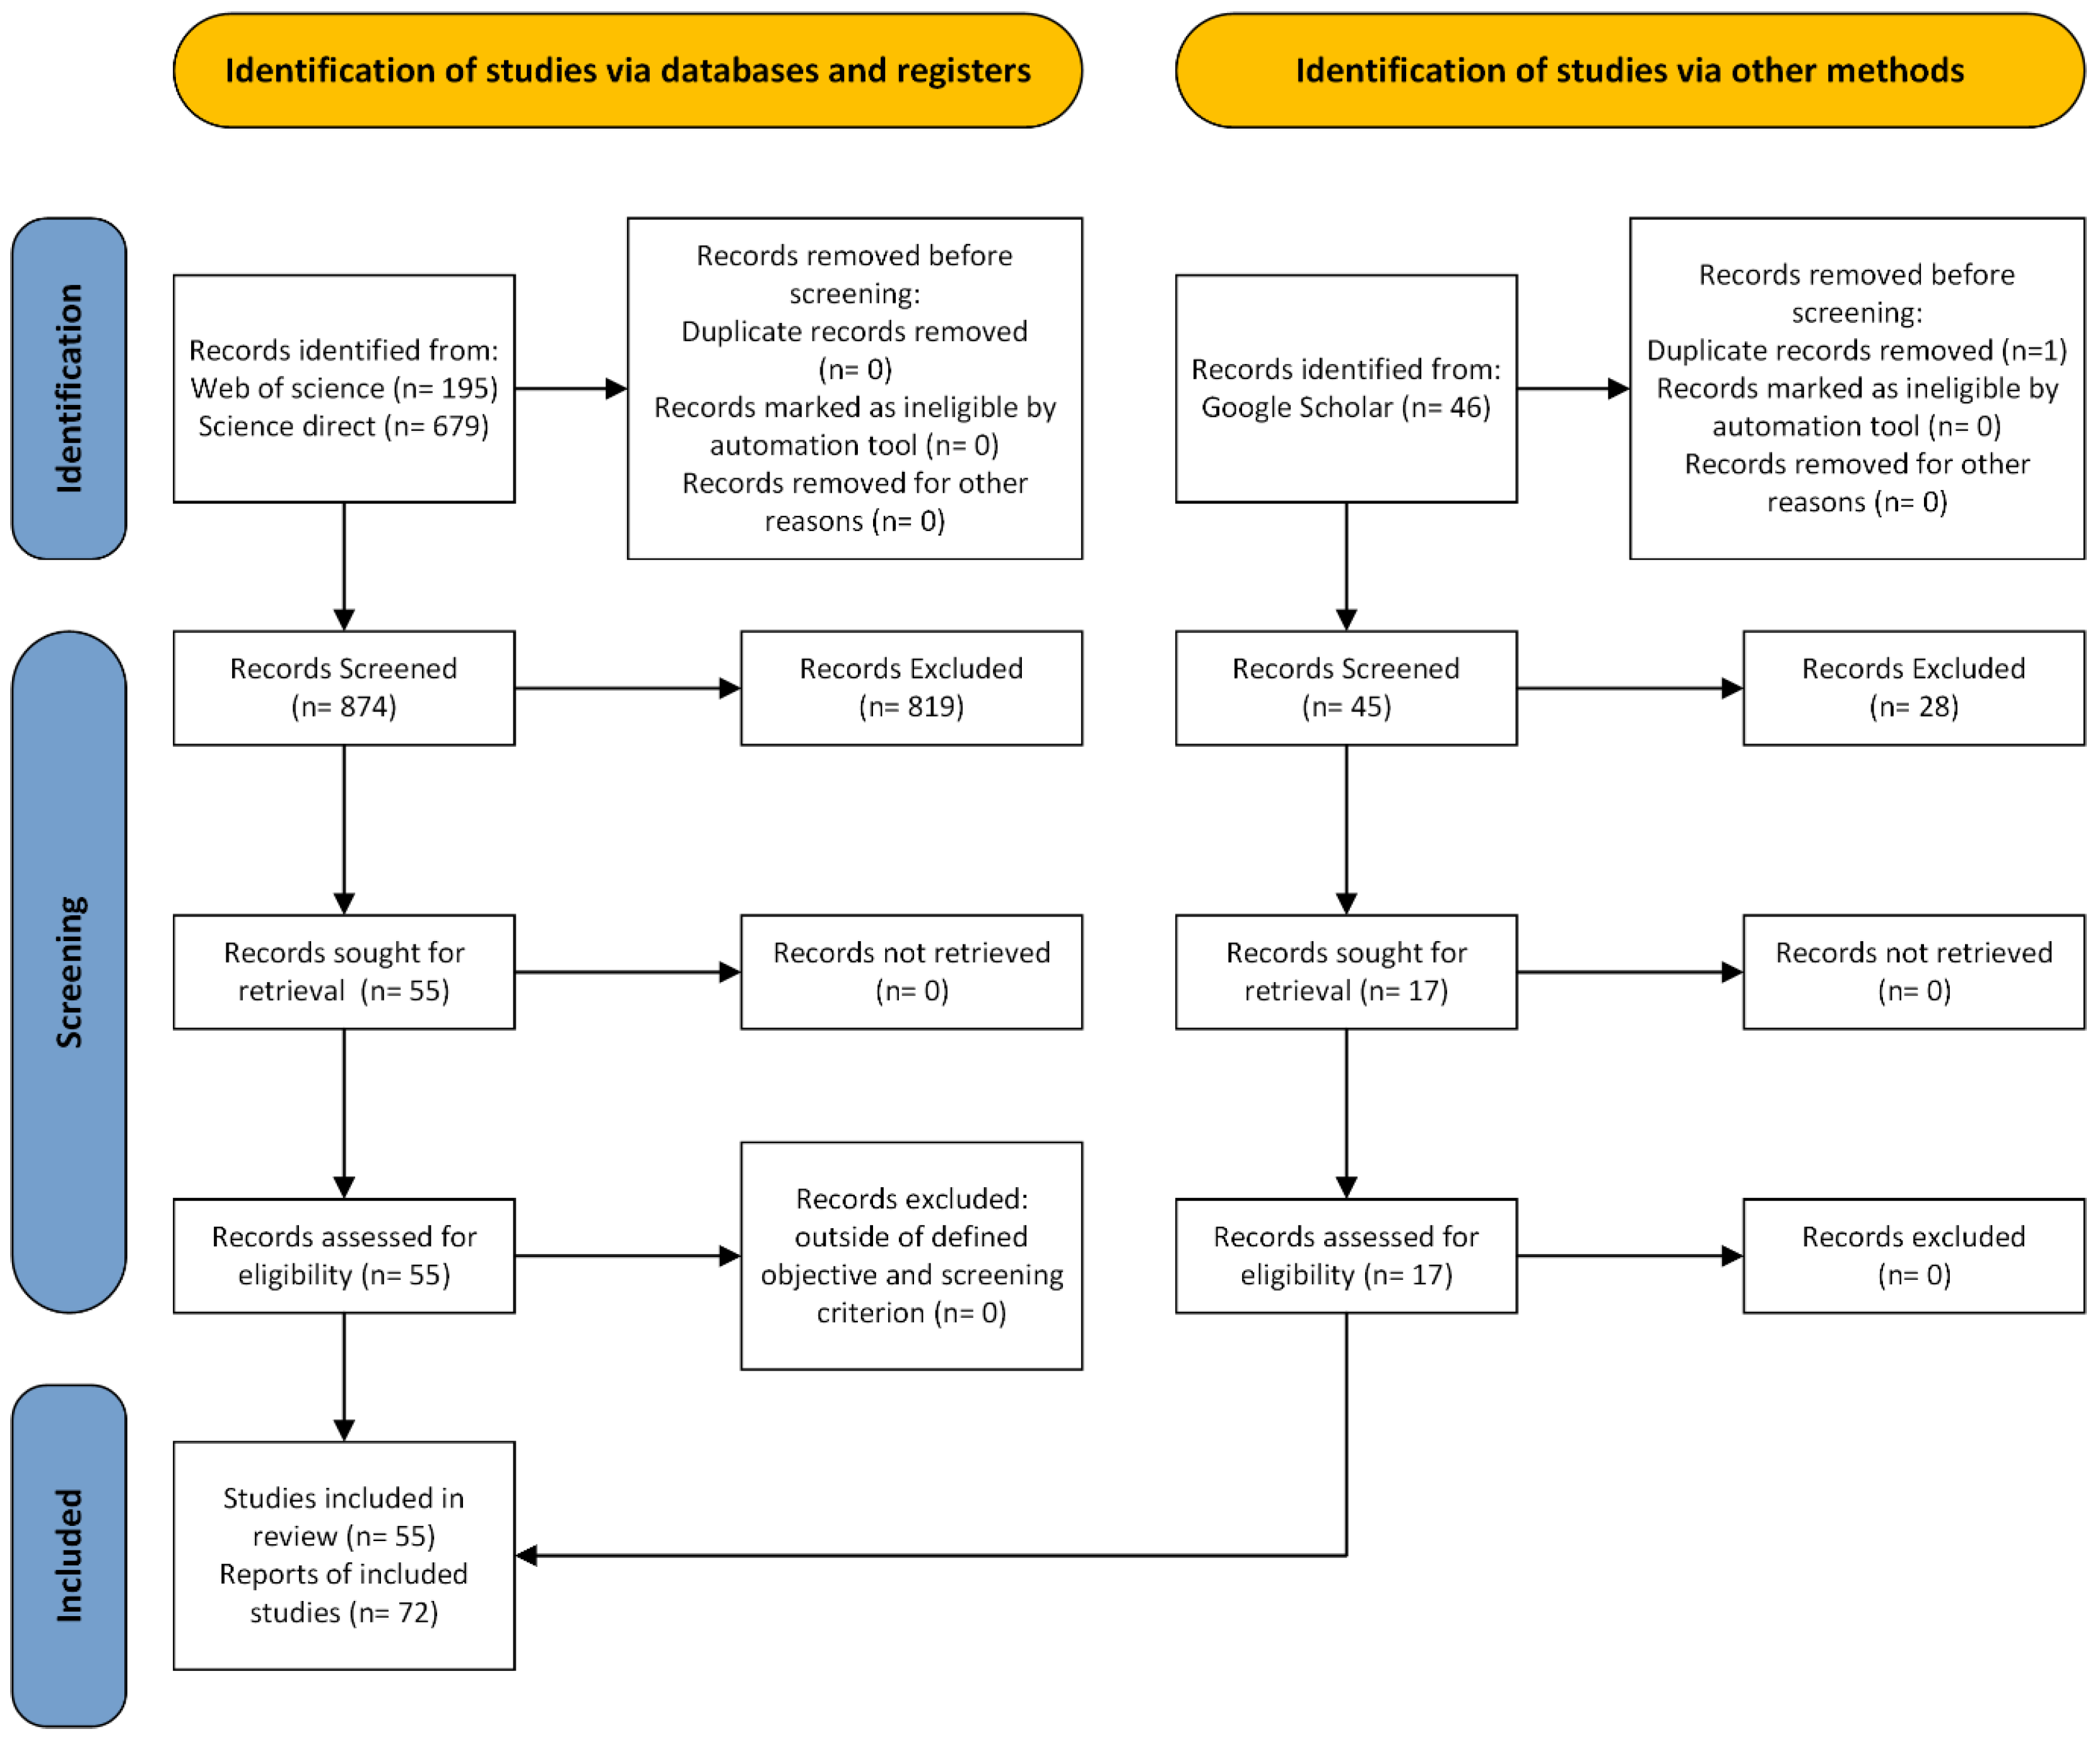
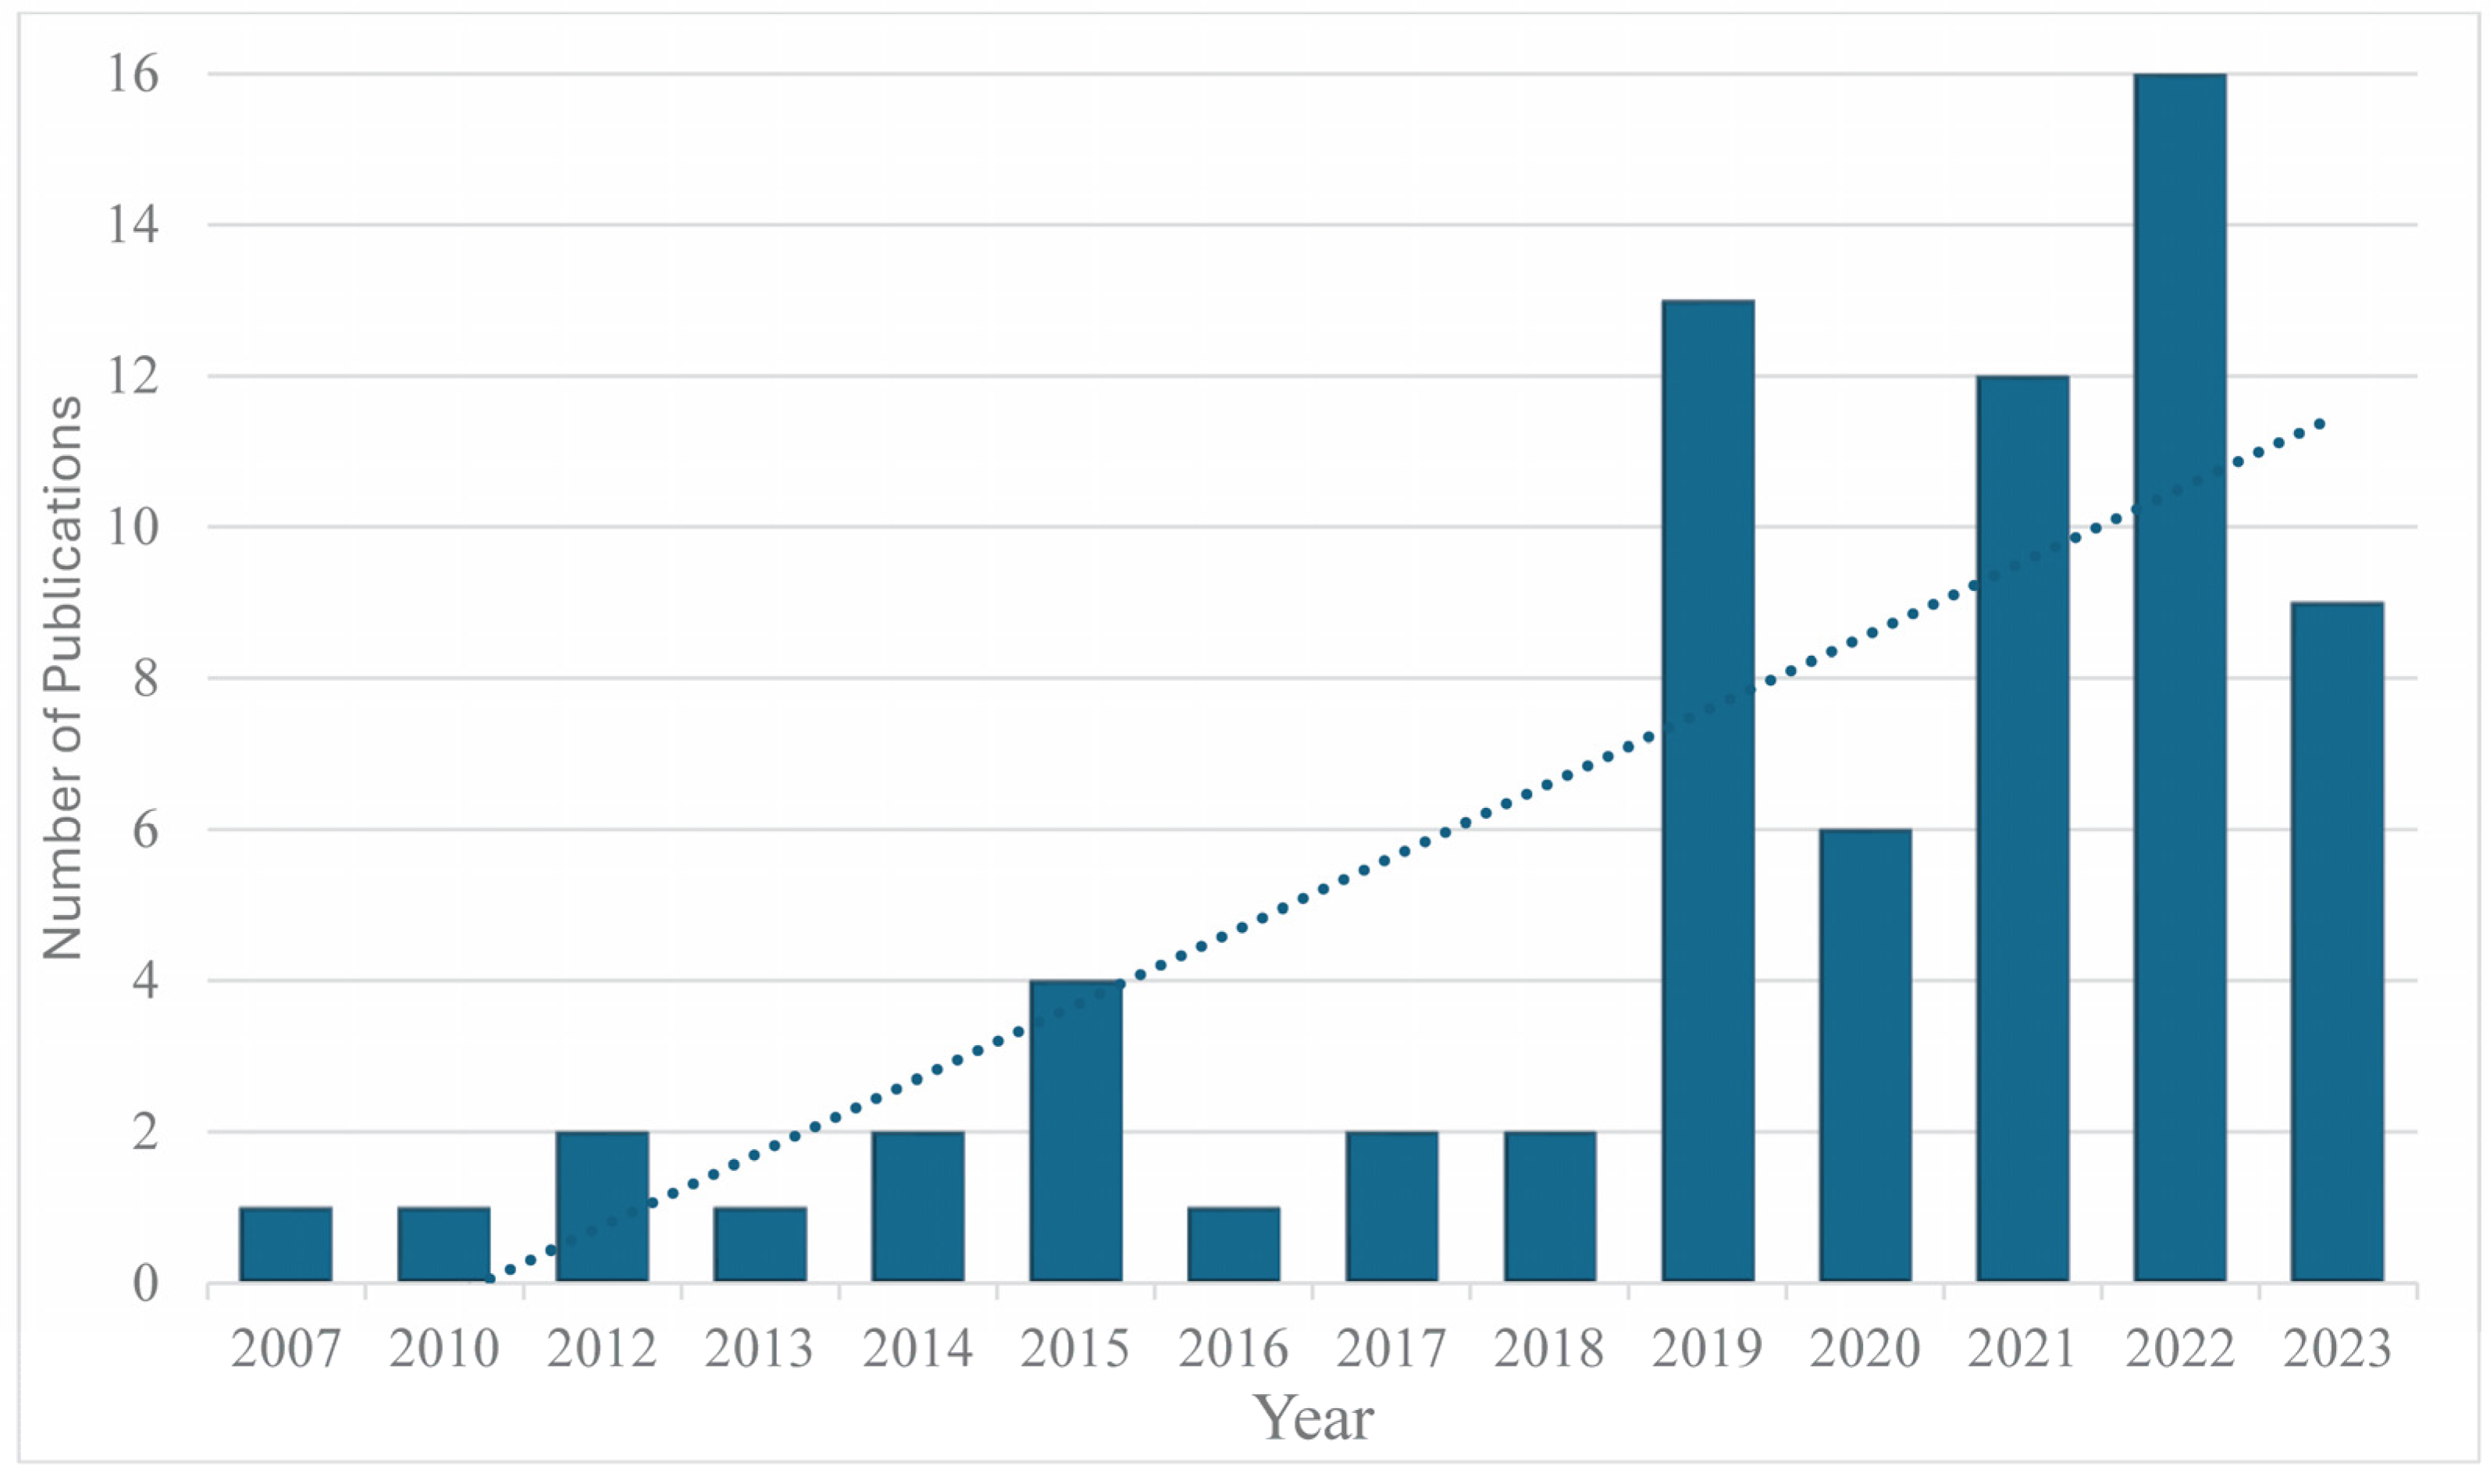
2. Methodology
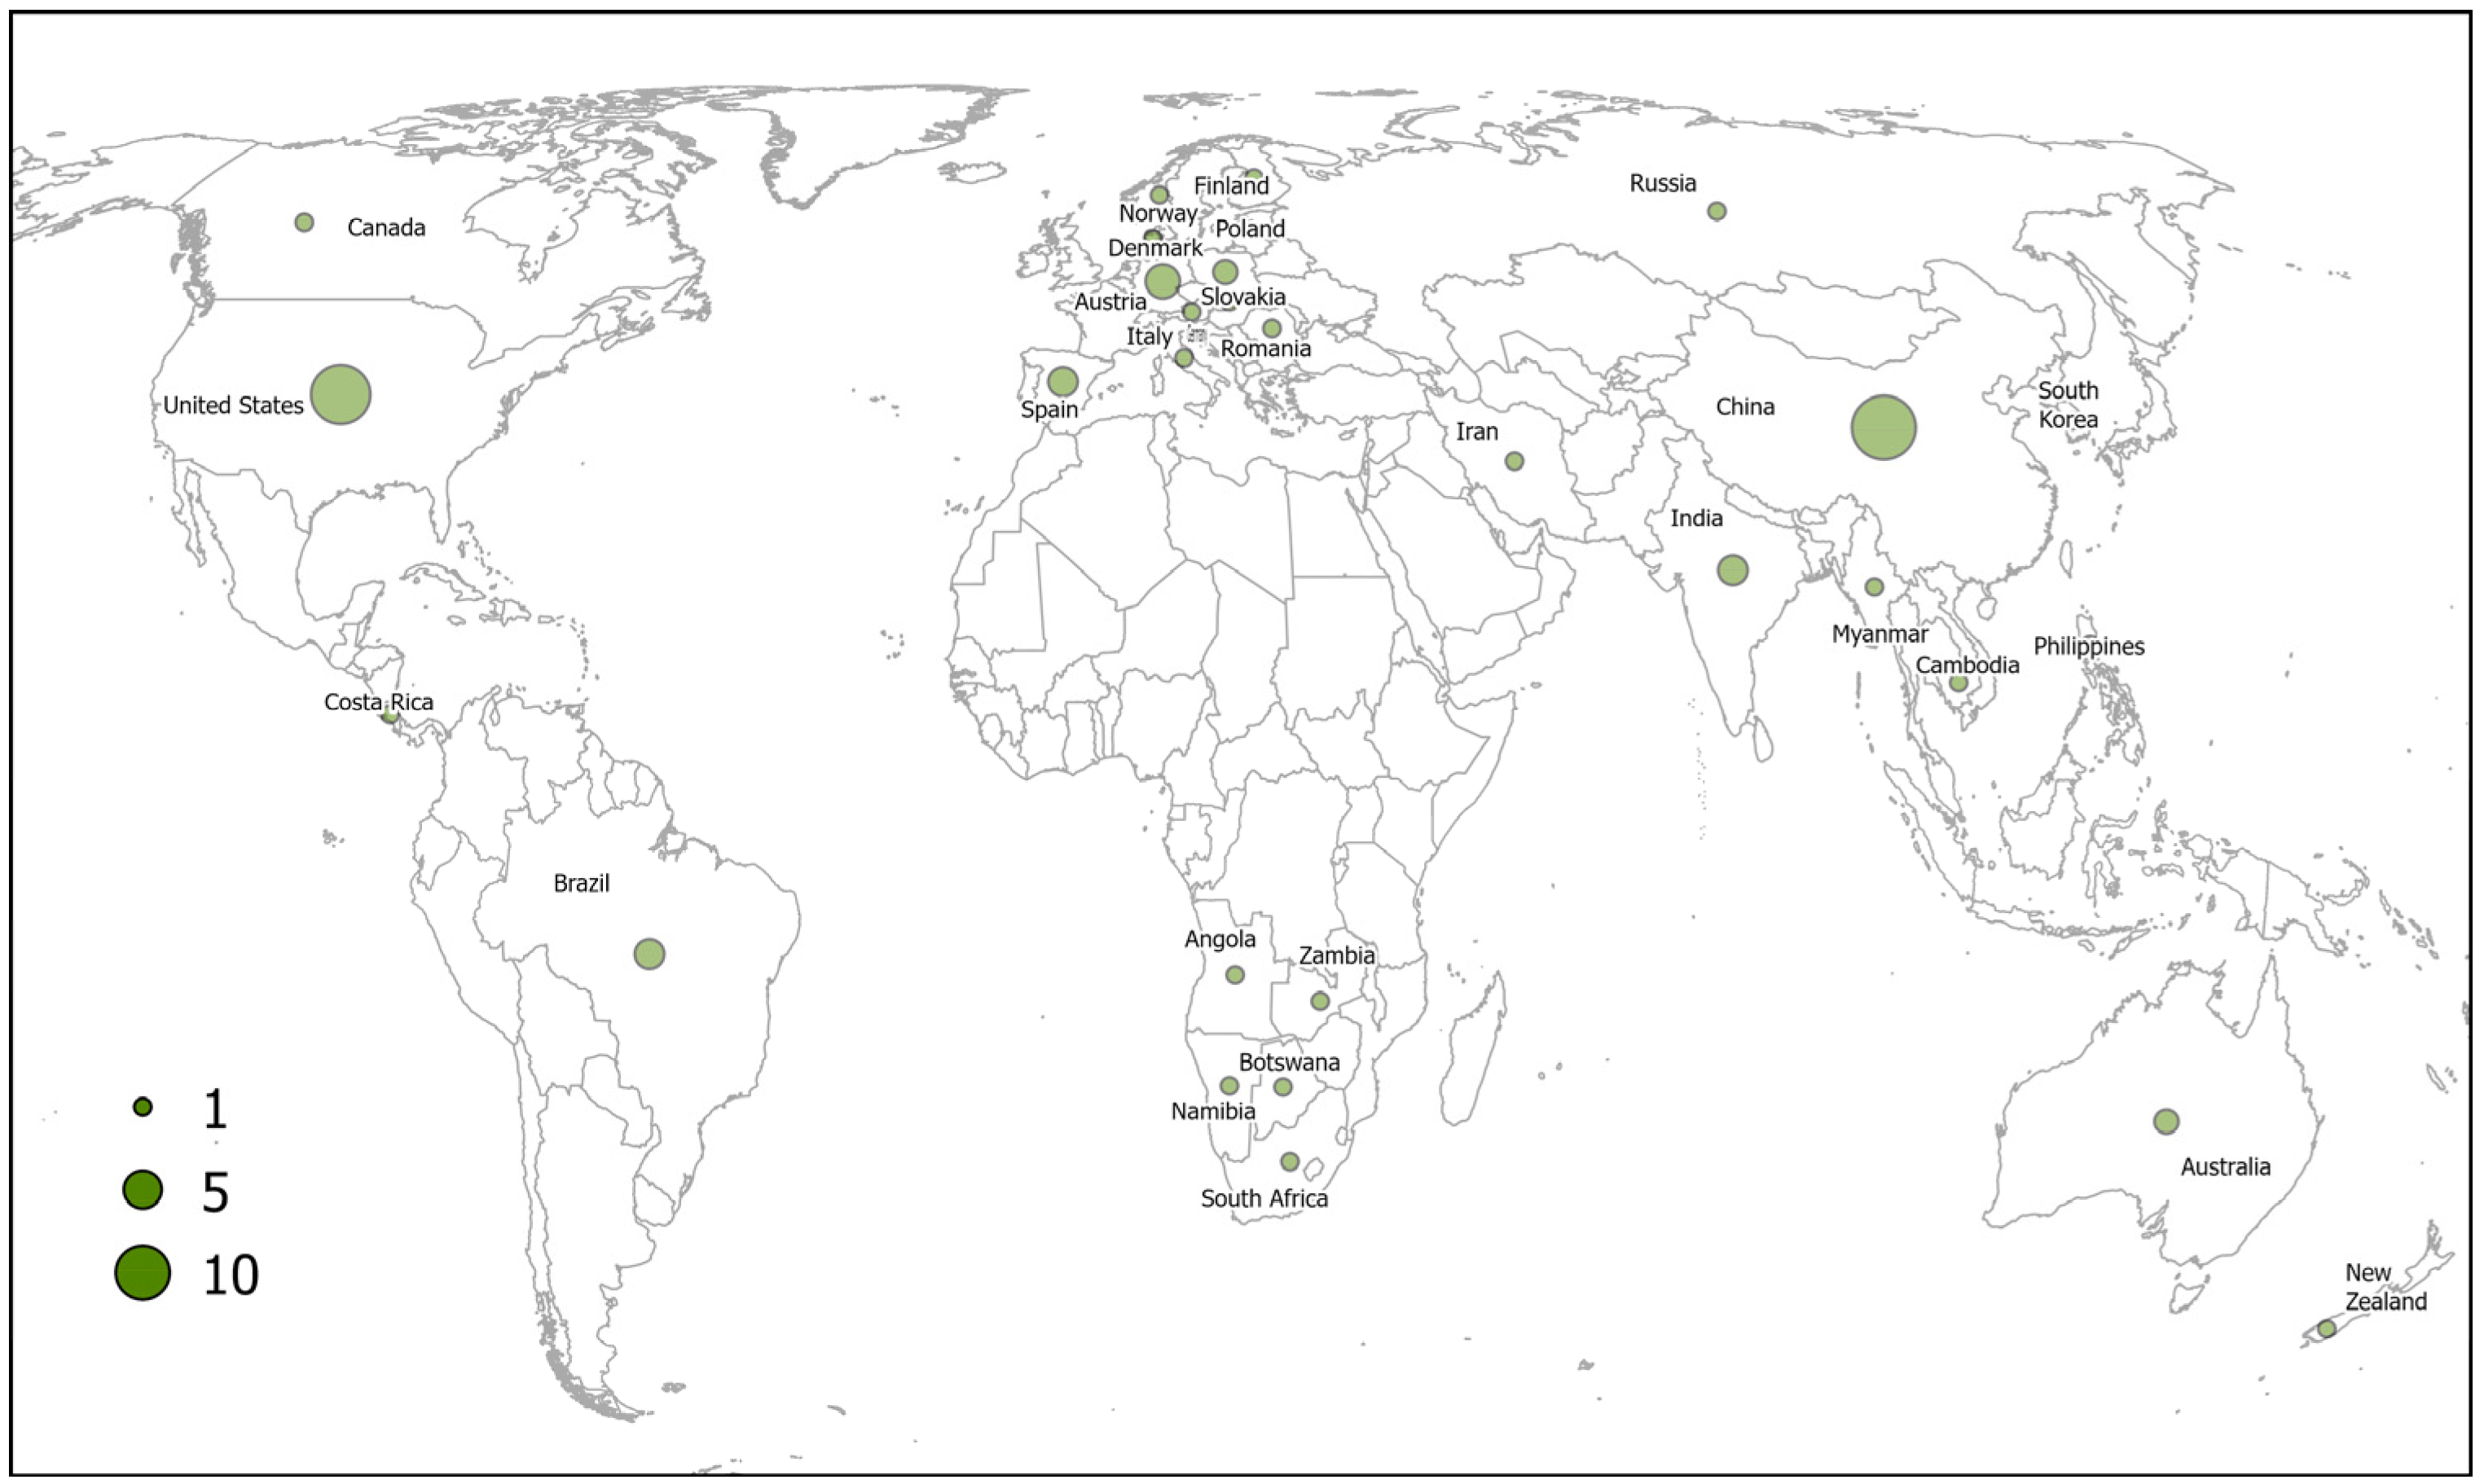
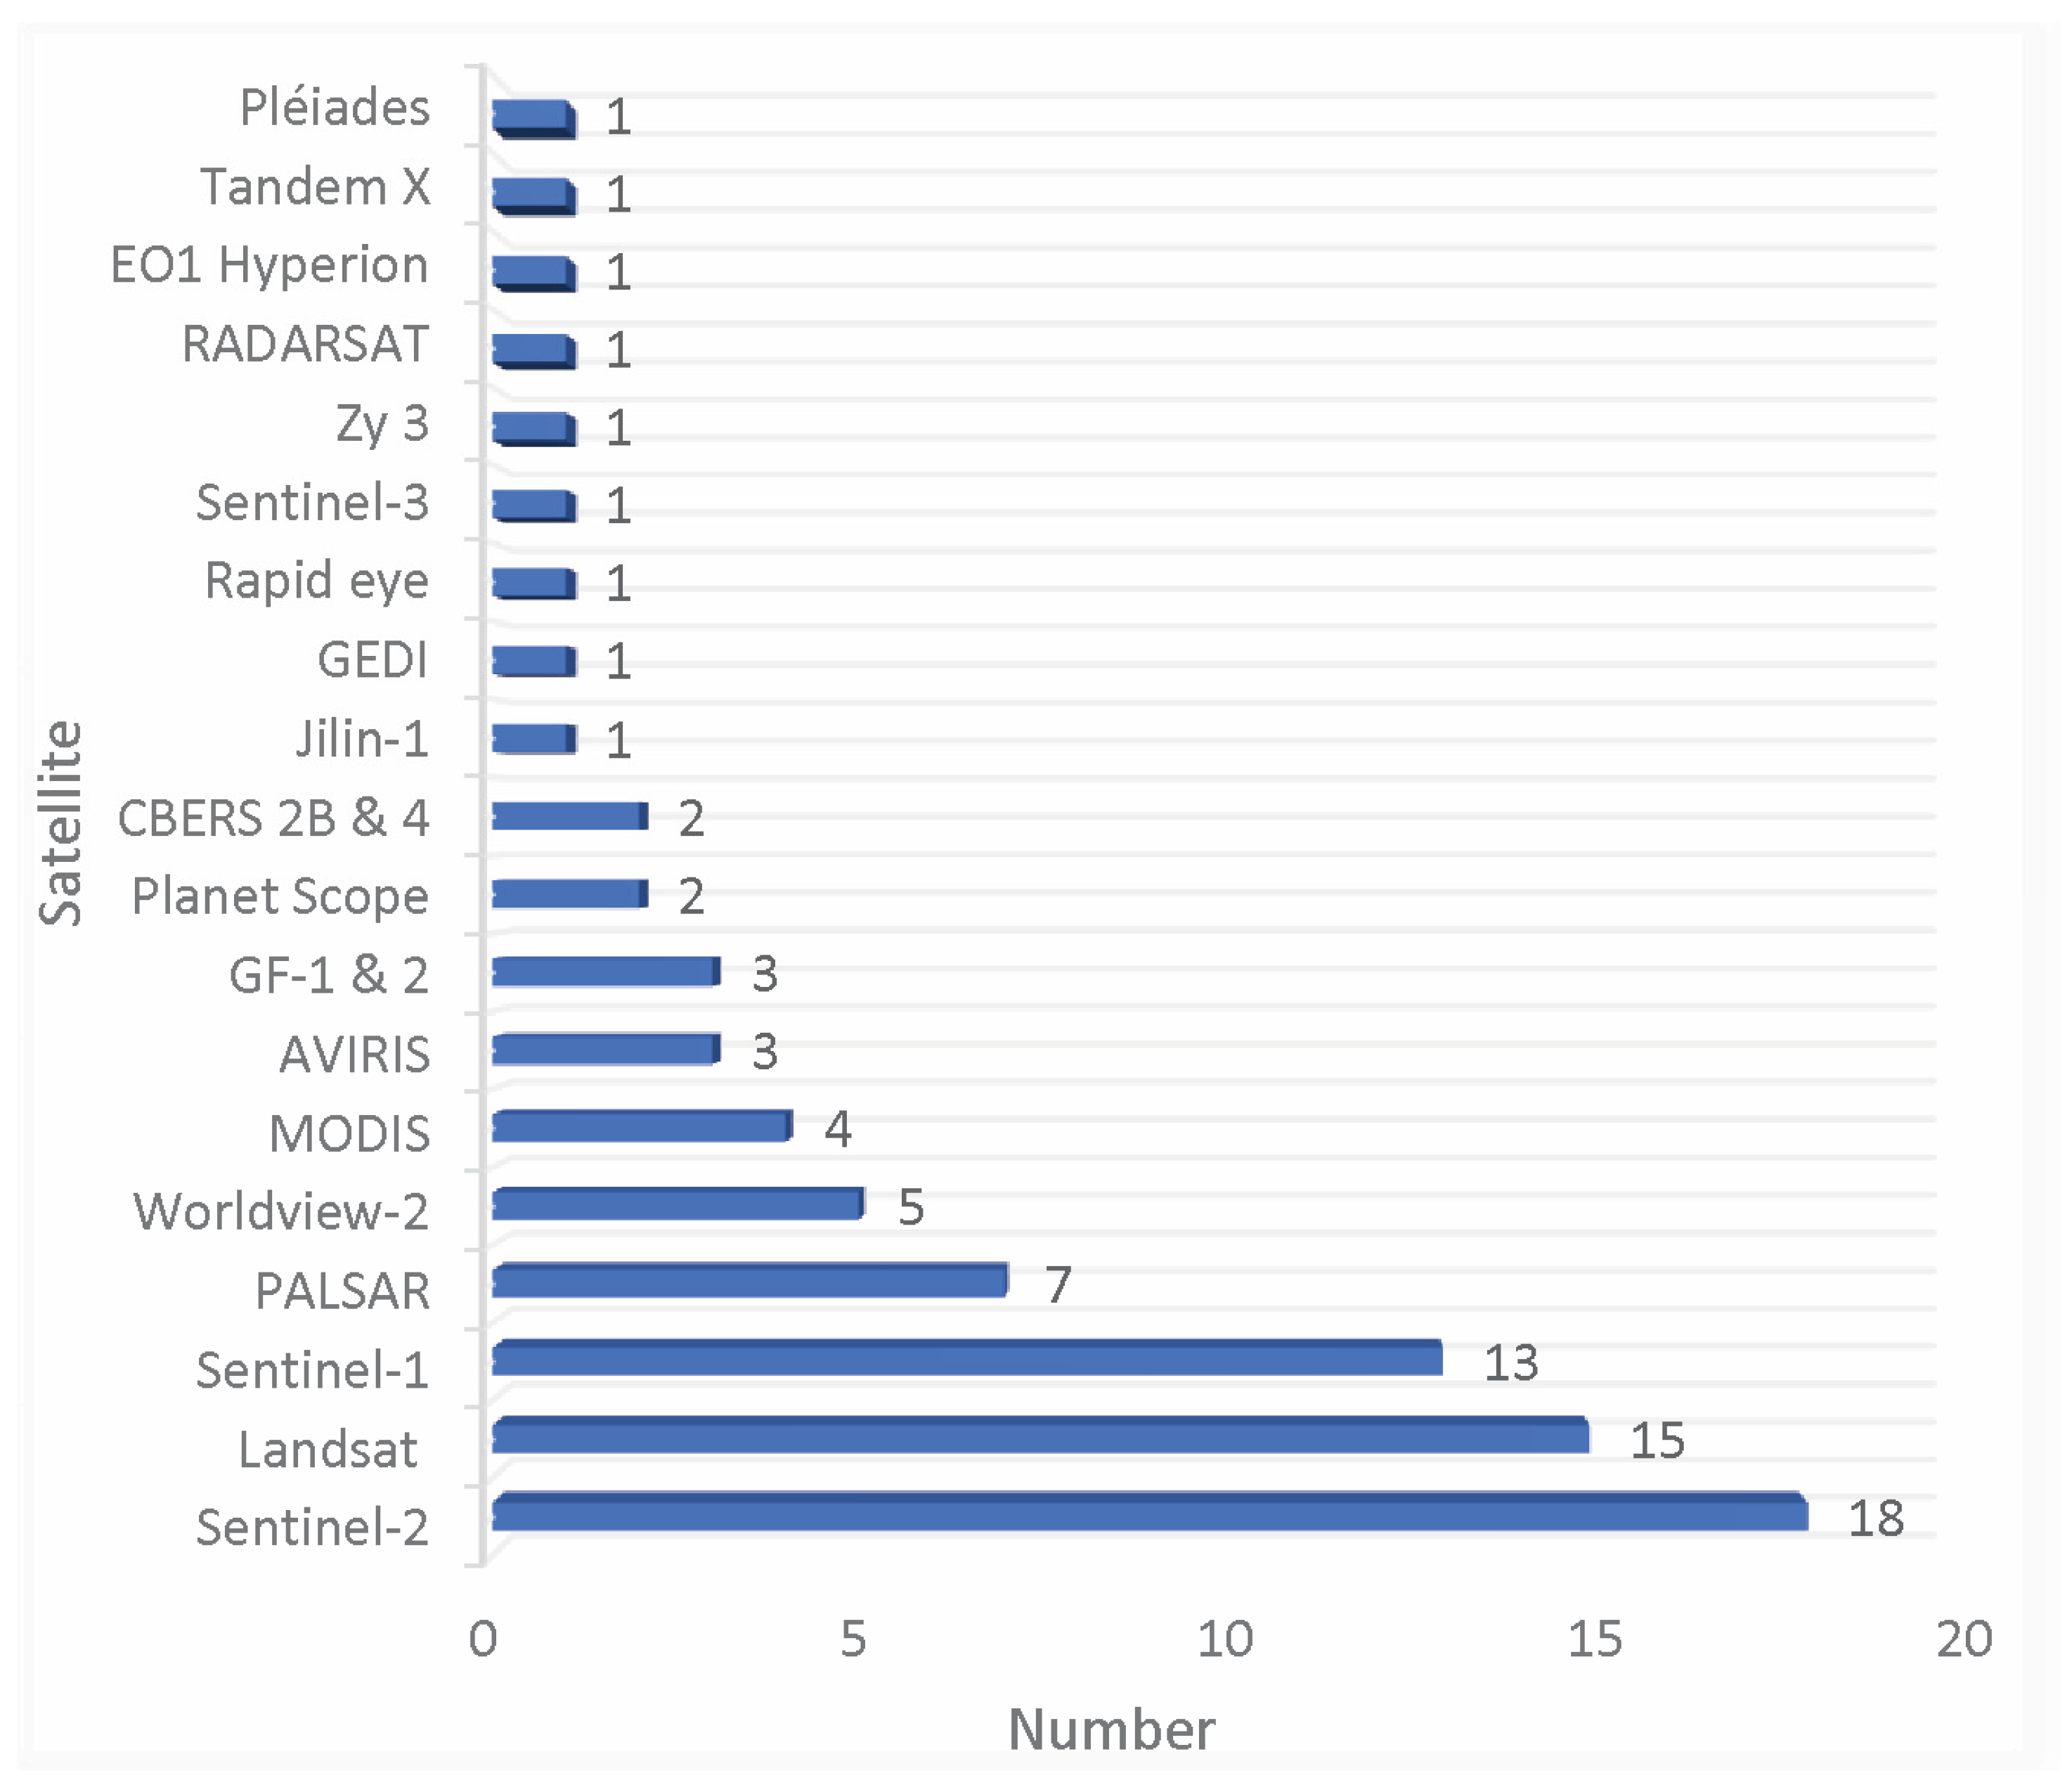
3. Results
Overview of Approaches and Machine Learning Algorithms for Forest Monitoring
4. Discussions
4.1. Data Sources
4.2. Variable Selection
4.3. Fusion Techniques
4.4. Classifier
4.5. Accuracy Assessment
4.6. Limitation of Fusion and Machine Learning Algorithms for Forest Monitoring
4.7. Implications of Multi-Source Data Fusion for Forest Monitoring
5. Conclusions
Author Contributions
Funding
Institutional Review Board Statement
Informed Consent Statement
Data Availability Statement
Acknowledgments
Conflicts of Interest
References
- Dash, J.; Ogutu, B.O. Recent Advances in Space-Borne Optical Remote Sensing Systems for Monitoring Global Terrestrial Ecosystems. Prog. Phys. Geogr. 2016, 40, 322–351. [Google Scholar] [CrossRef]
- Pandey, P.C.; Arellano, P. Advances in Remote Sensing for Forest Monitoring; John Wiley & Sons: Hoboken, NJ, USA, 2022; ISBN 1-119-78812-9. [Google Scholar]
- Doyog, N.D.; Lin, C.; Lee, Y.J.; Lumbres, R.I.C.; Daipan, B.P.O.; Bayer, D.C.; Parian, C.P. Diagnosing Pristine Pine Forest Development through Pansharpened-Surface-Reflectance Landsat Image Derived Aboveground Biomass Productivity. For. Ecol. Manag. 2021, 487, 119011. [Google Scholar] [CrossRef]
- Nguyen, T.H.; Jones, S.D.; Soto-Berelov, M.; Haywood, A.; Hislop, S. Monitoring Aboveground Forest Biomass Dynamics over Three Decades Using Landsat Time-Series and Single-Date Inventory Data. Int. J. Appl. Earth Obs. Geoinf. 2020, 84, 101952. [Google Scholar] [CrossRef]
- Purohit, S.; Aggarwal, S.; Patel, N. Estimation of Forest Aboveground Biomass Using Combination of Landsat 8 and Sentinel-1A Data with Random Forest Regression Algorithm in Himalayan Foothills. Trop. Ecol. 2021, 62, 288–300. [Google Scholar] [CrossRef]
- Bustamante, M.M.; Roitman, I.; Aide, T.M.; Alencar, A.; Anderson, L.O.; Aragão, L.; Asner, G.P.; Barlow, J.; Berenguer, E.; Chambers, J. Toward an Integrated Monitoring Framework to Assess the Effects of Tropical Forest Degradation and Recovery on Carbon Stocks and Biodiversity. Glob. Change Biol. 2016, 22, 92–109. [Google Scholar] [CrossRef]
- Latifi, H. Characterizing Forest Structure by Means of Remote Sensing: A Review. Remote Sens.-Adv. Tech. Platf. 2012, 1–26. [Google Scholar] [CrossRef]
- Debastiani, A.B.; Sanquetta, C.R.; Dalla Corte, A.P.; Pinto, N.S.; Rex, F.E. Evaluating SAR-Optical Sensor Fusion for Aboveground Biomass Estimation in a Brazilian Tropical Forest. Ann. For. Res. 2009, 52, 109–122. [Google Scholar] [CrossRef]
- Bogan, S.A.; Antonarakis, A.S.; Moorcroft, P.R. Imaging Spectrometry-Derived Estimates of Regional Ecosystem Composition for the Sierra Nevada, California. Remote Sens. Environ. 2019, 228, 14–30. [Google Scholar] [CrossRef]
- Khan, M.R.; Khan, I.A.; Baig, M.H.A.; Liu, Z.; Ashraf, M.I. Exploring the Potential of Sentinel-2A Satellite Data for Aboveground Biomass Estimation in Fragmented Himalayan Subtropical Pine Forest. J. Mt. Sci. 2020, 17, 2880–2896. [Google Scholar] [CrossRef]
- Li, X.; Zhang, M.; Long, J.; Lin, H. A Novel Method for Estimating Spatial Distribution of Forest Above-Ground Biomass Based on Multispectral Fusion Data and Ensemble Learning Algorithm. Remote Sens. 2021, 13, 3910. [Google Scholar] [CrossRef]
- Wulder, M.A.; Loveland, T.R.; Roy, D.P.; Crawford, C.J.; Masek, J.G.; Woodcock, C.E.; Allen, R.G.; Anderson, M.C.; Belward, A.S.; Cohen, W.B. Current Status of Landsat Program, Science, and Applications. Remote Sens. Environ. 2019, 225, 127–147. [Google Scholar] [CrossRef]
- Fassnacht, F.E.; White, J.C.; Wulder, M.A.; Næsset, E. Remote Sensing in Forestry: Current Challenges, Considerations and Directions. For. Int. J. For. Res. 2024, 97, 11–37. [Google Scholar] [CrossRef]
- Tomppo, E.; Olsson, H.; Ståhl, G.; Nilsson, M.; Hagner, O.; Katila, M. Combining National Forest Inventory Field Plots and Remote Sensing Data for Forest Databases. Remote Sens. Environ. 2008, 112, 1982–1999. [Google Scholar] [CrossRef]
- Bergseng, E.; Ørka, H.O.; Næsset, E.; Gobakken, T. Assessing Forest Inventory Information Obtained from Different Inventory Approaches and Remote Sensing Data Sources. Ann. For. Sci. 2015, 72, 33–45. [Google Scholar] [CrossRef]
- Jurjević, L.; Liang, X.; Gašparović, M.; Balenović, I. Is Field-Measured Tree Height as Reliable as Believed–Part II, A Comparison Study of Tree Height Estimates from Conventional Field Measurement and Low-Cost Close-Range Remote Sensing in a Deciduous Forest. ISPRS J. Photogramm. Remote Sens. 2020, 169, 227–241. [Google Scholar] [CrossRef]
- Wang, Y.; Lehtomäki, M.; Liang, X.; Pyörälä, J.; Kukko, A.; Jaakkola, A.; Liu, J.; Feng, Z.; Chen, R.; Hyyppä, J. Is Field-Measured Tree Height as Reliable as Believed–A Comparison Study of Tree Height Estimates from Field Measurement, Airborne Laser Scanning and Terrestrial Laser Scanning in a Boreal Forest. ISPRS J. Photogramm. Remote Sens. 2019, 147, 132–145. [Google Scholar] [CrossRef]
- Dube, T.; Mutanga, O. The Impact of Integrating WorldView-2 Sensor and Environmental Variables in Estimating Plantation Forest Species Aboveground Biomass and Carbon Stocks in uMgeni Catchment, South Africa. ISPRS J. Photogramm. Remote Sens. 2016, 119, 415–425. [Google Scholar] [CrossRef]
- Kattenborn, T.; Maack, J.; Faßnacht, F.; Enßle, F.; Ermert, J.; Koch, B. Mapping Forest Biomass from Space–Fusion of Hyperspectral EO1-Hyperion Data and Tandem-X and WorldView-2 Canopy Height Models. Int. J. Appl. Earth Obs. Geoinf. 2015, 35, 359–367. [Google Scholar] [CrossRef]
- Albarakat, R.; Lakshmi, V. Comparison of Normalized Difference Vegetation Index Derived from Landsat, MODIS, and AVHRR for the Mesopotamian Marshes between 2002 and 2018. Remote Sens. 2019, 11, 1245. [Google Scholar] [CrossRef]
- Chen, Y.; Li, L.; Lu, D.; Li, D. Exploring Bamboo Forest Aboveground Biomass Estimation Using Sentinel-2 Data. Remote Sens. 2018, 11, 7. [Google Scholar] [CrossRef]
- Lu, D.; Chen, Q.; Wang, G.; Liu, L.; Li, G.; Moran, E. A Survey of Remote Sensing-Based Aboveground Biomass Estimation Methods in Forest Ecosystems. Int. J. Digit. Earth 2016, 9, 63–105. [Google Scholar] [CrossRef]
- Kumar, L.; Mutanga, O. Remote Sensing of Above-Ground Biomass. Remote Sens. 2017, 9, 935. [Google Scholar] [CrossRef]
- Bright, B.C.; Hicke, J.A.; Hudak, A.T. Estimating Aboveground Carbon Stocks of a Forest Affected by Mountain Pine Beetle in Idaho Using Lidar and Multispectral Imagery. Remote Sens. Environ. 2012, 124, 270–281. [Google Scholar] [CrossRef]
- Koch, B. Status and Future of Laser Scanning, Synthetic Aperture Radar and Hyperspectral Remote Sensing Data for Forest Biomass Assessment. ISPRS J. Photogramm. Remote Sens. 2010, 65, 581–590. [Google Scholar] [CrossRef]
- Ballanti, L.; Blesius, L.; Hines, E.; Kruse, B. Tree Species Classification Using Hyperspectral Imagery: A Comparison of Two Classifiers. Remote Sens. 2016, 8, 445. [Google Scholar] [CrossRef]
- Camarretta, N.; Harrison, P.A.; Bailey, T.; Potts, B.; Lucieer, A.; Davidson, N.; Hunt, M. Monitoring Forest Structure to Guide Adaptive Management of Forest Restoration: A Review of Remote Sensing Approaches. New For. 2020, 51, 573–596. [Google Scholar] [CrossRef]
- Abad-Segura, E.; González-Zamar, M.-D.; Vázquez-Cano, E.; López-Meneses, E. Remote Sensing Applied in Forest Management to Optimize Ecosystem Services: Advances in Research. Forests 2020, 11, 969. [Google Scholar] [CrossRef]
- Bjerreskov, K.S.; Nord-Larsen, T.; Fensholt, R. Classification of Nemoral Forests with Fusion of Multi-Temporal Sentinel-1 and 2 Data. Remote Sens. 2021, 13, 950. [Google Scholar] [CrossRef]
- Huang, X.; Ziniti, B.; Torbick, N.; Ducey, M.J. Assessment of Forest above Ground Biomass Estimation Using Multi-Temporal C-Band Sentinel-1 and Polarimetric L-Band PALSAR-2 Data. Remote Sens. 2018, 10, 1424. [Google Scholar] [CrossRef]
- Brovelli, M.A.; Sun, Y.; Yordanov, V. Monitoring Forest Change in the Amazon Using Multi-Temporal Remote Sensing Data and Machine Learning Classification on Google Earth Engine. ISPRS Int. J. Geo-Inf. 2020, 9, 580. [Google Scholar] [CrossRef]
- Esteban, J.; McRoberts, R.E.; Fernández-Landa, A.; Tomé, J.L.; Nӕsset, E. Estimating Forest Volume and Biomass and Their Changes Using Random Forests and Remotely Sensed Data. Remote Sens. 2019, 11, 1944. [Google Scholar] [CrossRef]
- Pu, R.; Landry, S. Mapping Urban Tree Species by Integrating Multi-Seasonal High Resolution Pléiades Satellite Imagery with Airborne LiDAR Data. Urban For. Urban Green. 2020, 53, 126675. [Google Scholar] [CrossRef]
- Sun, C.; Cao, S.; Sanchez-Azofeifa, G.A. Mapping Tropical Dry Forest Age Using Airborne Waveform LiDAR and Hyperspectral Metrics. Int. J. Appl. Earth Obs. Geoinf. 2019, 83, 101908. [Google Scholar] [CrossRef]
- Hernández-Stefanoni, J.L.; Reyes-Palomeque, G.; Castillo-Santiago, M.Á.; George-Chacón, S.P.; Huechacona-Ruiz, A.H.; Tun-Dzul, F.; Rondon-Rivera, D.; Dupuy, J.M. Effects of Sample Plot Size and GPS Location Errors on Aboveground Biomass Estimates from LiDAR in Tropical Dry Forests. Remote Sens. 2018, 10, 1586. [Google Scholar] [CrossRef]
- Kane, V.R.; Bakker, J.D.; McGaughey, R.J.; Lutz, J.A.; Gersonde, R.F.; Franklin, J.F. Examining Conifer Canopy Structural Complexity across Forest Ages and Elevations with LiDAR Data. Can. J. For. Res. 2010, 40, 774–787. [Google Scholar] [CrossRef]
- Racine, E.B.; Coops, N.C.; St-Onge, B.; Bégin, J. Estimating Forest Stand Age from LiDAR-Derived Predictors and Nearest Neighbor Imputation. For. Sci. 2014, 60, 128–136. [Google Scholar] [CrossRef]
- Vastaranta, M.; Niemi, M.; Wulder, M.A.; White, J.C.; Nurminen, K.; Litkey, P.; Honkavaara, E.; Holopainen, M.; Hyyppä, J. Forest Stand Age Classification Using Time Series of Photogrammetrically Derived Digital Surface Models. Scand. J. For. Res. 2016, 31, 194–205. [Google Scholar] [CrossRef]
- Dassot, M.; Constant, T.; Fournier, M. The Use of Terrestrial LiDAR Technology in Forest Science: Application Fields, Benefits and Challenges. Ann. For. Sci. 2011, 68, 959–974. [Google Scholar] [CrossRef]
- Shendryk, Y. Fusing GEDI with Earth Observation Data for Large Area Aboveground Biomass Mapping. Int. J. Appl. Earth Obs. Geoinf. 2022, 115, 103108. [Google Scholar] [CrossRef]
- Cui, L.; Chen, S.; Mu, Y.; Xu, X.; Zhang, B.; Zhao, X. Tree Species Classification over Cloudy Mountainous Regions by Spatiotemporal Fusion and Ensemble Classifier. Forests 2023, 14, 107. [Google Scholar] [CrossRef]
- Jin, Q.; Xu, E.; Zhang, X. A Fusion Method for Multisource Land Cover Products Based on Superpixels and Statistical Extraction for Enhancing Resolution and Improving Accuracy. Remote Sens. 2022, 14, 1676. [Google Scholar] [CrossRef]
- Kopeć, D.; Zakrzewska, A.; Halladin-Dąbrowska, A.; Wylazłowska, J.; Sławik, Ł. The Essence of Acquisition Time of Airborne Hyperspectral and On-Ground Reference Data for Classification of Highly Invasive Annual Vine Echinocystis Lobata (Michx.) & Torr. A. Gray. GIScience Remote Sens. 2023, 60, 2204682. [Google Scholar]
- Banks, S.; White, L.; Behnamian, A.; Chen, Z.; Montpetit, B.; Brisco, B.; Pasher, J.; Duffe, J. Wetland Classification with Multi-Angle/Temporal SAR Using Random Forests. Remote Sens. 2019, 11, 670. [Google Scholar] [CrossRef]
- Choe, H.; Chi, J.; Thorne, J.H. Mapping Potential Plant Species Richness over Large Areas with Deep Learning, MODIS, and Species Distribution Models. Remote Sens. 2021, 13, 2490. [Google Scholar] [CrossRef]
- Araya-López, R.A.; Lopatin, J.; Fassnacht, F.E.; Hernández, H.J. Monitoring Andean High Altitude Wetlands in Central Chile with Seasonal Optical Data: A Comparison between Worldview-2 and Sentinel-2 Imagery. ISPRS J. Photogramm. Remote Sens. 2018, 145, 213–224. [Google Scholar] [CrossRef]
- Fu, B.; Zuo, P.; Liu, M.; Lan, G.; He, H.; Lao, Z.; Zhang, Y.; Fan, D.; Gao, E. Classifying Vegetation Communities Karst Wetland Synergistic Use of Image Fusion and Object-Based Machine Learning Algorithm with Jilin-1 and UAV Multispectral Images. Ecol. Indic. 2022, 140, 108989. [Google Scholar] [CrossRef]
- Tamiminia, H.; Salehi, B.; Mahdianpari, M.; Beier, C.M.; Johnson, L.; Phoenix, D.B.; Mahoney, M. Decision Tree-Based Machine Learning Models for above-Ground Biomass Estimation Using Multi-Source Remote Sensing Data and Object-Based Image Analysis. Geocarto Int. 2022, 37, 12763–12791. [Google Scholar] [CrossRef]
- Qian, C.; Qiang, H.; Wang, F.; Li, M. Estimation of Forest Aboveground Biomass in Karst Areas Using Multi-Source Remote Sensing Data and the K-DBN Algorithm. Remote Sens. 2021, 13, 5030. [Google Scholar] [CrossRef]
- dos Santos, E.P.; da Silva, D.D.; do Amaral, C.H.; Fernandes-Filho, E.I.; Dias, R.L.S. A Machine Learning Approach to Reconstruct Cloudy Affected Vegetation Indices Imagery via Data Fusion from Sentinel-1 and Landsat 8. Comput. Electron. Agric. 2022, 194, 106753. [Google Scholar] [CrossRef]
- García-Gutiérrez, J.; Martínez-Álvarez, F.; Troncoso, A.; Riquelme, J.C. A Comparison of Machine Learning Regression Techniques for LiDAR-Derived Estimation of Forest Variables. Neurocomputing 2015, 167, 24–31. [Google Scholar] [CrossRef]
- Jiang, Y.; Zhang, L.; Yan, M.; Qi, J.; Fu, T.; Fan, S.; Chen, B. High-Resolution Mangrove Forests Classification with Machine Learning Using Worldview and Uav Hyperspectral Data. Remote Sens. 2021, 13, 1529. [Google Scholar] [CrossRef]
- Liu, L.; Guo, Y.; Li, Y.; Zhang, Q.; Li, Z.; Chen, E.; Yang, L.; Mu, X. Comparison of Machine Learning Methods Applied on Multi-Source Medium-Resolution Satellite Images for Chinese Pine (Pinus tabulaeformis) Extraction on Google Earth Engine. Forests 2022, 13, 677. [Google Scholar] [CrossRef]
- Navale, A.; Haldar, D. Evaluation of Machine Learning Algorithms to Sentinel SAR Data. Spat. Inf. Res. 2020, 28, 345–355. [Google Scholar] [CrossRef]
- Wessel, M.; Brandmeier, M.; Tiede, D. Evaluation of Different Machine Learning Algorithms for Scalable Classification of Tree Types and Tree Species Based on Sentinel-2 Data. Remote Sens. 2018, 10, 1419. [Google Scholar] [CrossRef]
- Altarez, R.D.D.; Apan, A.; Maraseni, T. Deep Learning U-Net Classification of Sentinel-1 and 2 Fusions Effectively Demarcates Tropical Montane Forest’s Deforestation. Remote Sens. Appl. Soc. Environ. 2023, 29, 100887. [Google Scholar] [CrossRef]
- Dong, L.; Du, H.; Mao, F.; Han, N.; Li, X.; Zhou, G.; Zheng, J.; Zhang, M.; Xing, L.; Liu, T. Very High Resolution Remote Sensing Imagery Classification Using a Fusion of Random Forest and Deep Learning Technique—Subtropical Area for Example. IEEE J. Sel. Top. Appl. Earth Obs. Remote Sens. 2019, 13, 113–128. [Google Scholar] [CrossRef]
- Hamraz, H.; Jacobs, N.B.; Contreras, M.A.; Clark, C.H. Deep Learning for Conifer/Deciduous Classification of Airborne LiDAR 3D Point Clouds Representing Individual Trees. ISPRS J. Photogramm. Remote Sens. 2019, 158, 219–230. [Google Scholar] [CrossRef]
- Liu, M.; Fu, B.; Fan, D.; Zuo, P.; Xie, S.; He, H.; Liu, L.; Huang, L.; Gao, E.; Zhao, M. Study on Transfer Learning Ability for Classifying Marsh Vegetation with Multi-Sensor Images Using DeepLabV3+ and HRNet Deep Learning Algorithms. Int. J. Appl. Earth Obs. Geoinf. 2021, 103, 102531. [Google Scholar] [CrossRef]
- Hamedianfar, A.; Mohamedou, C.; Kangas, A.; Vauhkonen, J. Deep Learning for Forest Inventory and Planning: A Critical Review on the Remote Sensing Approaches so Far and Prospects for Further Applications. Forestry 2022, 95, 451–465. [Google Scholar] [CrossRef]
- Kluczek, M.; Zagajewski, B.; Zwijacz-Kozica, T. Mountain Tree Species Mapping Using Sentinel-2, PlanetScope, and Airborne HySpex Hyperspectral Imagery. Remote Sens. 2023, 15, 844. [Google Scholar] [CrossRef]
- Joshi, N.; Baumann, M.; Ehammer, A.; Fensholt, R.; Grogan, K.; Hostert, P.; Jepsen, M.; Kuemmerle, T.; Meyfroidt, P.; Mitchard, E.; et al. A Review of the Application of Optical and Radar Remote Sensing Data Fusion to Land Use Mapping and Monitoring. Remote Sens. 2016, 8, 70. [Google Scholar] [CrossRef]
- Mohammadpour, P.; Viegas, C. Applications of Multi-Source and Multi-Sensor Data Fusion of Remote Sensing for Forest Species Mapping. Adv. Remote Sens. For. Monit. 2022, 255–287. [Google Scholar] [CrossRef]
- Harzing, A.-W.; Alakangas, S. Google Scholar, Scopus and the Web of Science: A Longitudinal and Cross-Disciplinary Comparison. Scientometrics 2016, 106, 787–804. [Google Scholar] [CrossRef]
- Martín-Martín, A.; Orduna-Malea, E.; Thelwall, M.; López-Cózar, E.D. Google Scholar, Web of Science, and Scopus: A Systematic Comparison of Citations in 252 Subject Categories. J. Informetr. 2018, 12, 1160–1177. [Google Scholar] [CrossRef]
- Tober, M. PubMed, ScienceDirect, Scopus or Google Scholar–Which Is the Best Search Engine for an Effective Literature Research in Laser Medicine? Med. Laser Appl. 2011, 26, 139–144. [Google Scholar] [CrossRef]
- Rethlefsen, M.L.; Kirtley, S.; Waffenschmidt, S.; Ayala, A.P.; Moher, D.; Page, M.J.; Koffel, J.B. PRISMA-S: An Extension to the PRISMA Statement for Reporting Literature Searches in Systematic Reviews. Syst. Rev. 2021, 10, 39. [Google Scholar] [CrossRef]
- Page, M.J.; McKenzie, J.E.; Bossuyt, P.M.; Boutron, I.; Hoffmann, T.C.; Mulrow, C.D.; Shamseer, L.; Tetzlaff, J.M.; Akl, E.A.; Brennan, S.E. The PRISMA 2020 Statement: An Updated Guideline for Reporting Systematic Reviews. Int. J. Surg. 2021, 88, 105906. [Google Scholar] [CrossRef]
- Sarkis-Onofre, R.; Catalá-López, F.; Aromataris, E.; Lockwood, C. How to Properly Use the PRISMA Statement. Syst. Rev. 2021, 10, 117. [Google Scholar] [CrossRef]
- Zhao, Y.; Yin, X.; Fu, Y.; Yue, T. A Comparative Mapping of Plant Species Diversity Using Ensemble Learning Algorithms Combined with High Accuracy Surface Modeling. Environ. Sci. Pollut. Res. 2022, 29, 17878–17891. [Google Scholar] [CrossRef]
- Fang, P.; Ou, G.; Li, R.; Wang, L.; Xu, W.; Dai, Q.; Huang, X. Regionalized Classification of Stand Tree Species in Mountainous Forests by Fusing Advanced Classifiers and Ecological Niche Model. GIScience Remote Sens. 2023, 60, 2211881. [Google Scholar] [CrossRef]
- Song, G.; Wang, Q. Species Classification from Hyperspectral Leaf Information Using Machine Learning Approaches. Ecol. Inform. 2023, 76, 102141. [Google Scholar] [CrossRef]
- Tamiminia, H.; Salehi, B.; Mahdianpari, M.; Beier, C.M.; Johnson, L. Evaluating Pixel-Based and Object-Based Approaches for Forest Above-Ground Biomass Estimation Using a Combination of Optical, SAR, and AN Extreme Gradient Boosting Model. ISPRS Ann. Photogramm. Remote Sens. Spat. Inf. Sci. 2022, 3, 485–492. [Google Scholar] [CrossRef]
- Chusnah, W.N.; Chu, H.-J.; Jaelani, L.M. Machine-Learning-Estimation of High-Spatiotemporal-Resolution Chlorophyll-a Concentration Using Multi-Satellite Imagery. Sustain. Environ. Res. 2023, 33, 11. [Google Scholar] [CrossRef]
- David, R.M.; Rosser, N.J.; Donoghue, D.N. Improving above Ground Biomass Estimates of Southern Africa Dryland Forests by Combining Sentinel-1 SAR and Sentinel-2 Multispectral Imagery. Remote Sens. Environ. 2022, 282, 113232. [Google Scholar] [CrossRef]
- Guo, L.; Chehata, N.; Mallet, C.; Boukir, S. Relevance of Airborne Lidar and Multispectral Image Data for Urban Scene Classification Using Random Forests. ISPRS J. Photogramm. Remote Sens. 2011, 66, 56–66. [Google Scholar] [CrossRef]
- Higginbottom, T.P.; Symeonakis, E.; Meyer, H.; van der Linden, S. Mapping Fractional Woody Cover in Semi-Arid Savannahs Using Multi-Seasonal Composites from Landsat Data. ISPRS J. Photogramm. Remote Sens. 2018, 139, 88–102. [Google Scholar] [CrossRef]
- Immitzer, M.; Atzberger, C.; Koukal, T. Tree Species Classification with Random Forest Using Very High Spatial Resolution 8-Band WorldView-2 Satellite Data. Remote Sens. 2012, 4, 2661–2693. [Google Scholar] [CrossRef]
- Pascual, A.; Bravo, F.; Ordonez, C. Assessing the Robustness of Variable Selection Methods When Accounting for Co-Registration Errors in the Estimation of Forest Biophysical and Ecological Attributes. Ecol. Model. 2019, 403, 11–19. [Google Scholar] [CrossRef]
- Rajbhandari, S.; Aryal, J.; Osborn, J.; Lucieer, A.; Musk, R. Leveraging Machine Learning to Extend Ontology-Driven Geographic Object-Based Image Analysis (O-GEOBIA): A Case Study in Forest-Type Mapping. Remote Sens. 2019, 11, 503. [Google Scholar] [CrossRef]
- Scholl, V.M.; Cattau, M.E.; Joseph, M.B.; Balch, J.K. Integrating National Ecological Observatory Network (NEON) Airborne Remote Sensing and in-Situ Data for Optimal Tree Species Classification. Remote Sens. 2020, 12, 1414. [Google Scholar] [CrossRef]
- Shimizu, K.; Ota, T.; Mizoue, N. Detecting Forest Changes Using Dense Landsat 8 and Sentinel-1 Time Series Data in Tropical Seasonal Forests. Remote Sens. 2019, 11, 1899. [Google Scholar] [CrossRef]
- Xu, Z.; Shen, X.; Cao, L.; Coops, N.C.; Goodbody, T.R.; Zhong, T.; Zhao, W.; Sun, Q.; Ba, S.; Zhang, Z. Tree Species Classification Using UAS-Based Digital Aerial Photogrammetry Point Clouds and Multispectral Imageries in Subtropical Natural Forests. Int. J. Appl. Earth Obs. Geoinf. 2020, 92, 102173. [Google Scholar] [CrossRef]
- Ye, N.; Morgenroth, J.; Xu, C.; Chen, N. Indigenous Forest Classification in New Zealand–A Comparison of Classifiers and Sensors. Int. J. Appl. Earth Obs. Geoinf. 2021, 102, 102395. [Google Scholar] [CrossRef]
- Zhang, C.; Xie, Z. Data Fusion and Classifier Ensemble Techniques for Vegetation Mapping in the Coastal Everglades. Geocarto Int. 2014, 29, 228–243. [Google Scholar] [CrossRef]
- Zhang, F.; Tian, X.; Zhang, H.; Jiang, M. Estimation of Aboveground Carbon Density of Forests Using Deep Learning and Multisource Remote Sensing. Remote Sens. 2022, 14, 3022. [Google Scholar] [CrossRef]
- Finley, A.O.; Banerjee, S.; Cook, B.D.; Bradford, J.B. Hierarchical Bayesian Spatial Models for Predicting Multiple Forest Variables Using Waveform LiDAR, Hyperspectral Imagery, and Large Inventory Datasets. Int. J. Appl. Earth Obs. Geoinf. 2013, 22, 147–160. [Google Scholar] [CrossRef]
- Zhu, J.; Huang, Z.; Sun, H.; Wang, G. Mapping Forest Ecosystem Biomass Density for Xiangjiang River Basin by Combining Plot and Remote Sensing Data and Comparing Spatial Extrapolation Methods. Remote Sens. 2017, 9, 241. [Google Scholar] [CrossRef]
- Kozoderov, V.; Kondranin, T.; Dmitriev, E.; Kamentsev, V. Bayesian Classifier Applications of Airborne Hyperspectral Imagery Processing for Forested Areas. Adv. Space Res. 2015, 55, 2657–2667. [Google Scholar] [CrossRef]
- Karimi, D.; Akbarizadeh, G.; Rangzan, K.; Kabolizadeh, M. Effective Supervised Multiple-feature Learning for Fused Radar and Optical Data Classification. IET Radar Sonar Navig. 2017, 11, 768–777. [Google Scholar] [CrossRef]
- Lin, Y.; Hyyppä, J. A Comprehensive but Efficient Framework of Proposing and Validating Feature Parameters from Airborne LiDAR Data for Tree Species Classification. Int. J. Appl. Earth Obs. Geoinf. 2016, 46, 45–55. [Google Scholar] [CrossRef]
- Shahfahad; Talukdar, S.; Naikoo, M.W.; Rahman, A.; Gagnon, A.; Islam, A.R.M.T.; Mosavi, A. Comparative Evaluation of Operational Land Imager Sensor on Board Landsat 8 and Landsat 9 for Land Use Land Cover Mapping over a Heterogeneous Landscape. Geocarto Int. 2022, 38, 2152496. [Google Scholar] [CrossRef]
- Shi, S.; Xu, L.; Gong, W.; Chen, B.; Chen, B.; Qu, F.; Tang, X.; Sun, J.; Yang, J. A Convolution Neural Network for Forest Leaf Chlorophyll and Carotenoid Estimation Using Hyperspectral Reflectance. Int. J. Appl. Earth Obs. Geoinf. 2022, 108, 102719. [Google Scholar] [CrossRef]
- Wang, X.; Xiong, X.; Ning, C.; Shi, A.; Lv, G. Integration of Heterogeneous Features for Remote Sensing Scene Classification. J. Appl. Remote Sens. 2018, 12, 015023. [Google Scholar] [CrossRef]
- Mizuochi, H.; Hayashi, M.; Tadono, T. Development of an Operational Algorithm for Automated Deforestation Mapping via the Bayesian Integration of Long-Term Optical and Microwave Satellite Data. Remote Sens. 2019, 11, 2038. [Google Scholar] [CrossRef]
- Ahlswede, S.; Schulz, C.; Gava, C.; Helber, P.; Bischke, B.; Förster, M.; Arias, F.; Hees, J.; Demir, B.; Kleinschmit, B. TreeSatAI Benchmark Archive: A Multi-Sensor, Multi-Label Dataset for Tree Species Classification in Remote Sensing. Earth Syst. Sci. Data Discuss. 2022, 15, 681–695. [Google Scholar] [CrossRef]
- Forkel, M.; Drüke, M.; Thurner, M.; Dorigo, W.; Schaphoff, S.; Thonicke, K.; von Bloh, W.; Carvalhais, N. Constraining Modelled Global Vegetation Dynamics and Carbon Turnover Using Multiple Satellite Observations. Sci. Rep. 2019, 9, 18757. [Google Scholar] [CrossRef]
- Breidenbach, J.; Næsset, E.; Gobakken, T. Improving K-Nearest Neighbor Predictions in Forest Inventories by Combining High and Low Density Airborne Laser Scanning Data. Remote Sens. Environ. 2012, 117, 358–365. [Google Scholar] [CrossRef]
- Scholl, V.M.; McGlinchy, J.; Price-Broncucia, T.; Balch, J.K.; Joseph, M.B. Fusion Neural Networks for Plant Classification: Learning to Combine RGB, Hyperspectral, and Lidar Data. PeerJ 2021, 9, e11790. [Google Scholar] [CrossRef]
- Zhang, J.; Hu, X.; Dai, H.; Qu, S. DEM Extraction from ALS Point Clouds in Forest Areas via Graph Convolution Network. Remote Sens. 2020, 12, 178. [Google Scholar] [CrossRef]
- Tan, K.; Hu, J.; Li, J.; Du, P. A Novel Semi-Supervised Hyperspectral Image Classification Approach Based on Spatial Neighborhood Information and Classifier Combination. ISPRS J. Photogramm. Remote Sens. 2015, 105, 19–29. [Google Scholar] [CrossRef]
- Luo, H.; Khoshelham, K.; Chen, C.; He, H. Individual Tree Extraction from Urban Mobile Laser Scanning Point Clouds Using Deep Pointwise Direction Embedding. ISPRS J. Photogramm. Remote Sens. 2021, 175, 326–339. [Google Scholar] [CrossRef]
- Apostol, B.; Petrila, M.; Lorenţ, A.; Ciceu, A.; Gancz, V.; Badea, O. Species Discrimination and Individual Tree Detection for Predicting Main Dendrometric Characteristics in Mixed Temperate Forests by Use of Airborne Laser Scanning and Ultra-High-Resolution Imagery. Sci. Total Environ. 2020, 698, 134074. [Google Scholar] [CrossRef] [PubMed]
- Lu, C.; Xu, H.; Zhang, J.; Wang, A.; Wu, H.; Bao, R.; Ou, G. A Method for Estimating Forest Aboveground Biomass at the Plot Scale Combining the Horizontal Distribution Model of Biomass and Sampling Technique. Forests 2022, 13, 1612. [Google Scholar] [CrossRef]
- Chen, J.; Zhang, Z. An Improved Fusion of Landsat-7/8, Sentinel-2, and Sentinel-1 Data for Monitoring Alfalfa: Implications for Crop Remote Sensing. Int. J. Appl. Earth Obs. Geoinf. 2023, 124, 103533. [Google Scholar] [CrossRef]
- Inglada, J.; Vincent, A.; Arias, M.; Marais-Sicre, C. Improved Early Crop Type Identification by Joint Use of High Temporal Resolution SAR and Optical Image Time Series. Remote Sens. 2016, 8, 362. [Google Scholar] [CrossRef]
- Li, S.; Dragicevic, S.; Castro, F.A.; Sester, M.; Winter, S.; Coltekin, A.; Pettit, C.; Jiang, B.; Haworth, J.; Stein, A. Geospatial Big Data Handling Theory and Methods: A Review and Research Challenges. ISPRS J. Photogramm. Remote Sens. 2016, 115, 119–133. [Google Scholar] [CrossRef]
- Lu, D. The Potential and Challenge of Remote Sensing-based Biomass Estimation. Int. J. Remote Sens. 2006, 27, 1297–1328. [Google Scholar] [CrossRef]
- Morales-Barquero, L.; Lyons, M.B.; Phinn, S.R.; Roelfsema, C.M. Trends in Remote Sensing Accuracy Assessment Approaches in the Context of Natural Resources. Remote Sens. 2019, 11, 2305. [Google Scholar] [CrossRef]
- Stehman, S.V.; Foody, G.M. Key Issues in Rigorous Accuracy Assessment of Land Cover Products. Remote Sens. Environ. 2019, 231, 111199. [Google Scholar] [CrossRef]
- Rajah, P.; Odindi, J.; Mutanga, O.; Kiala, Z. The Utility of Sentinel-2 Vegetation Indices (VIs) and Sentinel-1 Synthetic Aperture Radar (SAR) for Invasive Alien Species Detection and Mapping. Nat. Conserv. 2019, 35, 41–61. [Google Scholar] [CrossRef]
- Sano, E.E.; Ferreira, L.G.; Huete, A.R. Synthetic Aperture Radar (L Band) and Optical Vegetation Indices for Discriminating the Brazilian Savanna Physiognomies: A Comparative Analysis. Earth Interact. 2005, 9, 1–15. [Google Scholar] [CrossRef]
- Millard, K.; Richardson, M. Quantifying the Relative Contributions of Vegetation and Soil Moisture Conditions to Polarimetric C-Band SAR Response in a Temperate Peatland. Remote Sens. Environ. 2018, 206, 123–138. [Google Scholar] [CrossRef]
- McNairn, H.; Champagne, C.; Shang, J.; Holmstrom, D.; Reichert, G. Integration of Optical and Synthetic Aperture Radar (SAR) Imagery for Delivering Operational Annual Crop Inventories. ISPRS J. Photogramm. Remote Sens. 2009, 64, 434–449. [Google Scholar] [CrossRef]
- Patel, P.; Srivastava, H.S.; Panigrahy, S.; Parihar, J.S. Comparative Evaluation of the Sensitivity of Multi-polarized Multi-frequency SAR Backscatter to Plant Density. Int. J. Remote Sens. 2006, 27, 293–305. [Google Scholar] [CrossRef]
- Chuai, X.; Huang, X.; Wang, W.; Bao, G. NDVI, Temperature and Precipitation Changes and Their Relationships with Different Vegetation Types during 1998–2007 in Inner Mongolia, China. Int. J. Climatol. 2013, 33, 1696–1706. [Google Scholar] [CrossRef]

| Search Criteria | Database | Number |
|---|---|---|
| TS = (Forest) OR TS = (Biomass) OR TS = (Above ground biomass) OR TS = (Type)) AND TS = (Machine learning) AND TS = (Fusion) AND (TS = (Remote Sensing) OR TS = (Satellite) OR TS = (SAR) OR TS = (Lidar) OR TS = (Optical)) NOT TS = (Height) NOT TS = (Crop *) NOT TS = (Farm *) NOT TS = (Salinity) NOT TS = (Plantation) NOT TS = (Sea) NOT TS = (Earthquake) NOT TS = (Urban) NOT TS = (Snow) NOT TS = (Habitat) NOT TS = (Geological) NOT TS = (Fire) | Web of Science | 195 |
| (Forest OR Biomass) AND remote sensing AND fusion AND Machine Learning NOT (habitat OR fire OR Crop OR Land) | Science Direct | 679 |
| forest biomass satellite data fusion machine learning fusion, OR image OR fusion, OR multisource “remote sensing machine learning” | Google Scholar | 46 |
| Combination | Number |
|---|---|
| Optical & Radar | 16 |
| Optical & LiDAR | 6 |
| Hyperspectral & LiDAR | 5 |
| Optical & Hyperspectral | 9 |
| Optical & Field Data | 9 |
| LiDAR & Field Data | 6 |
| Hyperspectral & Field Data | 10 |
| Only Radar | 2 |
| Only Optical | 1 |
| All type | 2 |
| Name of Algorithm | Reference |
|---|---|
| Least Absolute Shrinkage and Selection Operator (Lasso) | [70] |
| Ridge Regression (Ridge) | [70] |
| Extreme Gradient Boosting (Xgboost) | [47,48,70,71,72,73] |
| Random Forest (RF) | [8,11,19,29,31,32,33,34,41,42,43,44,47,48,49,50,52,53,54,55,56,57,61,70,71,72,73,74,75,76,77,78,79,80,81,82,83,84,85,86] |
| Multivariate Adaptive Regression Splines | [50] |
| Multivariate Linear Regression | [49,50,51,75,79,86,87,88] |
| Gram Schmidt (GS) | [11] |
| Nearest Neighbor Diffusion Pan Sharpening (NND) | [11] |
| Wavelet Resolution Merge (WRM) | [11] |
| Brovey Transform (BT) | [89] |
| Support Vector Machine (SVM) | [19,33,34,51,52,53,54,55,61,71,76,84,85,86,89,90,91,92,93,94] |
| Artificial Neural Network (ANN) | [3,19,34,41,54,84,89] |
| Bayesian Classifier | [87,89,95] |
| Light Gradient Boosting (LightGBM) | [41,47,72,96] |
| Deep Neural Network | [53] |
| Dynamic Global Vegetation Models (Dgvms) | [97] |
| K-Nearest Neighbor (KNN) | [41,56,79,87,88,93,98] |
| U-NET | [56] |
| Decision Tree (DT) | [8,54] |
| Maximum Likelihood Classification | [89] |
| Dynamic Global Vegetation Models (Dgvms) | [97] |
| Convolution Neural Network (CNN) | [57,58,86,93,99,100] |
| Robust Regression | [8] |
| Decision Stump | [8] |
| Gradient Boosting | [40,48] |
| Linear Discriminant Analysis And Sparse Regularisation (LDASR) | [90] |
| Random Subspace (RS) | [90] |
| Deeplabv3+ | [59] |
| Hrnet Deep Learning Algorithms | [59] |
| Multi-Layer Perceptron (MLP) | [45,96] |
| Gaussian Process Regression (GPR) | [51,93] |
| Breaking Ties (BT) Methods | [101] |
| Multinomial Logistic Regression (MLR) | [101] |
| Pointwise Direction Embedding Deep Network (PDE-Net) | [102] |
| Classification and Regression Tree (CART) | [19] |
| PROSAIL-PRO Model | [53] |
| Monte Carlo Simulations | [103] |
| Plot-Scale Methodology (AGB & Biomass Horizontal Distribution Model (HDM)) | [104] |
| K-DBN Algorithm | [49] |
| Weighted CW-Knn And G-Knn | [88] |
Disclaimer/Publisher’s Note: The statements, opinions and data contained in all publications are solely those of the individual author(s) and contributor(s) and not of MDPI and/or the editor(s). MDPI and/or the editor(s) disclaim responsibility for any injury to people or property resulting from any ideas, methods, instructions or products referred to in the content. |
© 2025 by the authors. Licensee MDPI, Basel, Switzerland. This article is an open access article distributed under the terms and conditions of the Creative Commons Attribution (CC BY) license (https://creativecommons.org/licenses/by/4.0/).
Share and Cite
Saim, A.A.; Aly, M.H. Fusion-Based Approaches and Machine Learning Algorithms for Forest Monitoring: A Systematic Review. Wild 2025, 2, 7. https://doi.org/10.3390/wild2010007
Saim AA, Aly MH. Fusion-Based Approaches and Machine Learning Algorithms for Forest Monitoring: A Systematic Review. Wild. 2025; 2(1):7. https://doi.org/10.3390/wild2010007
Chicago/Turabian StyleSaim, Abdullah Al, and Mohamed H. Aly. 2025. "Fusion-Based Approaches and Machine Learning Algorithms for Forest Monitoring: A Systematic Review" Wild 2, no. 1: 7. https://doi.org/10.3390/wild2010007
APA StyleSaim, A. A., & Aly, M. H. (2025). Fusion-Based Approaches and Machine Learning Algorithms for Forest Monitoring: A Systematic Review. Wild, 2(1), 7. https://doi.org/10.3390/wild2010007