Simple Summary
Mangrove forests are vital coastal ecosystems that provide invaluable services, such as coastal erosion protection, biodiversity conservation, and carbon sequestration. In Benoa Bay, Bali, Indonesia, these ecosystems are facing increasing pressure from urbanization, infrastructure development, and tourism. This study utilized satellite imagery to assess changes in mangrove canopy cover between 2013 and 2023 and linked them to mangrove management policies. While some areas have experienced declines due to development pressures of supporting infrastructure for urban areas and tourism facilities, others have benefited from reforestation efforts, resulting in an overall slight decrease in mangrove area. Encouragingly, many areas have witnessed an increase in canopy cover, as indicated by remote sensing vegetation indices. Conservation policies, including the establishment of protected areas, have contributed to these positive outcomes, although challenges remain due to gaps in law enforcement. This study underscores the importance of strengthening policy integration, enhancing monitoring efforts, and fostering community engagement to ensure the long-term sustainability of Benoa Bay’s mangrove ecosystems.
Abstract
(1) Background: Mangroves are critical ecosystems that provide essential services, including coastal protection, biodiversity support, and carbon storage. However, urbanization and infrastructure development increasingly threaten their sustainability. This study investigates the spatio-temporal trends of mangrove canopy cover in Benoa Bay, Bali, Indonesia, which is an urban area and a center of tourism activities with various supporting facilities. The analysis was conducted from 2013 to 2023, using Landsat 8 satellite imagery and Normalized Difference Vegetation Index (NDVI) analysis. In addition, the analysis was also linked to mangrove area management policies. (2) Methods: The annual NDVI time series based on Landsat 8 imagery, obtained through the Google Earth Engine (GEE), was used to characterize the vegetation canopy cover in the study area. Statistical analysis of the annual linear trend of the NDVI was conducted to examine the spatio-temporal variation in canopy cover. Additionally, policies related to regional spatial planning and area protection were analyzed to assess their role in preserving mangrove forests in urban areas. (3) Results: There was a net decrease in mangrove area in Benoa Bay of 3.97 hectares, mainly due to infrastructure development and tourism facilities. The NDVI trend shows an overall increase in canopy cover due to reforestation and natural regeneration efforts, although there was a local decrease in some areas. Conservation policies, such as the establishment of the Ngurah Rai Forest Park, have supported mangrove protection. (4) Conclusions: The analysis demonstrated that mangroves surrounded by urban areas and tourism activity centers can still be maintained quite well with the right policies.
1. Introduction
Mangroves are an important and unique ecosystem found at the intersection of intertidal areas. These forests provide high-value ecosystem services, including coastal protection, habitat provision, and blue carbon storage, and they play a critical role in climate change mitigation [1,2]. Mangroves can preserve a maximum of five times the organic carbon that tropical terrestrial forests do [3]. Moreover, the greenhouse gas (GHG) mitigation advantages of preserving mangroves in Tiwoho, Indonesia, could be three times more than those of terrestrial forest carbon initiatives, and within eleven years, two-thirds of project costs might be recovered, at a 7.6% annual return [4]. Rizal et al. in 2018 also revealed that the mangrove ecosystem has high economic value, with the valuation estimation ranging from USD 3624.98 to USD 26,734.61/hectare/year [5]. Despite its critical functions, the mangrove ecosystem is threatened by anthropogenic activities such as coastal development, aquaculture expansion, and other actions leading to deforestation and habitat loss [6]. Indonesia, one of the countries with the highest mangrove coverage in the world, lost about 30% of its mangroves between 1980 and 2005 [7,8]. Arifanti et al. [9] reported that mangrove deforestation in Indonesia from 2009 to 2019 reached 182,091 hectares. The deforestation trend increased during the 2015–2019 period. However, several Indonesian regions, including the Madura Strait in East Java [10] and Perancak in Bali [11], have successfully expanded their mangrove forest areas. In the Madura Strait, this expansion primarily occurred naturally, particularly around river estuaries and abandoned fish pond areas. In contrast, the mangrove expansion in Perancak was predominantly due to successful reforestation efforts.
Benoa Bay, located south of Bali Island, is a mangrove ecosystem with high anthropogenic pressure and deterioration. This bay has a large mangrove forest covering 1132 hectares but suffers from sedimentation and nutrient pollution caused by complex activities and urban and tourism development [12,13,14]. In 2012, the Republic of Indonesia’s central government and Bali’s provincial governments built the Bali Mandara highway, constructed above the sea and located around the mangrove area of Benoa Bay. This has led to a significant increase in anthropogenic pressure on this urban mangrove ecosystem. The situation is further compounded by the rapid and unchecked growth of development in the surrounding area. Moreover, this site is surrounded by urban areas and tourist centers. Consequently, developing coastal areas and infrastructure around the Benoa Bay forest ecosystem exerts high pressure, making it susceptible to damage [15].
With such high ecosystem pressure, it is necessary to carry out periodic monitoring of mangrove forest cover in Benoa Bay. A study on the damage to the Benoa Bay mangrove forest was conducted by Anggraini et al. [16], derived from a vegetation index using SPOT 6 imagery. The study results show that 2.81% of the Benoa Bay mangrove forest is in a damaged condition. Another study by Purwanto et al. [17] focused on modeling the spatio-temporal dynamics of the mangrove ecosystem in the Benoa Bay Mangrove Forest. The research used supervised classification to identify mangrove and non-mangrove areas and applied the Normalized Difference Vegetation Index (NDVI) to calculate mangrove canopy cover density [17]. Landsat images from 1995, 2015, and 2019 were analyzed to assess the condition and density of the mangrove forest. The results indicate an increase of about 0.22% in mangrove coverage during the 1995–2015 period, while the 2015–2019 period showed a decrease of about 0.06%. A study by Yastika et al. [18] analyzed changes in mangrove coverage using Landsat 7 ETM+ and Landsat 8 OLI imagery from 2002, 2014, and 2021. The results of this study show that the total mangrove coverage decreased by approximately 19.6 ha (1.78%) from 2002 to 2021 [18]. However, previous studies have not yet examined the annual trends in mangrove forest vegetation canopy cover, which are crucial for monitoring changes in canopy cover as an indicator of mangrove health [14]. With technological advancements, the analysis of medium-resolution remote sensing data, such as Landsat imagery, can be effectively conducted using Google Earth Engine (GEE), as demonstrated in the Indian Sundarbans National Park [19]. Nonetheless, that study did not explore the relationship between these trends and government regulations. Thus, this study explores the synergies between the annual trends of mangrove canopy cover and national and local policy interventions to restore mangrove forests.
The effective management of mangrove areas is significantly shaped by the presence and enforcement of governmental policies within a specific region. According to Nuarsa et al. [20], government policies, such as regional spatial plans, can serve as key determinants in facilitating or restricting land-use conversion. Moreover, these policies often evolve in response to the changing dynamics of regional development. While policies are instrumental in safeguarding such areas through enforcement mechanisms, they can also negatively impact environmental conditions when permits are issued without sufficient environmental assessment and analysis. For instance, Indonesia has set a target to rehabilitate 600,000 hectares of mangroves by 2024 [21]. This initiative aligns with the United Nations Decade of Ecosystem Restoration (2021–2030) and demonstrates the international conservation community’s commitment to increasing the area of mangroves by 20% by 2030 [21]. Also, the increased involvement of subnational governments in mangrove management is a crucial factor in the success of this initiative, as it brings local knowledge and resources to the table [22]. Coupled with improved monitoring and evaluation, this local participation will enhance the chances of meeting these commitments and reduce the risk of failure [22]. Currently, this program is supported through the Mangroves for Coastal Resilience (M4CR) project by the development partner of the World Bank. The initiative will be applied until 2027 and will assist with policy and institutional improvements for enhanced mangrove management, with a massive rehabilitation of degraded and deforested mangrove forests, providing better economic prospects for coastal inhabitants [23].
This study aims to analyze the annual trends in changes to mangrove canopy cover using Landsat 8 remote sensing data in the southern urban area of Bali, Indonesia, specifically focusing on the mangrove area of Benoa Bay. Additionally, the research evaluates the effectiveness of conservation and management policies in preserving this critical mangrove ecosystem in the face of increasing human pressures. The findings are intended to provide essential data on the condition of the mangrove forest ecosystem, particularly regarding the canopy cover in the Benoa Bay mangrove forest. This information will contribute to preservation efforts for the mangrove ecosystem amid urban development and anthropogenic activities.
2. Materials and Methods
2.1. Research Location
The research focuses on the mangrove area located in Benoa Bay. Benoa Bay is a semi-enclosed micro tidal body of water, which encompasses a total area of approximately 3415 hectares within the inner bay, including water areas, mangroves, and intertidal zones, and is situated at coordinates 8°42′28′′–8°47′46′′ south latitude and 115°10′21′′–115°14′52′′ east longitude. Administratively, Benoa Bay lies within Badung Regency and Denpasar City, Bali Province. Benoa Bay, the largest bay in the southern region of Bali Island, is placed south of Denpasar, the capital city of Bali Province. This bay is bordered by key tourism hubs, including Kuta, Nusa Dua, and Jimbaran in Badung Regency, as well as Sanur and Serangan in Denpasar. Additionally, Benoa Bay hosts Benoa Port, the largest port in Bali Province, and lies in proximity to Ngurah Rai International Airport, the island’s main airport. The bay is also adjacent to significant infrastructure, such as Bali’s largest landfill site, a wastewater treatment facility (DSDP), and the estuaries of several rivers, including the Badung and Mati Rivers, which flow through the capital city and tourism center. Nevertheless, this mangrove region is crucial as a conservation area, supporting the health of coastal and marine ecosystems by acting as a natural shield against erosion and storm surges, thereby protecting nearby communities from climate-related risks. Ecologically, the mangrove forests of Benoa Bay are vital habitats for various marine and terrestrial species and play a significant role in biodiversity preservation and supporting local fisheries by providing spawning and nursery grounds, thereby contributing to the region’s economic sustainability. In this bay, approximately 19 species of mangroves were identified [24], primarily dominated by Rhizophora sp., Sonneratia sp., and Bruguiera sp. [14]. Climatically, Benoa Bay is characterized by a tropical climate, with its weather patterns shaped by the Asian-Australian monsoon. Peak rainfall is recorded from December to February, aligning with the western monsoon, whereas the driest period occurs during the southeast monsoon, typically in July and August [25]. The region experiences an annual total rainfall of 1803.62 mm and an average yearly temperature of 27.6 °C [26]. The research location overview can be seen in Figure 1.
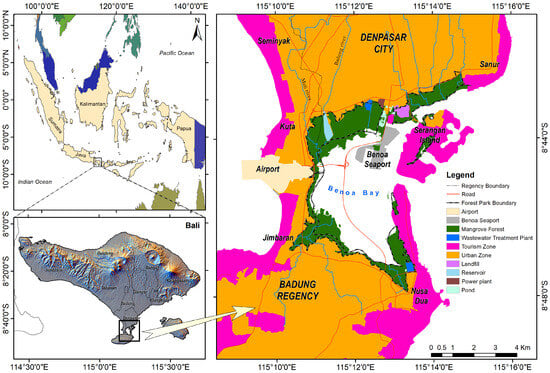
Figure 1.
Research location of mangrove area in Benoa Bay, Bali, Indonesia.
2.2. Data Uses
The primary data source for this study is the Landsat 8 Operational Land Imager (OLI), with a spatial resolution of 30 m and revisit period (temporal resolution) of 16 days. We retrieved the Tier-1 Surface Reflectance (SR) images from the USGS website through the GEE platform, a web-based application that allows data retrieval and processing using JavaScript. A temporal filter was applied to the data, covering 2013 to 2023.
For preprocessing, we masked clouds and cloud shadows and selected clear pixels using bitwise operations on the Quality Assessment (QA) bands provided in the Level 2 data. While a cloud filter from the metadata was not applied to the entire dataset, we retained only the pixels not identified as clouds in the QA bands and subsequently composited the images using the median operation. We performed a yearly median synthesis data reducer composite for each year from the image collection to construct annual summaries.
The spatial extent of the Landsat 8 imagery in this study covers the Mangrove Area in Benoa Bay, situated in Badung Regency and Denpasar City, Bali Province. This area, which includes a vast mangrove ecosystem along Bali’s southern coast, benefits from the 30 m spatial resolution of Landsat 8, making it particularly suitable for capturing the detailed conditions within the mangrove ecosystem. These high-resolution data allow for an in-depth analysis of vegetation and land cover changes at the landscape level, including the distribution and density of mangrove vegetation as an integral part of the Benoa Bay coastal ecosystem.
After aligning the data with the specified period and cropping them to the predefined mangrove area boundaries, we conducted statistical processing of the image bands. This processing was based on vegetation index equations designed to detect mangrove vegetation, facilitating an accurate and detailed assessment of the spatial and temporal dynamics within the mangrove ecosystem over the study period.
The process of delineating the mangrove area involved the combined mangrove extents for 2013 and 2023. To spatially distinguish mangrove from non-mangrove features, an on-screen digitization approach was employed using Google Earth Pro (GEP) imagery, with the time slider adjusted to cover the period between 2013 and 2023. Mangrove features were identified based on our local knowledge (our interpretation key for mangroves) of Benoa Bay mangrove area. The visual interpretation process was also supported by employing nine key elements of remote sensing data interpretation [27]. The resulting polygons were constructed in GEP and exported in Keyhole Markup Language (KML) format. These mangrove extent data were later used to change and clip features for further analysis. The use of high-resolution GEP imagery for mapping mangroves and coastal resources has been employed by previous studies [28,29]. In particular, on-screen digitization of GEP imagery has proven to be a highly accurate method for mapping the spatial distribution of mangroves compared to other techniques [30].
2.3. Research Framework
Figure 2 illustrates the methodological process for assessing the annual canopy trend over a 10-year period in Benoa Bay, Bali, and its implications for mangrove management policies. We utilized a remote sensing dataset with a 30 m spatial resolution from Landsat images collected between 2013 and 2023 to estimate the Normalized Difference Vegetation Index (NDVI) as an indicator of mangrove canopy cover. Since the NDVI can also reflect the presence of terrestrial plants, we conducted a visual interpretation to specifically delineate the mangrove area for the canopy cover analysis. The visual analysis can be carefully checked by examining high-resolution satellite imagery or looking at imagery from many auxiliary spatial datasets, a method also employed in previous studies, such as those by Gaveau et al. [31] and Kiswanto et al. [32]. Following this, we performed a trend analysis of canopy cover within the mangrove regions. Finally, based on the trend analysis results, we conducted a descriptive study of relevant national and local policies, utilizing grey literature that included national and local regulations, the Bali Mid-term Regional Plan, and various project reports.
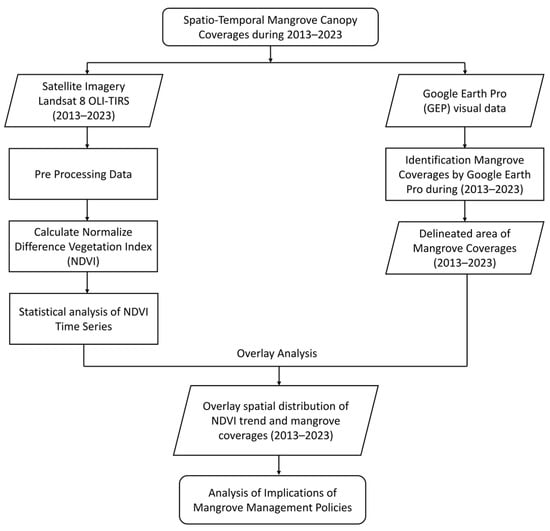
Figure 2.
Research framework for assessing the trend of mangrove canopy cover and its policy implications in Benoa Bay, Bali, Indonesia.
2.4. Data Analysis
Derived from the visual interpretation of mangrove extents derived from GEP data for 2013 and 2023, we analyzed changes in mangrove extent by overlaying the two datasets to understand the transitions between mangrove and non-mangrove features. The areas were subsequently classified based on the observed changes, categorized as gains (transition from non-mangrove to mangrove), no change (consistent presence of mangroves), and losses (transitions from mangrove to non-mangrove). Furthermore, changes in mangrove area were quantified using the visual interpretation data, as described previously. The mangrove area change was calculated using Equation (1), which is defined as follows:
where MAC (ha) represents the change in mangrove area, measured in hectares, between time t (the current year) and time t − 1 (the previous year). The MAt and MAt−1 denote the total mangrove area in hectares at time t (current year) and time t − 1 (previous year), respectively.
Additionally, we calculated vegetation index for each year’s imagery to support temporal analysis. The vegetation index, namely the Normalized Different Vegetation Index (NDVI), was used. The NDVI has a strong relationship with the percentage of mangrove canopy cover [33]. The equation for the NDVI calculation is as follows [34]:
where the near-infrared (NIR) channel in Landsat 8 spectral images ranges from 850 nm to 880, and the Red channel ranges from 640 nm to 670 nm. The data processing was conducted using GEE, resulting in annual NDVI datasets for the study period.
To ensure consistency in the analysis of mangrove areas, a combined (overlay) mangrove area boundary for 2013 and 2023, previously interpreted using GEP, was utilized to define mangrove boundaries during the observation year and that used to clip NDVI values from Landsat 8 imagery for each year between 2013 and 2023. The clipped NDVI data enabled the calculation of annual NDVI values specific to the delineated mangrove areas, facilitating the detection and analysis of trends in mangrove canopy cover over time. Temporal patterns and rates of change in mangrove canopy cover were subsequently evaluated through a time-series analysis of the NDVI data spanning the study period.
Statistical metrics, including the mean, standard deviation, variance, and linear trend, were calculated using the personal basic version of WPS Office software version 11.2.0.8934. The rate of change was determined by applying a linear regression model to estimate the slope of the relationship between NDVI values and year. The statistical significance of these trends was assessed using a p-value of 0.05, corresponding to a 95% confidence level. This linear regression model was further applied on a per-pixel basis to assess spatial trends, providing a detailed understanding of mangrove canopy cover dynamics across the study area.
To assess the implications of policies on mangrove management, this study employed library research methods to examine the regulatory framework governing mangrove management in Benoa Bay. According to Zed [35], library research encompasses the processes of data collection, data processing, data analysis, and the presentation of findings. In this research, a systematic approach was taken to evaluate the role of policies in the management of mangrove forests in Benoa Bay, involving the following steps: (1) collecting relevant regulations and literature on mangrove management in Indonesia, with a particular focus on Bali Province; (2) studying these regulations and literature and extracting the information specifically related to the management of mangroves in Benoa Bay; and (3) interpreting and analyzing this information in relation to the dynamics of mangrove forest park management within the bay. Upon completing these processes, we proceeded with a descriptive analysis to evaluate the influence of policies on mangrove forest management. It is important to note that the policies examined in this study were confined to specific regulations relevant to mangrove forest management in Benoa Bay. These included the Minister of Forestry’s regulations concerning the establishment of Ngurah Rai Forest Park in Benoa Bay, as well as spatial planning regulations for the SARBAGITA metropolitan area (an acronym representing Denpasar, Badung, Gianyar, and Tabanan of Bali Province), the spatial planning framework for Bali Province, and the spatial planning regulations for Badung Regency and Denpasar City. This focused approach allows for a detailed understanding of how these specific policies shape the management practices within this vital ecosystem. The method used in this study was previously employed by Drasospolino et al. [36] to analyze the impact of forest management policies on the utilization of forest areas in Yogyakarta. Due to limited access to obtain the original spatial data of Ngurah Rai Forest Park from the Indonesian Ministry of Environment and Forestry, which is part of the policy analysis, we digitized the forest park boundary using on-screen digitation based on the map provided by Sutiarso et al. [37].
3. Results
3.1. Changes in Mangrove Area in Benoa Bay from 2013 to 2023
Figure 3 illustrates changes in mangrove coverage in Benoa Bay from 2013 to 2023. As shown in the figure and detailed in Table 1, the total mangrove area in Benoa Bay declined from 1172.04 hectares in 2013 to 1168.06 hectares in 2023, representing a net reduction of 3.97 hectares over the eleven-year period, or a decrease of 0.34% from the mangrove area in 2013. Badung Regency experienced a more significant decline, losing 10.91 hectares (−1.82%), decreasing from 601.04 hectares in 2013 to 590.13 hectares in 2023. In contrast, Denpasar City recorded an increase of 6.94 hectares (1.22%), with mangrove coverage expanding from 571.00 hectares to 577.94 hectares.
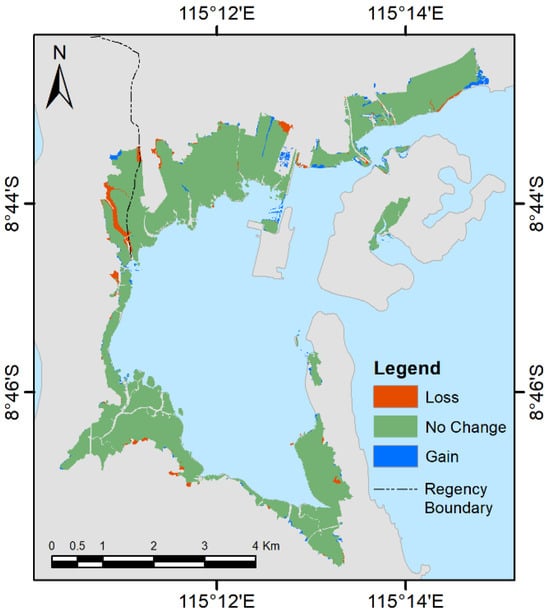
Figure 3.
Changes of mangrove area in Benoa Bay from 2013 to 2023.

Table 1.
Mangrove area change from 2013 to 2023.
Figure 3 also highlights the spatial distribution of these changes: areas of mangrove gain, indicated in blue, are dispersed along the coastline of Benoa Bay, whereas areas of mangrove loss, marked in red, are concentrated near infrastructure development zones. The mangrove loss in Badung Regency was primarily driven by infrastructure development, including the expansion of I Gusti Ngurah Rai International Airport in 2013 and the widening of the Mati River channel beginning in 2017. Previously, by late 2014, the mangrove areas around the Mati River estuary experienced losses in cover due to riverbank normalization activities. Additional contributors included the construction of parking facilities near the mangrove tourism area between 2019 and 2022 (near the reservoir, see Figure 1), as well as the development of residential areas in the southern region of the regency. Conversely, the increase in mangrove coverage in Denpasar City can be largely attributed to reforestation initiatives undertaken in coastal zones, particularly along the interface between the mangroves and the sea. Additionally, natural mangrove regeneration was observed in previously vegetated areas, such as river channels, although on a smaller scale. Furthermore, urban-related infrastructure development contributed to mangrove loss within Denpasar City. The conversion of mangrove areas for establishing a power plant in 2013 had a detrimental impact on mangrove coverage.
3.2. Mangrove Vegetation Canopy Cover Trend
The annual mangrove canopy cover analysis results from 2013 to 2023 are presented in Figure 4, which depicts the annual NDVI distribution in Benoa Bay derived from the image median synthesis data reducer of Landsat 8. Figure 5 presents the spatial distribution trend of NDVI values, while Figure 6 illustrates the statistical trend of annual NDVI values including the minimum, maximum, mean, and standard deviation for each year of the study period. Overall, average NDVI values show an increasing trend from 2013 to 2023, despite a significant drop in 2018. However, the maximum NDVI value demonstrates a declining pattern during the same period. This indicates a reduction in mangrove density in previously highly dense areas, suggesting potential localized degradation or changes in the structure of the mangrove ecosystem.
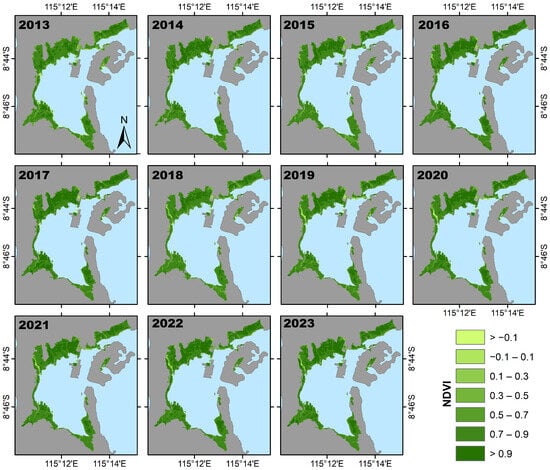
Figure 4.
Annual NDVI distribution in Benoa Bay based on image median synthesis data reducer performed in GEE.
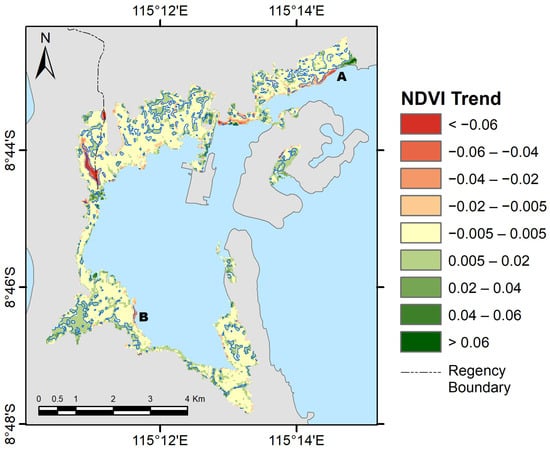
Figure 5.
Spatial distribution of annual mangrove NDVI trends in Benoa Bay, derived from the annual composite from Landsat 8 imagery. Blue lines indicate statistically significant trends at the 95% confidence level. Locations that were difficult to identify by name during the analysis are designated as ‘A’ and ‘B’ for clarity.
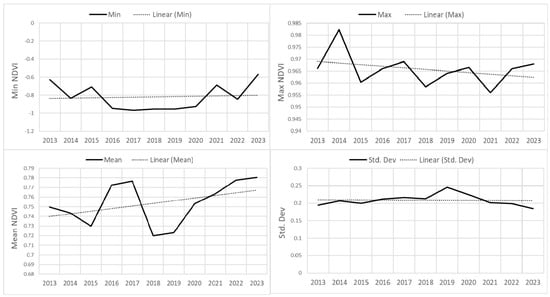
Figure 6.
Statistical trend of annual NDVI values over the decade: minimum NDVI (top left), maximum NDVI (top right), mean NDVI (bottom left), and standard deviation of NDVI (bottom right).
Figure 5 illustrates the spatial distribution of annual NDVI trends from Landsat 8 within the Benoa Bay mangrove area between 2013 and 2023. NDVI trends are interpreted as indicators of changes in the density of mangrove vegetation canopies, reflecting either an increase or decrease in canopy cover. The figure indicates that while a significant increasing trend (21.83% of the total mangrove area) is the dominant pattern across the study area (with a confidence level of 95%), several locations exhibit a notable downward trend (4.96% of the total mangrove area). Specifically, a pronounced decreasing trend in NDVI values (<−0.005) is predominantly observed in the northwest of Benoa Bay, particularly around the Mati River estuary (see detail location by place name in Figure 1), as well as along the northeast side of Benoa Bay, notably near areas bordering the sea. Conversely, an increasing trend in NDVI values (>0.005) is more widespread compared to the areas of decline. This significant upward trend is evident in the southwest of Benoa Bay, the east side of the airport, the mangrove areas within Serangan Island, the northern part of Benoa Bay, and the easternmost section of the study area. The declining trend in NDVI values, particularly in areas A and B (see Figure 5), occurred in naturally growing mangroves dominated by the Sonneratia sp. species. In the southern part of the Landfill, the observed decline in NDVI can be attributed to a phenomenon of mangrove die-off, primarily influenced by sedimentation processes linked to the Benoa Port development from 2018 to 2019. A decrease was also observed in the Mati River estuary, where the river was widened to accelerate the flow and prevent flooding, particularly in tourism areas in the north part of the Mangrove area. This modification may be a factor contributing to the decrease in mangrove canopy cover in this area. The development of tourism support facilities on Serangan Island may have contributed to a slight decrease in mangrove canopy cover in a small portion of the region. However, most areas exhibit a trend of increasing NDVI values. Nevertheless, the decrease of mangrove area in the northwest of the Badung River estuary may be influenced by estuary maintenance and the creation of parking areas to support estuary and mangrove nature tourism in the region. The results also indicate an increase in mangrove canopy cover across several areas. The natural enhancement of mangrove canopy cover is particularly evident in the central part of the mangrove zone, where ecological conditions likely support the natural regeneration and growth of mangroves.
Conversely, expansion of mangrove coverage was observed in the mangrove area north of Benoa Seaport, the part near the sea on the south side of the landfill, and the western part of location A. The expansion is primarily attributed to active reforestation initiatives. These efforts, which involve the strategic planting and management of mangroves, aim to rehabilitate degraded ecosystems, enhance biodiversity, and strengthen coastal resilience.
Figure 6 presents the annual trend of NDVI values. The linear pattern demonstrates an overall increasing trend in annual NDVI values from 2013 to 2023. The highest mean NDVI value occurred in 2023, at 0.78, and the lowest mean NDVI was found in 2018, at 0.72. However, annual fluctuations reveal a decline in values during 2018 and 2019, followed by a recovery in 2020. This decline is likely associated with a mass mangrove die-off in the Pesanggaran area, which is suspected to have resulted from sedimentation caused by dredging activities at Benoa Port [38]. The NDVI distribution pattern (Figure 3) also indicates a reduction in NDVI values in specific locations during 2018, notably in the downstream area of the Mati River. Although the mean NDVI values show an increasing trend, the maximum NDVI values exhibit a declining trend over a decade. The highest maximum NDVI over decades was found in 2014, at 0.98; the lowest maximum NDVI value was found in 2021, at 0.96. This indicates that some mangrove areas in excellent condition are gradually experiencing degradation. The minimum values and standard deviation do not show a significant change in trend. The minimum NDVI values show a slight decrease in 2016 and a recovery after 2019, suggesting a recovery of mangrove conditions over the past four years in areas with poor conditions. Similarly, the standard deviation values show no significant changes, except for fluctuations in 2019. The fluctuation indicates an increased variability in NDVI values caused by changes in mangrove conditions. While the linear pattern generally indicates an upward trend in annual NDVI values from 2013 to 2023, except the maximum NDVI values, statistical analysis using linear regression reveals that this trend is not significant (p-value > 0.05). The lack of statistical significance is likely due to 73.22% of the mangrove area exhibiting no substantial trend, as shown in Figure 5.
3.3. Implications of Mangrove Management Policies
A spatio-temporal analysis of mangrove canopy cover in Benoa Bay reveals a complex dynamic linked to the region’s management policies. A significant policy was establishing Ngurah Rai Forest Park (Tahura, an acronym representing Taman Hutan Raya) by the Ministry of Forestry through Decree No. 544/Kpts-II/1993. This policy aimed to protect the mangrove area near urban areas and tourist destinations, serving as an ecological buffer zone and green open space. According to the decree, the Ngurah Rai Forest Park encompasses an area of 1373.5 hectares, including the Convertible Production Forest, a type of forest that can be converted for other uses, predominantly situated within the waters of Benoa Bay, where the Convertible Production Forest area was not analyzed in this study. An overlay analysis between the mangrove area and the forest park, as depicted in Figure 7, reveals that the extent of the mangrove area inside the forest park was 916.95 hectares in 2013. However, despite the primary conservation goal, research findings indicate a 23.31 hectares decline in mangrove coverage within the forest park between 2013 and 2023, leaving the mangrove area at 905.42 hectares. This decrease is primarily attributed to infrastructure development, as displayed in sub-chapter 3.1, where the situation reflects the dilemma between conservation efforts and the need for economic growth in this strategic area.
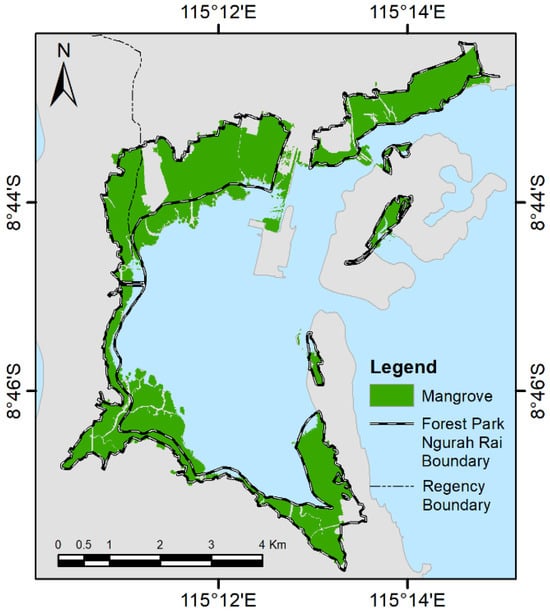
Figure 7.
The boundary of the Ngurah Rai Forest Park area that overlaid Benoa bay’s mangrove forest area from 2013 to 2023. The black/white line is the boundary of the Ngurah Rai Forest Park.
Beyond the forest park policy, mangrove areas outside the forest park are governed by several regulations, including Presidential Regulation No. 51 of 2014 on the Spatial Plan for the Urban Areas of Denpasar, Badung, Gianyar, and Tabanan (SARBAGITA metropolitan). This regulation designates mangroves as coastal and small island conservation areas, reinforced by Denpasar City Regional Regulation No. 27 of 2011 on the Spatial Plan for Denpasar City 2011–2031, as well as the Bali Provincial Spatial Plan No. 16 of 2009 and Badung Regency Spatial Plan No. 26 of 2013, respectively. Nevertheless, mangrove area outside the forest park increased from 255.09 hectares in 2013 to 262.64 hectares in 2023, with a net increase of 21.16 hectares. This increase indicates ongoing mangrove rehabilitation efforts and growing awareness of the importance of mangrove ecosystems as natural protectors against abrasion and other environmental disasters. However, challenges persist, primarily due to the loss of 13.61 hectares of mangrove area outside the forest park, caused mainly by infrastructure development.
Overall, this research demonstrates that mangrove management in Benoa Bay, directly adjacent to the urban area and center of tourism activity, faces significant challenges in balancing environmental conservation and economic development. The decline in mangrove area within forest parks highlights the need for a policy review, particularly in infrastructure development within conservation areas. On the other hand, the increase in mangrove area outside forest parks reflects the positive potential of conservation policies supported by various regional regulations. The implications of these policies emphasize the need for integration between national and local policies, with a more adaptive approach. Additionally, the urgency of stricter monitoring of regulation enforcement and increased public and private sector awareness is underscored. This is required to support mangrove rehabilitation and conservation programs and to ensure that mangrove management in Benoa Bay can contribute to environmental conservation and the region’s economic and social sustainability.
4. Discussion
The study’s main objective was to analyze the annual trend in mangrove canopy cover changes using Landsat 8 remote sensing data in the southern urban area of Bali for eleven years. In general, the mangrove forest area has decreased by 0.34% over the past decade, reflecting a negative direction in mangrove ecosystem recovery. However, this decrease does not align with the observed increase in trend and mean of NDVI values, which illustrate the increase in the percentage of mangrove vegetation canopy cover (Figure 6), indicating that mangroves in this area have not experienced significant disturbance. As shown in Figure 5, a significant increase in the NDVI value trend is observed, particularly in the central part of the mangrove forest region. This central region is relatively well protected from disturbances caused by anthropogenic activities, in contrast to edge areas near the mainland, where much of the conversion to non-mangrove land-use has occurred (see Figure 3). Although there has been a decrease in mangrove areas in several places caused by anthropogenic disturbance such as infrastructure development, there has also been an increase in mangrove areas observed in some locations, likely due to active reforestation initiatives and supportive natural conditions. A detailed analysis of the mangrove area change map (Figure 3) reveals significant increases in specific locations, including the eastern side of the airport, the northern part of the port, and the easternmost part of the study area. Similar expansions in mangrove area have been observed by other studies where reforestation efforts have been implemented, such as in Perancak, Indonesia [11], or naturally, such as in Madura Strait, Indonesia [10].
The decrease and increase in mangrove area are closely linked to the development processes occurring around these regions. As illustrated in Figure 1, the Benoa Bay mangrove forest is situated within an urban area and directly borders tourism and residential zones. Consequently, the pressure for conversion to non-mangrove areas is significantly higher compared to mangroves located in remote areas. This is because, in urban and tourism-focused regions, land conversion is often driven by economic growth and the development of infrastructure to support tourism activities [20,39]. This dynamic is particularly evident in the Benoa Bay mangrove area, as shown in Figure 8, which highlights several ongoing activities occurring on land that was previously mangrove vegetation. Additionally, the relatively low direct economic value of mangrove land per unit area, compared to the financial benefits of tourism-supporting infrastructure per unit area, further incentivizes land-use changes. Although mangrove forests, such as those in Bintan, Indonesia, are estimated to have an economic value of USD 2077 per hectare [40], this value is not directly realized by the landowner, unlike the immediate financial benefits derived from tourism infrastructure. To address this challenge, strong efforts are required to preserve mangrove areas in urban environments. Existing regulations must be rigorously enforced and further strengthened to safeguard these critical ecosystems against conversion pressures.
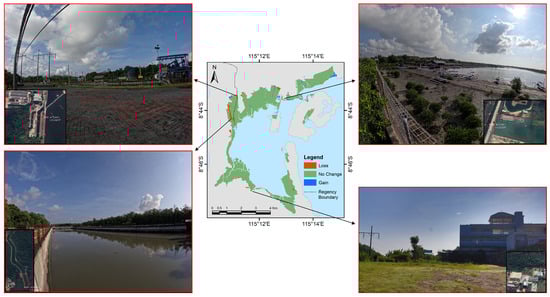
Figure 8.
Various activities transform former mangrove areas into non-mangrove land. The red box indicates an estimated area captured in the photograph, including the point of view (POV) coordinates and the angle at which the photo was taken.
However, it is important to note a simultaneous decrease in mangrove canopy cover in certain areas, particularly near the landfill and the downstream section of the Mati River. This reduction in the mangrove area may be linked to the development of the seaport and the river widening project, which could have disrupted the mangrove ecosystem (Figure 3). The annual NDVI map (Figure 4) indicates that the decline in NDVI values in the Mati River area began in 2018, as well as on the south side of the landfill. The annual NDVI trend downstream of the Mati River shows the most significant decrease compared to other regions within the Benoa Bay mangrove area. Studies have shown that infrastructure projects can significantly impact mangrove ecosystems, as shown by Vasquez et al. [41].
Research conducted by Partama et al. [42] revealed that 22.54% of the mangrove ecosystem in Benoa Bay is classified under a high vulnerability index, with an additional 3% falling into the very high vulnerability category. These results underscore the mounting pressures on this vital ecosystem, primarily driven by rapid urbanization and the burgeoning tourism industry. The demand for land, spurred by infrastructure development and urban expansion, poses a significant threat to mangrove forests. Activities such as the expansion of Benoa Seaport, the construction of tourism facilities within mangrove forests, airport enlargement, and landfill management have direct and indirect impacts on the sustainability of mangroves. These anthropogenic pressures are compounded by natural and environmental challenges, including urban waste discharge into Benoa Bay, rising sea levels, and changing environmental conditions, all of which exert additional stress on the mangrove ecosystem.
The mangrove area within the Ngurah Rai Forest Park benefits from several protections under a decree by the Ministry of Forestry, designating it as a conservation area. However, regions outside the forest park boundaries are highly susceptible to degradation due to private ownership, which heightens the risk of land conversion despite being designated as conservation areas under regional spatial planning and presidential regulations. The vulnerability of these areas is particularly concerning, given their significant ecological and climatic benefits. Rising sea levels present an additional threat, as prolonged root submersion can weaken mangroves, leading to reduced leaf density and overall canopy cover, particularly at sites A and B (see Figure 5). Moreover, accelerated sea level rise (SLR) inhibits mangroves’ ability to foster surface elevation increase, and inland movement remains the sole adaptive alternative for mangroves [43]. For instance, in northern Australia, mangroves in selected coastal areas can colonize higher mudflats, owing to the joint consequence of SLR and the inundation of the coastal plains over time [44], one of the significant circumstances driving mangrove inland development. However, mangroves in urban areas would be difficult since there is no additional land for higher intertidal mangroves. The mangroves in the study area are dominant in the lower intertidal zone, making this area more vulnerable to both threats. Also, the NDVI trends indicate an increase in mangrove canopy cover within the Ngurah Rai Forest Park area, but fluctuations are observed in certain regions, such as the southern area near the landfill. These variations are likely attributable to sediment deposition during port construction activities in 2018 and 2019, highlighting ongoing and diverse challenges to mangrove health. This is corroborated by research showing that sediment deposition and sea-level rise significantly impact mangrove health and distribution [45].
This situation suggests that decisive policy interventions were necessary to maintain the Benoa Bay mangrove forest. The national government played a crucial role in this effort by initiating reforestation actions. This included securing foreign loans, such as those for the mangrove rehabilitation project in Bali carried out by the Japan International Cooperation Agency (JICA). The first phase of this project took place from 1990 to 1999, followed by a second phase from 2001 to 2006, which focused on establishing a Mangrove Information Center [46]. Moreover, community-based mangrove restoration (CBMR) also puts a crucial effort into mangrove conservation within the region. For instance, Mangrove Care Forum Bali (MCFB) and Eden Reforestation Project, established in 2013 and 2017, were the major non-governmental organizations (NGOs) that promote the local communities’ awareness of mangrove preservation within the study area. A previous study mentioned that civil society organizations (CSOs) and NGOs have been highlighted as the major actors supporting the enactment of community-based mangrove restoration in Indonesia, including in Bali [47]. Integrating active restoration with strengthening community institutions resulted in considerable increases in carbon biomass, while having a fair impact on local income. However, only nearly 25% of the case studies of CBMR within the country demonstrated consistent execution [47]. Therefore, there is a need to offer direct socioeconomic benefits within the CBMR project in order to achieve a higher number of consistent implementations.
Despite these threats, efforts to protect and restore mangrove forests are intensifying, driven by recognizing their role as crucial blue carbon sources for climate change mitigation. Reforestation initiatives have been actively promoted, especially in areas outside forest parks, where urban communities, tourism stakeholders, and government agencies are increasingly collaborating. This is supported by research highlighting the importance of community involvement and multi-stakeholder collaboration in mangrove restoration efforts [48]. Another study, by Kardana et al. [49], identified several forms of community involvement in the Benoa Bay mangrove area: community-based participation by fishing communities and government-led initiatives facilitated by the Mangrove Information Center. To ensure long-term sustainability, implementing the Mixed-Based Participation model can effectively balance conservation efforts with socioeconomic development, thereby securing the future of the Benoa Bay mangrove ecosystem.
The Benoa Bay mangrove forest is an essential ecosystem that performs several key functions. Primarily, it acts as a coastal protector, mitigating the impacts of hydrological processes such as erosion and serving as a natural barrier against disasters like tsunamis. Additionally, this mangrove ecosystem plays a vital role in sediment control, effectively trapping materials originating from terrestrial sources, e.g., [9,50]. Ecologically, mangroves provide critical habitats for diverse aquatic species and function as natural filters, which are expected to efficiently absorb pollutants generated by activities at the Benoa Seaport, landfill, wastewater treatment facility, and by other activities related to urban tourism. However, the precise capacity of the Benoa Bay mangrove ecosystem to absorb pollutants remains uncertain, necessitating further studies on this function in the future. Furthermore, these ecosystems are notable for their exceptional carbon sequestration capabilities. The carbon stock potential in the Benoa Bay mangrove area is estimated at 209,027.28 tons of carbon (C), with the capacity to absorb approximately 767,130.11 tons of carbon dioxide (CO2) [51]. The Benoa Bay mangrove forest also significantly contributes to the availability of urban green spaces within Denpasar City [52,53]. These functions underscore the critical importance of the Benoa Bay mangrove ecosystem in addressing climate change at both the local urban and global levels. In addition to its ecological significance, the mangrove ecosystem provides substantial economic benefits through fisheries and tourism activities. Moreover, it offers opportunities for recreation and education, making it an invaluable resource for urban communities.
However, the current study still presents several uncertainties. This study primarily examines the annual NDVI trend, which reflects annual changes in mangrove vegetation canopy cover and changes in the area of mangrove forests, alongside its links with governmental policies aimed at preserving the sustainability of mangrove ecosystems. However, it does not provide a thorough analysis of the environmental conditions influencing the NDVI trend. Important environmental factors, including temperature variations, salinity levels, and sediment types, have not been investigated, despite their considerable potential to impact mangrove growth patterns [1,45]. Variations in temperature regimes within coastal regions can generate distinct microenvironments for different mangrove species, while fluctuations in salinity directly influence the growth and distribution of specific mangrove taxa [2]. Furthermore, although community participation is a crucial aspect of mangrove restoration efforts, this study does not examine deeply the effective strategies for enhancing sustainable mangrove management. Future research should aim to identify effective strategies, such as employing the Rapid Appraisal for Mangroves (RAPMangroves) method developed by Hidayah et al. [10]. Another uncertainty is the insufficient integration of supporting data related to urban development, such as nighttime light data, which could illustrate conflicts between infrastructure expansion and mangrove conservation efforts. Such data can offer insights into anthropogenic activities occurring at night that may threaten the sustainability of mangrove areas [41]. Therefore, future studies must conduct comprehensive analyses of environmental factors, community engagement strategies, and the integration of supporting data. This approach will not only enhance the robustness of research findings but also contribute significantly to the formulation of effective, efficient, and sustainable policies for mangrove management.
5. Conclusions
This study offers a comprehensive analysis of the spatio-temporal variations in mangrove canopy cover in Benoa Bay, Bali, from 2013 to 2023, utilizing Landsat 8 imagery. It also evaluates the implications of management policies on this critical ecosystem. The findings reveal complex dynamics; although there has been a slight overall decline in mangrove area (by 3.97 hectares), significant increases have been observed in certain areas due to reforestation efforts and natural regeneration, particularly in Denpasar City. Conversely, substantial losses in mangrove area have been recorded in Badung Regency, primarily driven by urban infrastructure, tourism development, and urban expansion.
NDVI-based analysis indicates a general increase in mangrove canopy cover, with a rising trend in mean NDVI values, despite localized declines in areas impacted by development activities and other natural causes that warrant further investigation. Policies such as the establishment of the Ngurah Rai Forest Park have had a dual effect: while they protect some areas, they have not entirely prevented mangrove loss within the conservation zone due to competing development priorities.
This study highlights the necessity of integrating scientific data with policy frameworks to achieve a balanced approach to development and conservation. By addressing existing management gaps and leveraging community engagement alongside technological advancements, the mangrove ecosystem of Benoa Bay can continue to deliver essential ecological services and support sustainable development in the region. These findings offer valuable insights for policymakers, conservationists, and local communities, ensuring that mangroves continue providing ecological and economic benefits amidst urban development and tourism pressures.
Author Contributions
Conceptualization, A.R.A.-s. and M.D.S.; methodology, A.R.A.-s.; software, A.R.A.-s., I.G.A.N. and P.E.P.A.; validation, I.G.A.N., P.E.P.A. and R.T.P.; formal analysis, A.R.A.-s., M.D.S., I.K.A.K.W. and H.A.R.; investigation, I.G.A.N., M.S. and P.E.P.A.; data curation, I.G.A.N., P.E.P.A. and R.T.P.; writing—original draft preparation, A.R.A.-s., M.D.S., I.K.A.K.W., I.G.A.N. and H.A.R.; writing—review and editing, A.R.A.-s., M.D.S. and I.K.A.K.W.; visualization, A.R.A.-s., I.K.A.K.W. and I.G.A.N.; supervision, A.R.A.-s.; funding acquisition, M.D.S. All authors have read and agreed to the published version of the manuscript.
Funding
This research received no external funding.
Institutional Review Board Statement
Not applicable.
Informed Consent Statement
Not applicable.
Data Availability Statement
The datasets used and analyzed during this study are available from the corresponding author on reasonable request.
Acknowledgments
We express our gratitude to the National Aeronautics and Space Administration (NASA) and the United States Geological Survey (USGS) for providing and processing the Landsat 8 data. We also extend our thanks to the Google Earth Engine (GEE) development team and community for their support via their forum. Finally, we are grateful to the Wild manuscript review committee for their insightful and constructive peer review.
Conflicts of Interest
The authors declare no conflicts of interest.
References
- Jiao, M.; Ren, L.; Wang, Y.; Ding, C.; Li, T.; Cao, S.; Li, R.; Wang, Y. Mangrove forest: An important coastal ecosystem to intercept river microplastics. Environ. Res. 2022, 210, 112939. [Google Scholar] [CrossRef] [PubMed]
- Bryan-Brown, D.N.; Connolly, R.M.; Richards, D.R.; Adame, F.; Friess, D.A.; Brown, C.J. Global trends in mangrove forest fragmentation. Sci. Rep. 2020, 10, 7117. [Google Scholar] [CrossRef]
- Donato, D.C.; Kauffman, J.B.; Murdiyarso, D.; Kurnianto, S.; Stidham, M.; Kanninen, M. Mangroves among the most carbon-rich forests in the tropics. Nat. Geosci. 2011, 4, 293–297. [Google Scholar] [CrossRef]
- Cameron, C.; Hutley, L.B.; Friess, D.A.; Brown, B.M. High greenhouse gas emissions mitigation benefits from mangrove rehabilitation in Sulawesi, Indonesia. Ecosyst. Serv. 2019, 40, 101035. [Google Scholar] [CrossRef]
- Rizal, A.; Sahidin, A.; Herawati, H. Economic value estimation of mangrove ecosystems in Indonesia. Biodivers. Int. J. 2018, 2, 98–100. [Google Scholar] [CrossRef]
- Eddy, S.; Milantara, N.; Sasmito, S.D.; Kajita, T.; Basyuni, M. Anthropogenic drivers of mangrove loss and associated carbon emissions in South Sumatra, Indonesia. Forests 2021, 12, 187. [Google Scholar] [CrossRef]
- Ministry of Environment and Forestry Republic of Indonesia. The State of Indonesia’s Forests 2020; Efransjah, M.S., Erwinsyah, D.E., Eds.; Ministry of Environment and Forestry: Jakarta, Indonesia, 2020.
- FAO. The World’s Mangroves 1980–2005; FAO Forestry Paper No. 153; FAO: Rome, Italy, 2007. [Google Scholar]
- Arifanti, V.B.; Sidik, F.; Mulyanto, B.; Susilowati, A.; Wahyuni, T.; Yuniarti, N.; Novita, N. Challenges and strategies for sustainable mangrove management in Indonesia: A review. Forests 2022, 13, 695. [Google Scholar] [CrossRef]
- Hidayah, Z.; As-Syakur, A.R.; Rachman, H.A. Sustainability assessment of mangrove management in Madura Strait, Indonesia: A combined use of the rapid appraisal for mangroves (RAPMangroves) and the remote sensing approach. Mar. Policy 2024, 163, 106128. [Google Scholar] [CrossRef]
- Proisy, C.; Viennois, G.; Sidik, F.; Andayani, A.; Enright, J.A.; Guitet, S.; Soulard, B. Monitoring mangrove forests after aquaculture abandonment using time series of very high spatial resolution satellite images: A case study from the Perancak estuary, Bali, Indonesia. Mar. Pollut. Bull. 2018, 131, 61–71. [Google Scholar] [CrossRef]
- Raharja, I.M.D.; Hendrawana, I.G.; Suteja, Y. Modeling of nitrate distribution in the waters of Benoa Bay. J. Mar. Res. Technol. 2018, 1, 22–28. [Google Scholar] [CrossRef]
- Rahayu, N.W.S.T.; Hendrawan, I.G.; Suteja, Y. Spatial and temporal distribution of nitrate and phosphate during the western monsoon on the surface of Benoa Bay, Bali. J. Mar. Aquat. Sci. 2018, 4, 1–13. [Google Scholar] [CrossRef]
- Sugiana, I.P.; Andiani, A.A.E.; Dewi, I.G.A.I.P.; Karang, I.W.G.A.; As-Syakur, A.R.; Dharmawan, I.W.E. Spatial distribution of mangrove health index on three genera dominated zones in Benoa Bay, Bali, Indonesia. Biodiversitas 2022, 23, 713. [Google Scholar] [CrossRef]
- Suardana, A.M.A.P.; Anggraini, N.; Aziz, K.; Nandika, M.R.; Ulfa, A.; Wijaya, A.D.; Dewanti, R. Biomass estimation model and carbon dioxide sequestration for mangrove forest using Sentinel-2 in Benoa Bay, Bali. Int. J. Remote Sens. Earth Sci. 2022, 19, 91–100. [Google Scholar]
- Anggraini, N.; Suardana, A.A.M.A.P.; Nandika, M.R.; Ulfa, A.; Ginting, D.N.B.; Adawiah, S.W.; Marpaung, S. Mangrove damage based on canopy density derived on SPOT 6 at Ngurah Rai Forest Park, Bali. IOP Conf. Ser. Earth Environ. Sci. 2023, 1224, 012017. [Google Scholar] [CrossRef]
- Purwanto, A.D.; Hikmah, N.I.; Aprianto, A.; Rahmawati, E. Modelling spatio-temporal of mangrove ecosystem and community local wisdom in Taman Hutan Raya (Tahura), Ngurah Rai, Bali. Int. J. Adv. Sci. Eng. Inf. Technol. 2021, 11, 1642–1653. [Google Scholar] [CrossRef]
- Yastika, P.E.; Vipriyanti, N.U.; Doan, T.-U.T. Spatio-temporal analysis of mangrove vegetation cover changes in Ngurah Rai Grand Forest Park using Landsat 7 ETM+ and Landsat 8 OLI imagery. J. Appl. Innov. Sci. Technol. 2023, 4, 82–92. [Google Scholar] [CrossRef]
- Karsch, G.; Mukul, S.A.; Srivastava, S.K. Annual mangrove vegetation cover changes (2014–2020) in Indian Sundarbans National Park using Landsat 8 and Google Earth Engine. Sustainability 2023, 15, 5592. [Google Scholar] [CrossRef]
- Nuarsa, I.W.; As-Syakur, A.R.; Gunadi, I.G.A.; Sukewijaya, I.M. Changes in gross primary production (GPP) over the past two decades due to land use conversion in a tourism city. ISPRS Int. J. Geo-Inf. 2018, 7, 57. [Google Scholar] [CrossRef]
- Gong, M.; Teller, N.; Golebie, E.J.; Aczel, M.; Jiang, Z.; Van Zeghbroeck, J.; Liu, J. Unveiling complementarities between mangrove restoration and global sustainable development goals. J. Clean. Prod. 2024, 474, 143524. [Google Scholar] [CrossRef]
- Sasmito, S.D.; Basyuni, M.; Kridalaksana, A.; Saragi-Sasmito, M.F.; Lovelock, C.E.; Murdiyarso, D. Challenges and opportunities for achieving Sustainable Development Goals through restoration of Indonesia’s mangroves. Nat. Ecol. Evol. 2023, 7, 62–70. [Google Scholar] [CrossRef]
- World Bank. Indonesia Sustainable Landscapes Management Program (SLMP). Available online: https://www.worldbank.org/en/programs/indonesia-sustainable-landscapes-management-program/practice (accessed on 29 November 2024).
- As-syakur, A.R.; Wijaya, I.M.S.; Andiani, A.A.E.; Dewi, I.G.A.I.P.; Sugiana, I.P.; Faiqoh, E.; Wiyanto, D.B.; Rachman, H.A. Pedoman Identifikasi Mangrove di Bali; Edisi, I., Ed.; AVI: Badung, Indonesia, 2023. [Google Scholar]
- As-syakur, A.R.; Osawa, T.; Miura, F.; Nuarsa, I.W.; Ekayanti, N.W.; Dharma, I.G.B.S.; Adnyana, I.W.S.; Arthana, I.W.; Tanaka, T. Maritime Continent rainfall variability during the TRMM era: The role of monsoon, topography, and El Niño Modoki. Dyn. Atmos. Oceans 2016, 75, 58–77. [Google Scholar] [CrossRef]
- As-syakur, A.R.; Tanaka, T.; Osawa, T.; Mahendra, M.S. Indonesian rainfall variability observation using TRMM multi-satellite data. Int. J. Remote Sens. 2013, 34, 7723–7738. [Google Scholar] [CrossRef]
- Haack, B.; Ryerson, R. Training for remote sensing image interpretation. Photogramm. Eng. Remote Sens. 2017, 83, 795–806. [Google Scholar] [CrossRef]
- Harrington, S.; Teitelman, J.; Rummel, E.; Morse, B.; Chen, P.; Eisentraut, D.; McDonough, D. Validating Google Earth Pro as a scientific utility for use in accident reconstruction. SAE Int. J. Transp. Saf. 2017, 5, 135–166. [Google Scholar] [CrossRef]
- Setiawati, M.D.; Nandika, M.R.; Hernawan, U.E.; Rachman, H.A.; Chatterjee, U.; Adi, N.S.; Muslim, A.M. Application of coastal hazard index to advance nature-based protection for coastal communities in the small islands. Discov. Appl. Sci. 2024, 6, 462. [Google Scholar] [CrossRef]
- Calva, L.G.; Golubov, J.; Mandujano, M.D.C.; Lara-Domínguez, A.L.; López-Portillo, J. Assessing Google Earth Pro images for detailed conservation diagnostics of mangrove communities. J. Coast. Res. 2019, 92 (Suppl. 1), 33–43. [Google Scholar] [CrossRef]
- Gaveau, D.L.A.; Locatelli, B.; Salim, M.A.; Yaen, H.; Pacheco, P.; Sheil, D. Rise and fall of forest loss and industrial plantations in Borneo (2000–2017). Conserv. Lett. 2018, 12, e12622. [Google Scholar] [CrossRef]
- Kiswanto; Setiawati, M.D.; Wahyulianto, I.; Tsuyuki, S. Tracking transitions of tropical deforestation in East Kalimantan, Indonesia using time-series Landsat images from 2000 to 2016. In Towards Sustainable Natural Resources; Rani, M., Chaudhary, B.S., Jamal, S., Kumar, P., Eds.; Springer: Cham, Switzerland, 2022; pp. 11–31. [Google Scholar] [CrossRef]
- As-syakur, A.R.; Aryunisha, P.E.P.; Wijana, I.M.S.; Novanda, I.G.A.; Dewi, I.G.A.I.P.; Andiani, A.A.E.; Sugiana, I.P. Comparison of mangrove canopy covering accuracy using Landsat 8 and Landsat 9 imagery based on several vegetation indices in West Bali National Park. E3S Web Conf. 2023, 442, 03001. [Google Scholar] [CrossRef]
- Rouse, J.W.; Haas, R.H.; Schell, J.A.; Deering, D.W. Monitoring Vegetation Systems in the Grat Plains with ERTS; NASA Spec. Publ.: Washington, DC, USA, 1974; Volume 351, p. 309. Available online: https://ntrs.nasa.gov/api/citations/19740022614/downloads/19740022614.pdf (accessed on 16 November 2024).
- Zed, M. Metode Penelitian Kepustakaan; Yayasan Obor Indonesia: Jakarta, Indonesia, 2004. [Google Scholar]
- Drasospolino, D.; Zauhar, S.; Santoso, B. The forest management policy and its influence in forest area utilization and empowering forest communities in Yogyakarta. Land Use Policy 2023, 127, 106539. [Google Scholar] [CrossRef]
- Sutiarso, M.A.; Suprapto, I.N.A.; Pantiyasa, I.W. Eksistensi ekowisata mangrove di Tahura Ngurah Rai bagi pembangunan kepariwisataan Bali. Edutourism J. Tour. Res. 2023, 5, 230–240. [Google Scholar] [CrossRef]
- Adinegoro, R.D.S.; Putra, I.D.N.N.; Nyoman, I.; Putra, G. Pemetaan perubahan luasan mangrove menggunakan citra Sentinel-2A pasca kematian mangrove di Denpasar-Bali. J. Mar. Aquat. Sci. 2022, 8, 66–77. [Google Scholar] [CrossRef]
- As-syakur, A.R.; Setiawati, M.D.; Mukaromah, L.; Osawa, T.; Adnyana, I.W.S.; Sunarta, I.N. Growing urban tourism activities while increasing vegetation ecosystem service under land use changes pressure: A case study of Sanur, Bali, Indonesia. In Urban Commons, Future Smart Cities and Sustainability; Chatterjee, U., Bandyopadhyay, N., Setiawati, M.D., Sarkar, S., Eds.; Springer Geography; Springer: Cham, Switzerland, 2023; pp. 667–687. [Google Scholar] [CrossRef]
- Arkham, M.N.; Riadi, S.; Wahyudin, Y.; Krisnafi, Y. Economic value of mangrove ecosystem services in the coastal area of Bintan Island, Indonesia. Wetl. Ecol. Manag. 2024, 32, 727–740. [Google Scholar] [CrossRef]
- Vasquez, J.; Acevedo-Barrios, R.; Miranda-Castro, W.; Guerrero, M.; Meneses-Ospina, L. Determining changes in mangrove cover using remote sensing with Landsat images: A review. Water Air Soil Pollut. 2024, 235, 18. [Google Scholar] [CrossRef]
- Partama, I.G.Y.; Wardhani, O.K.; Surata, S.P.K.; Yastika, P.E.; Kusuma, I.K.T.W. Mangrove ecosystem vulnerability mapping in Ngurah Rai-Bali Forest Park: Physical, biological, and anthropogenic aspects using GIS. J. Ilmu Lingkungan 2024, 22, 648–657. [Google Scholar] [CrossRef]
- Asbridge, E.; Lucas, R.; Ticehurst, C.; Bunting, P. Mangrove response to environmental change in Australia’s Gulf of Carpentaria. Ecol. Evol. 2016, 6, 3523–3539. [Google Scholar] [CrossRef]
- Saintilan, N.; Khan, N.S.; Ashe, E.; Kelleway, J.J.; Rogers, K.; Woodroffe, C.D.; Horton, B.P. Thresholds of mangrove survival under rapid sea level rise. Science 2020, 368, 1118–1121. [Google Scholar] [CrossRef]
- Liang, S.; Hu, W.; Wu, P.; Wang, J.; Su, S.; Chen, G.; Du, J.; Liu, W.; Chen, B. Prediction of the joint impacts of sea level rise and land development on distribution patterns of mangrove communities. For. Ecosyst. 2023, 10, 100100. [Google Scholar] [CrossRef]
- JICA. The Final Report of Project Administration: The Development of Sustainable Mangrove Management Project Bali and Lombok, Republic of Indonesia; Ministry of Forestry and Estate Crops in Indonesia—Japan International Cooperation Agency (JICA): Jakarta, Indonesia, 1999. [Google Scholar]
- Kusumadewi, S.D.; Purnomo, H.; Nadhira, S.; Putrizulfan, R. Systematic review on the implementation of mangrove community-based restoration in Indonesia and beyond. IOP Conf. Ser. Earth Environ. Sci. 2024, 1315, 012052. [Google Scholar] [CrossRef]
- Sathiyamoorthy, S.; Sakurai, T. Effectiveness of community participation in mangrove restoration: The evidence from northern Sri Lanka. Environ. Econ. Policy Stud. 2024, 26, 759–779. [Google Scholar] [CrossRef]
- Kardana, I.K.; Kristianto, Y.; Widyatmaja, I.G.N. Model of local community participation in the management of the Ngurah Rai Mangrove Forest area as a tourist attraction in Denpasar City, Bali. Int. J. Hum. Educ. Soc. Sci. 2023, 3, 1–12. [Google Scholar]
- Murdiyarso, D.; Purbopuspito, J.; Kauffman, J.B.; Warren, M.W.; Sasmito, S.D.; Donato, D.C.; Kurnianto, S. The potential of Indonesian mangrove forests for global climate change mitigation. Nat. Clim. Chang. 2015, 5, 1089–1092. [Google Scholar] [CrossRef]
- Mahasani, I.G.A.I.; Osawa, T.; Adnyana, I.W.S.; Suardana, A.A.M.A.P. Carbon stock estimation and mapping of mangrove forest using ALOS-2 PALSAR-2 in Benoa Bay Bali, Indonesia. IOP Conf. Ser. Earth Environ. Sci. 2021, 944, 012044. [Google Scholar] [CrossRef]
- Wirayuda, I.K.A.K.; Widayani, P.; Sekaranom, A.B. Urban green space analysis and its effect on the surface urban heat island phenomenon in Denpasar City, Bali. For. Soc. 2023, 7, 150–168. [Google Scholar] [CrossRef]
- Andika, I.B.M.B.; Kusmana, C.; Nurjaya, I.W. The impact of the construction of Bali Mandala Toll Road to the mangrove ecosystem at Benoa Bay Bali. J. Nat. Resour. Environ. Manag. 2018, 9, 641–657. [Google Scholar]
Disclaimer/Publisher’s Note: The statements, opinions and data contained in all publications are solely those of the individual author(s) and contributor(s) and not of MDPI and/or the editor(s). MDPI and/or the editor(s) disclaim responsibility for any injury to people or property resulting from any ideas, methods, instructions or products referred to in the content. |
© 2025 by the authors. Licensee MDPI, Basel, Switzerland. This article is an open access article distributed under the terms and conditions of the Creative Commons Attribution (CC BY) license (https://creativecommons.org/licenses/by/4.0/).