Article

Patient Diagnosis Alzheimer’s Disease with Multi-Stage Features Fusion Network and Structural MRI

by
Thi My Tien Nguyen
1 and
Ngoc Thang Bui
2,3,*
1
Department of Pediatrics of Hospital for Tropical Diseases, Ho Chi Minh City 700000, Vietnam
2
Department of Radiology of Mayo Clinic, Rochester, MN 55901, USA
3
Institute of Engineering of HUTECH University, Ho Chi Minh City 700000, Vietnam
*
Author to whom correspondence should be addressed.
J. Dement. Alzheimer's Dis. 2025, 2(4), 35; https://doi.org/10.3390/jdad2040035
Submission received: 13 June 2025 / Revised: 18 August 2025 / Accepted: 5 September 2025 / Published: 1 October 2025

Abstract

Background: Timely intervention and effective control of Alzheimer’s disease (AD) have been shown to limit memory loss and preserve cognitive function and the ability to perform simple activities in older adults. In addition, magnetic resonance imaging (MRI) scans are one of the most common and effective methods for early detection of AD. With the rapid development of deep learning (DL) algorithms, AD detection based on deep learning has wide applications. Methods: In this research, we have developed an AD detection method based on three-dimensional (3D) convolutional neural networks (CNNs) for 3D MRI images, which can achieve strong accuracy when compared with traditional 3D CNN models. The proposed model has four main blocks, and the multi-layer fusion functionality of each block was used to improve the efficiency of the proposed model. The performance of the proposed model was compared with three different pre-trained 3D CNN architectures (i.e., 3D ResNet-18, 3D InceptionResNet-v2, and 3D Efficientnet-b2) in both tasks of multi-/binary-class classification of AD. Results: Our model achieved impressive classification results of 91.4% for binary-class as well as 80.6% for multi-class classification on the Open Access Series of Imaging Studies (OASIS) database. Conclusions: Such results serve to demonstrate that multi-stage feature fusion of 3D CNN is an effective solution to improve the accuracy of diagnosis of AD with 3D MRI, thus enabling earlier and more accurate diagnosis.

1. Introduction

The World Alzheimer Report 2018 estimated that, globally, one person develops dementia every three seconds. In 2018, approximately 50 million individuals were living with dementia, a figure projected to more than triple to 152 million by 2050. The most common causes of dementia include Alzheimer’s disease (AD), vascular dementia (VaD), and dementia with Lewy bodies (DLB) [1]. While both the prevalence and incidence of dementia increase with advancing age, approximately 5% of cases have an onset before the age of 65 [2]. AD is the leading cause of dementia, accounting for 60% to 80% of all cases, and represents one of the primary contributors to physical and mental health decline among the elderly worldwide [3]. Importantly, AD is an irreversible neurodegenerative disorder, and current therapeutic options can only delay disease progression rather than reverse it [4]. Early diagnosis of AD is therefore critical—not only to allow individuals and their families to plan and adapt but also because accurate and timely diagnosis is essential for the development and implementation of future disease-modifying treatments [5,6].
Alzheimer’s disease (AD), a neurodegenerative disorder with an unclear pathological etiology, remains challenging to diagnose definitively through noninvasive clinical methods [7,8,9]. Several established imaging techniques, most notably magnetic resonance imaging (MRI) and positron emission tomography (PET), have been employed in recent years to support the early diagnosis of AD [10,11]. However, PET imaging presents several limitations: while it offers functional insights, its spatial resolution is limited in certain contexts, making precise localization of pathological changes difficult [1]. Additionally, the high cost and limited availability of PET scanners pose significant challenges for widespread clinical and research use. In contrast, structural MRI offers high spatial resolution, widespread availability, and the ability to visualize and quantify gray matter atrophy, making it a powerful tool for tracking AD progression [1,9,11]. As a result, MRI-based approaches are gaining increasing attention in AD research, with significant potential for advancing diagnosis and monitoring strategies on a global scale.
In recent years, the trend is to use deep learning (DL) and machine learning (ML) techniques, which have made breakthroughs in medical image analysis [12,13,14]. The application of ML and DL algorithms in AD detection research has achieved many surprising results [15]. In previous studies, ML algorithms, including support vector machine (SVM), K-nearest neighbors (KNN), and decision tree (DT), have achieved promising results in AD diagnosis using structural MRI images [14,16]. In the past decade, convolutional neural networks (CNNs) have shown significant potential in AD diagnosis. In addition, for the image classification task based on ML/DL applications, the combination of different types of features also significantly increases the accuracy of the model [17,18]. The application of CNNs in AD detection based on MRI images is mainly divided into two main methods. First, the 3D CNN [19] method can automatically learn discriminative features for region of interest (ROI)-based AD diagnosis without manual feature extraction [20], and the 3D CNN can automatically segment the hippocampus and classify AD using structural MRI images. Second, the 2D CNN [1,12,21] is used to classify AD based on three views of 3D MRI images. The advantage of the 3D CNN method is that it directly analyzes 3D MRI images, while the 2D CNN needs to analyze 3D MRI images from three different views (i.e., axial, coronal, and sagittal) and then synthesize them [22]. The synthesis of results from analysis in three different views is likely to lead to inaccurate prediction results. However, the 2D CNN method has a lighter structure than the 3D CNN [9], thus significantly saving hardware resources and implementation time. Therefore, the development of a lightweight 3D CNN that combines the advantages of 3D CNN and 2D CNN in AD detection with 3D MRI images shows great development potential. We have summarized and compared the most recent studies on AD classification models based on 2D CNN and 3D CNN in Table 1 below.
Our main motivation for this research remains to develop an approach that combines the strengths of both 2D CNN and 3D CNN. By leveraging the advantages of each approach, we aim to create a more robust and accurate framework for early diagnosis and classification of Alzheimer’s disease using structural MRI data. This paper describes the following work that was performed:
  • We proposed a multi-stage feature fusion-based 3D CNN model that fuses feature extraction across multiple blocks of a CNN to avoid information loss and improve classification accuracy [32].
  • Optimize model parameters to achieve high computational efficiency at low cost.
  • Compare our proposed approach with other 3D CNN models applied in AD classification [33].
  • Preprocessing stage for structural MRI data to remove noise and reconstruct image with four feature image (i.e., white matter, grey matter, cerebrospinal fluid, and bias correction) to improve image quality and reduce computational complexity [34].
Our paper is structured as follows. Section 2 provides materials and methods. The results obtained from the proposed method and comparison with state-of-the-art methods are presented in Section 3. Section 4 provides a discussion and future research directions. In Section 5, we conclude the paper.

2. Materials and Methods

2.1. The Open-Access Series of Imaging Studies (OASIS) Dataset

In this study, we used the Open Access Series of Imaging Studies (OASIS) database [35,36] for the experiments with the proposed models. The OASIS database includes more than 400 subjects over 4 different patient groups with Clinical Dementia Rating (CDR) (i.e., Non-Demented (CDR = 0), Very Mild Demented (CDR = 0.5), Mild Demented (CDR = 1.0), and Moderate Demented (CDR = 2.0)). However, the Moderate Demented (CDR = 2.0) group only included 2 patients, so we excluded this group from the experiments. Details of the OASIS database are described in Table 2 below.

2.2. Data Preprocessing

The OASIS database was processed using SPM12 (Statistical Parametric Mapping v.12) software [34], including realignment, co-registration, and spatial and intensity normalization steps. In addition, these images were segmented into Bias Correction, Gray Matter (GM), White Matter (WM), and Cerebrospinal Fluid (CSF) maps. In total, 464 3D MRI images (i.e., size of 91 × 109 × 91 voxels) were preprocessed and normalized according to the intensity range (0, 1). Finally, we synthesized the images into a database for evaluating models. The details of the analysis and synthesis process are given in Figure 1a. Figure 1b–d show examples of 3 different types of patient MRI images after preprocessing with 3 different view modes (i.e., axial, coronal, and sagittal).

2.3. Proposed Architecture of Classification Model Based on 3D CNN

Our proposed model processed 3D MRI images of size (91 × 109 × 91) voxels. Due to the single channel for MRI images, we set the size of the input image to (91 × 109 × 91 × 1). The input images were 3D cubes containing axial, sagittal, and coronal views of the brain. In detail, the proposed model consists of 4 blocks (i.e., Blocks 1 to 4). Each block consists of a 3D CNN layer (i.e., 3 × 3 × 3 kernel), a 3D Maxpooling layer (stride 2 × 2 × 2), and a Normalization layer, and a rectified linear unit (ReLU) activation function was used for all convolutional layers. The outputs of each block were connected to each other by a fusion block. Then, several fully connected (FC) layers were added after the last pooling layer to process the features. The 3D feature map was generated when the result was flattened and concatenated into a 1D vector as input to the FC layer. Finally, a softmax layer was added to the last FC layer and used to predict the class probabilities (i.e., normal, very mild, and mild) while fine-tuning with backpropagation. The model details are depicted in Figure 2 below.

2.4. Evaluation Metrics

This study used a stratified 5-fold CV technique to evaluate the model. In addition, various evaluation metrics were used to demonstrate the appropriate quality of the proposed model. The most common evaluation metrics used were the F1-score, accuracy, specificity, sensitivity, and precision, which are shown in [1,7,10,19]. We also evaluated our model using common evaluation metrics because these metrics are commonly used measures in the literature for DL models, which helps to compare our results with those of other studies.

3. Results

Based on the research results described in [33,37], we selected 3D ResNet-18, InceptionResNet-v2, and EfficientNet-b2 to compare with our proposed model (Figure 3). Our model is considered to have a much lighter structure, as a result of the optimization process in the proposed model compared to traditional models. In addition, we observed during the optimization of the proposed model that as the number of layers of the model increases, it can easily overfit the training data. This observation allows our proposed model to be much smaller in size but still achieve the same performance as the models with large structures. All networking was implemented with Python v3.12.5, TensorFlow framework v.2.18.0 and trained on a PC with an Intel® Xeon (R) E5-2650 Processor paired with a NVIDIA Quadro P2000 GPU.

3.1. Preparation of Dataset for Training Proposed Classification Model

After preprocessing, OASIS is used to train and test 4-DL models. We divide the dataset into two types of multi-class and binary class for classification tasks. All evaluations of models were performed on these datasets. The details of the OASIS dataset for each classification task are presented in Table 3 and Table 4 below.

3.2. Evaluation Performance of Proposed Model

To evaluate the performance of our model with the other three models on the OASIS dataset, we set up hyperparameters to train all four models in both multi-class and binary classification modes. The details are presented in Table 5. We chose the ResNet-18 model to train simultaneously with our model and conducted a t-test to compare the performance of our model with a model of ResNet-18.
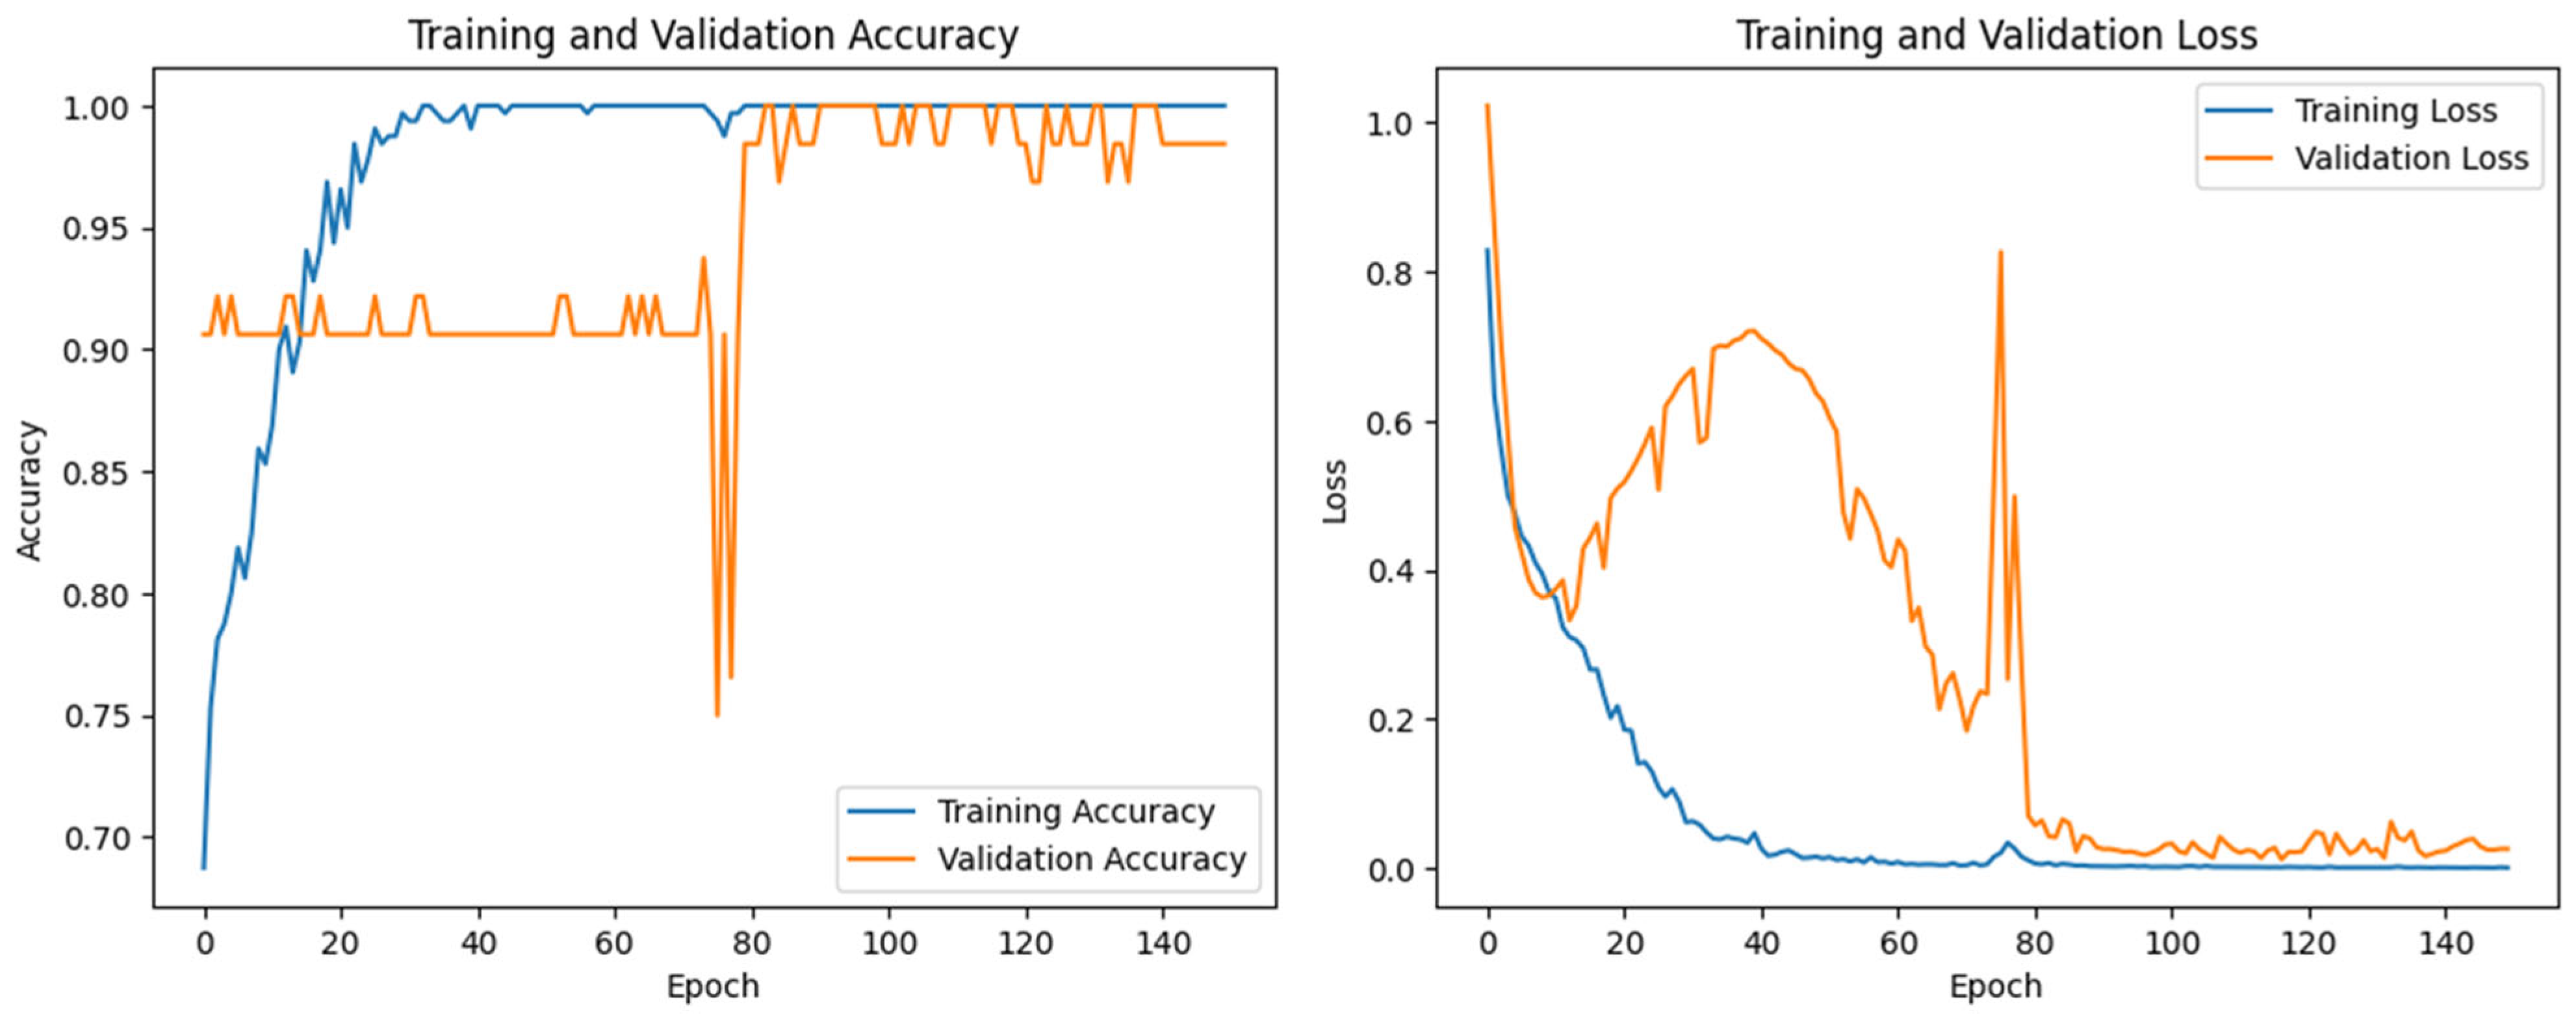
Figure 4 and Table 6 below detail the process of training and testing our model with 5-fold cross-validation and five evaluation metrics of binary classification. When observing Figure 4 and Table 6, we can see that from the fourth and fifth cross-validations, the model enters a steady state with quite stable acc and loss values as well as quite low values of other evaluation metrics.
Similarly to above, Figure 5 and Table 7 below describe in detail the process of training and testing our model with 5-fold cross-validation and five evaluation metrics for multi-class classification tasks. When observing Figure 5 and Table 7, we can see that from the fourth and fifth cross-validations, the model enters a steady state with quite stable acc and loss values as well as quite low values of other evaluation metrics. The t-test results show that our model has higher accuracy than the ResNet-18 model at each k-fold. However, at k = 3, k = 4, there is no significant difference between the two models.
In Table 8 below, we compare our model’s acc with ResNet-18 after performing k-fold cross-validation. We trained our model and ResNet-18 on k-1 folds and evaluated them on the remaining fold, then recorded the accuracy metric. Finally, we performed a t-test with the acc of these models. The t and p values show that our model has significantly higher (p < 0.05) accuracy than the Restnet-18 model after each k-fold.

3.3. Comparison of Performance of Proposed Model with Three Different Classification 3D CNN Models Based on Transfer Learning

The comparison of our model with three other transfer learning models based on 3D CNN is performed through four steps: first, we compare five evaluation metrics after training; second, we compare the performance of all four models with the test set in both multi-class and binary-class tasks; third, we compare the activation map with the grad cam method; and fourth, we compare the sizes of the four models.

3.3.1. Comparison Evaluation of Metrics After Training

In Table 9 below, we compare the training/validation values of the four models. The results show that all models have a train-acc greater than 93%, in which our model achieves a train-acc of 98.6%, while the train-acc of ResNet-18 is lowest, only reaching 93.64% for multi-class and 94.47% for binary class. The InceptionResNet-v2 model achieves the lowest validation-acc in both multi/binary classification tasks. Our model achieves a validation acc greater than 93% for both multi- and binary classes for 3D MRI images of the OASIS dataset with a trained model.

3.3.2. Comparison of Performance of Multi-Class and Binary Classification with Test Set

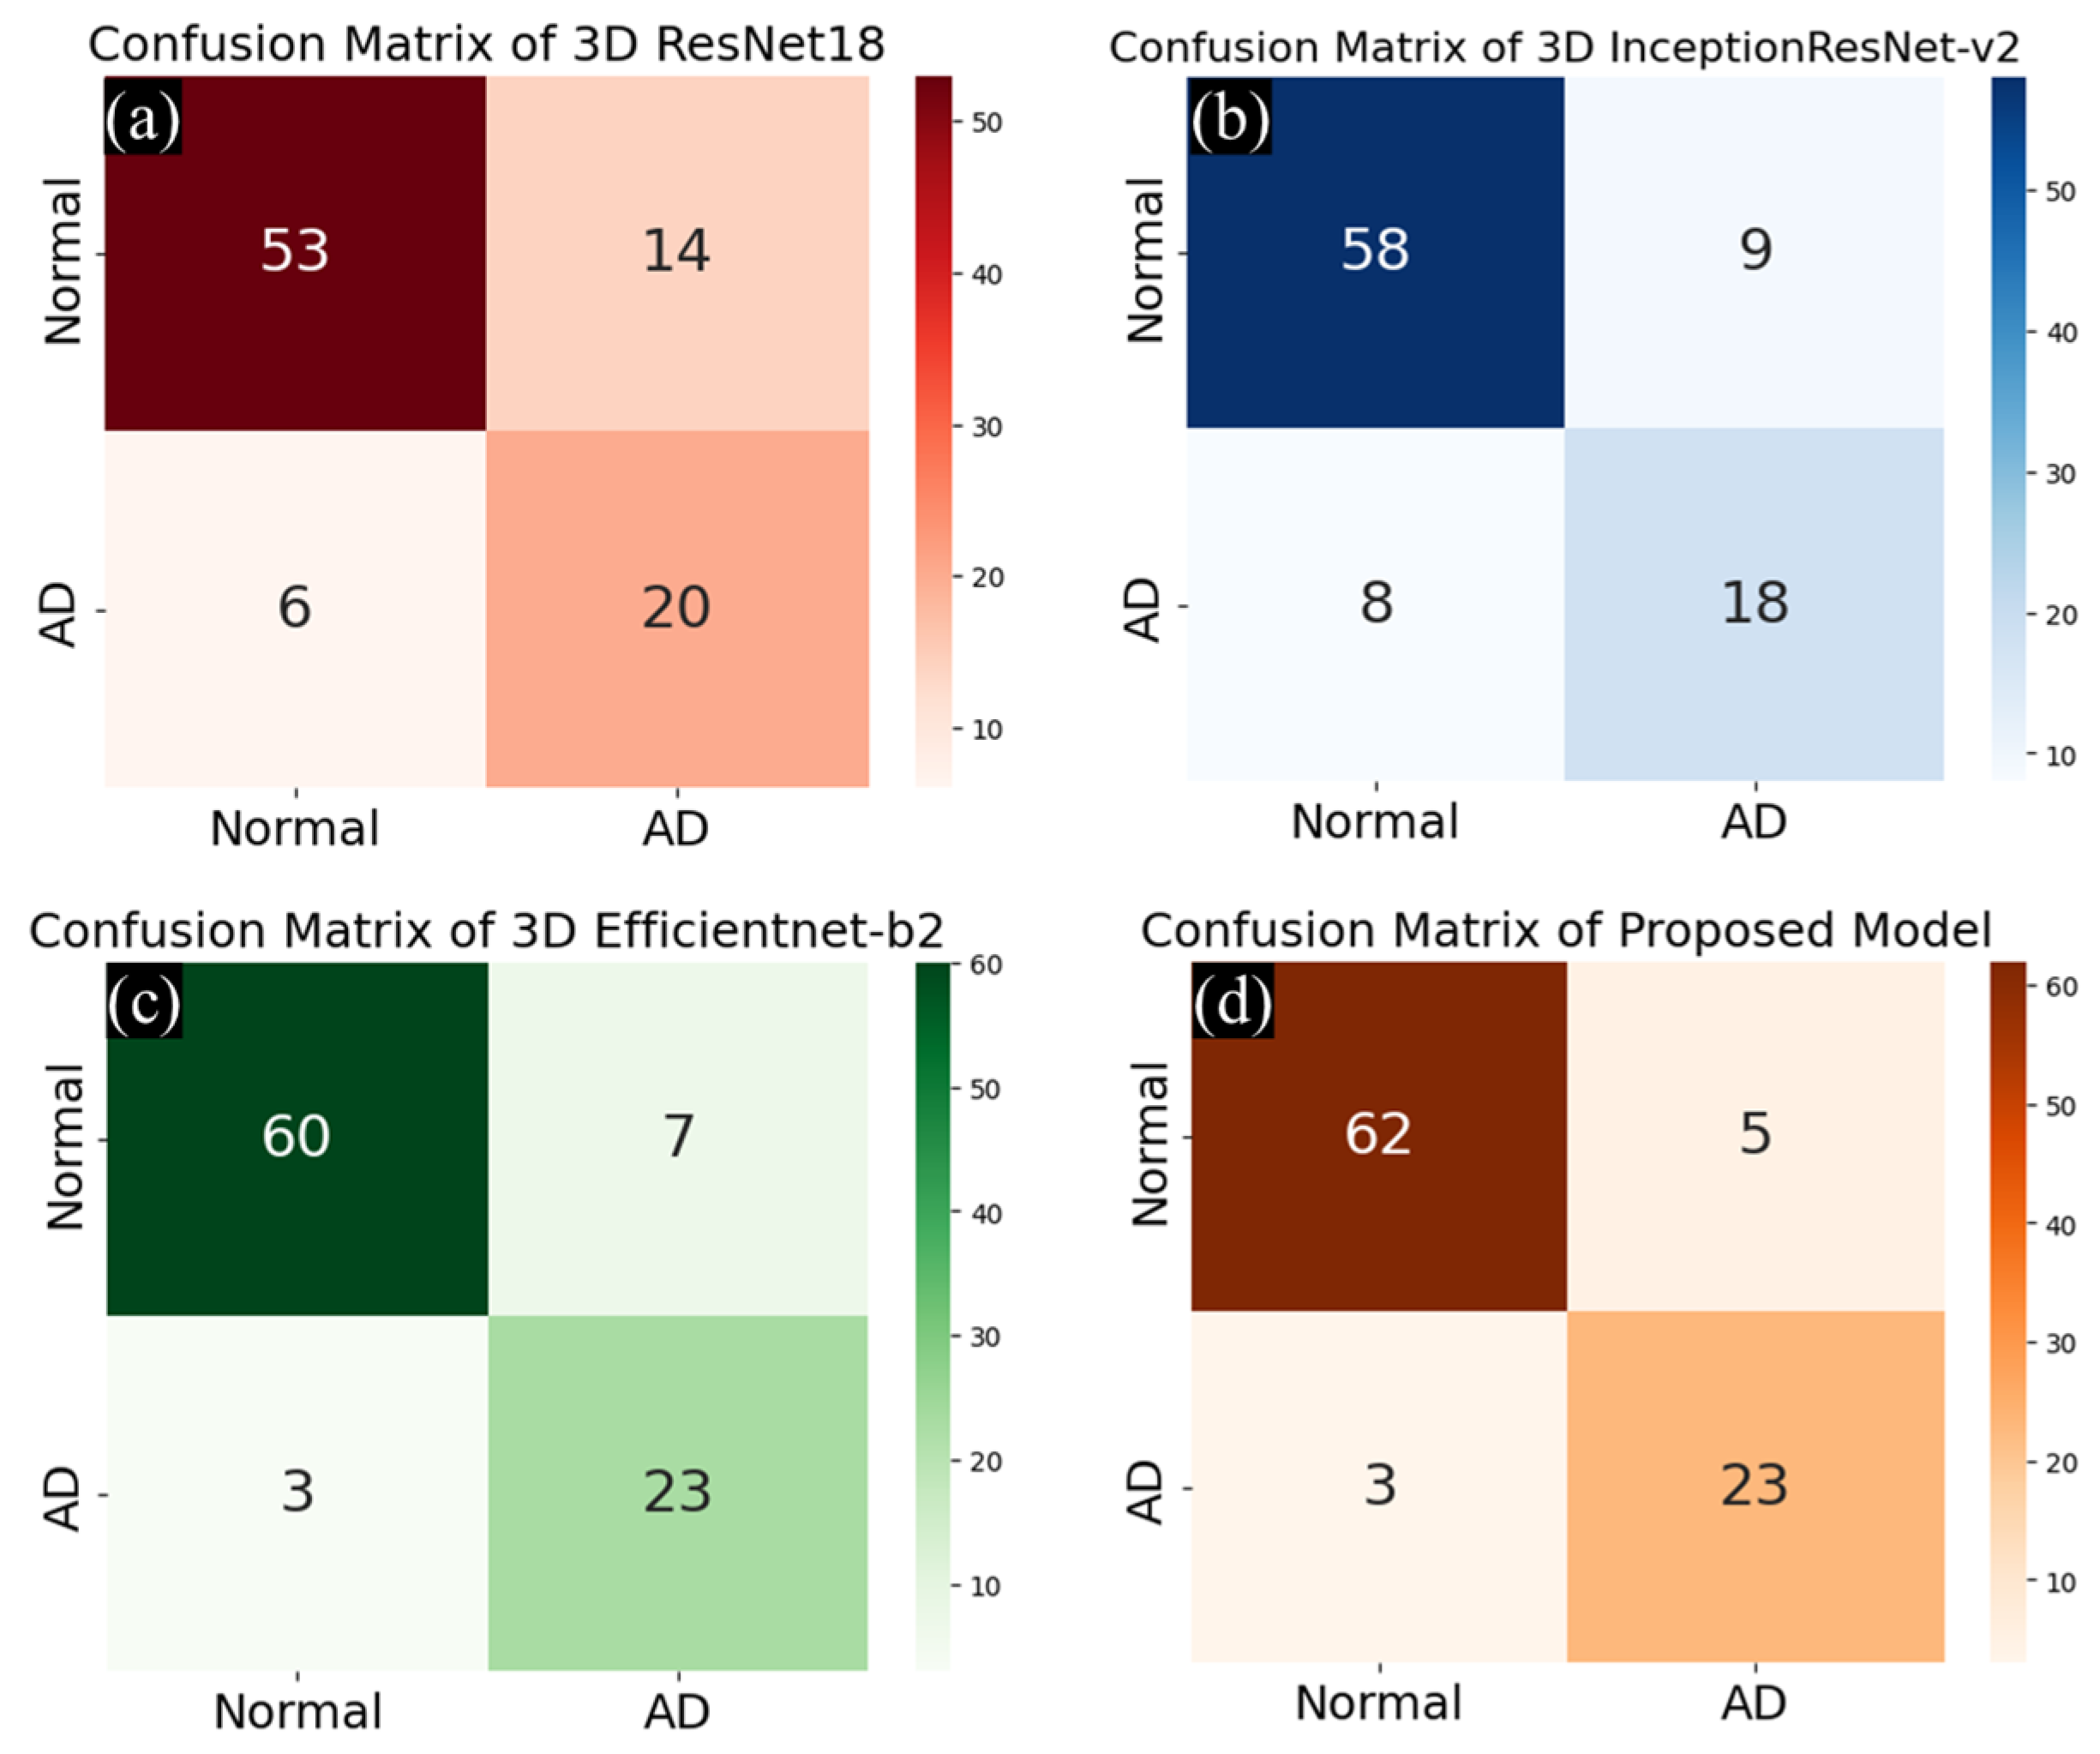
We present the classification performance of the selected models used in this study in Figure 6 (multi-class classification) and Figure 7 (binary classification). From the results, it is evident that our model has the best performance among all the reference models. The performances of ResNet-18, InceptionResNet-v2, and EfficientNet-b2 are outstanding for general image classification tasks, but in this study, they achieve low performance. This is because of the lack of a large enough training dataset due to the limited number of patients and the imbalanced AD-to-normal ratio in OASIS.
For multi-class classification, we also analyzed the incorrectly predicted subjects thoroughly, and we found that many of them had a Clinical Dementia Rating (CDR) of 0.5. When classifying subjects according to the CDR, 0.5 is associated with the very mild class, which is an intermediate transitional stage between normal and AD. Patients in this stage may transition to AD within a short time after the initial stage. This shows that the model achieves high accuracy with the AD/normal group but low accuracy for the very mild group, so we will focus on developing new methods for classifying the very mild group in our future work.
For binary classification, due to the more balanced amount of data in each class, the segmentation efficiency of the models is significantly improved. However, the ResNet-18 and IncaeptionReNet-v2 models still have a high false prediction rate for subjects with a CDR = 0.5. Our model has superior accuracy, with four features extracted from four different CNN layers, avoiding information loss and overcoming the disadvantage of data imbalance between classes of the OASIS dataset.

3.3.3. Comparison of Activation Maps with Grad Cam Method

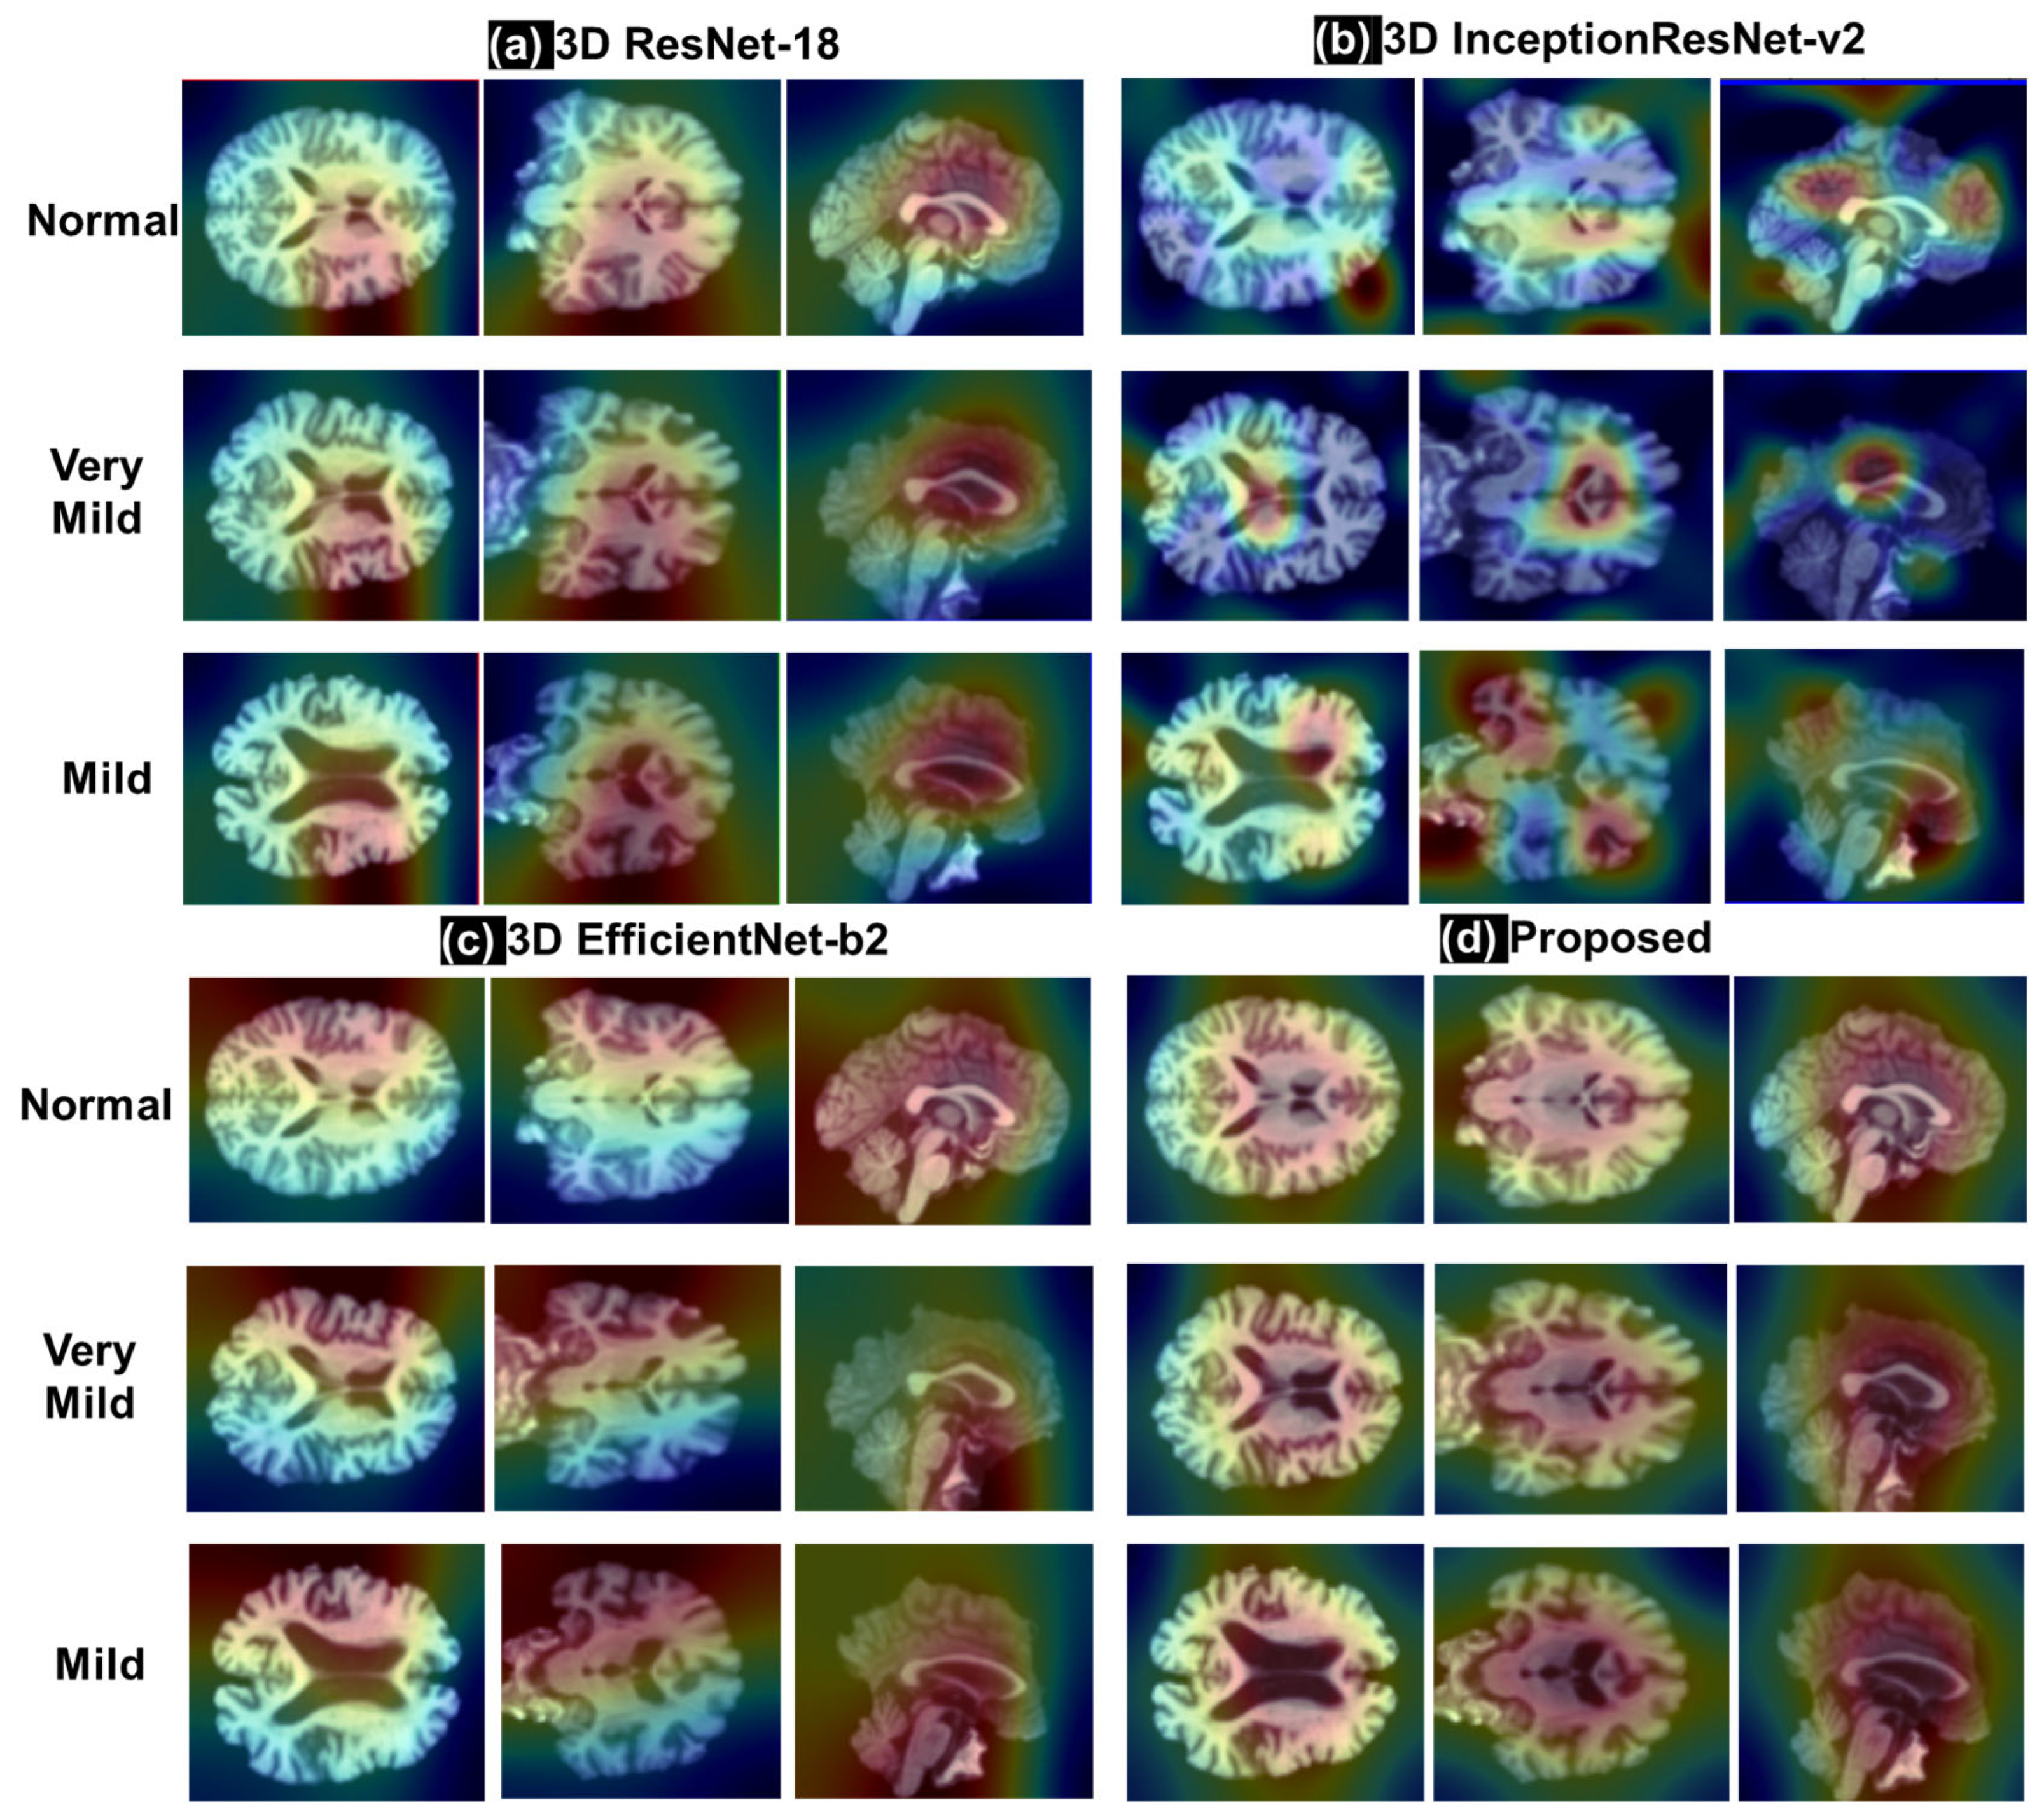
In this part, we demonstrate several CAM-based images obtained from 3D MRI and four different DL models, which show the effectiveness of the feature fusion module. We compare the visualization of our proposed model with three traditional DL models in three classes of patients (i.e., very mild, mild, and normal) with three view modes. The proposed model used an attention mechanism-based multi-stage feature fusion module to realize fusion of local regional features of 3D MRI images. Figure 8 shows the specific visualization results. The above visualization results verify the effectiveness of the attention mechanism-based multi-stage fusion module. As can be seen from Figure 8, our proposed multi-feature fusion learning method focuses on the areas strongly related to AD, which verify that the model has been well trained, and the fusion information has been well learned to classify multi-class data.

3.3.4. Comparison of Model Sizes for Proposed Model and Three Transfer Learning Models Based on 3D CNN

In Table 10 below, we compare the sizes of the four 3D CNN-based classification models in this study. The results show that InceptionResNet-v2 is the model with the largest size (258.08 MB), which is much larger than our model (5.28 MB) by 48.87 times. Meanwhile, the classification performance of our model is still better. This shows that focusing on optimizing the model for specific tasks can give outstanding results. ResNet-18 and InceptionReNet-v2 have been studied and applied in many different studies. However, a large-sized model is not effective and often gives an average accuracy, but it has wider applicability.

4. Discussion

The main objective of this study was to develop a lightweight AD classification model based on 3D MRI images and improve the accuracy already achieved with the Alzheimer’s disease classification model compared to a normal control. This approach merged features extracted from different CNN layers used in most CNN-based classification models. The fused features were then fed into the classifier block, which outperforms in accuracy compared with other CNN approaches. The fused features from MRI images appear to be extremely effective in improving the accuracy and reliability of deep learning models, considering the data and computational constraints. The results confirm the effectiveness of the proposed approach. The proposed solution is a single and less complex model, achieving a comparable or better performance when compared to complex models.
In this study, the selection of ResNet-18, InceptionResNet-v2, and EfficientNet-b2 as benchmarks against the proposed CNN is justified for several key reasons: (1) ResNet-18 is a relatively shallow residual network that mitigates the vanishing gradient problem and allows for training deeper networks. It serves as a lightweight and fast baseline. In addition, InceptionResNet-v2 combines inception modules (multi-scale processing) with residual connections, allowing for efficient extraction of complex features. In addition, EfficientNet-b2 uses a convolutional scaling method in depth, width, and resolution, providing a state-of-the-art balance of accuracy and efficiency with fewer parameters and lower computational costs. By combining all three, we capture a wide range of model complexity, depth, and efficiency. (2) All three networks are pre-trained on ImageNet and are therefore ideal for transfer learning, especially in medical imaging tasks where labeled data is often limited. Therefore, fine-tuning the model also yields good results with small datasets. Comparing a proposed CNN with them validates its relative strengths in terms of accuracy, efficiency, and generalization.
Our proposed model performs better in both binary and multi-class classification than previous studies. Our model accuracy is 91.40% for binary classification and 80.6% for multi-class classification on a 3D MRI database at the patient level. Unlike other models, which evaluate at the slide level and then aggregate at the patient level, our study evaluates directly at the patient level, thereby improving the stability of the model.
As shown in Figure 3, our model only includes four 3D CNN blocks, which is a small architecture. Therefore, to increase the accuracy of the proposed model, we can increase the number of CNN blocks, thereby increasing the number of features extracted for each block. However, this method also increases the model size and shows the high customizability and applicability of the model. Moreover, the 3D MRI data is input into the model, meaning it is possible to evaluate the volumetric ROI affecting the diagnosis of AD (i.e., based on the activation map of Figure 8), which is a prominent feature compared to the model based on 2D CNN.
Figure 6 shows the experimental results of the four models in this study. We found that the classification performance of the very mild class is relatively low for all four models. We believe that the current dataset has a large imbalance between classes, and there is no significant difference in features between very mild and normal. Therefore, we plan to apply methods to solve this problem, including the synthetic minority oversampling technique (SMOTE) [38], two-dimensional Fourier Bessel series expansion-based empirical wavelet transform [39], radiomics feature [12], and class-weighted losses [40].
We have developed a classification model based on 3D CNN, which is different from 2D CNN models. Three-dimensional CNN models can extract spatial features, thereby significantly reducing the number of datasets required. In addition, our model is small in size, is easy to use to train parameters, and converges faster. This is the big advantage of 3D CNN compared to 2D CNN, which requires a training set of tens of thousands of data [41,42]. However, 3D CNN also requires a more complex data structure. Many other studies also require smaller datasets, which are summarized in Table 1, with the ADNI dataset including around 500 data.
In the future, we will develop the research in the following directions: 1. Testing the model with different datasets (OASIS-3/4 [35,36], Alzheimer’s Disease Neuroimaging Initiative (ADNI) database (adni.loni.usc.edu)) and aiming for multi-center research. 2. Analyzing the GM volume to see if there are any structural changes in these regions that can be used as biomarkers of different types of AD. Integrating more clinical data into the model to assess the progression of AD through different stages. Addressing these limitations requires continuous research, robust validation, and careful consideration of ethical and practical factors to improve the effectiveness and reliability of AI models in clinical practice.

5. Conclusions

In this paper, we have proposed a 3D CNN-based AD classification model that combines features extraction from different 3D CNN layers to improve the accuracy of the model. We rigorously evaluated our proposed technique using a commonly used training and validation protocol. The performance of our proposed technique ranks highly when compared to other 3D CNN-based classification models for AD classification. Most importantly, we further show that the model has a small size that is suitable for deployment on low-end hardware while still ensuring good accuracy. Our analysis was performed in detail for both multi- and binary-class classification in AD.

Author Contributions

Conceptualization, T.M.T.N. and N.T.B.; methodology, T.M.T.N.; software, T.M.T.N.; validation, N.T.B.; formal analysis, T.M.T.N.; investigation, T.M.T.N.; resources, T.M.T.N.; data curation, T.M.T.N.; writing—original draft preparation, T.M.T.N.; writing—review and editing, N.T.B.; visualization, N.T.B.; supervision, N.T.B.; project administration, N.T.B. All authors have read and agreed to the published version of the manuscript.

Funding

This research received no external funding.

Institutional Review Board Statement

Not applicable.

Data Availability Statement

Data were provided 1-12 by OASIS-1: Cross-Sectional: Principal Investigators: D. Marcus, R, Buckner, J, Csernansky J. Morris; P50 AG05681, P01 AG03991, P01 AG026276, R01 AG021910, P20 MH071616, U24 RR021382.

Conflicts of Interest

The authors declare no conflicts of interest.

References

  1. Huang, H.; Pedrycz, W.; Hirota, K.; Yan, F. A multiview-slice feature fusion network for early diagnosis of Alzheimer’s disease with structural MRI images. Inf. Fusion 2025, 119, 103010. [Google Scholar] [CrossRef]
  2. Rahim, N.; El-Sappagh, S.; Ali, S.; Muhammad, K.; Del Ser, J.; Abuhmed, T. Prediction of Alzheimer’s progression based on multimodal Deep-Learning-based fusion and visual Explainability of time-series data. Inf. Fusion 2023, 92, 363–388. [Google Scholar] [CrossRef]
  3. Fu, J.; Ferreira, D.; Smedby, Ö.; Moreno, R. Decomposing the effect of normal aging and Alzheimer’s disease in brain morphological changes via learned aging templates. Sci. Rep. 2025, 15, 11813. [Google Scholar] [CrossRef]
  4. Cheng, J.; Wang, H.; Wei, S.; Mei, J.; Liu, F.; Zhang, G. Alzheimer’s disease prediction algorithm based on de-correlation constraint and multi-modal feature interaction. Comput. Biol. Med. 2024, 170, 108000. [Google Scholar] [CrossRef]
  5. Raza, H.A.; Ansari, S.U.; Javed, K.; Hanif, M.; Mian Qaisar, S.; Haider, U.; Pławiak, P.; Maab, I. A proficient approach for the classification of Alzheimer’s disease using a hybridization of machine learning and deep learning. Sci. Rep. 2024, 14, 30925. [Google Scholar] [CrossRef]
  6. Liu, S.; Masurkar, A.V.; Rusinek, H.; Chen, J.; Zhang, B.; Zhu, W.; Razavian, N. Generalizable deep learning model for early Alzheimer’s disease detection from structural MRIs. Sci. Rep. 2022, 12, 17106. [Google Scholar] [CrossRef]
  7. Golovanevsky, M.; Eickhoff, C.; Singh, R. Multimodal attention-based deep learning for Alzheimer’s disease diagnosis. J. Am. Med. Inform. Assoc. 2022, 29, 2014–2022. [Google Scholar] [CrossRef]
  8. Kim, J.S.; Han, J.W.; Bae, J.B.; Moon, D.G.; Shin, J.; Kong, J.E.; Lee, H.; Yang, H.W.; Lim, E.; Kim, J.Y.; et al. Deep learning-based diagnosis of Alzheimer’s disease using brain magnetic resonance images: An empirical study. Sci. Rep. 2022, 12, 18007. [Google Scholar] [CrossRef] [PubMed]
  9. Kang, W.; Lin, L.; Sun, S.; Wu, S. Three-round learning strategy based on 3D deep convolutional GANs for Alzheimer’s disease staging. Sci. Rep. 2023, 13, 5750. [Google Scholar] [CrossRef] [PubMed]
  10. Alinsaif, S.; Lang, J. Alzheimer’s Disease Neuroimaging Initiative, 3D shearlet-based descriptors combined with deep features for the classification of Alzheimer’s disease based on MRI data. Comput. Biol. Med. 2021, 138, 104879. [Google Scholar] [CrossRef]
  11. Guan, H.; Wang, C.; Tao, D. MRI-based Alzheimer’s disease prediction via distilling the knowledge in multi-modal data. Neuroimage 2021, 244, 118586. [Google Scholar] [CrossRef]
  12. Jytzler, J.A.; Lysdahlgaard, S. Radiomics evaluation for the early detection of Alzheimer’s dementia using T1-weighted MRI. Radiography 2024, 30, 1427–1433. [Google Scholar] [CrossRef] [PubMed]
  13. Ur Rahman, J.; Hanif, M.; Ur Rehman, O.; Haider, U.; Mian Qaisar, S.; Pławiak, P. Stages prediction of Alzheimer’s disease with shallow 2D and 3D CNNs from intelligently selected neuroimaging data. Sci. Rep. 2025, 15, 9238. [Google Scholar] [CrossRef]
  14. Chen, K.; Weng, Y.; Hosseini, A.A.; Dening, T.; Zuo, G.; Zhang, Y. A comparative study of GNN and MLP based machine learning for the diagnosis of Alzheimer’s Disease involving data synthesis. Neural Netw. 2024, 169, 442–452. [Google Scholar] [CrossRef] [PubMed]
  15. Zhang, X.; Li, Z.; Zhang, Q.; Yin, Z.; Lu, Z.; Li, Y. A new weakly supervised deep neural network for recognizing Alzheimer’s disease. Comput. Biol. Med. 2023, 163, 107079. [Google Scholar] [CrossRef] [PubMed]
  16. Bloch, L.; Friedrich, C.M. Alzheimer’s Disease Neuroimaging Initiative, Systematic comparison of 3D Deep learning and classical machine learning explanations for Alzheimer’s Disease detection. Comput. Biol. Med. 2024, 170, 108029. [Google Scholar] [CrossRef]
  17. Park, C.; Jung, W.; Suk, H.I. Deep joint learning of pathological region localization and Alzheimer’s disease diagnosis. Sci. Rep. 2023, 13, 11664. [Google Scholar] [CrossRef]
  18. Jenber Belay, A.; Walle, Y.M.; Haile, M.B. Deep Ensemble learning and quantum machine learning approach for Alzheimer’s disease detection. Sci. Rep. 2024, 14, 14196. [Google Scholar] [CrossRef]
  19. Ebrahimi, A.; Luo, S.; Chiong, R. Introducing Transfer Learning to 3D ResNet-18 for Alzheimer’s Disease Detection on MRI Images. In Proceedings of the 35th International Conference on Image and Vision Computing New Zealand (IVCNZ), Wellington, New Zealand, 25–27 November 2020; pp. 1–6. [Google Scholar]
  20. Cao, G.; Zhang, M.; Wang, Y.; Zhang, J.; Han, Y.; Xu, X.; Huang, J.; Kang, G. End-to-end automatic pathology localization for Alzheimer’s disease diagnosis using structural MRI. Comput. Biol. Med. 2023, 163, 107110. [Google Scholar]
  21. Hussain, M.Z.; Shahzad, T.; Mehmood, S.; Akram, K.; Khan, M.A.; Tariq, M.U.; Ahmed, A. A fine-tuned convolutional neural network model for accurate Alzheimer’s disease classification. Sci. Rep. 2025, 15, 11616. [Google Scholar] [CrossRef]
  22. Zhang, Y.; Peng, S.; Xue, Z.; Zhao, G.; Li, Q.; Zhu, Z.; Gao, Y.; Kong, L. Alzheimer’s Disease Neuroimaging Initiative, AMSF: Attention-based multi-view slice fusion for early diagnosis of Alzheimer’s disease. PeerJ Comput. Sci. 2023, 9, e1706. [Google Scholar] [CrossRef]
  23. Priyadharshini, S.; Ramkumar, K.; Vairavasundaram, S.; Narasimhan, K.; Venkatesh, S.; Madhavasarma, P.; Kotecha, K. Bio-inspired feature selection for early diagnosis of Parkinson’s disease through optimization of deep 3D nested learning. Sci. Rep. 2024, 14, 23394. [Google Scholar] [CrossRef]
  24. Parmar, H.; Nutter, B.; Long, R.; Antani, S.; Mitra, S. Spatiotemporal feature extraction and classification of Alzheimer’s disease using deep learning 3D-CNN for fMRI data. J. Med. Imaging 2020, 7, 056001. [Google Scholar] [CrossRef]
  25. Pan, D.; Zeng, A.; Jia, L.; Huang, Y.; Frizzell, T.; Son, X.; Initia, A. Early Detection of Alzheimer’s Disease Using Magnetic Resonance Imaging: A Novel Approach Combining Convolutional Neural Networks and Ensemble Learning. Front. Neurosci. 2020, 14, 259. [Google Scholar] [CrossRef] [PubMed]
  26. Oh, K.; Chung, Y.-C.; Kim, K.W.; Kim, W.-S.; Oh, I.-S. Classification and Visualization of Alzheimer’s Disease using Volumetric Convolutional Neural Network and Transfer Learning. Sci. Rep. 2019, 9, 18150. [Google Scholar] [CrossRef] [PubMed]
  27. Balboni, E.; Nocetti, L.; Carbone, C.; Dinsdale, N.; Genovese, M.; Guidi, G.; Malagoli, M.; Chiari, A.; Namburete, A.I.L.; Jenkinson, M.; et al. The impact of transfer learning on 3D deep learning convolutional neural network segmentation of the hippocampus in mild cognitive impairment and Alzheimer disease subjects. Hum. Brain Mapp. 2022, 43, 3427–3438. [Google Scholar] [CrossRef] [PubMed]
  28. Rogeau, A.; Hives, F.; Bordier, C.; Lahousse, H.; Roca, V.; Lebouvier, T.; Pasquier, F.; Huglo, D.; Semah, F.; Lopes, R. A 3D convolutional neural network to classify subjects as Alzheimer’s disease, frontotemporal dementia or healthy controls using brain 18F-FDG PET. Neuroimage 2024, 288, 120530. [Google Scholar] [CrossRef]
  29. Alp, S.; Akan, T.; Bhuiyan, M.S.; Disbrow, E.A.; Conrad, S.A.; Vanchiere, J.A.; Kevil, C.G.; Bhuiyan, M.A.N. Joint transformer architecture in brain 3D MRI classification: Its application in Alzheimer’s disease classification. Sci. Rep. 2024, 14, 8996. [Google Scholar] [CrossRef]
  30. Zhang, J.; Zheng, B.; Gao, A.; Feng, X.; Liang, D.; Long, X. A 3D densely connected convolution neural network with connection-wise attention mechanism for Alzheimer’s disease classification. Magn. Reson. Imaging 2021, 78, 119–126. [Google Scholar] [CrossRef]
  31. Zhang, X.; Han, L.; Zhu, W.; Sun, L.; Zhang, D. An Explainable 3D Residual Self-Attention Deep Neural Network for Joint Atrophy Localization and Alzheimer’s Disease Diagnosis Using Structural MRI. IEEE J. Biomed. Health Inform. 2022, 26, 5289–5297. [Google Scholar] [CrossRef]
  32. Muhammad, G.; Shamim Hossain, M. COVID-19 and Non-COVID-19 Classification using Multi-layers Fusion From Lung Ultrasound Images. Inf. Fusion 2021, 72, 80–88. [Google Scholar] [CrossRef]
  33. Solovyev, R.; Kalinin, A.A.; Gabruseva, T. 3D convolutional neural networks for stalled brain capillary detection. Comput. Biol. Med. 2022, 141, 105089. [Google Scholar] [CrossRef]
  34. Friston, K.J.; Holmes, A.P.; Worsley, K.J.; Poline, J.-P.; Frith, C.D.; Frackowiak, R.S.J. Statistical Parametric Maps in Functional Imaging: A General Linear Approach. Hum. Brain Mapp. 1994, 2, 189–210. [Google Scholar] [CrossRef]
  35. Marcus, D.; Wang, T.H.; Parker, J.; Csernansky, J.G.; Morris, J.C.; Buckner, R.L. Open Access Series of Imaging Studies (OASIS): Cross-Sectional MRI Data in Young, Middle Aged, Nondemented, and Demented Older Adults. J. Cogn. Neurosci. 2007, 19, 1498–1507. [Google Scholar] [CrossRef]
  36. Salami, F.; Bozorgi-Amiri, A.; Hassan, G.M.; Tavakkoli-Moghaddam, R.; Datta, A. Designing a clinical decision support system for Alzheimer’s diagnosis on OASIS-3 data set. Biomed. Signal Process. Control 2022, 74, 103527. [Google Scholar] [CrossRef]
  37. Mishra, S.K.; Kumar, D.; Kumar, G.; Kumar, S. Multi-Classification of Brain MRI Using Efficientnet. In Proceedings of the 2022 International Conference for Advancement in Technology (ICONAT), Goa, India, 21–22 January 2022; pp. 1–6. [Google Scholar]
  38. Matharaarachchi, S.; Domaratzki, M.; Muthukumarana, S. Enhancing SMOTE for imbalanced data with abnormal minority instances. Mach. Learn. Appl. 2024, 18, 100597. [Google Scholar] [CrossRef]
  39. Chaudhary, P.K.; Pachori, R.B. Automatic diagnosis of glaucoma using two-dimensional Fourier-Bessel series expansion based empirical wavelet transform. Biomed. Signal Process. Control 2021, 64, 102237. [Google Scholar] [CrossRef]
  40. Fernando, K.R.M.; Tsokos, C.P. Dynamically Weighted Balanced Loss: Class Imbalanced Learning and Confidence Calibration of Deep Neural Networks. IEEE Trans. Neural Netw. Learn. Syst. 2022, 33, 2940–2951. [Google Scholar] [CrossRef] [PubMed]
  41. Bouguerra, O.; Attallah, B.; Brik, Y. MRI-based brain tumor ensemble classification using two stage score level fusion and CNN models. Egypt. Inform. J. 2024, 28, 100565. [Google Scholar] [CrossRef]
  42. Wang, W.R.; Pan, B.; Ai, Y.; Li, G.H.; Fu, Y.L.; Liu, Y.J. ParaCM-PNet: A CNN-tokenized MLP combined parallel dual pyramid network for prostate and prostate cancer segmentation in MRI. Comput. Biol. Med. 2024, 170, 107999. [Google Scholar] [CrossRef]
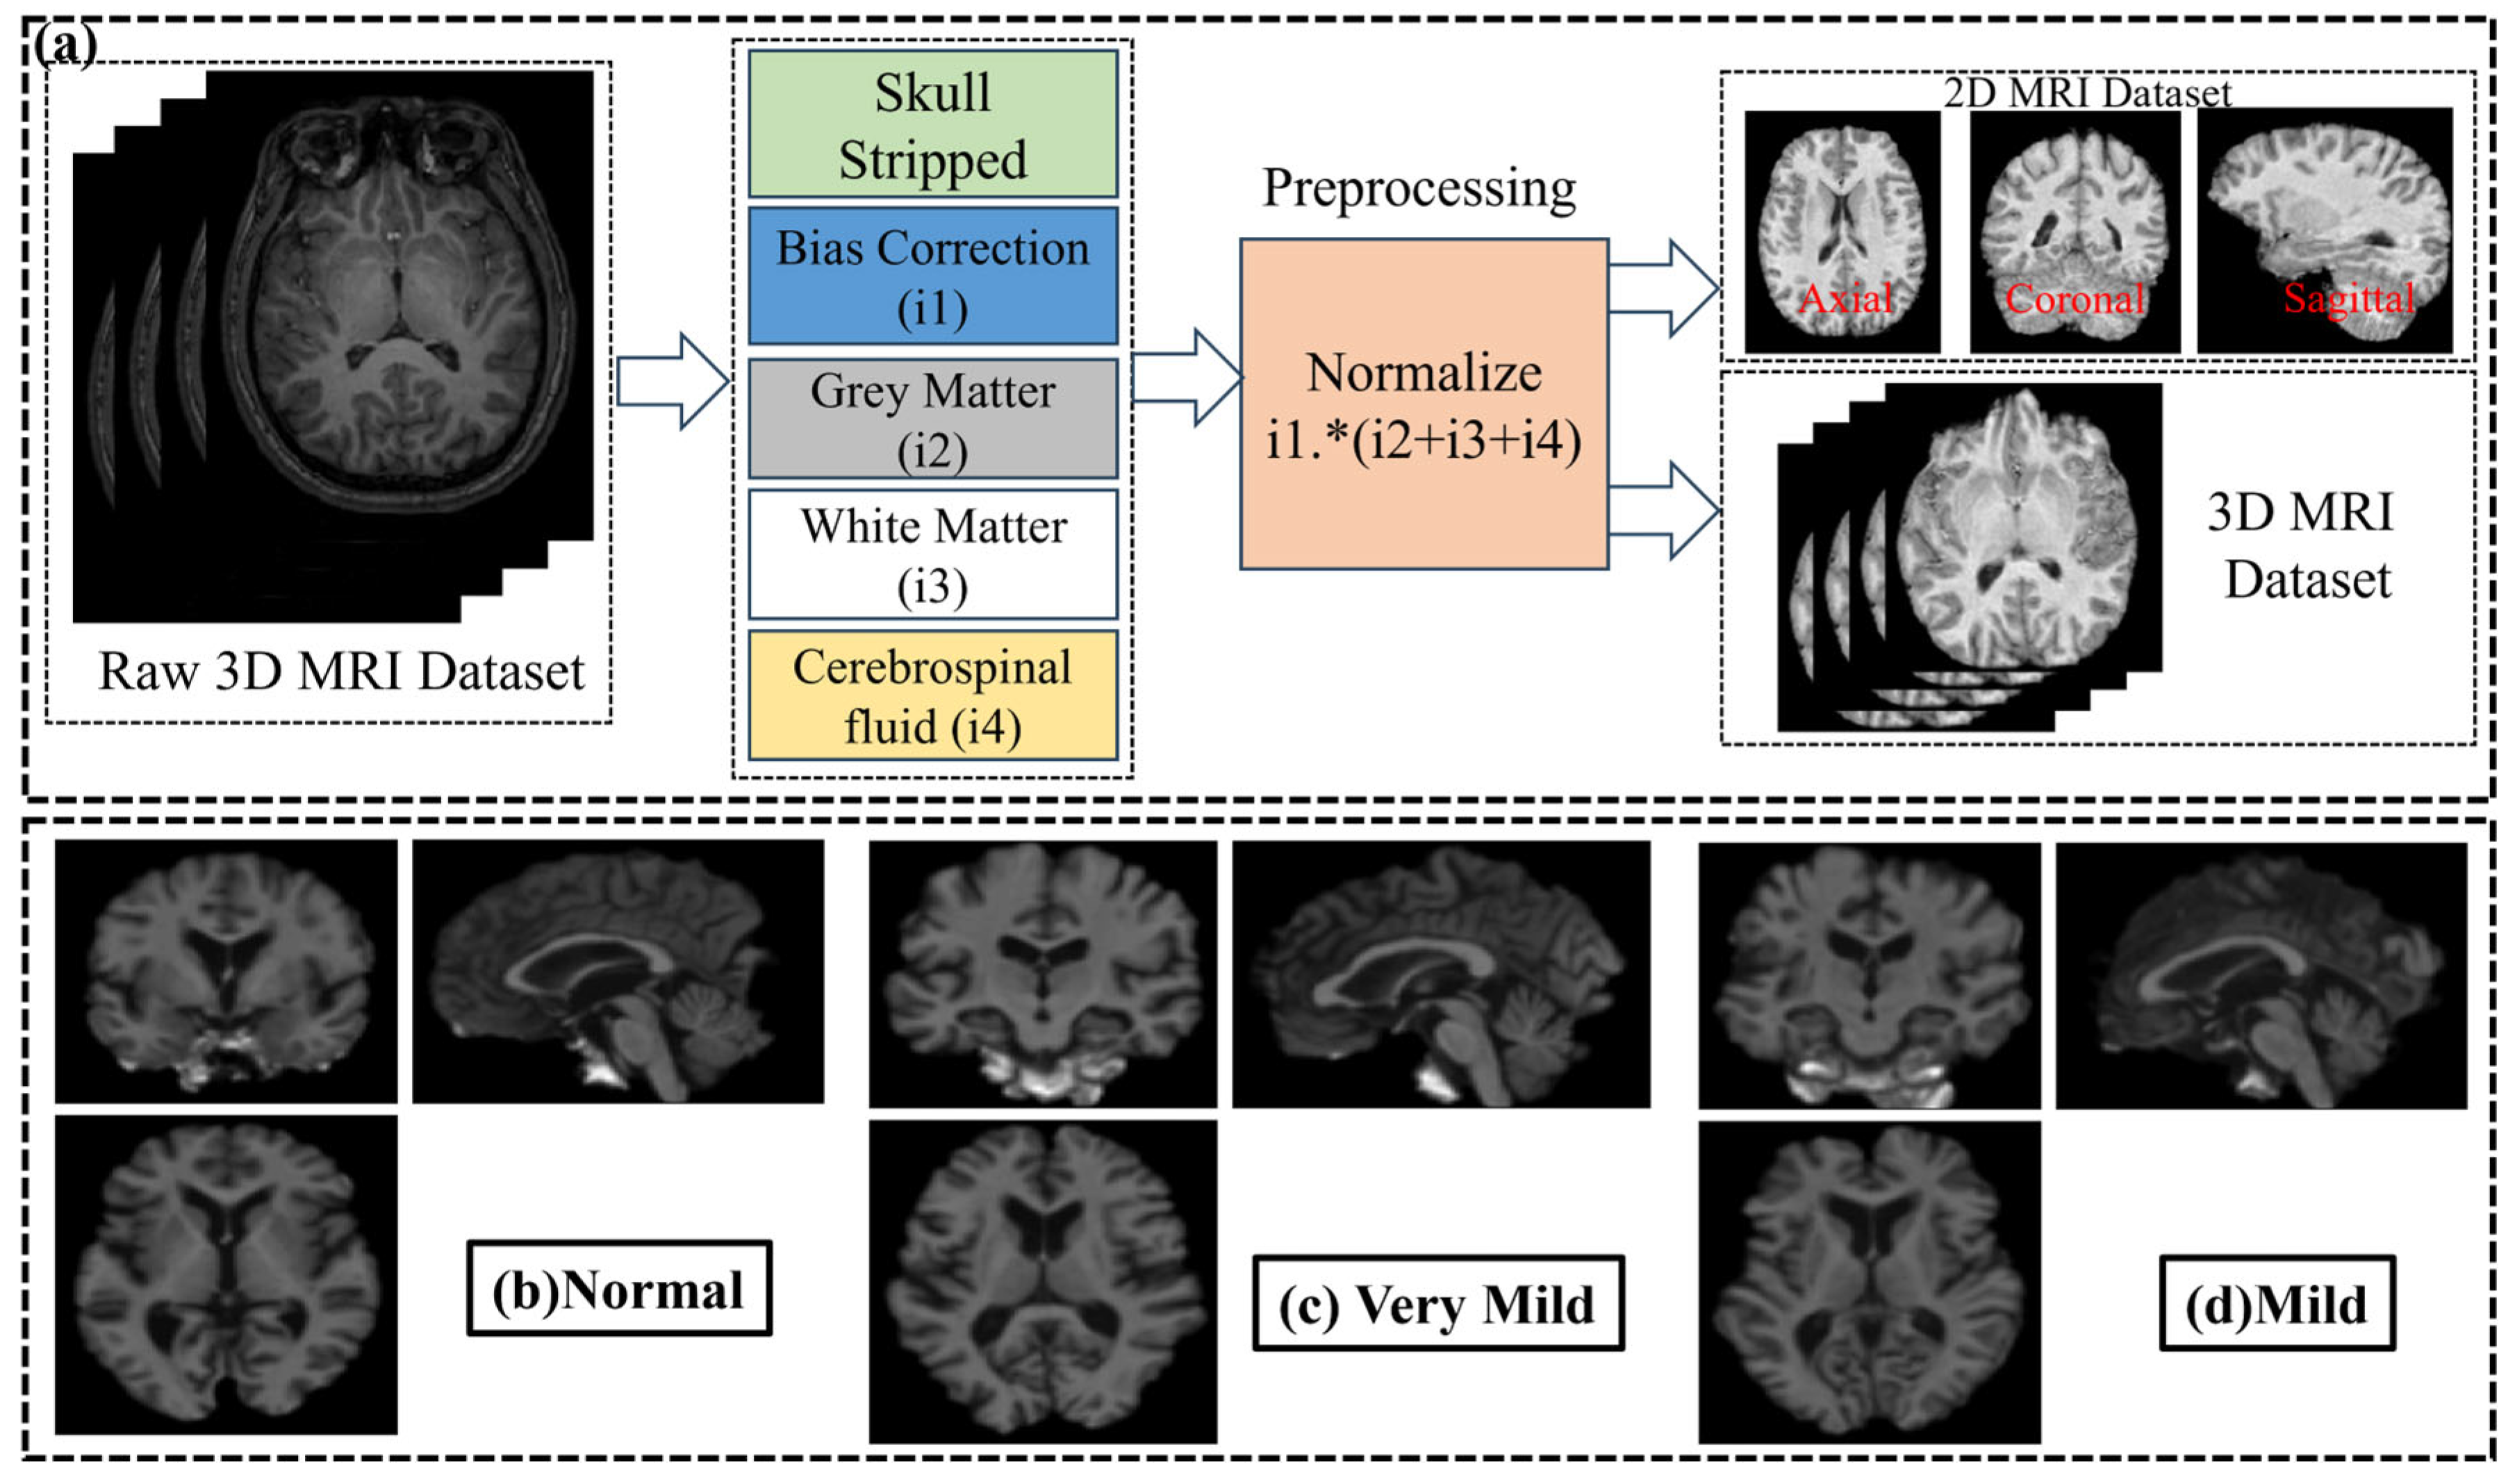
Figure 1. (a) Preprocessing scheme of MRI with SPM12; examples of (b) Normal, (c) Very Mild, and (d) Mild with three views: axial, coronal, and sagittal; Note: Bias Correction (i1) mean i1 value after applied bias correction method.
Jdad 02 00035 g001
Figure 2. Proposed 3D fusion CNN for classification of Alzheimer’s disease with 3D MRI image.
Jdad 02 00035 g002
Figure 3. Procedure of testing with 3D MRI and 3D CNN models.
Jdad 02 00035 g003
Figure 4. Acc and loss of training and validation during training with binary classification of proposed 3D fusion CNN model.
Jdad 02 00035 g004
Figure 5. Acc and loss of training and validation during training with multi-class classification of proposed fusion 3D CNN model.
Jdad 02 00035 g005
Figure 6. Comparison of confusion matrices for multi-class classification: (a) 3D ResNet-18, (b) 3D InceptionResNet-v2, (c) 3D Efficientnet-b2, (d) proposed model.
Jdad 02 00035 g006
Figure 7. Comparison of confusion matrices for binary classification: (a) 3D ResNet-18, (b) 3D InceptionResNet-v2, (c) 3D Efficientnet-b2, (d) proposed model.
Jdad 02 00035 g007
Figure 8. Examples of activation maps with Grad CAM of three different subjects: (a) 3D ResNet-18, (b) 3D EfficientNet-b2, (c) 3D InceptionResNet-v2, (d) proposed model.
Jdad 02 00035 g008
Table 1. AD classification research using 2D/3D CNN with 3D MRI imaging.
ReferenceYearDatasetImage TypeMethodClassification TypeAccuracy (%)No. of Layers/No. of Parameters
Priyadharshini et al. [23]2024PPMI databaseMRI3D CNNMulti-class9723 layers
Parmar et al. [24]2020ADNIfMRI3D CNNMulti-class938 layers
Pan et al. [25] 2020ADNIMR2D CNNMulti-class848 layers
Oh et al. [26]2020ADNIMRIConvolutional autoencoder (CAE)-basedMulti-class86.6371 K
Balboni et al. [27]2022ADNIMRISpatial warping network segmentation (SWANS) 3D- CNNMulti-class9010 layers
Rogeau et al. [28]2024ADNIMRI3D CNNMulti-class89.83D VGG16
Alp et al. [29]2024ADNIMRIVision Transformer (ViT) Multi-class99x
Zhang et al. [30] 2021ADNIMRI2D CNNMulti-class78.79Transfer learing with ResNet and DenseNet
Zhang et al. [31]2021ADNIMRI3D CNNMulti-class95.6Transfer learing with 3D-ResAttNet34
Kang et al. [9]2023ADNIMRI3D Deep Convolutional Generative Adversarial Networks (DCGANs)Multi-class92.8Transfer learing with 3D ResNet
Table 2. Demographic and CDR details of OASIS subjects.
CategoriesCDR = 0CDR = 0.5CDR = 1.0CDR = 2.0
Age (year)43.8 ± 23.7276.21 ± 7.1477.75 ± 6.6882.0 ± 4.0
Male1274891
Female20952191
Total336100282
Table 3. OASIS dataset for binary classification.
NormalAD
Train/Validation269102
Test6726
Table 4. OASIS dataset for multi-class classification.
CDR = 0 (Normal)CDR = 0.5 (Very Mild)CDR = 1.0 (Mild)
Train/Validation2698016
Test672010
Table 5. Hyper-parameters of proposed 3D fusion CNN for training.
Hyper-ParametersValue
Epoch30
k-folds5
Batch size32
Learning rate0.0001
Data augmentationRotation angles = (−20, −10, −5, 5, 10, 20)
OptimizerAdam
Loss functionCross-entropy
MetricsTrain_accuracy, train_loss, val_accuaracy, val_loss
Table 6. Five-fold results with 5 evaluation metrics during training with binary classification.
ParameterCross-ValidationAverage (Mean ± SD)
(95% CI)
k = 1k = 2k = 3k = 4k = 5
F1-score0.92780.92550.94070.97420.99270.9522 ± 0.0267
(0.9151–0.9892)
Accuracy0.92650.93550.95230.98860.99010.9586 ± 0.0264
(0.9219–0.9953)
Specificity0.93210.92690.94120.96230.99230.9510 ± 0.0239
(0.9177–0.9842)
Sensitivity 0.91230.91170.93200.96150.99570.9426 ± 0.0321
(0.8980–0.9872)
Precision0.92560.93600.93070.97090.99610.9515 ± 0.0272
(0.9141–0.9897)
Table 7. Five-fold results with 5 evaluation metrics during training of model with multi-class classification.
ParameterCross-ValidationAverage (Mean ± SD)
(95% CI)
k = 1k = 2k = 3k = 4k = 5
F1-score0.91550.91560.89040.96040.95210.9268 ± 0.0259
(0.8909–0.9627)
Accuracy0.92360.92980.88960.97690.96010.9360 ± 0.0303
(0.8939–0.9781)
Specificity0.92280.93050.89360.95560.96780.9341 ± 0.0260
(0.8980–0.9701)
Sensitivity0.92860.92880.88210.97740.95510.9344 ± 0.0319
(0.8902–0.9786)
Precision0.91440.91590.88450.96540.96680.9294 ± 0.0320
(0.8850–0.9738)
Table 8. t-test for comparison of accuracy between our model and ResNet-18 model with k-fold cross-validation.
k = 1k = 2k = 3k = 4k = 5t-Test
Acc of Binary
Classification
ResNet-180.76210.80220.86290.87820.8817t-statistic: 9.2936
p-value: 0.0007
Our0.87210.90210.93840.94320.9496
Acc of Multi-class ClassificationResNet-180.75220.77150.80990.82670.8398t-statistic: 8.5168
p-value: 0.001
Our0.80120.88230.90150.92180.9312
Table 9. Comparison of training metrics of four models with multi-class classification of OASIS dataset.
TaskEvaluation MetricsModel
3D ResNet183D InceptionResNet-v23D Efficientnet-b2Proposed
Multi-class ClassificationTrain Acc0.93640.99210.97360.9860
Validation Acc0.84160.80980.90570.9360
Train Loss0.02610.00560.00980.0174
Validation Loss0.16510.18270.13980.1152
Binary ClassificationTrain Acc0.94470.99490.99520.9886
Validation Acc0.88510.86040.91550.9586
Train Loss0.00560.00160.00290.0101
Validation Loss0.11250.12300.08790.0771
Table 10. Comparison of sizes of models.
ModelTrainable ParamsTotal Params
3D ResNet-1833,236,548 (126.79 MB)33,244,486 (126.82 MB)
3D InceptionResNet-v267,654,115 (258.08 MB)67,714,659 (258.31 MB)
3D Efficientnet-b29,898,577 (37.76 MB)9,980,865 (38.07 MB)
Proposed1,387,929 (5.28 MB)1,386,489
Disclaimer/Publisher’s Note: The statements, opinions and data contained in all publications are solely those of the individual author(s) and contributor(s) and not of MDPI and/or the editor(s). MDPI and/or the editor(s) disclaim responsibility for any injury to people or property resulting from any ideas, methods, instructions or products referred to in the content.