Article

Gray Matter Volume Associations with Montreal Cognitive Assessment Domains in an ADNI Cohort of Early-Onset Mild Cognitive Impairment and Alzheimer’s Disease

by
Minos Kritikos
1,2,†,
Taulant Rama
1,*,†,
Vania Zubair
1,
Chuan Huang
3,4,
Christopher Christodoulou
5,
Allen P. F. Chen
6,
Roman Kotov
7,
Frank D. Mann
2 and
on behalf of the Alzheimer’s Disease Neuroimaging Initiative
1
Program in Public Health, Health Sciences Center, #3-071, Renaissance School of Medicine, Stony Brook University, 101 Nichols Rd., Stony Brook, NY 11794, USA
2
Family, Population, and Preventive Medicine, Renaissance School of Medicine, Stony Brook University, Stony Brook, NY 11794, USA
3
Department of Radiology and Imaging Sciences, Emory University, Atlanta, GA 30322, USA
4
Department of Biomedical Engineering, Georgia Institute of Technology, Emory University, Atlanta, GA 30322, USA
5
Department of Psychiatry & Behavioral Health, Renaissance School of Medicine, Stony Brook University, New York, NY 11794, USA
6
Medical Scientist Training Program, Department of Neurobiology and Behavior, Renaissance School of Medicine at Stony Brook University, Stony Brook, NY 11794, USA
7
Department of Psychiatry, Renaissance School of Medicine, Stony Brook University, Stony Brook, NY 11794, USA
*
Author to whom correspondence should be addressed.
These authors contributed equally to this work.
Data used in preparation of this article were obtained from the Alzheimer’s Disease Neuroimaging Initiative (ADNI) database (adni.loni.usc.edu). As such, the investigators within the ADNI contributed to the design and implementation of ADNI and/or provided data but did not participate in analysis or writing of this report. A complete listing of ADNI investigators can be found at: http://adni.loni.usc.edu/wp-content/uploads/how_to_apply/ADNI_Acknowledgement_List.pdf.
J. Dement. Alzheimer's Dis. 2025, 2(3), 24; https://doi.org/10.3390/jdad2030024
Submission received: 17 February 2025 / Revised: 17 April 2025 / Accepted: 6 June 2025 / Published: 1 July 2025

Abstract

Background/Objectives: T1-weighted magnetic resonance imaging (MRI) and the Montreal Cognitive Assessment are standard, efficient, and swift clinical and research tools used when interrogating cognitively impairing (CI) conditions, such as Mild Cognitive Impairment (MCI) and Alzheimer’s disease (AD). However, the associations between gross cognitive impairment (CI) as compared to domain-specific functioning and underlying neuroanatomical correlates have not been investigated among individuals with early-onset Mild Cognitive Impairment (MCI) or Alzheimer’s disease (EOAD), who can benefit greatly from early diagnosis and intervention strategies. Methods: We analyzed T1-weighted MRIs and Montreal Cognitive Assessment (MoCA) scores from the ADNI database in individuals < 65 years old who were either cognitively normal (CN) or had MCI or EOAD. Gray matter volume (GMV) was estimated in voxel-based morphometry (VBM) and ROI-parcellation general linear models examining associations with individual MoCA scores after adjusting for demographic covariates. Results: Results from 120 subjects (44 CN, 62 MCI, and 14 EOAD), identified significant global but also individually distinct domain-specific topographical signatures spanning the temporal, parietal, limbic, occipital, frontal lobes, and cingulate gyri. Conclusions: The results highlight neural correlates of cognitive functioning in a sample of young patients representative of the AD continuum, in addition to studying the structural MRI and functional cognitive difference.

Graphical Abstract

1. Introduction

Alzheimer’s disease (AD) is responsible for over 100,000 deaths annually in the United States and presents a substantial economic strain on those involved [1]. AD is characterized by prodromal Mild Cognitive Impairment (MCI) [2] followed by cognitive impairment (CI) [3,4]. The etiology of AD is multifactorial and includes environmental and genetic components [5,6,7]. The neuropathological hallmarks of AD include the accumulation of amyloid beta (Aβ) plaques or senile plaques, the formation of neurofibrillary tangles (NFT) from hyperphosphorylated tau proteins, and extensive neurodegeneration across multiple brain regions [3,4,8], with atrophy typically beginning in the temporal lobes [4,9].
Late-onset AD (LOAD) is more common and canonically manifests in people > 65 years old. Comparatively, early-onset Alzheimer’s disease (EOAD) presents in younger people < 65, and is not strongly associated with the same genetic profile or medical comorbidities of LOAD, but often is more complex and aggressive [10]. However, prior studies investigating the differences between LOAD and EOAD identified key differential neuropathological findings. Specifically, both show significant atrophy of the hippocampus and temporal lobes, but EOAD shows greater atrophy in the occipital and parietal lobes, whereas LOAD shows more cerebellar atrophy [11,12,13]. Thus, the evidence suggests there could be different neuroanatomical substrates in early vs. late-onset patients, emphasizing the need for studies of EOAD to further investigate the neuropathological correlates of cognitive dysfunction, which could inform clinical interventions to improve later-life outcomes and reduce caregiver burden [14]. Τherefore, it is crucial to better understand the neural correlates of EOAD neuropathology through its association with clinically simple cognitive assessment tools, such as brief batteries, which can be linked to measures of brain health.
Cognitive examinations are foundational in the clinical diagnosis of AD and can be typically accompanied by neuroimaging, serological, and a battery of other relevant examinations. To assess cognition in a clinical research setting, cognitive batteries can either last under fifteen minutes, such as the Mini-Mental State Examination (MMSE) [15] and the Montreal Cognitive Assessment (MoCA) [16], or can be more involved and lengthy computerized tasks, such as the Cogstate [17,18] or the Cambridge Neuropsychological Test Automated Battery [19]. Shorter, multi-domain cognitive batteries such as the MMSE or the MoCA can provide clinical research utility due to their brief application in the examination room and their ability to gauge global cognition as a sum total of various domain-specific results. For example, both the MMSE and the MOCA are designed to diagnose AD by assessing the total score from subtests of different cognitive domains. The MMSE is slightly shorter and simpler than the MoCA and is best for moderate-to-severe dementia screening, but lacks the sensitivity of the MoCA for early cognitive deficits, as the latter further examines executive functioning, visuospatial abilities, and memory more thoroughly [16,20]. The MoCA specifically examines the following cognitive domains: (1) Visuospatial/Executive; (2) Naming; (3) Attention; (4) Language; (5) Abstraction; (6) Memory and Delayed Recall; and (7) Orientation. The cumulative score of these results is operationalized in the diagnosing criteria for CI, with total scores of <23 considered as MCI, and <19 considered as more severe CI [21,22,23]. Used in conjunction with neuroimaging studies, subject-level multi-dimensional cognitive data from such brief batteries can be useful in describing the neural correlates of cognition.
Neuroimaging studies aid the diagnosis and staging of AD due to their ability to capture neuroanatomical and topographical changes that reflect various aspects of changing brain health [24,25,26]. For example, voxel-based morphometric (VBM) estimations for gray matter volume (GMV) are a semi-automated MRI analysis technique that evaluates changes in neuronal volume, which is a biomarker for neurodegeneration [27] and has been shown to be strongly associated with cognitive ability [28,29]. GMV can also be extracted on a region-of-interest (ROI) level [27,30,31], highlighting topologically specific changes in brain health.
Population studies, such as the Alzheimer’s Disease Neuroimaging Initiative (ADNI), provide both neurocognitive and neuroimaging data through their database and have enabled many investigations in the study of dementia [26]. Specifically, ADNI uses various diagnostic criteria to operationalize the subject status of cognitively normal (CN), MCI, or AD, of which the MMSE is a core constituent for their diagnostic battery. ADNI also provides MoCA scores for many of their subjects which is a supplementary cognitive examination and not part of their core diagnostic criteria. Therefore, studying MoCA data within the ADNI cohort is not subject to the same selection biases that the MMSE poses by being a core diagnostic element [32,33], encouraging its clinical research use when studying the neural correlates of EOAD.
Diagnostic grouping, such as the pooling of CN, MCI, and AD, in a single study group can be representative of the continuum of cognitive decline and neurodegenerative encephalopathy as part of a single AD process. For example, when AD is studied this way, it can highlight individual variability in gray matter (GM) networks and cognitive decline [34], microstructural fiber radiality changes across the AD continuum [35], and longitudinal changes in the GMV of default mode networks [36]. To our knowledge, no studies to date have characterized the GMV associations with MoCA domain-specific cognitive performance across the EOAD continuum. In the present study, we examined associations between GMV and cognitive functioning by using data from individuals across the EOAD continuum. We hypothesized that cognitive sub-domains and their associations with GMV would differentially and distinctly map onto brain topology.

2. Materials and Methods

2.1. Population Data

Data used in this article were obtained from the Alzheimer’s Disease.
Neuroimaging Initiative (ADNI) database (adni.loni.usc.edu). Under the direction of Principal Investigator Michael W. Weiner, MD, the ADNI was launched in 2003 as a public–private partnership. The primary goal of ADNI has been to test whether serial MRI, positron emission tomography (PET), other biological markers, and clinical and neuropsychological assessment can be combined to measure the progression of MCI and early AD. For up-to-date information, see www.adni-info.org (accessed on 1 May 2023).
We downloaded a collection of three-dimensional 3T T-1 weighted magnetization-prepared rapid gradient echo (T1w-MPRAGE) MRI scans from an initial total of 140 ADNI participants. Inclusion criteria included an age range between 45 and 65 years old, concurrent MoCA assessment time-matched with the scan, and the first MRI scan to have accompanying MoCA scores.
Concomitant demographic data and the respective MoCA assessment, comprising sub-score-level data for each subject, were also obtained. Subjects were first stratified into their three respective groups as diagnosed by ADNI: Group 1 comprised CN controls, Group 2 comprised subjects with MCI, and Group 3 comprised subjects with EOAD. We note that in certain instances ADNI further stratifies MCI subjects by early MCI and late MCI; however, in this study, we did not distinguish between the subgroups and instead grouped them both as MCI.
ADNI diagnostic criteria involved the MMSE, Clinical Dementia Rating, Wechsler Memory Scale, and other clinical criteria but did not rely on information from the MoCA, making this the only test that is not directly biased by diagnostic categorization in the ADNI [32]. The study sample pooled together all three diagnostic groups (CN, MCI, and AD) not only to increase statistical power but also to set up our analyses for studying the AD continuum, represented by subjects capturing the three representative stages involved in this disease.

2.2. T1w-MPRAGE Pre-Processing

Standard pre-processing techniques were applied within the MATLAB environment (2023a) [37], which has the necessary framework to launch the toolbox Statistical Parametric Mapping (SPM12-7771) (www.fil.ion.ucl.ac.uk) (accessed on 1 May 2023), which can then launch the Computational Anatomy Toolbox (CAT12) [38,39]. All T1w-MPRAGE pre-processing steps were conducted in CAT12 and were kept to default to produce standard segmented volumes for gray and white matter (WM), along with cerebrospinal fluid (CSF) tissue types and total intracranial volume (TIV = GM + WM + CSF) for each subject. Briefly, segmentation involved affine regularization set to European brains using a medium-strength homogeneity correction. The native resolution was used for internal resampling of preprocessing with the spatial registration being set to Optimized Shooting with the standard (0.5) template. Denoising occurred by applying the Markov Random Field and spatial-adaptive Non-Local Means algorithms and interpolating out strip artifacts through affine preprocessing, enhancing segmentation quality. Local Adaptive Segmentation and Maximum A Posterior segmentation addressed intensity variations in different brain regions and allowed for adaptive estimations of local parameter differences, respectively. Partial volume segmentation estimated GM, WM, and CSF fractions in each voxel, thereby enhancing precision. A skull-stripping approach to remove non-brain tissue and a variety of morphological, smoothing, and distance operations to remove any residual meninges after segmentation were also performed (for more details see here: https://neuro-jena.github.io/cat12-help/) (accessed on 1 May 2023). After cleanup and spatial normalization to CAT12 Geodesic Shooting templates into Montreal Neurologic Institute (MNI) space, we examined GMV intensity maps after treating them to a 6 mm × 6 mm × 6 mm Full Width at Half Maximum isotropic smoothing kernel.

2.3. Voxel-Based Morphometry

After pre-processing, the smoothed images were semi-quantitively inspected for processing abnormalities by visualizing each scan with the “Data Quality Statistical Analysis Check” function. Ultimately, 20 scans were removed due to poor image quality or artifacts, such as motion blurring, resulting in a final study sample of 120 participants, stratified into the following three groups: CN (n = 44), MCI (n = 62), and EOAD (n = 14). The underlying regions-of-interest (ROIs) of our VBM analyses were based on the automated anatomical atlas 3 (aal3).

2.4. Region of Interest (ROI)-Based Morphometry

Separate from our VBM analyses, subject-level and TIV-corrected GMV estimates (in ml) for 116 cortical ROIs based on the aal3 atlas [40] were extracted for external analysis for all subjects using CAT12 functions.

2.5. Statistical Analyses

Demographic data (age, education, sex, ethnicity, and race) is provided as either means and standard deviations (SD) for continuous variables, or percentages of frequency for categorical variables. To highlight possibly confounding covariates for the subsequent models, we examined significant groupwise differences in demographic properties using F tests and Chi-square (χ2) tests, respectively, which were performed in Jeffery’s Amazing Statistics Program (JASP, v18.3) [41]. Sex, race, and ethnicity were significantly different at α = 0.05, thus we included them as covariates of no interest to be adjusted out in all subsequent models. The seven MoCA cognitive domain sub-scores and the total score were then stratified by CN, MCI, or EOAD group status whereby individual one-way ANOVAs with violin boxplots demonstrated the groupwise differences in total MoCa score plus the seven individual cognitive domain MoCA sub-scores that make up the total.
The “Full Factorial” basic model was then used in CAT12 to build individual multivariate adjusted general linear models (GLMs) to examine the factor GMV and its contrast associations with the total and seven cognitive domain scores across the EOAD continuum (comprising the three group levels CN, MCI, and EOAD). TIV was entered as a vector for each subject to adjust for relative head sizes and the SPM12 external mask: “mask_ICV” was entered to restrict the voxel-wise search volume, respectively. Individual SPM contrasts were then constructed to examine the correlation of each cognitive domain model (a total of eight models, including the total score) whilst keeping all covariates of interest constant (see Figure S1 for the full design matrix for each of the eight models used to generate images). T-maps resulting from the above contrasts then underwent threshold-free cluster enhancement (TFCE) with 10,000 permutations, as previously described [38]. For the present study, we chose to the report TFCE maps that survived a False Discovery Rate (FDR) of 0.05.
For the visualization of results, maximum intensity TFCE projections were then loaded into MRIcroGL (version 14.4.1) for figure presentation, using the CAT12 “Template_T1.nii” as an underlay. MNI coordinates are reported for each GLM’s peak cluster and are shown individually for each GLM, signifying the peak correlation topology for that specific MoCA subdomain. Finally, Spearman’s correlation models were constructed externally in JASP using the aal3 ROI’s extracted estimates (ml) for external analyses to examine associations between the total and the seven cognitive domain scores whilst correcting for TIV. For Spearman’s correlations, we reported the results that survived a False Rate Discovery Rate of 0.1.

3. Results

3.1. Subject Characteristics

Groupwise analyses of demographic variables identified no significant groupwise differences in age (p = 0.062) or years of education (p = 0.807). However, sex (p = 0.005), ethnicity (p = 0.017), and race (p < 0.001) were significantly different (Table 1). It was observed that males were underrepresented for the CN (25%) and MCI (31%) groups but were overrepresented for the EOAD (71%) group, whereas across the whole sample, race and ethnicity mostly constituted White (68.0%) and non-Hispanic or -Latino (87%) participants (Table 1).

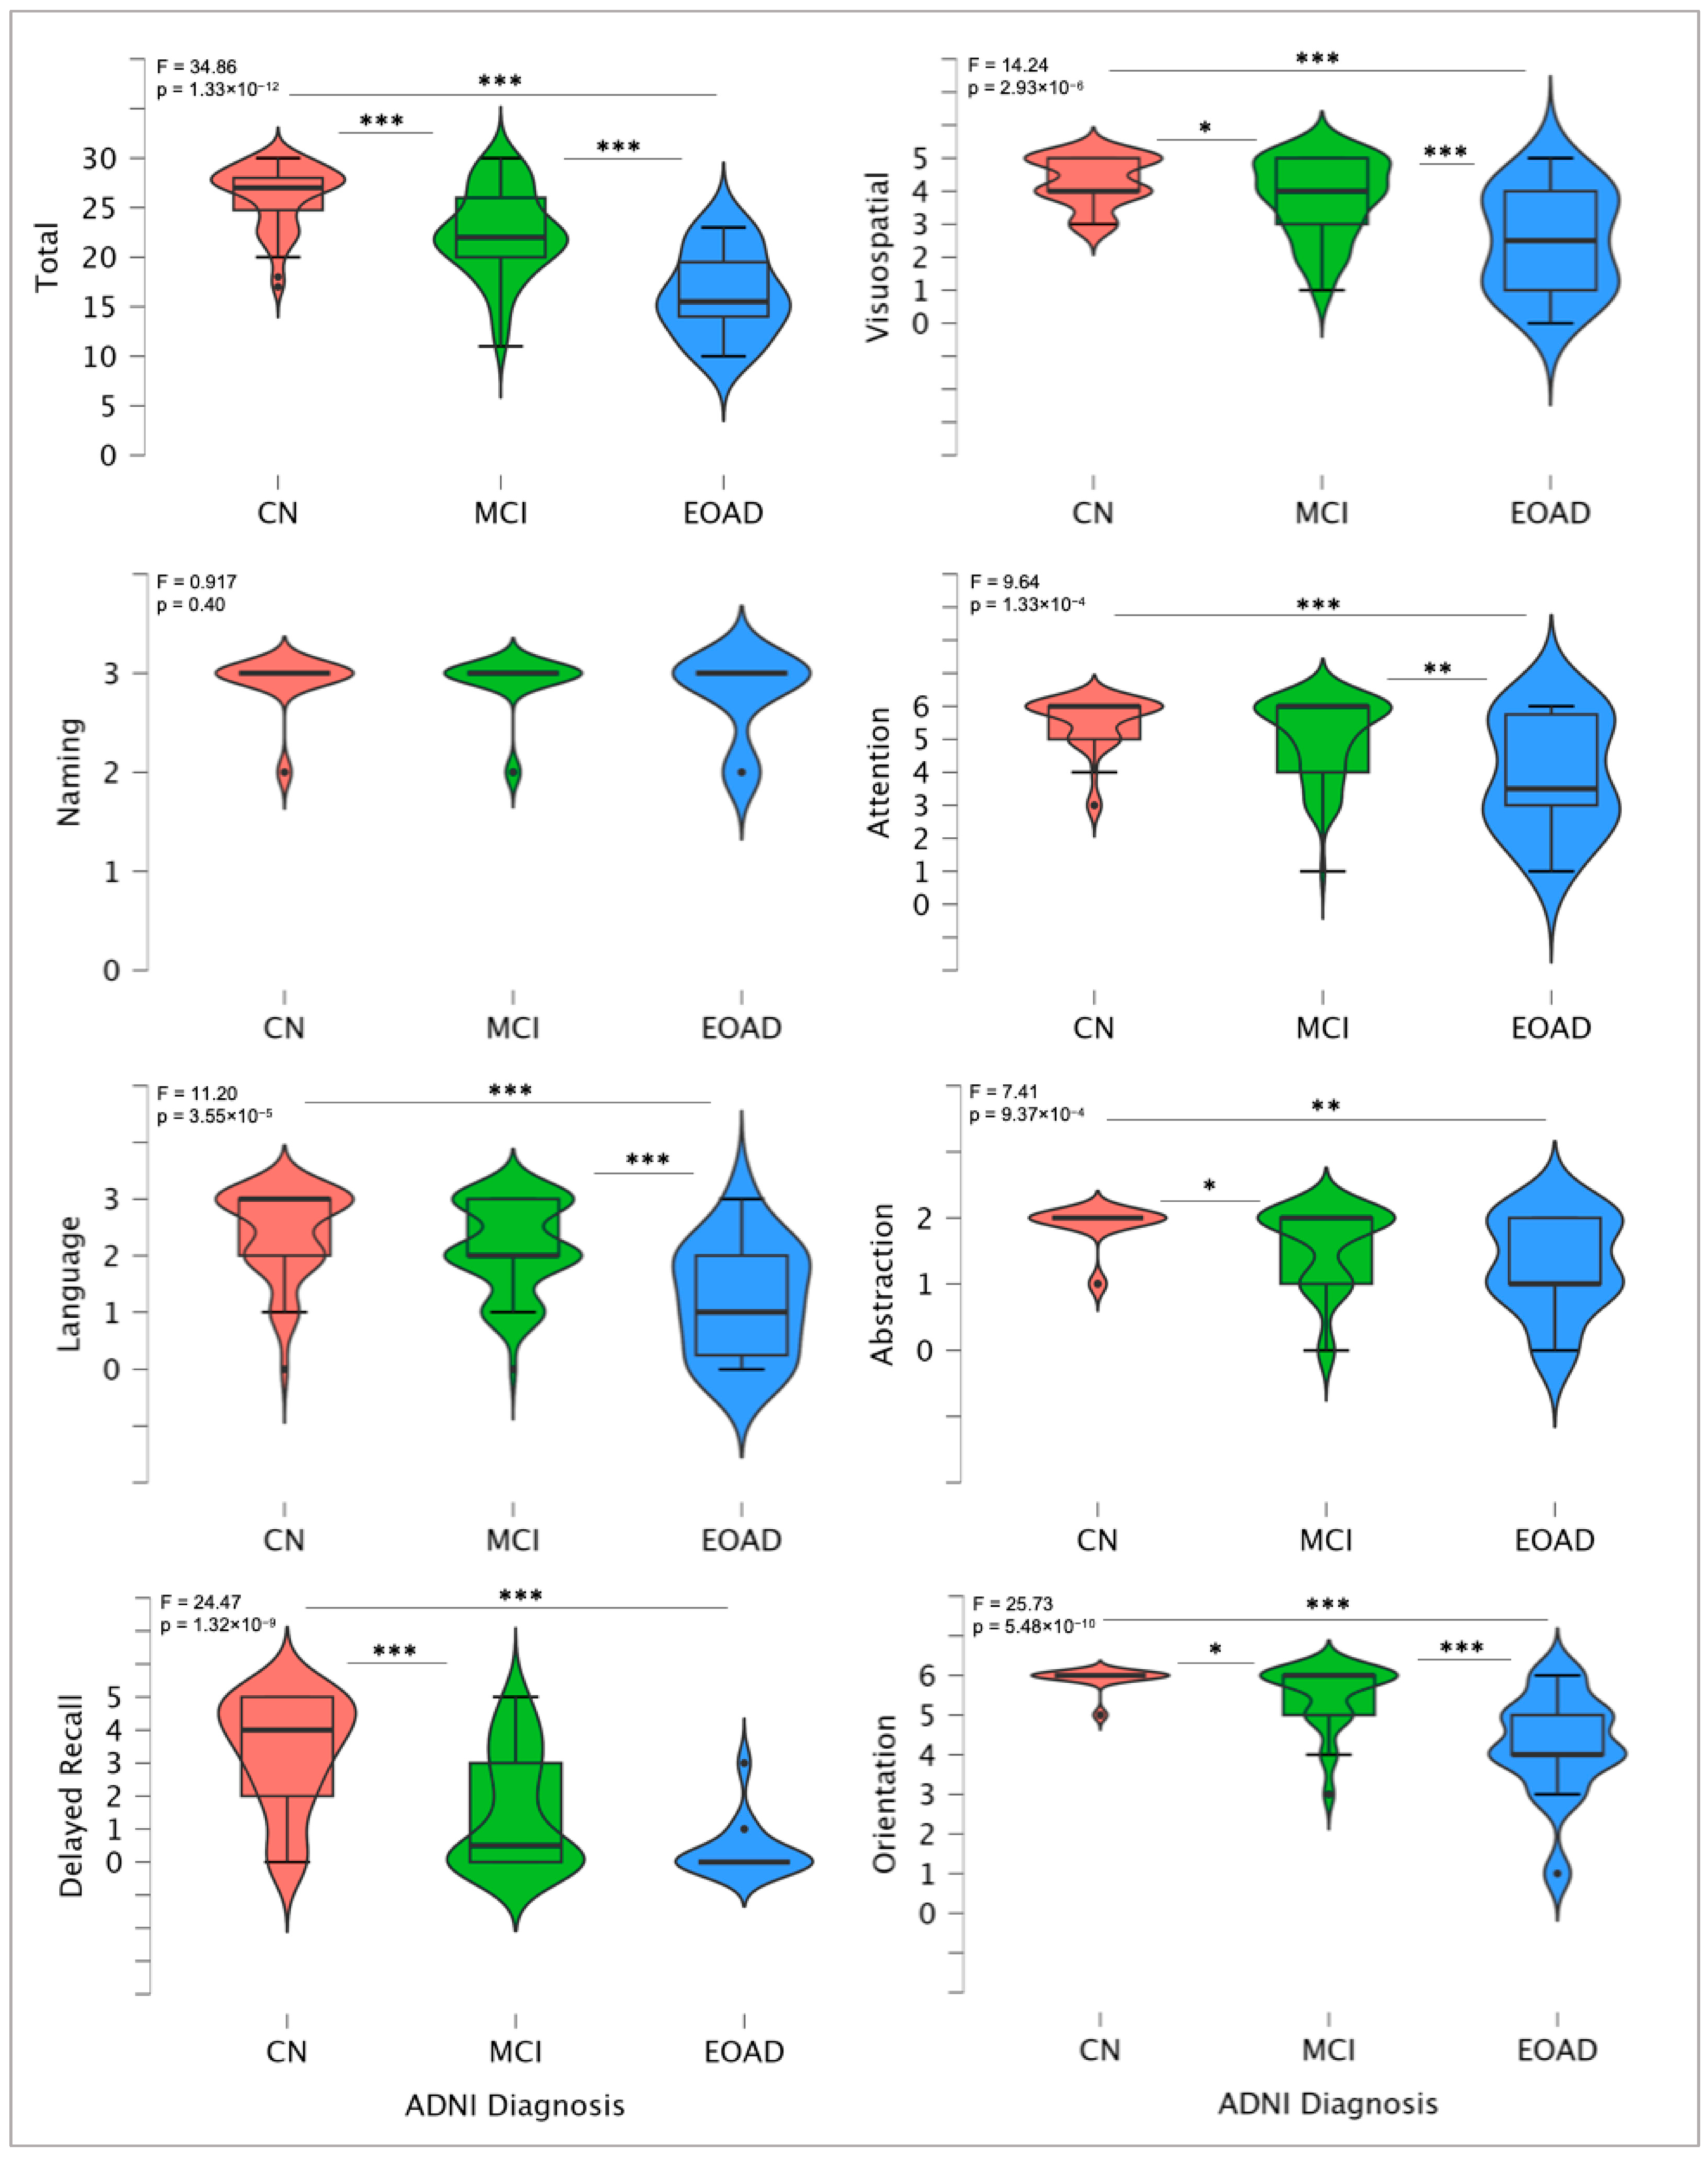
3.2. MoCA Total and Domain-Specific Scores

Total and the domain-specific MoCA sub-scores, Visuospatial and Orientation, were significantly different across all three groups (Figure 1). For Naming, no significant group differences were found. Attention was significantly different between CN and EOAD and Language was significantly different between MCI and EOAD (Figure 1). Abstraction and Delayed Recall identified that both MCI and EOAD were significantly different to CN, but not to each other (Figure 1).

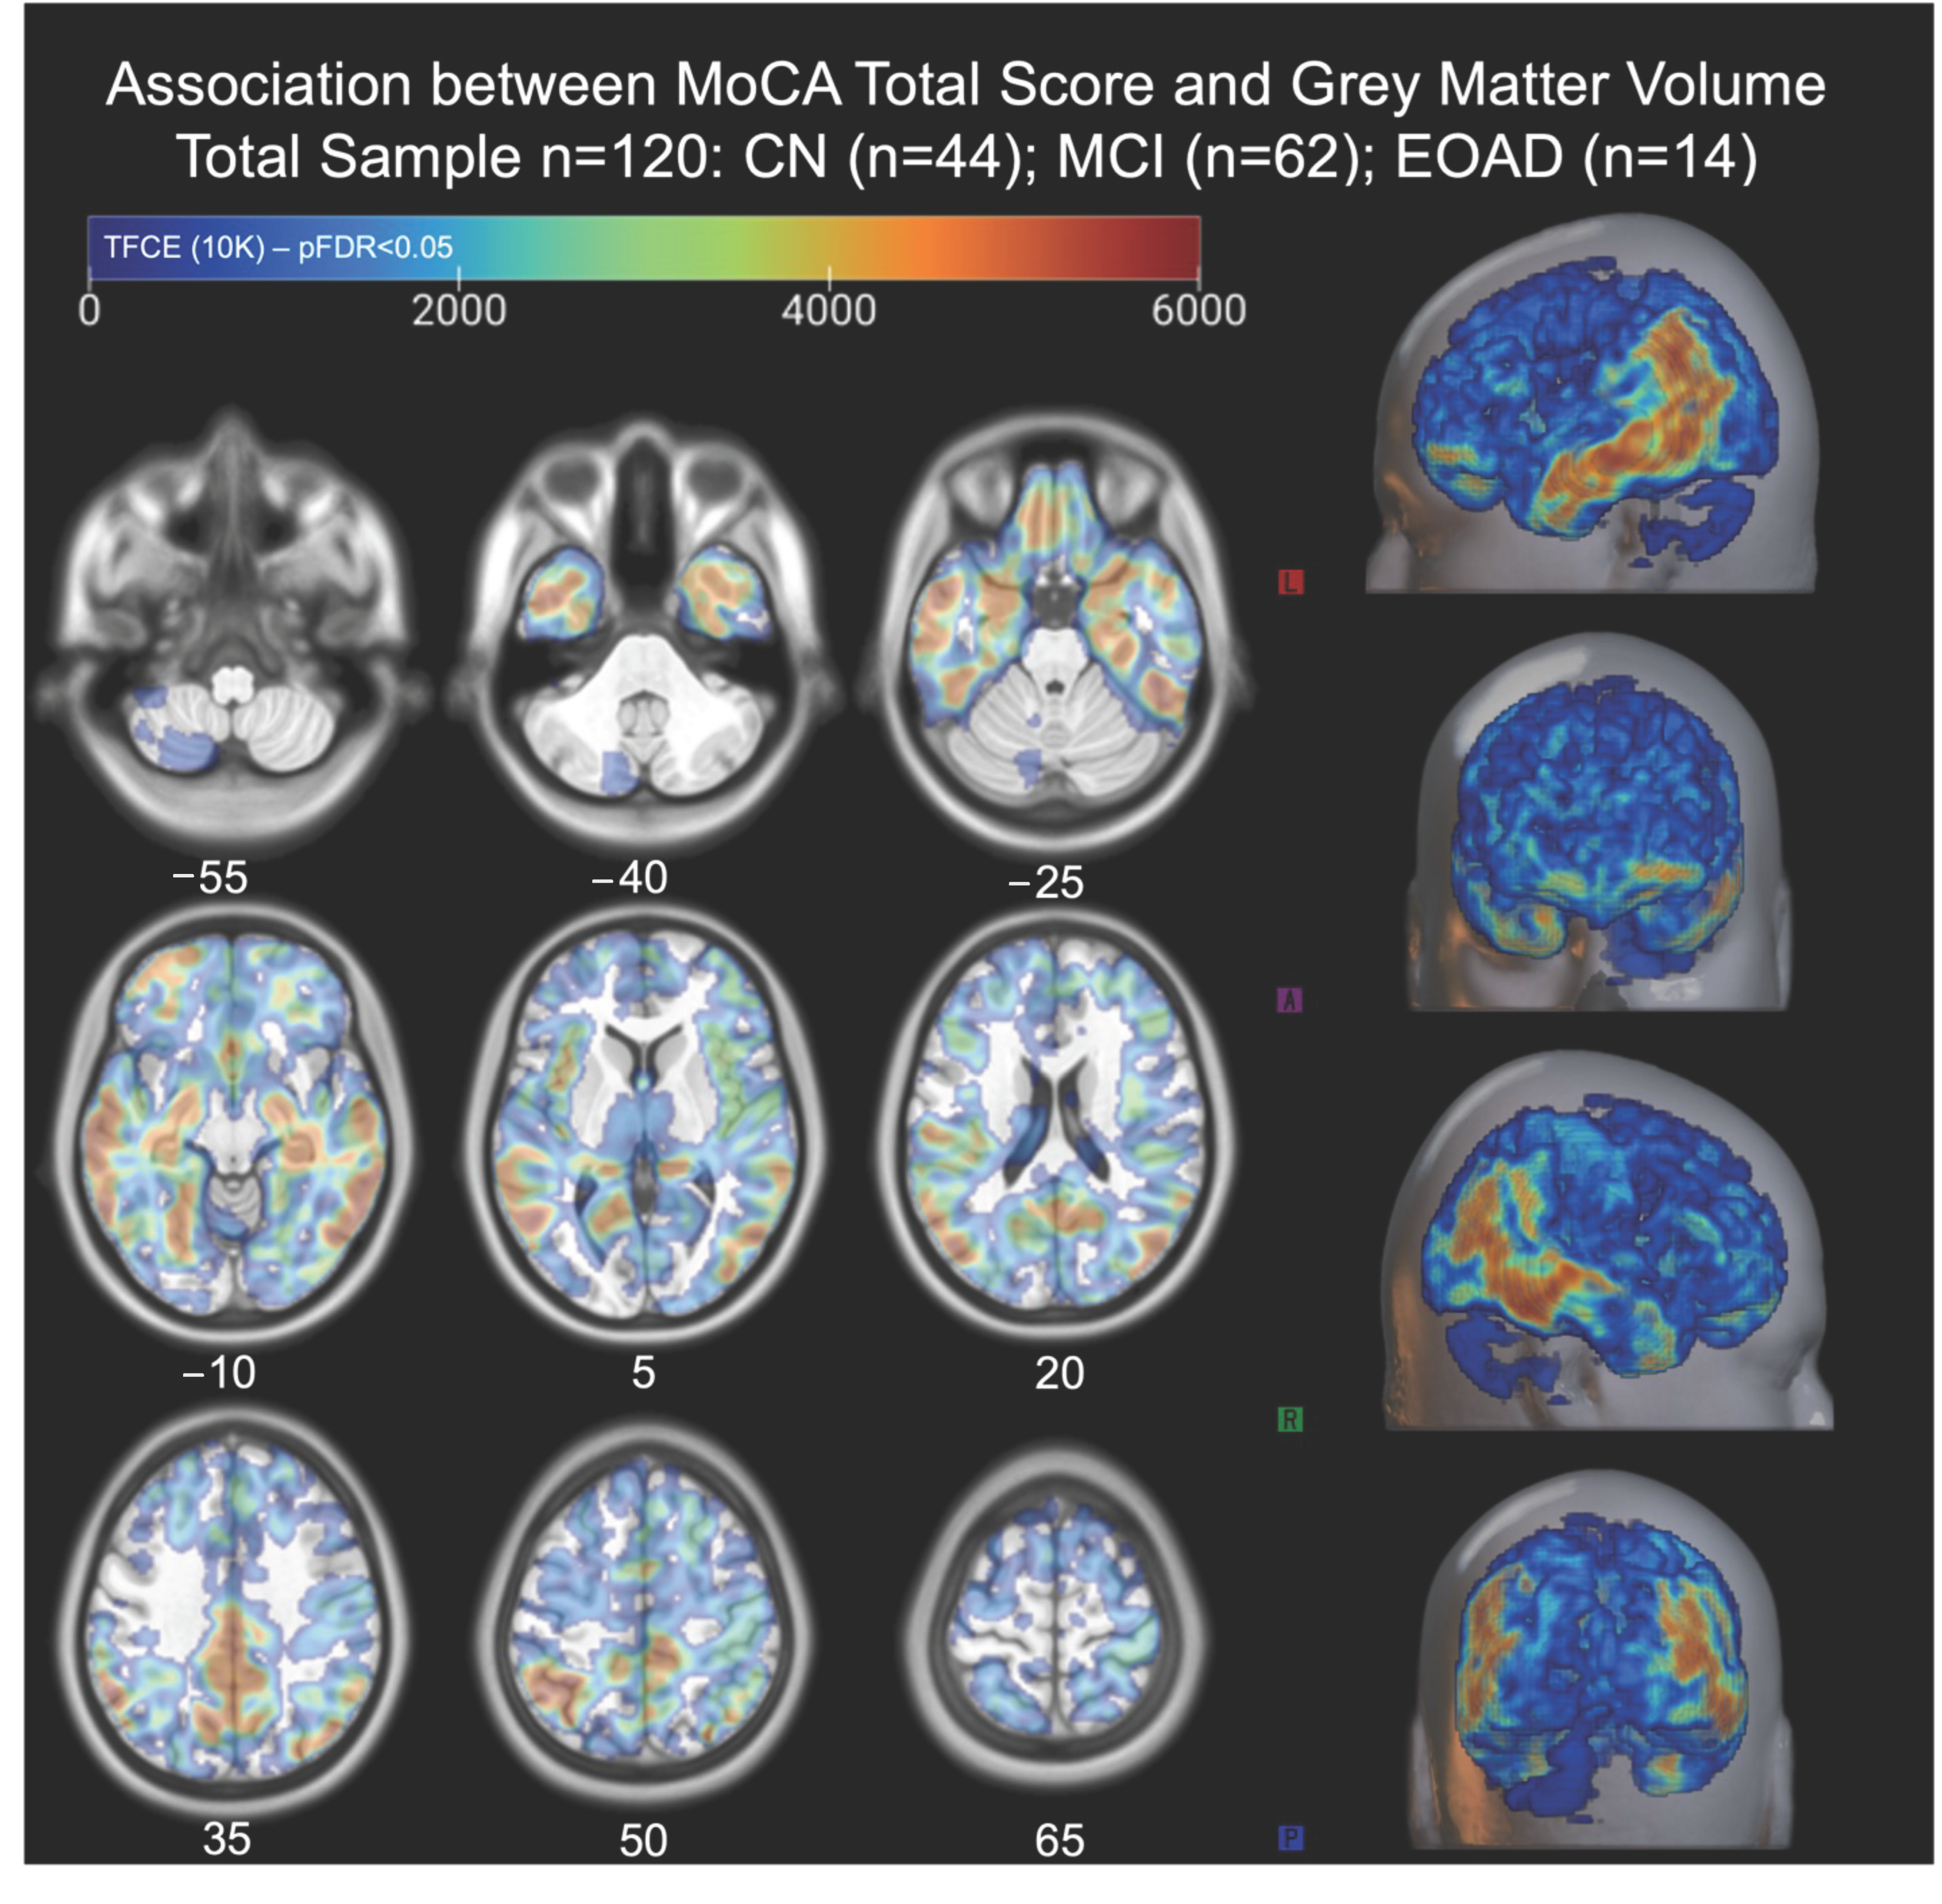
3.3. Global Associations Between MoCA Total Score and Gray Matter Volume

GMV associations with MoCA total score were examined whilst adjusting for sex, race, ethnicity, and TIV (Figure 2), and the identified significant positive correlations with GMV loss. Peak clusters spanned many areas of the brain, but were mainly focused around the temporal, fusiform, and inferior parietal areas (Table 2).

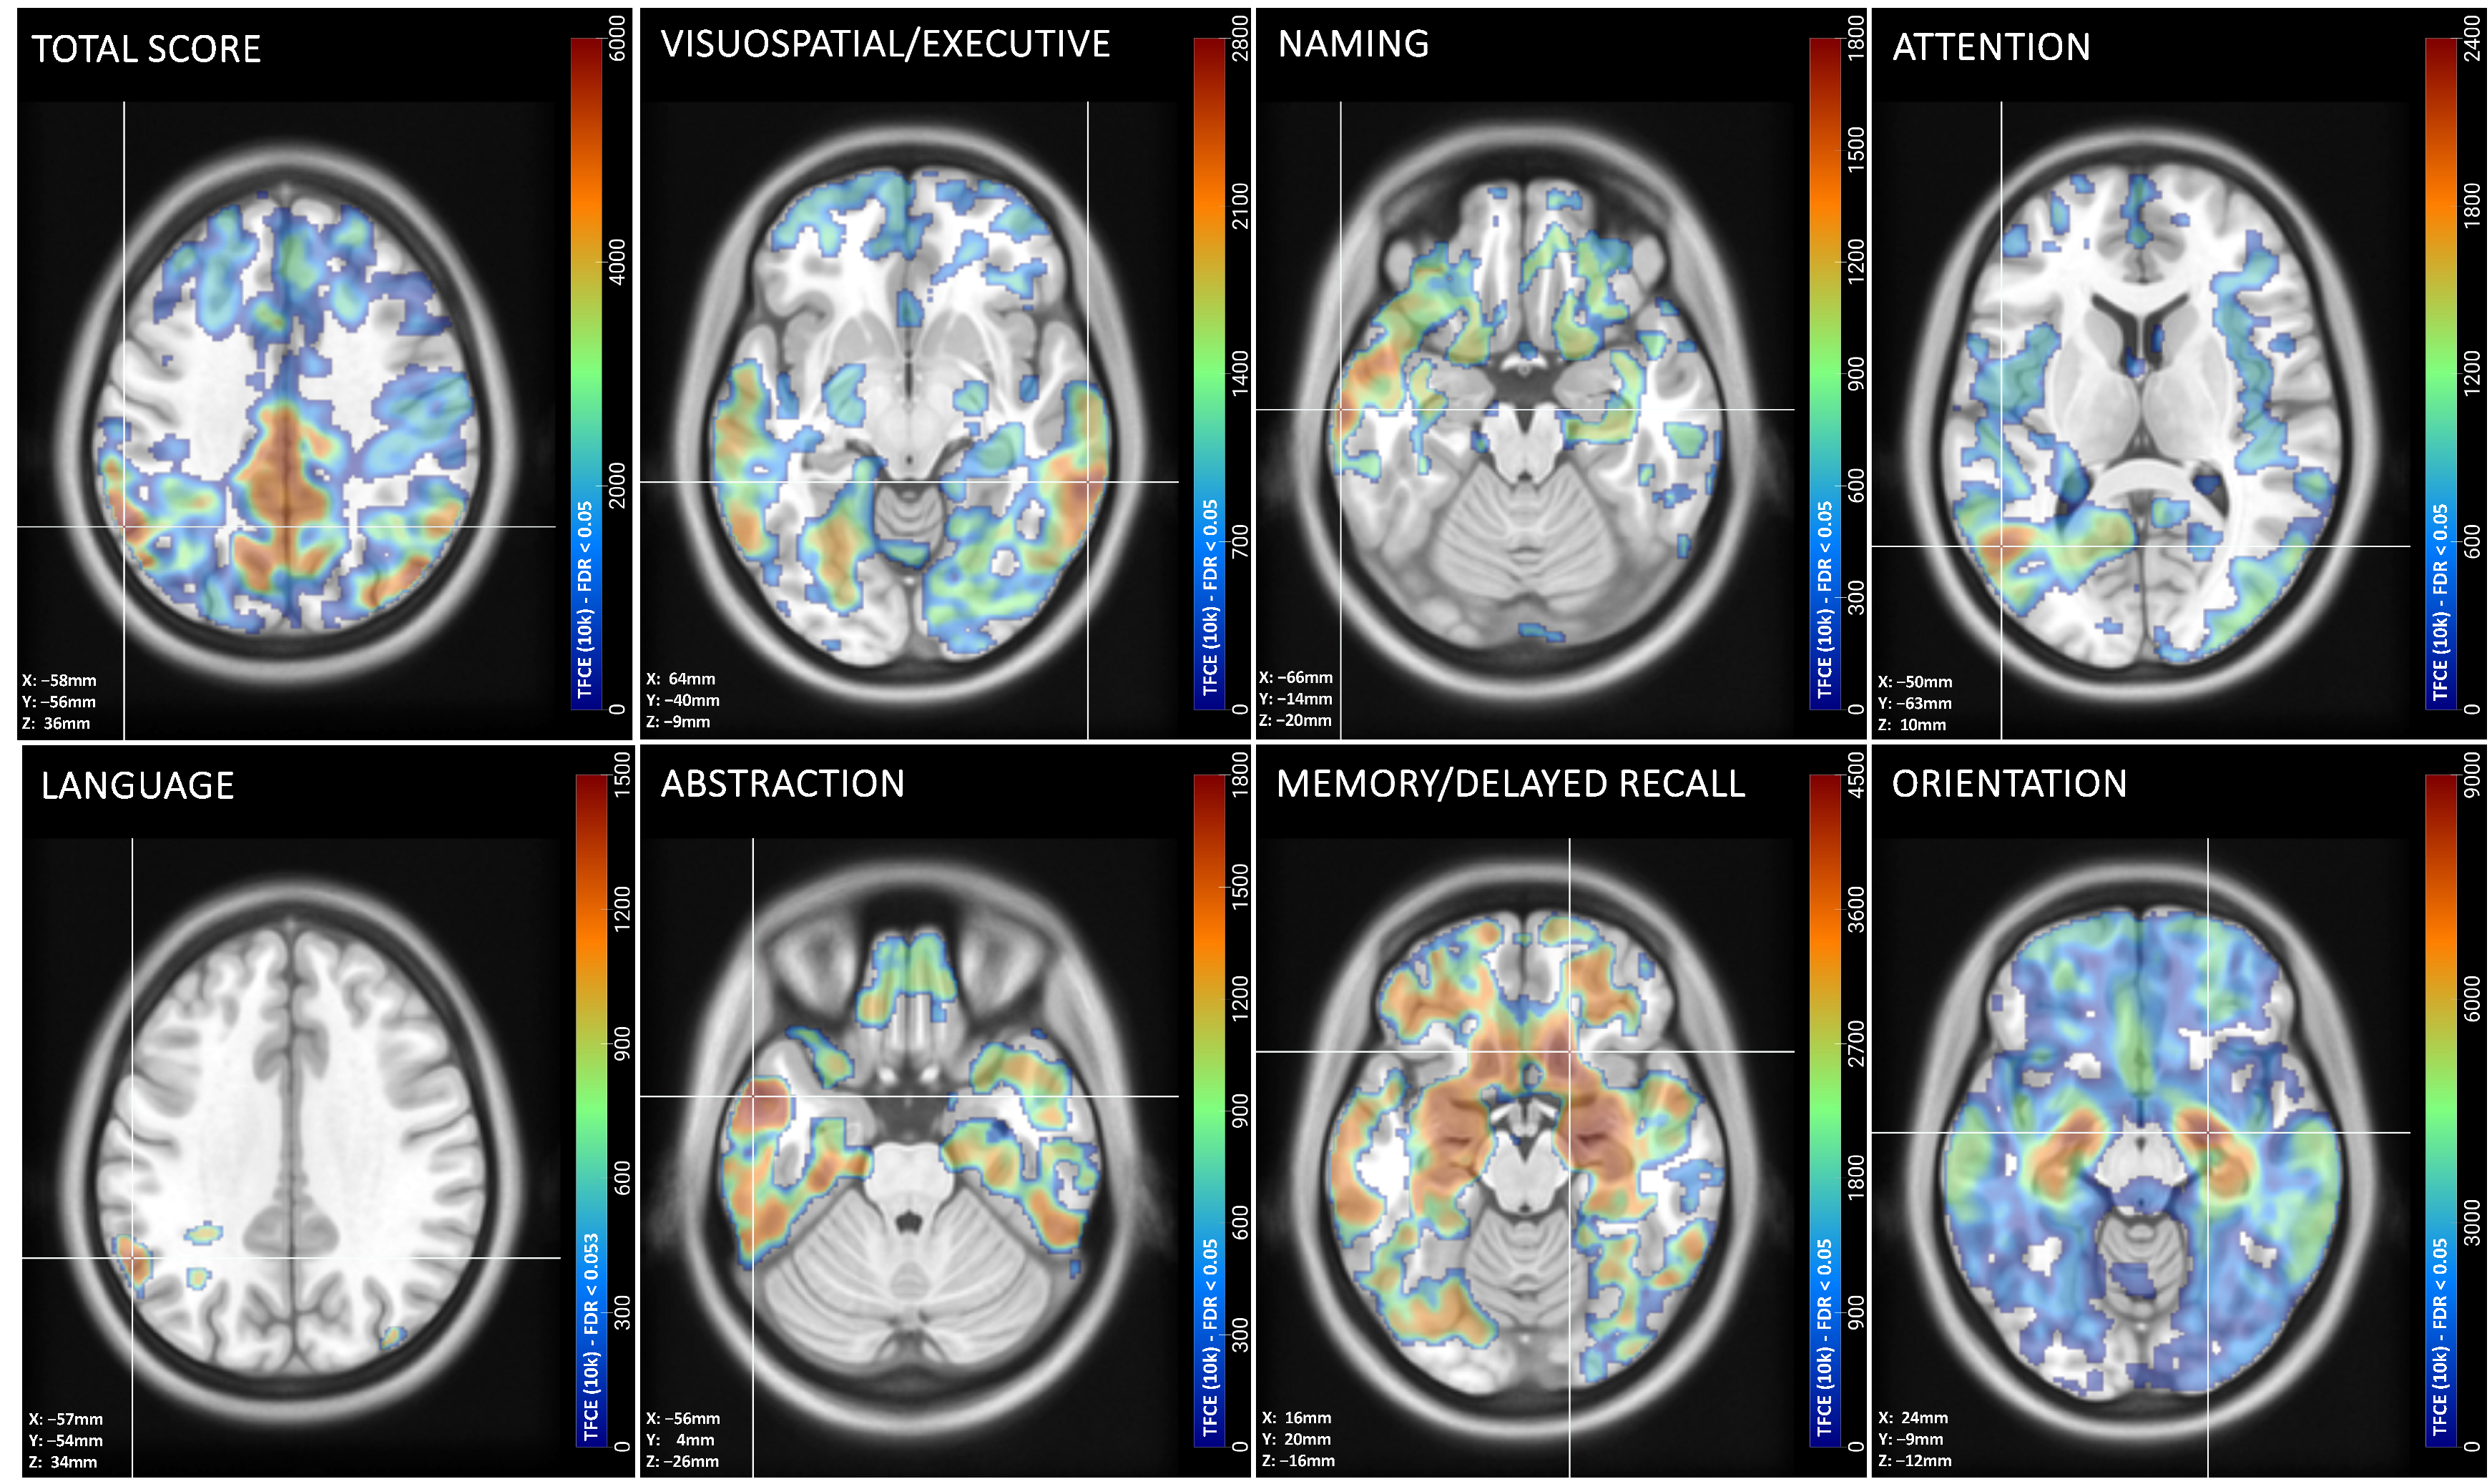
3.4. Peak Associations Between MoCA Domain Scores and Gray Matter Volume

Peak VBM-GMV associations with the total, and each of the seven individual MoCA subsection scores, whilst adjusting for sex, race, ethnicity, and TIV, were examined. Following 10k permutations of TFCE and FDR thresholding to p < 0.05, our results highlighted significant GMV clusters in six of the seven distinct MoCA cognitive domains, as well as the MoCA total score (Figure 3); the Language domain only approached our significance threshold at pFDR = 0.053 (Table 2).
Qualitative examination of individual peak GMV-atrophy cluster domain associations identified temporal lobe atrophy shared across the total and all cognitive domains (Table 2; Supplementary Tables S1–S9). Significant GMV associations are also noted across the parietal and frontal lobes for Visuospatial, Language, Delayed Recall, Orientation, and Total Score, as well as the partial occipital lobe in Visuospatial, Attention, and Total Score (Table 2). The largest multi-focal peak effect sizes were noted in the GMV association with the Total Score, which included a cluster compromising 58.2% of the intracranial volume. Subsequently, the cognitive domains of Orientation (53.8%) and Visuospatial (34.7%) showed considerable multi-focal peak clusters. Delayed Recall, Attention, and Language revealed similarly sized clusters comprising approximately 22% of intracranial volume, with the Abstraction model also revealing a large cluster compromising of 19.2%. Lastly, the Naming correlation showed the smallest but still significant multi-focal peak cluster compromising 7.6% of the intracranial volume (Table 2).

3.5. Significant Spearman’s Correlations Between MoCA Cognitive Domain Scores and Regional Gray Matter Volume

Spearman’s correlations examined 116 aal3-atlas-based ROIs for TIV-corrected GMV estimates (in mL) with each of the seven MoCA domain scores and the final Total Score. All eight correlation sets were significant in the positive direction for a range of underlying ROIs (see Table S10 for summary and Tables S11–S18 for individual domains), highlighting a whole-brain gray matter volume reduction associated with lower cognition, and in a cognitive domain-specific manner, as distinguished by the number and types of regions that were significant correlates of MoCA sub-scores. Briefly, regional correlations that survived FDR = 10% correction were evident in the Total Score and Visuospatial/Executive, Naming, Delayed Recall, and Orientation domains, but not in the Attention, Language, and Abstraction domains, which only displayed nominal results (Table S10). Nevertheless, for all eight correlation sets, the regional results (Tables S11–S18) largely overlapped with those from the voxel-wise findings (Tables S1–S9). Furthermore, all eight domains indicated significant correlations with distinct cortical structures as well as the cortical structures involved in larger neural networks (Tables S11–S18).

4. Discussion

In the present study, we examined GMV estimates across the EOAD continuum and their correlations with MoCA sub-scores to establish which cognitive domains associate with topology-based GMV as a measure of brain health. We hypothesized that each MoCA sub-domain and its associations with GMV would differentially and distinctly map onto brain topology. This would provide not only evidence for structural and functional correlations in EOAD but also provide us with a discussion of how a brief cognitive battery (MoCA) and an accessible neuroimaging biomarker of brain health (GMV) can inform the clinical research process when studying early-onset dementia, such as EOAD. This is a critical gap, as neuroimaging correlates of CI in such individuals may illuminate alternative methods for early detection and diagnosis.
We assessed cognition using the MoCA, which was external to the diagnostic battery used in the classification of CN, MCI, and EOAD, avoiding any potential sampling bias effects, when studying cognitive domain association with GMV [33]. We examined neural correlates of cognitive performance using eight separate models containing either the total score or one of the seven subdomains across the cognitive decline spectrum of EOAD. We also tested Spearman’s partial correlations between cognition and GMV aal3-atlas parcellated ROIs (in ml). Generally, our results illustrate the shape and extent of GMV directly associated with MoCA domain scores.
As expected, the Total Score, capturing deficits across multiple domains of cognition, was associated with the largest peak effect cluster. Multi-focal peak associations between the MoCA Total Score and GMV were observed at the supramarginal, angular, inferior parietal, inferior temporal, cerebellum, fusiform, and inferior occipital gyri. These results are consistent with findings from previous studies that have described differences between EOAD and LOAD, such as the reduced occipital and parietal atrophy seen more so in the former rather than the latter [12,42,43].
The second largest cluster was for Orientation, whereby declining Orientation subscale scores are one of the more severe symptoms of LOAD, indicative of functional debilitation [44,45]. Our study also highlights that Orientation identified multi-focal peak associations at the hippocampal, parahippocampal, and insula gyri, all of which have been linked to deficits in orientation [46,47,48]. However, our study also revealed peaks in the fusiform, superior temporal gyri, amygdala, pallidum, putamen, insula, olfactory, posterior, and medial orbital gyri, all of which require further study, but could be involved in larger network-based neurocognitive processes [45].
Visuospatial/Executive correlations highlighted another large multi-focal peak cluster composed of the right middle temporal, right inferior temporal, and the right crus I of the cerebellum as well as the left superior occipital gyrus. This is in line with prior studies suggesting that visuospatial cognition is predominantly mediated by the right-hemispheric neural network, in particular the inferior temporal cortex and occipital cortex [49,50]. ROI-level correlations identified a higher prevalence of right-hemispheric associations, including the right inferior and anterior orbital frontal gyri, which were less evident in our VBM results. Our results are also consistent with prior research demonstrating how executive cognitive function is associated with frontal lobe and prefrontal cortex activity [51].
Delayed Recall correlation analyses identified clusters with multi-focal peaks within the medial, posterior, and anterior orbital gyri, which spread into the olfactory cortex and the medial orbital superior frontal gyri, while extending posteriorly through the anterior cingulate, and then inferiorly through the nucleus accumbens and caudate nucleus into the parahippocampal gyrus, superior temporal gyrus and amygdala, all of which are associated with AD [52,53,54]. This cluster of interconnected regions highlights the intricate network involved in memory decline as one of the major underlying cerebral correlates of memory processes [43], particularly in the context of hippocampal–parietal–frontal network atrophy [55].
Similarly sized peak effect clusters were observed for Attention and Language correlations. Prior studies suggest that Attention employs neural networks involved in the activation of the bilateral prefrontal cortices, bilateral parietal cortices, and the left occipital lobe [22,56,57], which we highlighted more so with peak effects in the left parietal gyrus and the left middle occipital gyrus in our results.
Language is generally associated with a left-hemisphere-dominated neural network between Wernicke’s area in the temporal lobe [58] and Broca’s area in the frontal lobe [59], but has also been linked to complex connections with other cortical structures, specifically where language processing and speech generation are correlated with the activity of the supramarginal and angular gyri [60], all of which were within the multi-focal peak cluster observed herein. Additionally, ROI-based analyses of Language associations revealed significant correlations with the left inferior parietal gyrus which includes both the supramarginal and angular gyri, further validating our results. Nonetheless, Language associations approached passing our multiple comparisons corrections, which could be due to language being an aspect of crystallized intelligence as opposed to fluid intelligence with literature supporting that crystallized ability is spared initially in age-related neurodegenerative disorders [61]. Considering our sample is younger, Language could be less impacted, or this result could be a sample size issue.
Abstraction associations identified a multi-focal peak cluster with significant coordinates noted within the left superior, middle, and inferior temporal gyrus. Further analyses identified significant associations within the left middle temporal pole. Prior studies suggest that Abstraction typically activates left-lateralized neural networks [62], specifically with a locus in left temporal lobe activity, which is in agreement with our observations.
The smallest cluster with multi-focal peaks observed was for Naming associations, which have been associated with neuropathology in the occipital–temporal regions, particularly the fusiform gyrus in the prior literature [63]. Our Naming peak cluster did not include the fusiform gyrus but rather had strong associations within the temporal lobes. Significant Naming associations were also identified within the right posterior orbital frontal cortex, which, to the best of our knowledge, is not a cortical region that has previously been associated with picture naming impairments [42]. ROI-level analyses further support this novel association between the right posterior orbital frontal cortex and impairments in cognitive Naming.
Taken together, our results illustrate several important findings, particularly as the voxel- and ROI-based results largely overlapped with each other. Primarily, they illustrate the topographical signature and extent of EOAD, as captured by evidence of cerebral atrophy in relation to the MoCA total score. We also highlight individual cognitive domain functions as captured by each of the MoCA subsections. The present study advances our current understanding of the neural correlates of cognition in EOAD, as highlighted by our results that show neural correlates for global cognitive-based cognition. Future studies stand to benefit from interrogating further associations with other morphometric measures, such as surface- and- deformation-based morphometry (i.e., cortical thickness and complexity), which can span beyond just GMV estimations to include WM tissue, as well as diffusion tensor imaging and diffusion spectrum magnetic resonance imaging. The rationale would be that different morphometric measurements such as these will have different cortical sensitivities associated with the MoCA total and individual cognitive domains.

Limitations

There are several limitations to our study. Sample size differences between the three subject groups would be more negligible if there were a larger total sample size. Additionally, there were limited differences in the racial and ethnic makeup of the subject population, with most of the population self-identifying as White and non-Hispanic/-Latino. Although we adjusted for these existing demographic differences in our analyses, the overall lack of racial and ethnic diversity limits the ability to test for effect moderation and, consequently, limits the generalizability of our findings. Genetic risk factors, cerebrovascular disease, Alzheimer’s molecular biomarkers, such as amyloid-beta and neurofibrillary tau tangles, and pharmacological intake are other omitted variables that have the potential to change our interpretations but were beyond the scope of the present study and should be further pursued. A study sample of LOAD subjects would have benefited the overall interpretation of EOAD and LOAD differences and should be the basis of future investigations. Furthermore, early-onset AD patients more commonly present with atypical, non-amnestic phenotypes compared to late-onset AD patients, which may affect the neuropsychological profiles and atrophy patterns of these patients. Although information regarding the clinical presentation of the early-onset patients (i.e., amnestic, frontal, multi-domain, etc.) would critically inform our study, we note this is a limitation since not all subjects had this information.

5. Conclusions

The present study demonstrates an efficient way to highlight the unique neural correlates for global and domain-based cognition within the EOAD cognitive decline continuum. These findings can be clinically leveraged during brief cognitive and neuroimaging efforts at screening and diagnostic stages, but also for future clinical research studies. For example, this study could be expanded to investigate the signatures of other neurodegenerative disorders, such as Lewy Body Dementia, Parkinson’s dementia, or psychiatric disorders that can present with CI, such as post-traumatic stress disorder, schizophrenia, and depression. Future studies could also investigate the correlation of the MoCA domains and molecular biomarkers of AD through the analysis of PET imaging [40]. Comparisons with EOAD and LOAD would help disentangle their differential neurodegenerative signatures across the lifespan. In conclusion, our study shows results for domain-specific neural correlates of cognition in one easy analytic approach and can be similarly deployed to disentangle signatures across different neurological and psychiatric conditions.

Supplementary Materials

The following supporting information can be downloaded at: https://www.mdpi.com/article/10.3390/jdad2030024/s1, Figure S1: SPM data matrix for all eight general linear models analyzing gray matter (GM) volume associations with each cognitive domain from the Montreal Cognitive Assessment (MoCA), in a sample of Alzheimer’s Disease Neuroimaging Initiative (ADNI) Healthy Controls (n = 44), Mild Cognitive Impairment (n = 62), and early-onset Alzheimer’s disease (n = 14). Table S1. Peak gray matter (GM) volume associations with each cognitive domain from the Montreal Cognitive Assessment (MoCA), in a sample of Alzheimer’s Disease Neuroimaging Initiative (ADNI) Healthy Controls (n = 44), Mild Cognitive Impairment (n = 62), and early-onset Alzheimer’s disease (n = 14). Positive contrasts generated from multiple general linear models adjusting for sex, race, ethnicity and Total Intracranial Volume (TIV) that then underwent Threshold-Free Cluster Enhancement (TFCE) and passed False Rate Discovery (FDR) correction. “*” indicates failure to pass threshold of 0.05. Table indicates peak cluster brain region for each cognitive domain as determined by the AAL3 brain atlas region. Table S2. Gray matter volume (GMV) associations with the Visuospatial/Executive domain from the Montreal Cognitive Assessment (MoCA), in a sample of Alzheimer’s Disease Neuroimaging Initiative (ADNI) Healthy Controls (n = 44), Mild Cognitive Impairment (n = 62), and early-onset Alzheimer’s disease (n = 14). Positive contrast generated from general linear model adjusting for sex, race, ethnicity and Total Intracranial Volume (TIV) that then underwent Threshold- Free Cluster Enhancement (TFCE) and passed False Rate Discovery (FDR) correction at 0.053. Table indicates center of gravity cluster brain region as determined by the aal3 brain atlas region. Table S3. Gray matter volume (GMV) associations with the Naming domain from the Montreal Cognitive Assessment (MoCA), in a sample of Alzheimer’s Disease Neuroimaging Initiative (ADNI) Healthy Controls (n = 44), Mild Cognitive Impairment (n = 62), and early-onset Alzheimer’s disease (n = 14). Positive contrast generated from general linear model adjusting for sex, race, ethnicity and Total Intracranial Volume (TIV) that then underwent Threshold- Free Cluster Enhancement (TFCE) and passed False Rate Discovery (FDR) correction at 0.053. Table indicates center of gravity cluster brain region as determined by the aal3 brain atlas region. Table S4. Gray matter volume (GMV) associations with the Attention domain from the Montreal Cognitive Assessment (MoCA), in a sample of Alzheimer’s Disease Neuroimaging Initiative (ADNI) Healthy Controls (n = 44), Mild Cognitive Impairment (n = 62), and early-onset Alzheimer’s disease (n = 14). Positive contrast generated from general linear model adjusting for sex, race, ethnicity and Total Intracranial Volume (TIV) that then underwent Threshold- Free Cluster Enhancemnet (TFCE) and passed False Rate Discovery (FDR) correction at 0.053. Table indicates center of gravity cluster brain region as determined by the aal3 brain atlas region. Table S5. Gray matter volume (GMV) associations with the Language domain from the Montreal Cognitive Assessment (MoCA), in a sample of Alzheimer’s Disease Neuroimaging Initiative (ADNI) Healthy Controls (n = 44), Mild Cognitive Impairment (n = 62), and early-onset Alzheimer’s disease (n = 14). Positive contrast generated from general linear model adjusting for sex, race, ethnicity and Total Intracranial Volume (TIV) that then underwent Threshold- Free Cluster Enhancement (TFCE) and passed False Rate Discovery (FDR) correction at 0.053. Table indicates center of gravity cluster brain region as determined by the aal3 brain atlas region. Table S6. Gray matter volume (GMV) associations with the Abstraction domain from the Montreal Cognitive Assessment (MoCA), in a sample of Alzheimer’s Disease Neuroimaging Initiative (ADNI) Healthy Controls (n = 44), Mild Cognitive Impairment (n = 62), and early-onset Alzheimer’s disease (n = 14). Positive contrast generated from general linear model adjusting for sex, race, ethnicity and Total Intracranial Volume (TIV) that then underwent Threshold- Free Cluster Enhancement (TFCE) and passed False Rate Discovery (FDR) correction at 0.053. Table indicates center of gravity cluster brain region as determined by the aal3 brain atlas region. Table S7. Gray matter volume (GMV) associations with the Memory/Delayed Recall domain from the Montreal Cognitive Assessment (MoCA), in a sample of Alzheimer’s Disease Neuroimaging Initiative (ADNI) Healthy Controls (n = 44), Mild Cognitive Impairment (n = 62), and early-onset Alzheimer’s disease (n = 14). Positive contrast generated from general linear model adjusting for sex, race, ethnicity and Total Intracranial Volume (TIV) that then underwent Threshold- Free Cluster Enhancement (TFCE) and passed False Rate Discovery (FDR) correction at 0.053. Table indicates center of gravity cluster brain region as determined by the aal3 brain atlas region. Table S8. Gray matter volume (GMV) associations with the Orientation domain from the Montreal Cognitive Assessment (MoCA), in a sample of Alzheimer’s Disease Neuroimaging Initiative (ADNI) Healthy Controls (n = 44), Mild Cognitive Impairment (n = 62), and early-onset Alzheimer’s disease (n = 14). Positive contrast generated from general linear model adjusting for sex, race, ethnicity and Total Intracranial Volume (TIV) that then underwent Threshold- Free Cluster Enhancement (TFCE) and passed False Rate Discovery (FDR) correction at 0.053. Table indicates center of gravity cluster brain region as determined by the aal3 brain atlas region. Table S9. Gray matter volume (GMV) associations with the Total Score from the Montreal Cognitive Assessment (MoCA), in a sample of Alzheimer’s Disease Neuroimaging Initiative (ADNI) Healthy Controls (n = 44), Mild Cognitive Impairment (n = 62), and early-onset Alzheimer’s disease (n = 14). Positive contrast generated from general linear model adjusting for sex, race, ethnicity and Total Intracranial Volume (TIV) that then underwent Threshold- Free Cluster Enhancement (TFCE) and passed False Rate Discovery (FDR) correction at 0.053. Table indicates center of gravity cluster brain region as determined by the aal3 brain atlas region. Table S10. Summary Table of signficant spearman’s correlations from Tables S11–18. Total Intracranial Volume-corrected gray matter volume (GMV) associations with several cognitive domains in a sample of early onset Alzheimer’s Disease Neuroimaging Initiative (ADNI) who were either Cognitvely Normal (n = 44), Mild Cognitive Impairment (n = 62), or early onset Alzheimer’s disease (n = 14). Note: “+” indicates nominal threshold passing and failute to pass False Rate Discovery Rate (FDR). For the full list of 116 ROIs tested for associations with each of the eight MoCA scores, see Supplementary Tables S11–S18. Note: L = Left hemishere; R = Right hemisphere. Table S11. Gray matter volume (GMV) associations with the Visuospatial/Executive domain from the Montreal Cognitive Assessment (MoCA), in a sample of Alzheimer’s Disease Neuroimaging Initiative (ADNI) Healthy Controls (n = 44), Mild Cognitive Impairment (n = 62), and early onset Alzheimer’s disease (n = 14). Spearman correlation model constructed to determine significant ROI regions. Note: FDR = False Rate Discovery Rate. * = p < 0.1; ** = p < 0.05; and *** = p 0.01. Table S12. Gray matter volume (GMV) associations with the Naming domain from the Montreal Cognitive Assessment (MoCA), in a sample of Alzheimer’s Disease Neuroimaging Initiative (ADNI) Healthy Controls (n = 44), Mild Cognitive Impairment (n = 62), and early onset Alzheimer’s disease (n = 14). Spearman correlation model constructed to determine significant ROI regions. Note: FDR = False Rate Discovery Rate. * = p < 0.1; ** = p < 0.05; and *** = p 0.01. Table S13. Gray matter volume (GMV) associations with the Attention domain from the Montreal Cognitive Assessment (MoCA), in a sample of Alzheimer’s Disease Neuroimaging Initiative (ADNI) Healthy Controls (n = 44), Mild Cognitive Impairment (n = 62), and early onset Alzheimer’s disease (n = 14). Spearman correlation model constructed to determine significant ROI regions. Note: FDR = False Rate Discovery Rate. * = p < 0.1; ** = p < 0.05; and *** = p 0.01. Table S14. Gray matter volume (GMV) associations with the Language domain from the Montreal Cognitive Assessment (MoCA), in a sample of Alzheimer’s Disease Neuroimaging Initiative (ADNI) Healthy Controls (n = 44), Mild Cognitive Impairment (n = 62), and early onset Alzheimer’s disease (n = 14). Spearman correlation model constructed to determine significant ROI regions. Note: FDR = False Rate Discovery Rate. * = p < 0.1; ** = p < 0.05; and *** = p 0.01. Table S15. Gray matter volume (GMV) associations with the Abstraction domain from the Montreal Cognitive Assessment (MoCA), in a sample of Alzheimer’s Disease Neuroimaging Initiative (ADNI) Healthy Controls (n = 44), Mild Cognitive Impairment (n = 62), and early onset Alzheimer’s disease (n = 14). Spearman correlation model constructed to determine significant ROI regions. Note: FDR = False Rate Discovery Rate. * = p < 0.1; ** = p < 0.05; and *** = p 0.01. Table S16. Gray matter volume (GMV) associations with the Memory/Delayed Recall domain from the Montreal Cognitive Assessment (MoCA), in a sample of Alzheimer’s Disease Neuroimaging Initiative (ADNI) Healthy Controls (n = 44), Mild Cognitive Impairment (n = 62), and early onset Alzheimer’s disease (n = 14). Spearman correlation model constructed to determine significant ROI regions. Note: FDR = False Rate Discovery Rate. * = p < 0.1; ** = p < 0.05; and *** = p 0.01. Table S17. Gray matter volume (GMV) associations with the Orientation domain from the Montreal Cognitive Assessment (MoCA), in a sample of Alzheimer’s Disease Neuroimaging Initiative (ADNI) Healthy Controls (n = 44), Mild Cognitive Impairment (n = 62), and early onset Alzheimer’s disease (n = 14). Spearman correlation model constructed to determine significant ROI regions. Note: FDR = False Rate Discovery Rate. * = p < 0.1; ** = p < 0.05; and *** = p 0.01. Table S18. Gray matter volume (GMV) associations with the Total Score from the Montreal Cognitive Assessment (MoCA), in a sample of Alzheimer’s Disease Neuroimaging Initiative (ADNI) Healthy Controls (n = 44), Mild Cognitive Impairment (n = 62), and early onset Alzheimer’s disease (n = 14). Spearman correlation model constructed to determine significant ROI regions. Note: FDR = False Rate Discovery Rate. * = p < 0.1; ** = p < 0.05; and *** = p 0.01.

Author Contributions

Conceptualization: M.K.; Methodology: M.K., T.R. and V.Z.; Software: M.K. and Alzheimer’s Disease Neuroimaging Initiative; Validation: M.K. and T.R.; Formal Analysis: M.K. and T.R.; Investigation: M.K. and T.R.; Resources: M.K. and Alzheimer’s Disease Neuroimaging Initiative; Data Curation: T.R.; Writing—Original Draft: T.R.; Writing—Review and Editing: M.K., T.R., V.Z., C.H., C.C., A.P.F.C., R.K. and F.D.M.; Visualization: T.R.; Supervision: M.K.; Project Administration: M.K.; Funding Acquisition: M.K. All authors have read and agreed to the published version of the manuscript.

Funding

This research received no external funding.

Institutional Review Board Statement

IRB approval was not required because the authors of this study agreed to the Data Use Agreement through the ADNI Data Access application and used standard, de-identified datasets from their repository. For further details on the process, please see: https://adni.loni.usc.edu (accessed on 1 May 2023).

Informed Consent Statement

Informed consent was not required because the authors of this study agreed to the Data Use Agreement through the ADNI Data Access application and used standard, de-identified datasets from their repository. For further details on the process, please see: https://adni.loni.usc.edu (accessed on 1 May 2023).

Data Availability Statement

All data used in this manuscript were obtained from the ADNI dataset (https://ida.loni.usc.edu) (accessed on 1 May 2023) and can be made available upon request.

Acknowledgments

The authors acknowledge Alzheimer’s Disease Neuroimaging Initiative (ADNI), the National Institutes of Health Grant U01 AG024904 and DOD ADNI (Department of Defense Award Number W81XWH-12–2-0012) for providing access to Alzheimer’s disease data. ADNI is funded by the National Institute on Aging, the National Institute of Biomedical Imaging and Bioengineering, and through generous contributions from the following: AbbVie, Alzheimer’s Association; Alzheimer’s Drug Discovery Foundation; Araclon Biotech; BioClinica, Inc.; Biogen; Bristol-Myers Squibb Company; CereSpir, Inc.; Cogstate; Eisai Inc.; Elan Pharmaceuticals, Inc.; Eli Lilly and Company; EuroImmun; F. Hoffmann-La Roche Ltd. and its affiliated company Genentech, Inc.; Fujirebio; GE Healthcare; IXICO Ltd.; Janssen Alzheimer Immunotherapy Research & Development, LLC.; Johnson & Johnson Pharmaceutical Research & Development LLC.; Lumosity; Lundbeck; Merck & Co., Inc.; Meso Scale Diagnostics, LLC.; NeuroRx Research; Neurotrack Technologies; Novartis Pharmaceuticals Corporation; Pfizer Inc.; Piramal Imaging; Servier; Takeda Pharmaceutical Company; and Transition Therapeutics. ADNI clinical sites in Canada are also funded by the Canadian Institutes of Health Research. Private sector contributions are facilitated by the Foundation for the National Institutes of Health (www.fnih.org). The grantee organization is the Northern California Institute for Research and Education, and the study is coordinated by the Alzheimer’s Therapeutic Research Institute at the University of Southern California. ADNI data are disseminated by the Laboratory for Neuro Imaging at the University of Southern California.

Conflicts of Interest

The authors declare no conflicts of interest.

References

  1. Alzheimer’s Association. Alzheimer’s disease facts and figures. Alzheimer’s Dement. 2019, 15, 321–387. [Google Scholar]
  2. Wilson, R.S.; Leurgans, S.E.; Boyle, P.A.; Bennett, D.A. Cognitive decline in prodromal Alzheimer disease and mild cognitive impairment. Arch. Neurol. 2011, 68, 351–356. [Google Scholar] [CrossRef] [PubMed]
  3. Jack, C.R., Jr.; Bennett, D.A.; Blennow, K.; Carrillo, M.C.; Dunn, B.; Haeberlein, S.B.; Holtzman, D.M.; Jagust, W.; Jessen, F.; Karlawish, J.; et al. NIA-AA Research Framework: Toward a biological definition of Alzheimer’s disease. Alzheimer’s Dement. 2018, 14, 535–562. [Google Scholar] [CrossRef] [PubMed]
  4. Gholami, A. Alzheimer’s disease: The role of proteins in formation, mechanisms, and new therapeutic approaches. Neurosci. Lett. 2023, 817, 137532. [Google Scholar]
  5. Bekris, L.M.; Yu, C.E.; Bird, T.D.; Tsuang, D.W. Genetics of Alzheimer disease. J. Geriatr. Psychiatry Neurol. 2010, 23, 213–227. [Google Scholar] [CrossRef]
  6. Tanzi, R.E. The genetics of Alzheimer disease. Cold Spring Harb. Perspect Med. 2012, 2, a006296. [Google Scholar] [CrossRef]
  7. Andrade-Guerrero, J.; Santiago-Balmaseda, A.; Jeronimo-Aguilar, P.; Vargas-Rodríguez, I.; Cadena-Suárez, A.R.; Sánchez-Garibay, C.; Pozo-Molina, G.; Méndez-Catalá, C.F.; Cardenas-Aguayo, M.-D.; Diaz-Cintra, S.; et al. Alzheimer’s Disease: An Updated Overview of Its Genetics. Int. J. Mol. Sci. 2023, 24, 3754. [Google Scholar] [CrossRef] [PubMed]
  8. Morishima-Kawashima, M.; Ihara, Y. Alzheimer’s disease: β-Amyloid protein and tau. J. Neurosci. Res. 2002, 70, 392–401. [Google Scholar] [CrossRef]
  9. Ahmad, F.; Javed, M.; Athar, M.; Shahzadi, S. Determination of affected brain regions at various stages of Alzheimer’s disease. Neurosci. Res. 2023, 192, 77–82. [Google Scholar] [CrossRef]
  10. Mendez, M.F. Early-Onset Alzheimer Disease and Its Variants. Contin. Lifelong Learn. Neurol. 2019, 25, 34–51. [Google Scholar] [CrossRef] [PubMed]
  11. Chishiki, Y.; Hirano, S.; Li, H.; Kojima, K.; Nakano, Y.; Sakurai, T.; Mukai, H.; Sugiyama, A.; Kuwabara, S. Different Patterns of Gray Matter Volume Reduction in Early-onset and Late-onset Alzheimer Disease. Cogn. Behav. Neurol. 2020, 33, 253–258. [Google Scholar] [CrossRef] [PubMed]
  12. Frisoni, G.B.; Pievani, M.; Testa, C.; Sabattoli, F.; Bresciani, L.; Bonetti, M.; Beltramello, A.; Hayashi, K.M.; Toga, A.W.; Thompson, P.M. The topography of grey matter involvement in early and late onset Alzheimer’s disease. Brain 2007, 130, 720–730. [Google Scholar] [CrossRef]
  13. Möller, C.; Vrenken, H.; Jiskoot, L.; Versteeg, A.; Barkhof, F.; Scheltens, P.; van der Flier, W.M. Different patterns of gray matter atrophy in early- and late-onset Alzheimer’s disease. Neurobiol. Aging 2013, 34, 2014–2022. [Google Scholar] [CrossRef] [PubMed]
  14. Yiannopoulou, K.G.; Papageorgiou, S.G. Current and Future Treatments in Alzheimer Disease: An Update. J. Cent. Nerv. Syst. Dis. 2020, 12, 1179573520907397. [Google Scholar] [CrossRef] [PubMed]
  15. Tombaugh, T.N.; McIntyre, N.J. The mini-mental state examination: A comprehensive review. J. Am. Geriatr. Soc. 1992, 40, 922–935. [Google Scholar] [CrossRef]
  16. Nasreddine, Z.S.; Phillips, N.A.; Bédirian, V.; Charbonneau, S.; Whitehead, V.; Collin, I.; Cummings, J.L.; Chertkow, H. The Montreal Cognitive Assessment, MoCA: A brief screening tool for mild cognitive impairment. J. Am. Geriatr. Soc. 2005, 53, 695–699. [Google Scholar] [CrossRef]
  17. Hammers, D.; Spurgeon, E.; Ryan, K.; Persad, C.; Barbas, N.; Heidebrink, J.; Darby, D.; Giordani, B. Validity of a Brief Computerized Cognitive Screening Test in Dementia. J. Geriatr. Psychiatry Neurol. 2012, 25, 89–99. [Google Scholar] [CrossRef]
  18. Maruff, P.; Lim, Y.Y.; Darby, D.; A Ellis, K.; Pietrzak, R.H.; Snyder, P.J.; I Bush, A.; Szoeke, C.; Schembri, A.; Ames, D.; et al. Clinical utility of the cogstate brief battery in identifying cognitive impairment in mild cognitive impairment and Alzheimer’s disease. BMC Psychol. 2013, 1, 30. [Google Scholar] [CrossRef]
  19. Sandberg, M.A. Cambridge Neuropsychological Testing Automated Battery. In Encyclopedia of Clinical Neuropsychology; Kreutzer, J.S., DeLuca, J., Caplan, B., Eds.; Springer: New York, NY, USA, 2011; pp. 480–482. [Google Scholar]
  20. Hoops, S.; Nazem, S.; Siderowf, A.D.; Duda, J.E.; Xie, S.X.; Stern, M.B.; Weintraub, D. Validity of the MoCA and MMSE in the detection of MCI and dementia in Parkinson disease. Neurology 2009, 73, 1738–1745. [Google Scholar] [CrossRef]
  21. Smith, T.; Gildeh, N.; Holmes, C. The Montreal Cognitive Assessment: Validity and Utility in a Memory Clinic Setting. Can. J. Psychiatry 2007, 52, 329–332. [Google Scholar] [CrossRef]
  22. Julayanont, P.; Phillips, N.A.; Chertkow, H.; Nasreddine, Z.S. Montreal Cognitive Assessment (MoCA): Concept and Clinical Review; Springer: Berlin/Heidelberg, Germany, 2013. [Google Scholar]
  23. Islam, N.; Hashem, R.; Gad, M.; Brown, A.; Levis, B.; Renoux, C.; Thombs, B.D.; McInnes, M.D. Accuracy of the Montreal Cognitive Assessment tool for detecting mild cognitive impairment: A systematic review and meta-analysis. Alzheimer’s Dement. 2023, 19, 3235–3243. [Google Scholar] [CrossRef] [PubMed]
  24. Bobinski, M.; de Leon, M.; Wegiel, J.; DeSanti, S.; Convit, A.; Louis, L.S.; Rusinek, H.; Wisniewski, H. The histological validation of post mortem magnetic resonance imaging-determined hippocampal volume in Alzheimer’s disease. Neuroscience 2000, 95, 721–725. [Google Scholar] [CrossRef] [PubMed]
  25. Johnson, K.A.; Fox, N.C.; Sperling, R.A.; Klunk, W.E. Brain imaging in Alzheimer disease. Cold Spring Harb. Perspect. Med. 2012, 2, a006213. [Google Scholar] [CrossRef]
  26. Jack, C.R., Jr.; Dickson, D.W.; Parisi, J.E.; Xu, Y.C.; Cha, R.H.; O’Brien, P.C.; Edland, S.D.; Smith, G.E.; Boeve, B.F.; Tangalos, E.G.; et al. Antemortem MRI findings correlate with hippocampal neuropathology in typical aging and dementia. Neurology 2002, 58, 750–757. [Google Scholar] [CrossRef] [PubMed]
  27. Ashburner, J.; Friston, K.J. Voxel-based morphometry—The methods. Neuroimage 2000, 11, 805–821. [Google Scholar] [CrossRef]
  28. Ramanoël, S.; Hoyau, E.; Kauffmann, L.; Renard, F.; Pichat, C.; Boudiaf, N.; Krainik, A.; Jaillard, A.; Baciu, M. Gray Matter Volume and Cognitive Performance During Normal Aging. A Voxel-Based Morphometry Study. Front. Aging Neurosci. 2018, 10, 235. [Google Scholar] [CrossRef]
  29. van de Mortel, L.A.; Thomas, R.M.; van Wingen, G.A. Grey Matter Loss at Different Stages of Cognitive Decline: A Role for the Thalamus in Developing Alzheimer’s Disease. J. Alzheimers Dis. 2021, 83, 705–720. [Google Scholar] [CrossRef]
  30. Wang, W.-Y.; Yu, J.-T.; Liu, Y.; Yin, R.-H.; Wang, H.-F.; Wang, J.; Tan, L.; Radua, J.; Tan, L. Voxel-based meta-analysis of grey matter changes in Alzheimer’s disease. Transl. Neurodegener. 2015, 4, 6. [Google Scholar] [CrossRef] [PubMed]
  31. Khagi, B.; Lee, K.H.; Choi, K.Y.; Lee, J.J.; Kwon, G.-R.; Yang, H.-D. VBM-Based Alzheimer’s Disease Detection from the Region of Interest of T1 MRI with Supportive Gaussian Smoothing and a Bayesian Regularized Neural Network. Appl. Sci. 2021, 11, 6175. [Google Scholar] [CrossRef]
  32. Petersen, R.C.; Aisen, P.S.; Beckett, L.A.; Donohue, M.C.; Gamst, A.C.; Harvey, D.J.; Jack, C.R., Jr.; Jagust, W.J.; Shaw, L.M.; Toga, A.W.; et al. Alzheimer’s Disease Neuroimaging Initiative (ADNI): Clinical characterization. Neurology 2010, 74, 201–209. [Google Scholar] [CrossRef]
  33. Pearce, N.; Vandenbroucke, J.P.; Lawlor, D.A. Causal Inference in Environmental Epidemiology: Old and New Approaches. Epidemiology 2019, 30, 311–316. [Google Scholar] [CrossRef]
  34. Xiao, Y.; Gao, L.; Hu, Y.; Initiative, T.A.D.N. Disrupted single-subject gray matter networks are associated with cognitive decline and cortical atrophy in Alzheimer’s disease. Front. Neurosci. 2024, 18, 1366761. [Google Scholar]
  35. Lee, P.; Kim, H.-R.; Jeong, Y.; Initiative, F.T.A.D.N. Detection of gray matter microstructural changes in Alzheimer’s disease continuum using fiber orientation. BMC Neurol. 2020, 20, 362. [Google Scholar] [CrossRef] [PubMed]
  36. Goto, M.; Abe, O.; Aoki, S.; Hayashi, N.; Ohtsu, H.; Takao, H.; Miyati, T.; Matsuda, H.; Yamashita, F.; Iwatsubo, T.; et al. Longitudinal gray-matter volume change in the default-mode network: Utility of volume standardized with global gray-matter volume for Alzheimer’s disease: A preliminary study. Radiol. Phys. Technol. 2015, 8, 64–72. [Google Scholar] [CrossRef]
  37. MATLAB, Version: (2023a); The Mathworks, Inc.: Natick, MA, USA, 1993.
  38. Gaser, C.; Dahnke, R.; Thompson, P.M.; Kurth, F.; Luders, E.; The Alzheimer’s Disease Neuroimaging Initiative. CAT—A Computational Anatomy Toolbox for the Analysis of Structural MRI Data. bioRxiv 2023. bioRxiv:2022.06.11.495736. [Google Scholar]
  39. Ashburner, J.; Friston, K.J. Unified segmentation. NeuroImage 2005, 26, 839–851. [Google Scholar] [CrossRef] [PubMed]
  40. Rolls, E.T.; Huang, C.-C.; Lin, C.-P.; Feng, J.; Joliot, M. Automated anatomical labelling atlas 3. NeuroImage 2020, 206, 116189. [Google Scholar] [CrossRef]
  41. Han, H.; Dawson, K.J. JASP, Version 18.3. [Computer Software]. 2020.
  42. Cajanus, A.; Solje, E.; Koikkalainen, J.; Lötjönen, J.; Suhonen, N.-M.; Hallikainen, I.; Vanninen, R.; Hartikainen, P.; de Marco, M.; Venneri, A.; et al. The Association Between Distinct Frontal Brain Volumes and Behavioral Symptoms in Mild Cognitive Impairment, Alzheimer’s Disease, and Frontotemporal Dementia. Front. Neurol. 2019, 10, 1059. [Google Scholar] [CrossRef]
  43. Schroeter, M.L.; Stein, T.; Maslowski, N.; Neumann, J. Neural correlates of Alzheimer’s disease and mild cognitive impairment: A systematic and quantitative meta-analysis involving 1351 patients. Neuroimage 2009, 47, 1196–1206. [Google Scholar] [CrossRef] [PubMed]
  44. Davis, D.H.; Creavin, S.T.; Yip, J.L.; Noel-Storr, A.H.; Brayne, C.; Cullum, S. Montreal Cognitive Assessment for the diagnosis of Alzheimer’s disease and other dementias. Cochrane Database Syst Rev. 2015, 2015, Cd010775. [Google Scholar] [CrossRef]
  45. Razani, J.; Wong, J.T.; Dafaeeboini, N.; Edwards-Lee, T.; Lu, P.; Alessi, C.; Josephson, K. Predicting everyday functional abilities of dementia patients with the Mini-Mental State Examination. J. Geriatr. Psychiatry Neurol. 2009, 22, 62–70. [Google Scholar] [CrossRef] [PubMed]
  46. Aminoff, E.M.; Kveraga, K.; Bar, M. The role of the parahippocampal cortex in cognition. Trends Cogn. Sci. 2013, 17, 379–390. [Google Scholar]
  47. Hölscher, C. Time, space and hippocampal functions. Rev. Neurosci. 2003, 14, 253–284. [Google Scholar]
  48. Baier, B.; Cuvenhaus, H.S.; Müller, N.; Birklein, F.; Dieterich, M. The importance of the insular cortex for vestibular and spatial syndromes. Eur. J. Neurol. 2021, 28, 1774–1778. [Google Scholar] [CrossRef] [PubMed]
  49. Seydell-Greenwald, A.; Ferrara, K.; Chambers, C.E.; Newport, E.L.; Landau, B. Bilateral parietal activations for complex visual-spatial functions: Evidence from a visual-spatial construction task. Neuropsychologia 2017, 106, 194–206. [Google Scholar] [CrossRef]
  50. Possin, K.L. Visual spatial cognition in neurodegenerative disease. Neurocase 2010, 16, 466–487. [Google Scholar] [CrossRef]
  51. Takeuchi, H.; Taki, Y.; Sassa, Y.; Hashizume, H.; Sekiguchi, A.; Fukushima, A.; Kawashima, R. Brain structures associated with executive functions during everyday events in a non-clinical sample. Brain Struct. Funct. 2013, 218, 1017–1032. [Google Scholar] [PubMed]
  52. Son, G.; Jahanshahi, A.; Yoo, S.-J.; Boonstra, J.T.; Hopkins, D.A.; Steinbusch, H.W.M.; Moon, C. Olfactory neuropathology in Alzheimer’s disease: A sign of ongoing neurodegeneration. BMB Rep. 2021, 54, 295–304. [Google Scholar] [CrossRef]
  53. Scheff, S.W.; Price, D.A.; Ansari, M.A.; Roberts, K.N.; Schmitt, F.A.; Ikonomovic, M.D.; Mufson, E.J. Synaptic change in the posterior cingulate gyrus in the progression of Alzheimer’s disease. J. Alzheimers Dis. 2015, 43, 1073–1090. [Google Scholar] [CrossRef]
  54. Poulin, S.P.; Dautoff, R.; Morris, J.C.; Barrett, L.F.; Dickerson, B.C. Amygdala atrophy is prominent in early Alzheimer’s disease and relates to symptom severity. Psychiatry Res. 2011, 194, 7–13. [Google Scholar] [CrossRef] [PubMed]
  55. Fouquet, M.; Desgranges, B.; La Joie, R.; Rivière, D.; Mangin, J.-F.; Landeau, B.; Mézenge, F.; Pélerin, A.; de La Sayette, V.; Viader, F.; et al. Role of hippocampal CA1 atrophy in memory encoding deficits in amnestic Mild Cognitive Impairment. Neuroimage 2012, 59, 3309–3315. [Google Scholar] [CrossRef] [PubMed]
  56. Sun, X.; Zhang, X.; Chen, X.; Zhang, P.; Bao, M.; Zhang, D.; Chen, J.; He, S.; Hu, X. Age-dependent brain activation during forward and backward digit recall revealed by fMRI. Neuroimage 2005, 26, 36–47. [Google Scholar] [CrossRef]
  57. Hoshi, Y.; Oda, I.; Wada, Y.; Ito, Y.; Yamashita, Y.; Oda, M.; Ohta, K.; Yamada, Y.; Tamura, M. Visuospatial imagery is a fruitful strategy for the digit span backward task: A study with near-infrared optical tomography. Brain Res. Cogn. Brain Res. 2000, 9, 339–342. [Google Scholar] [CrossRef]
  58. Binder, J.R. The Wernicke area: Modern evidence and a reinterpretation. Neurology 2015, 85, 2170–2175. [Google Scholar] [CrossRef] [PubMed]
  59. Dell, G.S.; Schwartz, M.F.; Nozari, N.; Faseyitan, O.; Branch Coslett, H. Voxel-based lesion-parameter mapping: Identifying the neural correlates of a computational model of word production. Cognition 2013, 128, 380–396. [Google Scholar] [CrossRef]
  60. Şahin, M.H.; Akyüz, M.E.; Karadağ, M.K.; Yalçın, A. Supramarginal Gyrus and Angular Gyrus Subcortical Connections: A Microanatomical and Tractographic Study for Neurosurgeons. Brain Sci. 2023, 13, 430. [Google Scholar] [CrossRef]
  61. McDonough, I.M.; Bischof, G.N.; Kennedy, K.M.; Rodrigue, K.M.; Farrell, M.E.; Park, D.C. Discrepancies between fluid and crystallized ability in healthy adults: A behavioral marker of preclinical Alzheimer’s disease. Neurobiol. Aging 2016, 46, 68–75. [Google Scholar] [CrossRef]
  62. Binder, J.R.; Westbury, C.F.; McKiernan, K.A.; Possing, E.T.; Medler, D.A. Distinct brain systems for processing concrete and abstract concepts. J. Cogn. Neurosci. 2005, 17, 905–917. [Google Scholar] [CrossRef]
  63. Gleichgerrcht, E.; Fridriksson, J.; Bonilha, L. Neuroanatomical foundations of naming impairments across different neurologic conditions. Neurology 2015, 85, 284–292. [Google Scholar] [CrossRef]
Figure 1. Violin boxplots showing differences in MoCA scores for each cognitive domain across n = 120 Alzheimer’s Disease Neuroimaging Initiative (ADNI) subjects (n = 120) covering the Alzheimer’s disease continuum of cognitive decline, comprising ADNI CN (n = 44), MCI (n = 62), and EOAD (n = 14). Individual one-way ANOVAs (df = 2) examined differences in the total score and each of the seven cognitive domains assessed by the MoCA. Corresponding F-values and their p-values are denoted on the top-left of each plot, with post hoc groupwise comparison Tukey’s tests of significance denoted by: * = p < 0.05; ** = p < 0.01; and *** = p < 0.001.
Jdad 02 00024 g001
Figure 2. Gray matter volume (GMV) correlation with Montreal Cognitive Assessment (MoCA) total score, in a sample of Alzheimer’s Disease Neuroimaging Initiative (ADNI) subjects representing the AD continuum, comprising cognitively unimpaired controls (n = 44), those with Mild Cognitive Impairment (n = 62), and those early-onset Alzheimer’s disease (n = 14). Note: Threshold-Free Cluster Enhancement (TFCE) with 10,000 permutations was applied to all results, which were thresholded with a False Discovery Rate (FDR) of 0.05. Scale indicates TFCE effect sizes after being adjusted for sex, race, ethnicity, and Total Intracranial Volume (TIV). Axial images are presented using the neurological standard where left is left. L = Left; A = Anterior; R = Right; P = Posterior.
Jdad 02 00024 g002
Figure 3. Peak effects for gray matter volume (GMV) correlations with each cognitive domain from the Montreal Cognitive Assessment (MoCA), in a sample of Alzheimer’s Disease Neuroimaging Initiative (ADNI) Healthy Controls (n = 44), Mild Cognitive Impairment (n = 62), and early-onset Alzheimer’s disease (n = 14). Scales indicate positive signal intensity from multiple general linear models adjusting for sex, race, ethnicity, and Total Intracranial Volume that underwent Threshold-Free Cluster Enhancement (TFCE) analysis and passed a False Rate Discovery (FDR) correction of 0.05 (with the exception of Language). Note: the white crossbar indicates the location of the MNI coordinates of the peak cluster brain region (Supplementary Table S1). Axial images are presented using the neurological standard where left is left.
Jdad 02 00024 g003
Table 1. Group Characteristics. Values are expressed as mean [standard deviation] or percentages. “+” denotes F-statistic value; “^” denotes χ2-value; “*” denotes significant values where p < 0.05.
CharacteristicsADNI Control (CN) [n = 44]Mildly Cognitively Impaired (MCI) [n = 62]Early-Onset Alzheimer’s Disease (EOAD) [n = 14]Whole Sample [n = 120]F/χ2p-Value
Age (Years)60.38 [3.66]61.45 [2.42]59.47 [3.09]60.98 [3.07]2.937 +0.062
Education (School Years)15.80 [2.42]16.08 [2.34]14.86 [2.48]15.96 [2.39] 0.807
Male25%31%71%33%10.719 ^0.005 *
Race 32.039 ^<0.001 *
   American Indian/Alaskan Native2%0%0%1%
   Asian18%0%0%7%
   Native Hawaiian/Pacific Islander0%0%0%0%
   Black/African American32%11%7%18%
   White41%84%86%68%
   More than One Race5%2%7%3%
   Unknown2%3%0%3%
Ethnicity 8.188 ^0.017 *
   Hispanic or Latino25%6%7%13%
   Not Hispanic or Latino75%94%93%87%
Table 2. Peak gray matter volume (GMV) associations with each cognitive domain from the Montreal Cognitive Assessment (MoCA), in a sample of Alzheimer’s Disease Neuroimaging Initiative (ADNI) Healthy Controls (n = 44), Mild Cognitive Impairment (n = 62), and early-onset Alzheimer’s disease (n = 14). Positive contrasts generated from multiple general linear models adjusting for sex, race, ethnicity, and Total Intracranial Volume (TIV) that then underwent Threshold-Free Cluster Enhancement (TFCE) and passed the False Rate Discovery (FDR) correction. The table indicates the peak cluster brain region for each cognitive domain as determined by the AAL3 brain atlas region. Note: L = Left hemisphere; R = Right hemisphere; kE = Expected number of voxels in cluster.
Cognitive DomainkE (%ICV)p (FDR)Cluster aal3-Atlas Associated Regions
Visuospatial/Executive193,852 (34.7%)0.002R middle temporal gyrus; R inferior temporal gyrus; R Crus I of cerebellar hemisphere; L precuneus; L cuneus; L superior parietal gyrus; L superior occipital gyrus
Naming42,769 (7.6%)0.048L middle temporal gyrus; L inferior temporal gyrus; L superior temporal gyrus; L insula
Attention127,919 (22.9%)0.016L middle temporal gyrus; L middle occipital gyrus; L&R middle cingulate; L&R middle paracingulate; L&R precuneus; L&R paracentral lobule; R supplementary motor cortex
Language128,743 (23.0%)0.053L supramarginal gyrus; L angular gyrus; L inferior parietal gyrus; L superior parietal gyrus; L postcentral gyrus
Abstraction107,176 (19.2%)0.026L superior temporal gyrus; L middle temporal gyrus; L inferior temporal gyrus
Memory/Delayed Recall124,686 (22.3%)0.007R gyrus rectus; R midial orbital gyrus; R posterior orbital gyrus; R putamen; L&R olfactory cortex; R nucleus accumbens; R caudate; nucleus; R insula; R anterior orbital gyrus; L&R superior frontal gyrus-medial orbital; L&R anterior cingulate cortex; R parahippocampal gyrus; R superior temporal gyrus; R amygdala
Orientation300,363 (53.8%)0.000L&R hippocampus; R pallidum; L&R putamen; L&R parahippocampal gyrus; L&R amygdala; L fusiform gyrus; L superior temporal gyrus; L olfactory; L insula; L posterior orbital gyrus; L medial orbital gyrus
Total Score325,370 (58.2%)0.000L supramarginal gyrus; L angular gyrus; L inferior parietal gyrus; R inferior temporal gyrus; R Crus I of cerebellar hemisphere; R fusiform gyrus; R inferior occipital gyrus
Intracranial Volume (ICV): 558,718 voxelsDegrees of freedom = [1.0, 115.0]
Voxel size: 1.5 1.5 1.5 [mm]Permutations = 10,000
Disclaimer/Publisher’s Note: The statements, opinions and data contained in all publications are solely those of the individual author(s) and contributor(s) and not of MDPI and/or the editor(s). MDPI and/or the editor(s) disclaim responsibility for any injury to people or property resulting from any ideas, methods, instructions or products referred to in the content.

