Article

Curved Geometries in Persistent Homology: From Euclidean to AdS Metrics in Bow Echo Dynamics

1
Laboratoire de Mathématiques de Bretagne Atlantique, UMR 6205, Université de Bretagne-Sud, 56000 Vannes, France
2
Département de Mathématiques et Statistiques (M2N), Conservatoire National des Arts et Métiers, 292 Rue Saint-Martin, 75141 Paris, France
*
Author to whom correspondence should be addressed.
Int. J. Topol. 2025, 2(4), 19; https://doi.org/10.3390/ijt2040019
Submission received: 16 July 2025 / Revised: 8 September 2025 / Accepted: 22 October 2025 / Published: 4 November 2025
(This article belongs to the Special Issue Feature Papers in Topology and Its Applications)

Abstract

We propose a geometry topological framework to analyze storm dynamics by coupling persistent homology with Anti-de Sitter (AdS)-inspired metrics. On radar images of a bow echo event, we compare Euclidean distance with three compressive AdS metrics ( α = 0.01, 0.1, 0.3) via time-resolved H 1 persistence diagrams for the arc and its internal cells. The moderate curvature setting ( α = 0.1 ) offers the best trade-off: it suppresses spurious cycles, preserves salient features, and stabilizes lifetime distributions. Consistently, the arc exhibits longer, more dispersed cycles (large-scale organizer), while cells show shorter, localized patterns (confined convection). Cross-correlations of H 1 lifetimes reveal a temporal asymmetry: arc activation precedes cell activation. A differential indicator Δ ( t ) based on Wasserstein distances quantifies this divergence and aligns with the visual onset in radar, suggesting early warning potential. Results are demonstrated on a rapid Corsica bow echo; broader validation remains future work.

1. Introduction

Severe convective systems and bow echoes. Bow echoes are mesoscale convective structures characterized by a bowed radar reflectivity pattern, typically associated with strong straight-line winds, downbursts, and occasionally tornadoes [1,2]. They are often embedded within squall lines and are a hallmark of progressive mesoscale convective systems (MCSs). Their curved morphology results from rear inflow jets and the dynamical feedback between cold pool outflows and ambient vertical shear [3,4].
These structures evolve rapidly, with the bowing typically intensifying within one to two hours after initiation, making them difficult to anticipate with standard threshold-based detection methods. Bow echoes are frequently associated with derechos, long-lived, wind-producing convective events, and can generate complex mesovortices on their leading edge, which further contribute to localized hazards [5,6].
Over the past decade, bow echo detection has shifted from hand-crafted morphology to object-based and deep learning pipelines. Early shape morphology efforts demonstrated that explicit structure extraction could flag bow-shaped signatures in radar imagery, for example via skeletonization and shape matching, which provided robust baselines but required careful tuning [7]. Object-based storm identification and mode classification have since matured: iterative segmentation paired with rule-based classification now separates embedded cells and linear systems (including QLCS/bowing segments) in gridded radar analyses [8] and convection-allowing model (CAM) output, enabling scalable, reproducible labeling and downstream verification [9]. Supervised machine learning has also been used to diagnose storm mode directly from radar and CAM-derived objects; both traditional ML and CNNs can distinguish supercells, QLCS, and disorganized convection, with shape descriptors emerging as key predictors and with skill that generalizes across datasets [10,11]. In parallel, semantic segmentation CNNs (U-Net families) have been applied to the bow echo problem itself, both in forecasts, to detect bow echoes directly from simulated reflectivity fields, and in observations, to segment bowing structures as part of derecho identification pipelines [12]. These learning-based detectors reduce manual burden and provide spatially consistent masks that integrate naturally with object tracking and climatological analyses. Comprehensive reviews of ML for convective hazards corroborate these trends and highlight best practices for training data, uncertainty, and spatial verification in [13]. Complementary lines of work explore motion-aware prewarning (e.g., optical-flow tracking on X-band networks) and regional, radar-based bow echo climatologies that ground algorithm design in real-world case statistics [14].
In this work, we refer to the observed structure as a “bow echo” due to its visual signature and dynamic behavior from Météo France data [15]. The event studied is initiated as a squall line, which evolves into a fully developed bow echo during the 07h45–08h00 interval, as seen in radar imagery; see Appendix E. Such transitions underscore the importance of temporal topology in capturing the non-linear geometry of storm organization.
Within the bow echo, we define internal cells as compact radar-identified subregions corresponding to local maxima of reflectivity. These internal cells are embedded within the main arc structure and are associated with the highest precipitation intensity. From a topological perspective, they often exhibit short-scale homological features and dynamic evolution, distinguishing them from the broader, more stable arc geometry.
Topological Data Analysis. Topological data analysis (TDA) has emerged as a powerful framework for studying the shape and evolution of complex systems, particularly in fields where geometric structures evolve over time and under uncertainty. By encoding data into persistence diagrams and computing topological invariants such as lifetimes of homological features, TDA provides a robust and interpretable representation of structure and change [16,17,18].
Several studies have illustrated the potential of TDA to detect and characterize such complex dynamics [19,20,21]. In particular, Gidea and Katz [22] examine the evolution of daily returns from four major U.S. stock indices (e.g., S&P 500, Dow Jones) during two significant financial crises: the dot-com crash (2000) and the global financial crisis (2007–2009). The objective is to detect early warning signals of impending crashes by analyzing topological changes in these multidimensional time series using TDA. Perea [23] developed a framework for topological analysis of time series using delay embeddings, making it possible to detect recurrent structures and dynamical regimes across multivariate meteorological measurements.
Complementary approaches have further demonstrated that TDA is capable of capturing subtle transitions in high-dimensional dynamical systems. For instance, Khasawneh and Munch [24] used persistent homology to detect nonlinear instabilities in mechanical vibration signals, an approach that could be transposed to the detection of regime shifts in atmospheric dynamics. More generally, Lum et al. [25] emphasized the ability of topological methods such as Mapper to uncover global structures in complex data spaces, offering a promising avenue for the analysis of large-scale meteorological datasets with heterogeneous features.
Hoef et al. [26] show how topological persistence can extract structural patterns in image data (e.g., from satellites), with concrete applications to cloud morphology. Sena et al. in [27] use H 0 persistence to automatically characterize the spatial structure of climate zones from geospatial datasets. In [28], Muszynski, Kashinath, Kurlin et al. develop a threshold-free method to identify atmospheric rivers using a combination of TDA and machine learning. In their work, Strommen et al. [29] apply persistent homology to classify atmospheric circulation patterns such as anticyclones, cyclonic blocks, and vortex structures. Ma, Su, Abdel Wahab et al. [30] leverage zigzag persistence and graph networks to predict key meteorological variables such as temperature and cloud coverage. In their study, Tymochko et al. [31] quantify daily variability in hurricane structure using H 1 persistence.
Building on these advances, Canot et al. [32] applied persistent homology to radar reflectivity point clouds from the Corsican bow echo of 18 August 2022. They computed persistence diagrams via Vietoris–Rips filtrations and compared them using Bottleneck, Wasserstein, and kernel-based distances (PWGK, SWK, PFK), complemented by a curvature-based “arc-ratio.” Through hierarchical clustering, PCA, and change-point detection, they identified the structural transition marking bow echo formation and discussed triggering an early-alarm threshold. This concrete case study demonstrates that TDA yields actionable insight for extreme convective storm detection, beyond purely descriptive analysis. This study focuses on the topological characterization of two key storm-related structures: (i) the arc cloud, a horizontal outflow boundary or gust front that can evolve into a bow echo, and (ii) the internal cells, defined by localized maxima in radar reflectivity and lightning activity, often forming prior to arc structuring.
The interaction between these structures is both spatial and topological: cells may merge, split, or organize into larger-scale fronts. Tracking their persistent features over time reveals the timing and ordering of events—who initiates, who responds, and when dominance changes.
This work compares the impact of two distinct metrics on the persistence analysis of these meteorological objects:
  • The Euclidean metric  d E ( x , y ) , commonly used in TDA but sensitive to scale and local noise.
  • A bounded AdS-inspired metric:
    d AdS ( x , y ) = d E ( x , y ) 1 + α · d E ( x , y ) ,
where α > 0 is a curvature parameter. This geometry, inspired by Anti-de Sitter space, introduces a compressive effect that regularizes large distances while preserving short-range structure.
Comparison of distance metrics in TDA and positioning of the AdS geometry. In topological data analysis (TDA), the choice of distance metric critically affects the stability and expressiveness of persistence diagrams. Several metric families have been explored to improve the detection of multi-scale structures, reduce sensitivity to noise, or highlight specific geometric features. Below, we summarize the main approaches and situate the Anti-de Sitter (AdS)-inspired metric proposed in this work.
The Euclidean distance is practical, but often suboptimal. Unlike most TDA approaches that rely on Euclidean distance, Grande et al. in [33] show that adapted (non-isotropic) metrics can reveal hidden structures and better reflect the intrinsic characteristics of the data. In [34], Chazal et al. introduce Distance to a Measure (DTM), a robust generalization of the distance to a set of points (the classical distance function), for analyzing the shape and topology of point clouds. Rather than measuring the distance from a point to a set, DTM measures the distance to a given mass of a measure (e.g., an empirical probability distribution).
In [35], Coifman et al. introduced a geometric and harmonic framework for data analysis based on stochastic diffusion. The central idea is to construct a diffusion metric, which reflects the intrinsic connectivity of a point cloud via a simulated random walk process on a weighted neighborhood graph. From the data, a weighted graph is built using a Gaussian kernel, followed by a transition matrix for a Markov chain. The spectrum of this matrix yields an orthogonal basis of eigenfunctions ϕ j associated with eigenvalues λ j , which are then used to define
D t 2 ( x , y ) = j = 1 λ j 2 t ϕ j ( x ) ϕ j ( y ) 2
This distance measures the similarity between x and y across diffusion trajectories, integrating both local and global geometry. The Diffusion Map is defined by
Ψ t ( x ) = ( λ 1 t ϕ 1 ( x ) , λ 2 t ϕ 2 ( x ) , )
This demonstrates the robustness of this approach to noise and sampling variability, as well as its relevance to tasks such as dimensionality reduction, segmentation, and clustering. The framework lays the foundations of diffusion geometry, a powerful paradigm that combines harmonic analysis, spectral theory, and data processing.
Geodesic metrics defined via shortest paths on k-nearest neighbor graphs have also been explored, especially in manifold learning in De Silva et al. [36]. They preserve intrinsic geometry in high-dimensional or non-linear datasets, and improve the topological signal.
Metrics induced by positive-definite kernels allow one to define persistence in reproducing kernel Hilbert spaces (RKHSs). These metrics have been successfully applied in topological machine learning pipelines, for example, in the PersLay architecture, see Carriere et al. [37], which enables end-to-end, differentiable use of persistence summaries.
In this study, we introduce an AdS-inspired metric that replaces the Euclidean distance d E with a monotone, compressive transform:
d AdS ( x , y ) = d E ( x , y ) 1 + α · d E ( x , y ) ,
This mapping is (i) locally Euclidean ( d AdS ( x , y ) d E ( x , y ) for d E 0 ), (ii) bounded ( d AdS 1 / α ), and (iii) a metric since f ( r ) = r / ( 1 + α r ) is increasing, concave, and subadditive ( f ( a + b ) f ( a ) + f ( b ) ); hence, it preserves the triangle inequality when composed with d E . Operationally, we compute the pairwise matrix D AdS = f ( D E ) and build standard Vietoris–Rips filtration on D AdS without any other change. The “AdS” terminology reflects the negative curvature like compression of large separations, which de-emphasizes long-range links and improves multi-scale interpretability. Unless stated otherwise, we use α { 0.01 , 0.1 , 0.3 } . In our experiments, the AdS metric enhances temporal coherence in persistence diagrams, reduces topological noise, and improves alignment with physical dynamics in radar data.
The AdS-type metric shares conceptual similarities with compressive and anisotropic metrics but is geometrically grounded in hyperbolic models, making it suitable for multiscale and hierarchical structures such as storm systems. We thus position our approach at the interface between geometric filtering and robust topological feature extraction.
Scientific goals. This study investigates three interrelated questions: (i) How does the choice of distance metric affect persistence diagrams and the derived indicators? (ii) Can we detect the topological dominance of one structure over another, for example, the arc organizing or mimicking the cells? (iii) Does persistent topology provide evidence of temporal co-evolution or structural causality between the arc and the cells?
By tracking time-varying H 1 persistence diagrams for both structures and computing differential indicators across metrics, we aim to identify geometric precursors and to define topologically grounded alert indicators for extreme weather.
The remainder of this article is organized as follows: Section 2 introduces the mathematical and physical background together with the persistence framework. Section 3 presents a comparative study of the metrics on real meteorological data. Section 4 discusses the alert indicator in the context of the new metric. Finally, Section 5 concludes the paper and outlines future research directions.

2. Theoretical Framework

2.1. Physical Background: ADS-CFT Correspondance

Since Maldacena’s groundbreaking proposal [38], the Anti-de Sitter/Conformal Field Theory (AdS/CFT) correspondence has provided an unexpected bridge between a gravitational theory in d + 1 dimensions and a conformal gauge theory in d dimensions. This duality, rooted in the holographic principle, has become a powerful framework for exploring both black hole physics and the collective behavior of condensed matter systems.

2.1.1. Review of Anti-de Sitter Space: Geometry of AdSd+1

For a brief review of de Sitter and Anti-de Sitter spaces, we refer the reader to Moschella [39]. The AdSd+1 space see Figure 1 is a pseudo-Riemannian manifold of constant negative curvature, which can be realized as the hyperboloid
X 0 2 X d + 1 2 + i = 1 d X i 2 = L 2 ( L > 0 )
embedded in R 2 , d . In Poincaré coordinates,
d s 2 = L 2 z 2 d z 2 + η μ ν d x μ d x ν , z ( 0 , ) .
The radial coordinate z encodes the resolution scale: z 0 corresponds to the conformal boundary.
The holographic principle, first proposed by ’t Hooft (1993) [40] and further developed by Susskind (1995) [41], states that a gravitational system in a volume V can be fully described by degrees of freedom residing on its boundary V . The maximal entropy is bounded by A / ( 4 G N ) , in direct anticipation of black hole thermodynamics.
For the canonical triplet
Type   IIB   on   AdS 5   × S 5 ; ; N = 4   SYM   in   d = 4 ,
the gauge coupling g YM and the number of colors N determine the string length s and Newton’s constant G N . The GKPW dictionary relates the gravitational partition function Z grav [ ϕ 0 ] to the generating functional of CFT correlators:
Z grav [ ϕ 0 ] = exp AdS ϕ 0 O CFT .

2.1.2. Examples of Holographic Phenomena

  • Quark-gluon plasma: the holographic evaluation of the viscosity-to-entropy ratio η / s = 1 / 4 π remarkably matches RHIC measurements.
  • Holographic superconductors: the Hartnoll–Herzog–Horowitz (2008) model produces a type II phase transition via the condensation of a charged scalar field in AdS4.
  • Fluid/gravity duality: long-wavelength perturbations of the AdS5 metric map to relativistic hydrodynamics on the boundary.
  • Entanglement entropy: the Ryu–Takayanagi formula ( S A = Area ( γ A ) / ( 4 G N ) ) generalizes black hole thermodynamics to out-of-equilibrium quantum systems.

2.2. Mathematical Backgroud

Simplicial Homology

Let V be a set of vertices. A simplicial complex on V is a set K composed of subsets of V (the simplices) such that any τ σ , nonempty, τ K . the dimension of a simplex d i m ( σ ) is the number of vertices of σ minus 1.
K = { 0 , 1 , 2 , 3 , [ 0 , 1 ] , [ 1 , 2 ] , [ 0 , 3 ] , [ 0 , 1 , 3 ] } is a simplicial complex.
If K is a simplicial complex, we denote by K n the set of simplices of dimension n, and we define the n-chains of K; these are linear combinations of n-dimensional simplices. It is convenient to work on the field ( Z / 2 Z , + , x ) of integers modulo 2. Thus, the n-chains are written formally by
c = σ K n ϵ σ . σ , w i t h : ϵ σ Z / 2 Z
and form vector spaces over the field Z / 2 Z .
We can define the boundary of the n-dimensional simplex σ n = ( p 0 , p 1 , . . . p n ) :
n σ n = i = 1 n ( p 0 , p 1 , . . . , p i ^ , . . . p n ) .
The operator n expands to a linear map from C n ( K ) to C n 1 ( K ) . We can verify that the boundary of the boundary of a simplex is zero:
n 1 n = 0 .
For example,
( [ 1 , 2 , 3 ] ) = ( [ 1 , 2 ] + [ 2 , 3 ] + [ 1 , 3 ) = 1 + 2 + 2 + 3 + 1 + 3 = 0
A vector space sequence
. . . C n ( K ) n C n 1 ( K ) n 1 C n 2 ( K ) . . . 0 C 0 ( K ) O
is a complex simplicial. The kernel and image of each linear map, n , are vector subspaces; the n-cycles Z n ( K ) represent the kernel of δ n : K e r ( n ) ; and the n-edges B n ( K ) repesent the image of δ n + 1 : I m ( n + 1 . We have the inclusion B n ( K ) Z n ( K ) . A topological defect is the obstruction for an n-cycle to be an n-boundary: it results in the non-nullity of the quotient vector space (homology vector space H n ( K ) ) given by
H n ( K ) = Z n ( K ) / B n ( K ) = K e r ( n ) / I m ( n + 1 ) .
The dimension of each H i ( K ) is denoted as β i ( K ) = d i m ( H i ( K ) ) and represents the Betti numbers of the complex K.
The n-th vector spaces of homologies are finer invariants than the fundamental group. Indeed, the fundamental groups of a point and of the 2-sphere are both trivial: any loop drawn on S 2 can be contracted to a point. Nevertheless, the two spaces are neither homeomorphic nor homotopy-equivalent. Homology detects this difference: the second homology (over a field) of a point is zero. Equivalently, the fundamental 2-cycle of S 2 is not a boundary in S 2 (there are no 3-chains), so its second Betti number is nonzero. For a finite simplicial complex, homology is computed via linear algebra on boundary matrices, which makes these invariants practical for applications.

2.3. Topological Data Analysis

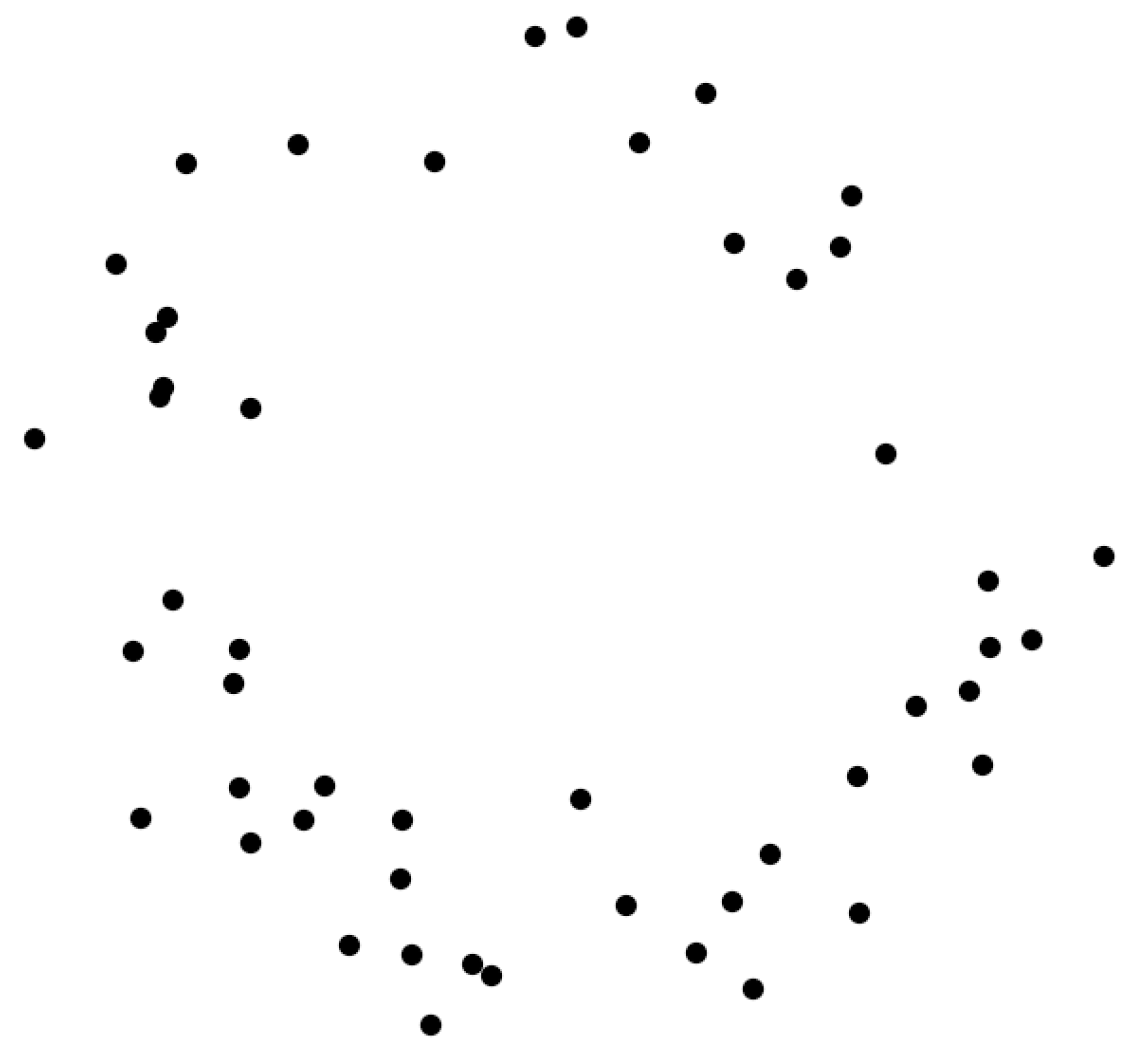
Topological data analysis (TDA) characterizes the shape of data across multiple scales by detecting topological features: connected components, loops, and voids. In this study, the point cloud X R 2 is extracted from binarized 2D radar images, where each active pixel is treated as a point. Thus, our analysis reduces to studying a point cloud in Euclidean space, like in Figure 2.
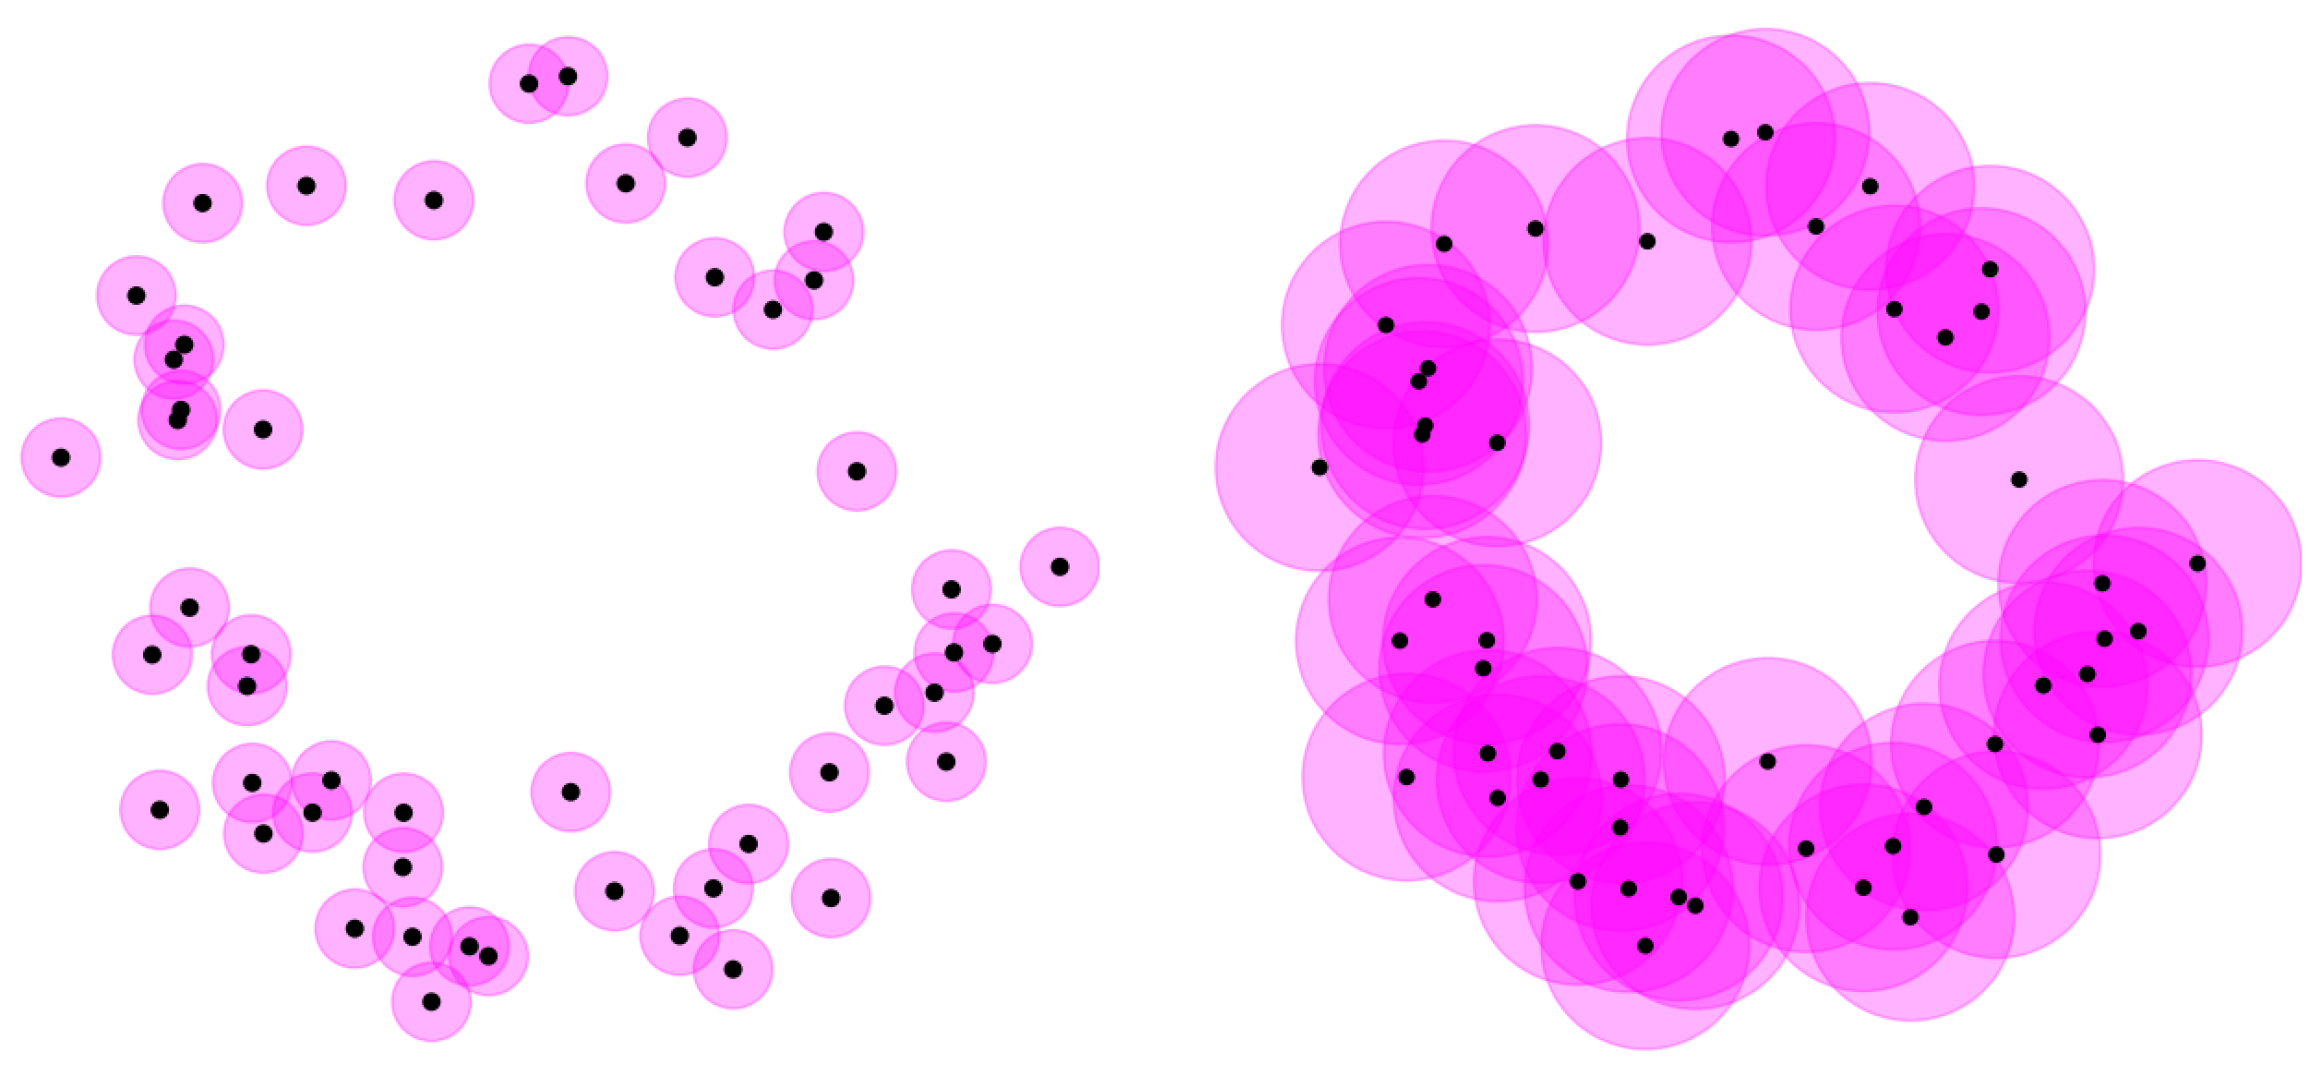
Topological analysis proceeds by associating to the point cloud a filtration of simplicial complexes, so that homological invariants can be computed across scales. The resulting invariants are the homology groups H k in all dimensions and their ranks β k = dim H k (the Betti numbers). Recall that homology detects independent k-cycles that are not boundaries. The filtration is obtained by “thickening” the cloud: for each radius ε 0 , place a ball B ( x , ε ) around every point x X and build the Vietoris–Rips filtration. At ε = 0 , the balls are disjoint, and the topology reduces to counting connected components. As ε increases, balls begin to intersect, edges and higher-dimensional simplices appear, components merge, and loops are created and later filled in, see Figure 3.
If two balls intersect, we add an edge between their centers; if three balls have a nonempty common intersection, we add the triangle spanned by their centers; see Figure 4. This is the nerve of the cover by balls. For each increasing value of ε , we thus obtain a simplicial complex and can compute homology at scale ε .
As ε grows, these complexes form a nested family (a filtration). Persistent homology records which topological features (components, loops, voids) appear and how long they persist across ε . We will use these summaries in the remainder of the article to interpret the data.

2.3.1. Nerve of a Cover and Simplicial Complex

Let X be a topological space. A (finite) cover of X is a collection U = { U i } i = 1 N of subsets of X such that
i = 1 N U i = X .
The nerve of U is the abstract simplicial complex N ( U ) with vertex set { 1 , , N } , in which a finite subset
σ = { i 0 , , i m } { 1 , , N }
spans an m-simplex if and only if
k = 0 m U i k .
(Equivalently, the m-simplices are precisely the ( m + 1 ) element subsets whose corresponding sets have nonempty common intersection.)

2.3.2. Persistence Module

We consider an increasing thickening sequence of X that denotes a filtration:
X 0 , 0 = X X 0 , 1 X 0 , 2 X 0 , t
We have the functor X 0 , t H i ( X 0 , t ) acting from the category of sets in the category of i t h -homology vector spaces. We calculate for each thickening X 0 , t the Betti numbers,
β 0 = d i m ( H 0 ( X 0 , t ) ) , β 1 = d i m ( H 1 ( X 0 , t ) ) , β i = d i m ( H i ( X 0 , t ) )
At the sequence of inclusions,
X 0 i 0 1 X 0 , 1 i 1 2 X 0 , 2 i 2 3 X 0 , 3 i 3 4 X 0 , 3
which corresponds by applying the i t h homology functors:
H i ( X 0 , 0 ) ( i 0 1 ) * H i ( X 0 , 1 ) ( i 1 2 ) * H i ( X 0 , 2 ) ( i 2 3 ) * H i ( X 0 , 3 ) ( i 3 4 ) * H i ( X 0 , 4 ) . . .
Each inclusion induces a linear map between vector spaces. We obtain a persistence module given by the sequence of vector space:
( H i ( X 0 , t ) ) t 0 , with linear maps ( ( i s t ) * : H i ( X 0 , s ) H i ( X 0 , t ) ) s t .
We can define the persistence as follows: Let i , t 0 0 , and consider a cycle c H i ( X 0 , t 0 ) .
Its death time is s u p { t 0 / ( i t 0 t ) * ( c ) 0 } .
Its birth time is i n f { t 0 / ( i t t 0 ) * 1 ( c ) 0 } .
Its persistence is the following difference:
P ( c ) = s u p { t 0 / ( i t 0 t ) * ( c ) 0 } i n f { t 0 / ( i t t 0 ) * 1 ( c ) 0 } .

2.3.3. Vietoris–Rips Complex Construction

Given a metric d and a scale parameter ϵ > 0 , the Vietoris–Rips complex VR ϵ ( X , d ) is defined as follows:
  • Each data point in X is a vertex (0-simplex).
  • A k-simplex is included for any k + 1 points { x 0 , , x k } if every pair satisfies
    d ( x i , x j ) ϵ for all 0 i < j k .
This construction is sensitive to the choice of distance d, which may be the classical Euclidean metric or a deformed version inspired by AdS geometry.

2.3.4. Filtration and Persistent Homology

As the scale parameter ϵ increases, the nested sequence of complexes forms a filtration:
VR ϵ 1 ( X , d ) VR ϵ 2 ( X , d ) VR ϵ n ( X , d ) .
This filtration encodes how topological features appear and disappear at different scales. We compute the homology groups H k of each complex to capture k-dimensional features: H 0 : connected components; H 1 : one-dimensional loops.

2.3.5. Persistence Diagrams

The birth and death of each topological feature is recorded in a persistence diagram D k see Figure 5, which is a multiset of points ( b i , d i ) R 2 , where
  • b i : the scale at which the i-th k-dimensional feature appears (is born).
  • d i : the scale at which it disappears (dies).
The lifetime i = d i b i represents the significance of the feature. Features with longer lifetimes are more likely to reflect meaningful structures in the data.
Figure 5. Persistence barcode (left) and persistence diagram (right) for X. Each bar represents a lifetime interval [ birth , death ] ; in the diagram, the same information is encoded as points ( birth , death ) . Distance from the diagonal measures persistence. Colors: H 0 in red, H 1 in blue. The H 0 bar extending to + corresponds to the remaining connected component.
Ijt 02 00019 g005

2.3.6. Stability and Comparison: Wasserstein Distances

The Wasserstein distance, originally rooted in optimal transport theory [42], has been rigorously adapted to the comparison of persistence diagrams in topological data analysis [43,44]. Its stability properties and statistical foundations make it a powerful tool for quantifying topological features in noisy or dynamic datasets [45]. We use the p-Wasserstein distance between diagrams D , D :
W p ( D , D ) = inf γ : D D x D x γ ( x ) p 1 / p .
Here, γ ranges over all bijections (allowing matching to the diagonal), and · is the norm.
This metric is sensitive to both the location and multiplicity of topological features, stable under perturbations of the input data, see Cohen et al. [46], and computationally feasible for moderate-sized diagrams.
For a comprehensive introduction to the theoretical and computational aspects of persistent homology, we refer the reader to the seminal works of Edelsbrunner and Harer [16], Carlsson [19], Chazal et al. [17], Cohen-Steiner et al. [46], Bubenik [45], and Ghrist [20].

2.4. Metrics

In this section, we first recall the standard Euclidean metric, which is the default choice in most applications. We then introduce an AdS-inspired deformation of the Euclidean distance. We proceed to analyze its main properties, and we discuss the topological consequences of this modified metric for persistent homology.

2.4.1. Euclidean Metric

Let x , y R n . The classical Euclidean distance between x and y is
d E ( x , y ) = i = 1 n ( x i y i ) 2 .
It corresponds to the straight-line distance between the two points in Euclidean space.
It is obvious that d AdS is a distance.

2.4.2. Continuity of the AdS Metric

We consider the deformed metric
d AdS ( x , y ) = d E ( x , y ) 1 + α d E ( x , y ) ,
where d E ( x , y ) is the standard Euclidean distance and α > 0 is a fixed curvature parameter.
Define the function f : R + R + by
f ( t ) = t 1 + α t .
This function is continuous on R + , as it is the quotient of continuous functions with a non-vanishing denominator.
Now, let ( x n , y n ) ( x , y ) in R n × R n . Since the Euclidean distance is continuous, we have
d E ( x n , y n ) d E ( x , y ) .
Applying the continuity of f, it follows that
d AdS ( x n , y n ) = f ( d E ( x n , y n ) ) f ( d E ( x , y ) ) = d AdS ( x , y ) .
The AdS metric d AdS is continuous on R n × R n .

2.4.3. Topological Consequences of the AdS-Inspired Metric

Let d AdS . Define r = d E ( x , y ) 0 and the associated function:
f ( r ) = r 1 + α r .
This function is strictly increasing and satisfies
lim r f ( r ) = 1 α .
Therefore,
x , y , 0 d AdS ( x , y ) < 1 α .
This shows that the AdS-inspired metric is bounded above by 1 α . The filtration is thus automatically bounded without requiring an arbitrary threshold. It induces a geometric compression: large Euclidean distances are asymptotically flattened, making faraway points topologically indistinguishable. This leads to stabilized filtrations in persistent homology and reduces the impact of outliers, which is crucial for robustness in topological data analysis. Therefore, Vietoris–Rips filtrations constructed with d AdS tend to highlight local structures while filtering out unstable topological artifacts. This leads to more stable and physically interpretable persistence diagrams.

2.4.4. Continuity and Lipschitz Behavior

We study the regularity of the function d AdS . Let f ( t ) = t 1 + α t . The function f is
  • Continuous on R + , as the denominator is strictly positive;
  • Strictly increasing, since f ( t ) = 1 ( 1 + α t ) 2 > 0 ;
  • Concave, since f ( t ) = 2 α ( 1 + α t ) 3 < 0 .
Hence, d AdS ( x , y ) = f ( d E ( x , y ) ) is continuous on R n × R n . We now examine its Lipschitz continuity. For all x , y , x , y R n , we have
d AdS ( x , y ) d AdS ( x , y ) = f ( d E ( x , y ) ) f ( d E ( x , y ) ) .
Since f is Lipschitz-continuous on compact intervals, and its derivative is bounded,
sup t 0 | f ( t ) | = sup t 0 1 ( 1 + α t ) 2 = 1 ,
we deduce that f is globally 1-Lipschitz. Therefore,
d AdS ( x , y ) d AdS ( x , y ) d E ( x , y ) d E ( x , y ) .
In particular, if one varies only one pair of points while fixing the others, we get
d AdS ( x , y ) d AdS ( x , y ) x x .
The AdS metric is globally Lipschitz with constant 1 with respect to the Euclidean metric.

2.4.5. Stability of Persistence Diagrams Under the AdS Metric

A key result in topological data analysis is the stability of persistence diagrams with respect to perturbations of the input metric space. Let us recall the classical theorem of stability for persistence diagrams:
Stability Theorem
Let ( X , d ) and ( X , d ) be two finite metric spaces on the same underlying set, and let D k ( X , d ) and D k ( X , d ) denote the corresponding persistence diagrams in homological dimension k. Then, for any p 1 , the p-Wasserstein distance satisfies [43,46]
W p ( D k ( X , d ) , D k ( X , d ) ) C k · d d ,
where
d d : = max x , y X | d ( x , y ) d ( x , y ) |
and C k is a constant depending only on the homological dimension k. This result ensures that small perturbations of the distance function result in small changes to the persistence diagram, under the Wasserstein metric.
Application to the AdS Metric
Let us consider the AdS distance. We have, for all x , y X ,
| d AdS ( x , y ) d E ( x , y ) | = d E ( x , y ) 1 + α d E ( x , y ) d E ( x , y ) = α d E ( x , y ) 2 1 + α d E ( x , y ) .
Therefore,
d AdS d E = sup x , y α d E ( x , y ) 2 1 + α d E ( x , y ) sup x , y d E ( x , y ) ,
which is finite on any bounded domain.
By the stability theorem, we conclude
W p ( D k ( X , d AdS ) , D k ( X , d E ) ) C k · d AdS d E .
The persistence diagrams computed using the AdS distance are stable with respect to the Euclidean-based diagrams. Thus, this deformation preserves topological consistency, while modifying geometric sensitivity.

2.4.6. Scale Invariance and Topological Sensitivity

A fundamental difference between the Euclidean distance and the AdS-inspired metric lies in their behavior under scaling transformations.
Let λ > 0 be a scaling factor, and consider the transformation
x λ x , y λ y .
The Euclidean distance is scale invariant up to homothety:
d E ( λ x , λ y ) = λ d E ( x , y ) .
Consequently, the persistence diagrams computed using d E on scaled point clouds are rescaled versions of the original diagrams, with lifetimes multiplied by λ .
For the AdS distance, we obtain under scaling
d AdS ( λ x , λ y ) = λ d E ( x , y ) 1 + α λ d E ( x , y ) λ d AdS ( x , y ) .
Hence, d AdS is “not scale-invariant”. In fact, we can write
d AdS ( λ x , λ y ) = λ 1 + α λ d E ( x , y ) · d E ( x , y ) ,
which implies a sublinear scaling effect as λ . The AdS metric compresses large distances more strongly as the scale increases.
This behavior increases sensitivity to small scale structures, such as internal convective cells or arc boundaries, while attenuating the influence of long-range interactions that often reflect noise or diffuse features. As a result, the filtration prioritizes local topological features and downplays large-scale geometric artifacts, an especially desirable property when analyzing radar-derived meteorological data with spatial uncertainties. The AdS metric induces a curvature like warping that breaks scale invariance and promotes topological localization, yielding persistence diagrams that highlight meteorologically relevant structures.

2.4.7. Compatibility with Vietoris–Rips Filtration

Let ( X , d ) be a finite metric space. The Vietoris–Rips filtration { VR ϵ ( X , d ) } ϵ 0 is defined by
VR ϵ ( X , d ) = σ X d ( x i , x j ) ϵ x i , x j σ .
This filtration is well defined for any metric d that satisfies the following conditions:
  • Symmetry: d ( x , y ) = d ( y , x ) ;
  • Positivity: d ( x , y ) 0 and d ( x , y ) = 0 x = y ;
  • Triangle inequality: d ( x , z ) d ( x , y ) + d ( y , z ) ;
  • Continuity (optional for stability, but not for definition).
Since the AdS metric satisfies these axioms, it can be used in place of the Euclidean distance in Vietoris–Rips constructions.
The function ϵ VR ϵ ( X , d AdS ) is still monotonic
ϵ 1 ϵ 2 VR ϵ 1 ( X , d AdS ) VR ϵ 2 ( X , d AdS ) ,
because the metric comparison is preserved.
Justification for the choice of the AdS metric. By the construction d AdS , is a continuous metric and compatible with Vietoris–Rips filtrations (same edge order, reparametrized scale). This choice emphasizes near-neighbor geometry while preventing very large separations from dominating the filtration. Empirical effects are quantified in Section 3.
Geometric interpretation. The map r r / ( 1 + α r ) mimics a hyperbolic-like compression: large Euclidean distances saturate to 1 / α . We use this as a geometric prior to control scale in the filtration (Figure 6).

2.4.8. Computational Methodology

We compute persistent homology of radar point clouds with the Python (3.11.11) library ripser [47], which efficiently builds Vietoris–Rips filtrations. By default, ripser constructs simplicial complexes from Euclidean coordinates. To work in our AdS-inspired geometry, we precompute a bounded AdS distance matrix and pass it directly to ripser with the option distance_matrix=True.
This option directs ripser to treat the input as a precomputed, symmetric distance matrix (rather than raw coordinates), enabling the use of a custom metric while still leveraging the library’s optimized Vietoris–Rips pipeline. The output contains persistence diagrams for each homology degree; we extract the entry associated with the key ‘dgms’, which stores the diagram data.
This design preserves the topological sensitivity of persistent homology while embedding the analysis in a non-Euclidean metric space, thereby capturing features that might be distorted or suppressed under Euclidean assumptions. The implementation is lightweight and efficient, and it provides a simple interface between ripser and AdS-inspired metric spaces.

3. Comparative Analysis of Euclidean and Ads Metrics for Arc and Cells

3.1. Pipeline Overview

To compare how different metrics influence topological features, we follow a multi-step pipeline see Figure 7 that transforms raw meteorological data into persistence diagrams. The procedure is applied independently to arc cloud structures and to convective precipitation cells extracted from radar images.
  • Contour extraction: From each radar frame, we obtain a binary contour of the target structure (arc or internal cells) using standard image processing steps (thresholding, edge detection).
  • Point-cloud generation: The extracted contours are converted into 2D point clouds that represent the geometry of the meteorological object at a given time.
  • Metric assignment: Each point cloud is endowed with a metric, either the classical Euclidean distance or the bounded AdS-inspired distance.
  • Vietoris–Rips filtration: A Vietoris–Rips filtration is built on the resulting metric space, encoding the evolution of topology across scales.
  • Persistent-homology computation: Persistence diagrams (and barcode lifetimes) are computed from the filtration, capturing connected components, loops, and cavities—features that often reflect spatial separation or internal organization.
  • Time series construction: The lifetimes of persistent H 1 features are tracked across successive radar timestamps to form topological time series for both the arc and the internal cells.
  • Topological interaction via cross-correlation: These time series are cross-correlated to quantify temporal alignment and asymmetry between arc and cell topologies, revealing potential causal influence or sequential activation.
  • Differential indicator and alert triggering: A topological differential indicator Δ ( t ) is computed at each time step from the Wasserstein distance between the arc and cell persistence diagrams. When Δ ( t ) exceeds a learned threshold θ * , a structural reconfiguration is detected and an early-warning alert is issued.
This pipeline allows for a consistent and reproducible comparison of the topological signature of meteorological structures under different geometric assumptions.

3.2. Persistence Diagrams

3.2.1. Comparative Analysis of Persistence Diagrams Across Metrics and Time

To assess the impact of the distance metric on topological descriptors, we compare H 1 persistence diagrams for the arc and the internal cells over 07h00–08h00, using the Euclidean metric and AdS-inspired metrics with α { 0.01 , 0.1 , 0.3 } .
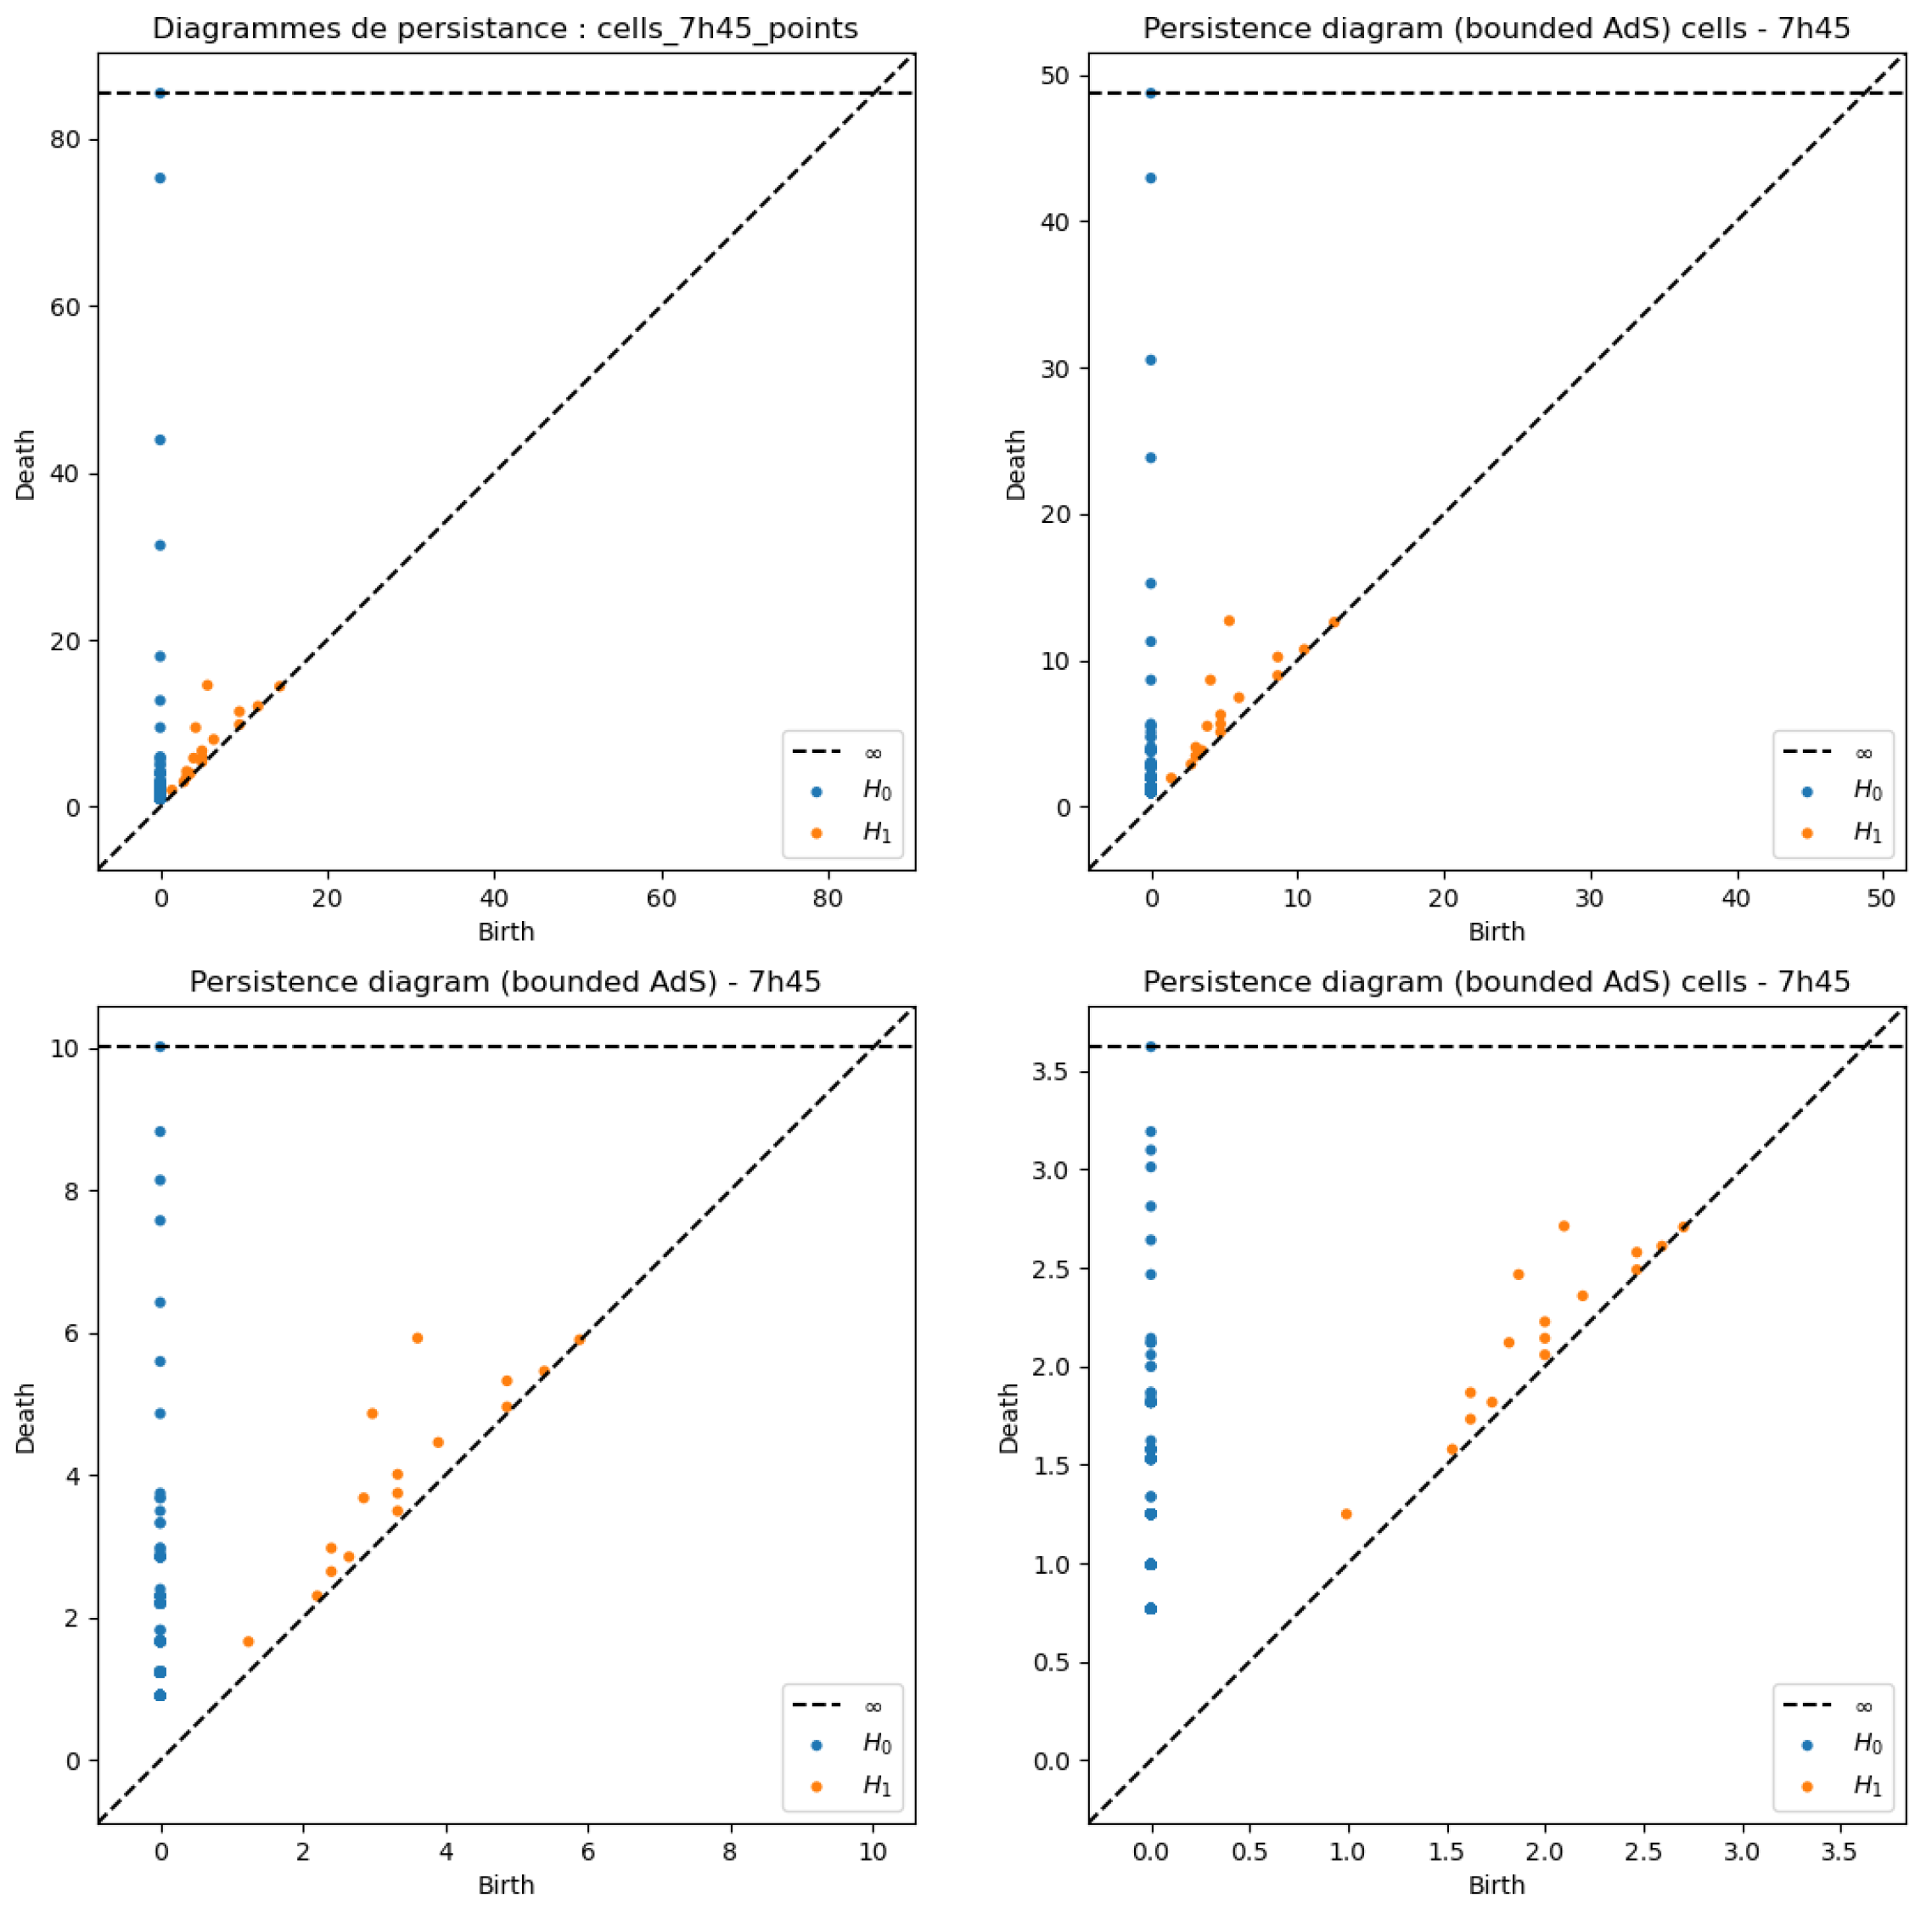
Figure 8 and Figure 9 show example persistence diagrams (07h45) for the arc and the internal cells. With the standard Euclidean distance, many H 1 points lie very close to the diagonal, indicating numerous short-lived features. AdS with α = 0.01 is visually similar (compression too weak). AdS with α = 0.1 clearly separates the meaningful points from the diagonal and stabilizes lifetimes—spurious cycles are filtered out while the main structures are preserved. AdS with α = 0.3 compresses too strongly: diagrams become sparse and some relevant features are pushed back toward the diagonal or disappear. Overall, α = 0.1 provides the best compromise between denoising and preserving the storm’s structure, consistently for both the arc and the cells at 07h45.
Having identified α = 0.1 as the most balanced AdS setting, we now examine the temporal evolution of H 1 signatures for the arc and for the internal cells over 07h00–08h00, and we summarize the metric-induced scaling effects in the diagrams.

3.2.2. Temporal Analysis of Persistence Diagrams for the Arc (AdS, α = 0.1 )

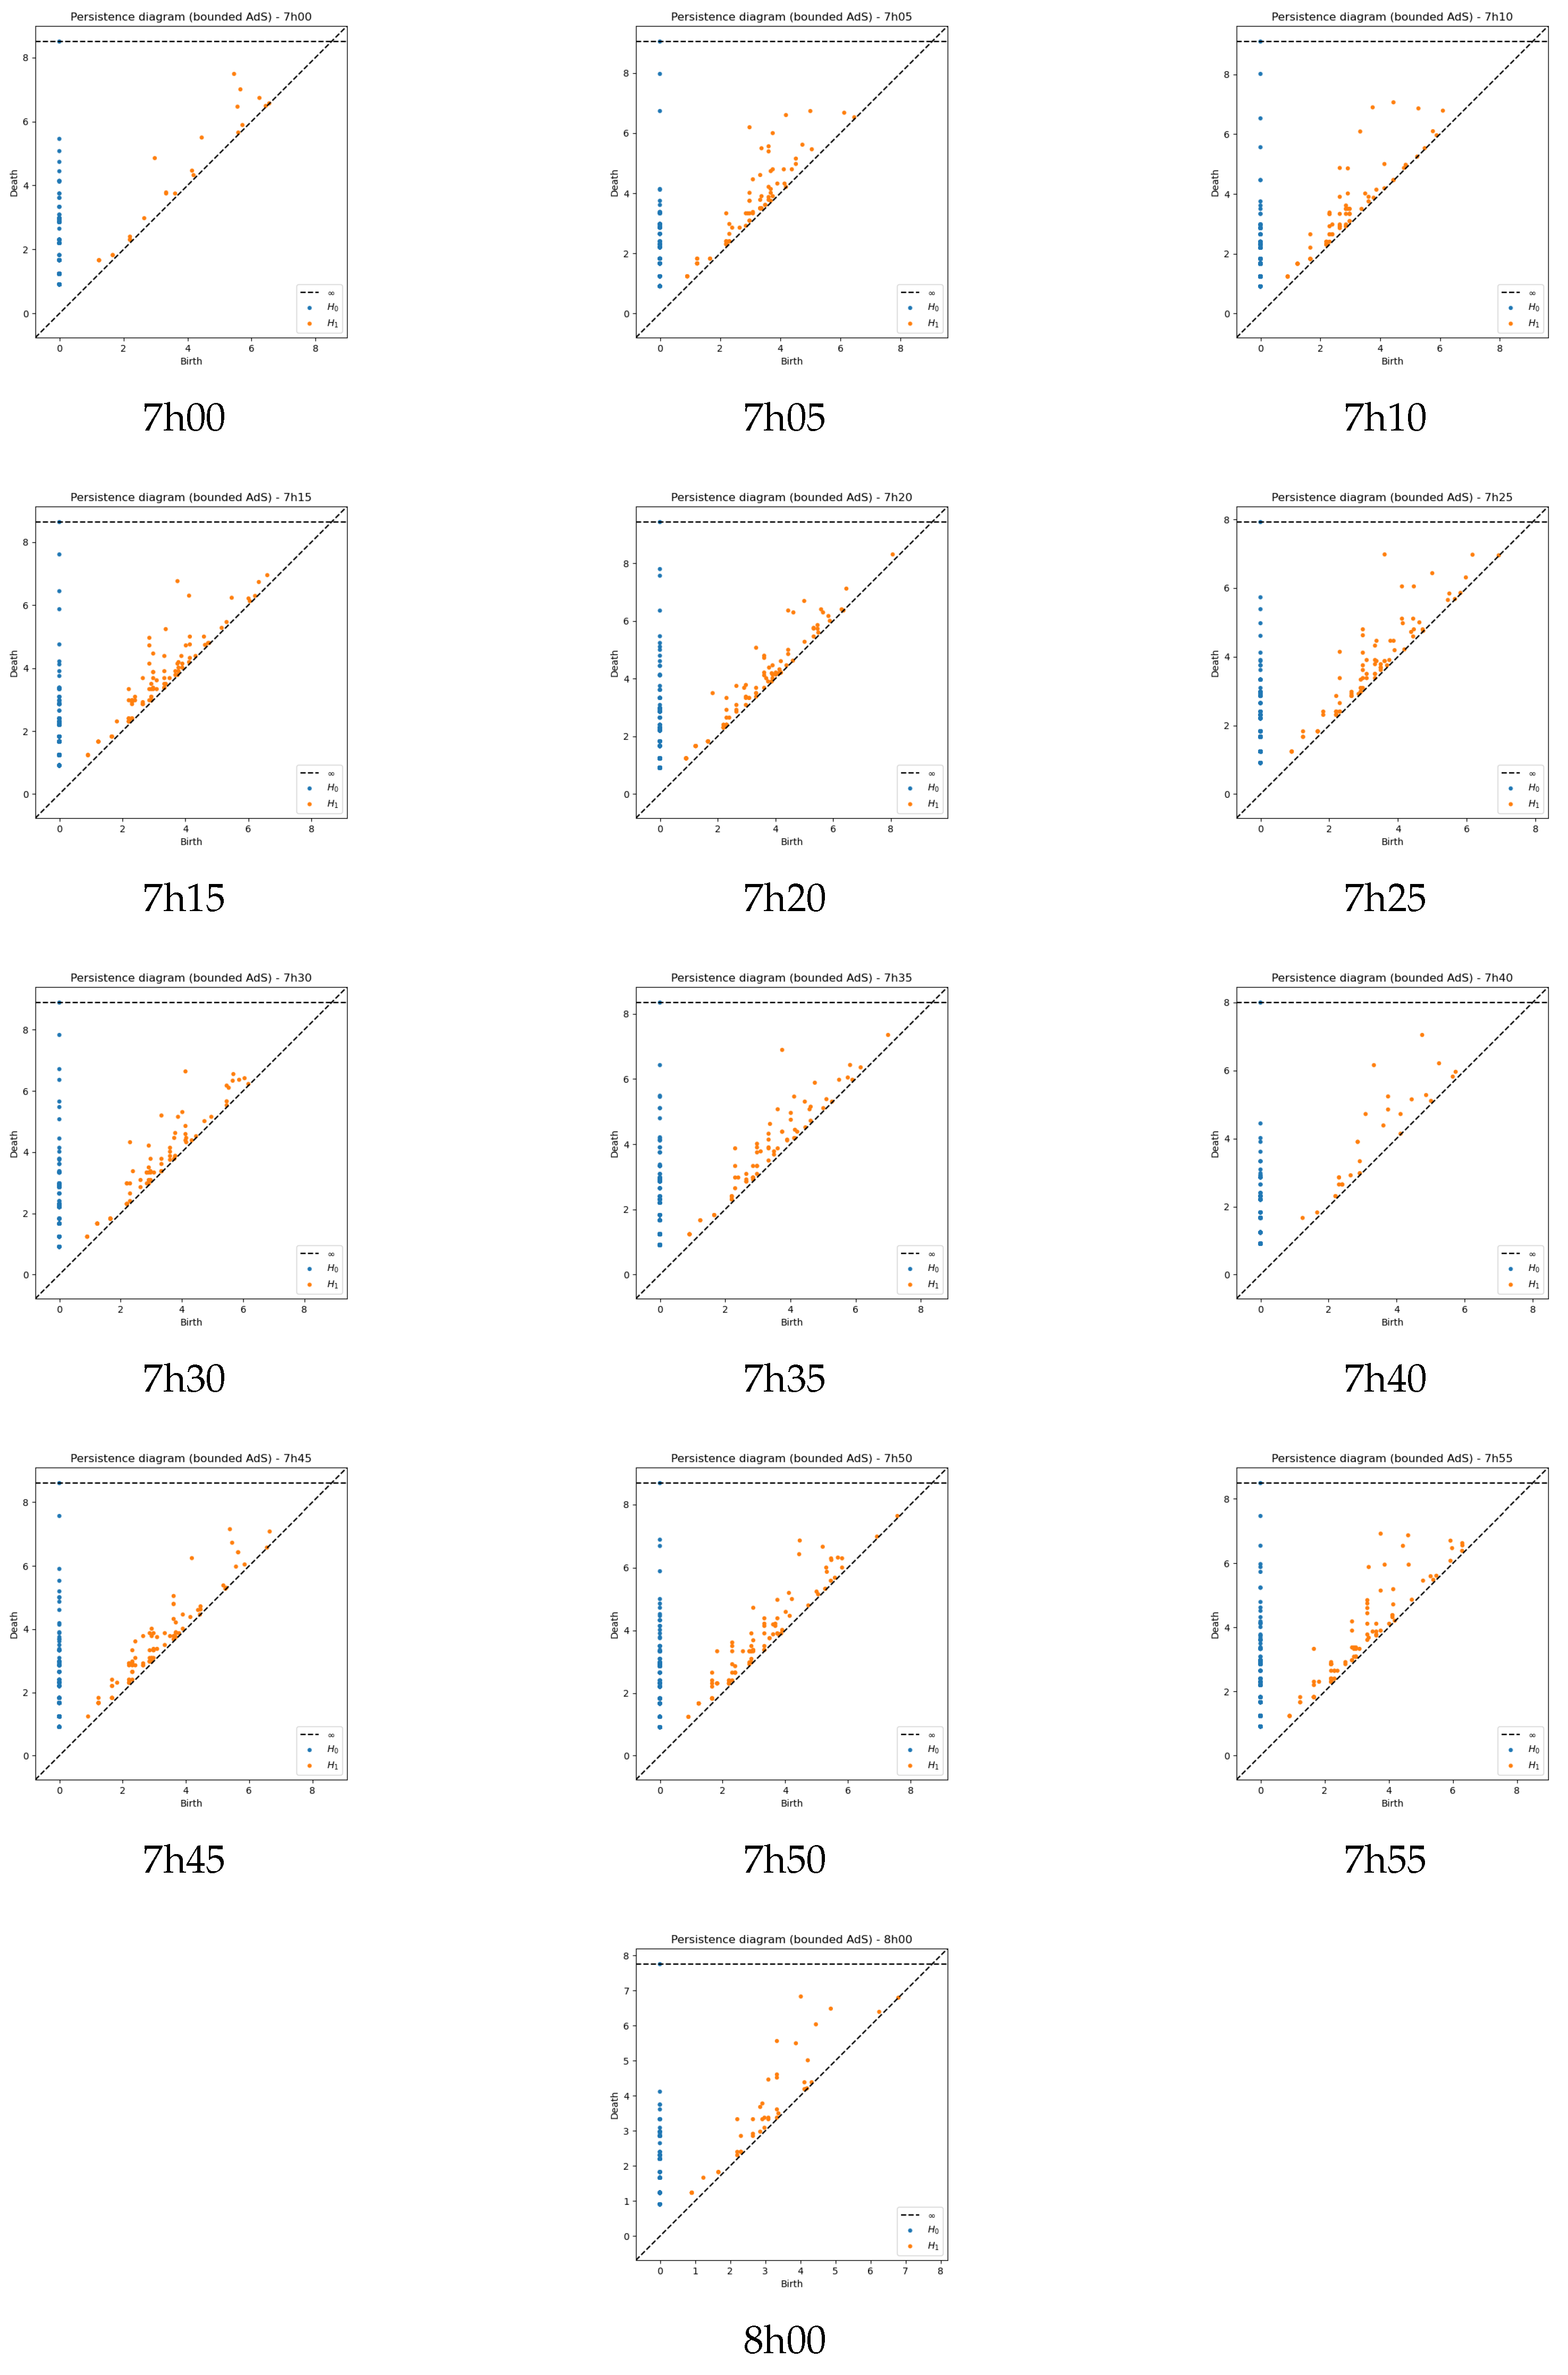
Full diagrams are provided in Appendix A (see also the radar sequence in Appendix E).
At 07h00, the system is diffuse and weakly organized; the corresponding persistence diagram shows few short-lived H 1 classes. From 07h05 to 07h15, curvature and organization increase, and clearer cycles emerge. Between 07h20 and 07h35, a pronounced arc is present and the H 1 diagram displays more numerous and more persistent loops. By 07h50–08h00, signs of stretching and dispersion appear, accompanied by a slight reduction in both the number and the lifetimes of cycles. This joint reading of radar and TDA supports the use of the AdS metric for early identification of organized convection.

3.2.3. Temporal Analysis of Persistence Diagrams for the Cells (AdS, α = 0.1 )

At 07h00–07h05, only a few points lie near the diagonal, indicating low topological activity. Around 07h10–07h15, points spread upward, marking the onset of internal organization. From 07h20 to 07h35, several cycles detach from the diagonal, consistent with intensified cellular activity. Toward 08h00, both the number and the lifetimes of cycles decrease, signaling decay. With α = 0.1 , the AdS metric filters noise while preserving the persistent structures associated with the cells. See Appendix B.

3.3. Metric Induced Scaling Effects in Persistence Diagrams

The choice of metric strongly affects the scale and readability of persistence diagrams. In the Euclidean case, H 1 birth/death values typically span a wide range (e.g., from near 0 up to ∼25). With the AdS metric ( α = 0.1 ), the same data concentrate into a narrower interval (e.g., ∼1 to ∼8).
This follows from the bounded transform d AdS = d E / ( 1 + α d E ) : as d E ( x , y ) , we have d AdS ( x , y ) 1 / α , which compresses large separations while preserving local ones. The result is a nonlinear “zoom” in the diagram: weak, short-lived noise is pushed toward the diagonal, whereas salient features are more clearly separated and visually enhanced. In practice, the AdS metric acts as a topological contrast enhancer.

3.4. Lifetime Analysis

We now move from geometric summaries (persistence diagrams) to their one-dimensional distributions: histograms of H 1 lifetimes, which quantify how long loops persist at each time and under each metric. Each histogram reports the topological lifetime = death birth (along the filtration scale). The horizontal axis is (continuous, not integer-binned); the vertical axis counts cycles whose lifetimes fall in each bin.
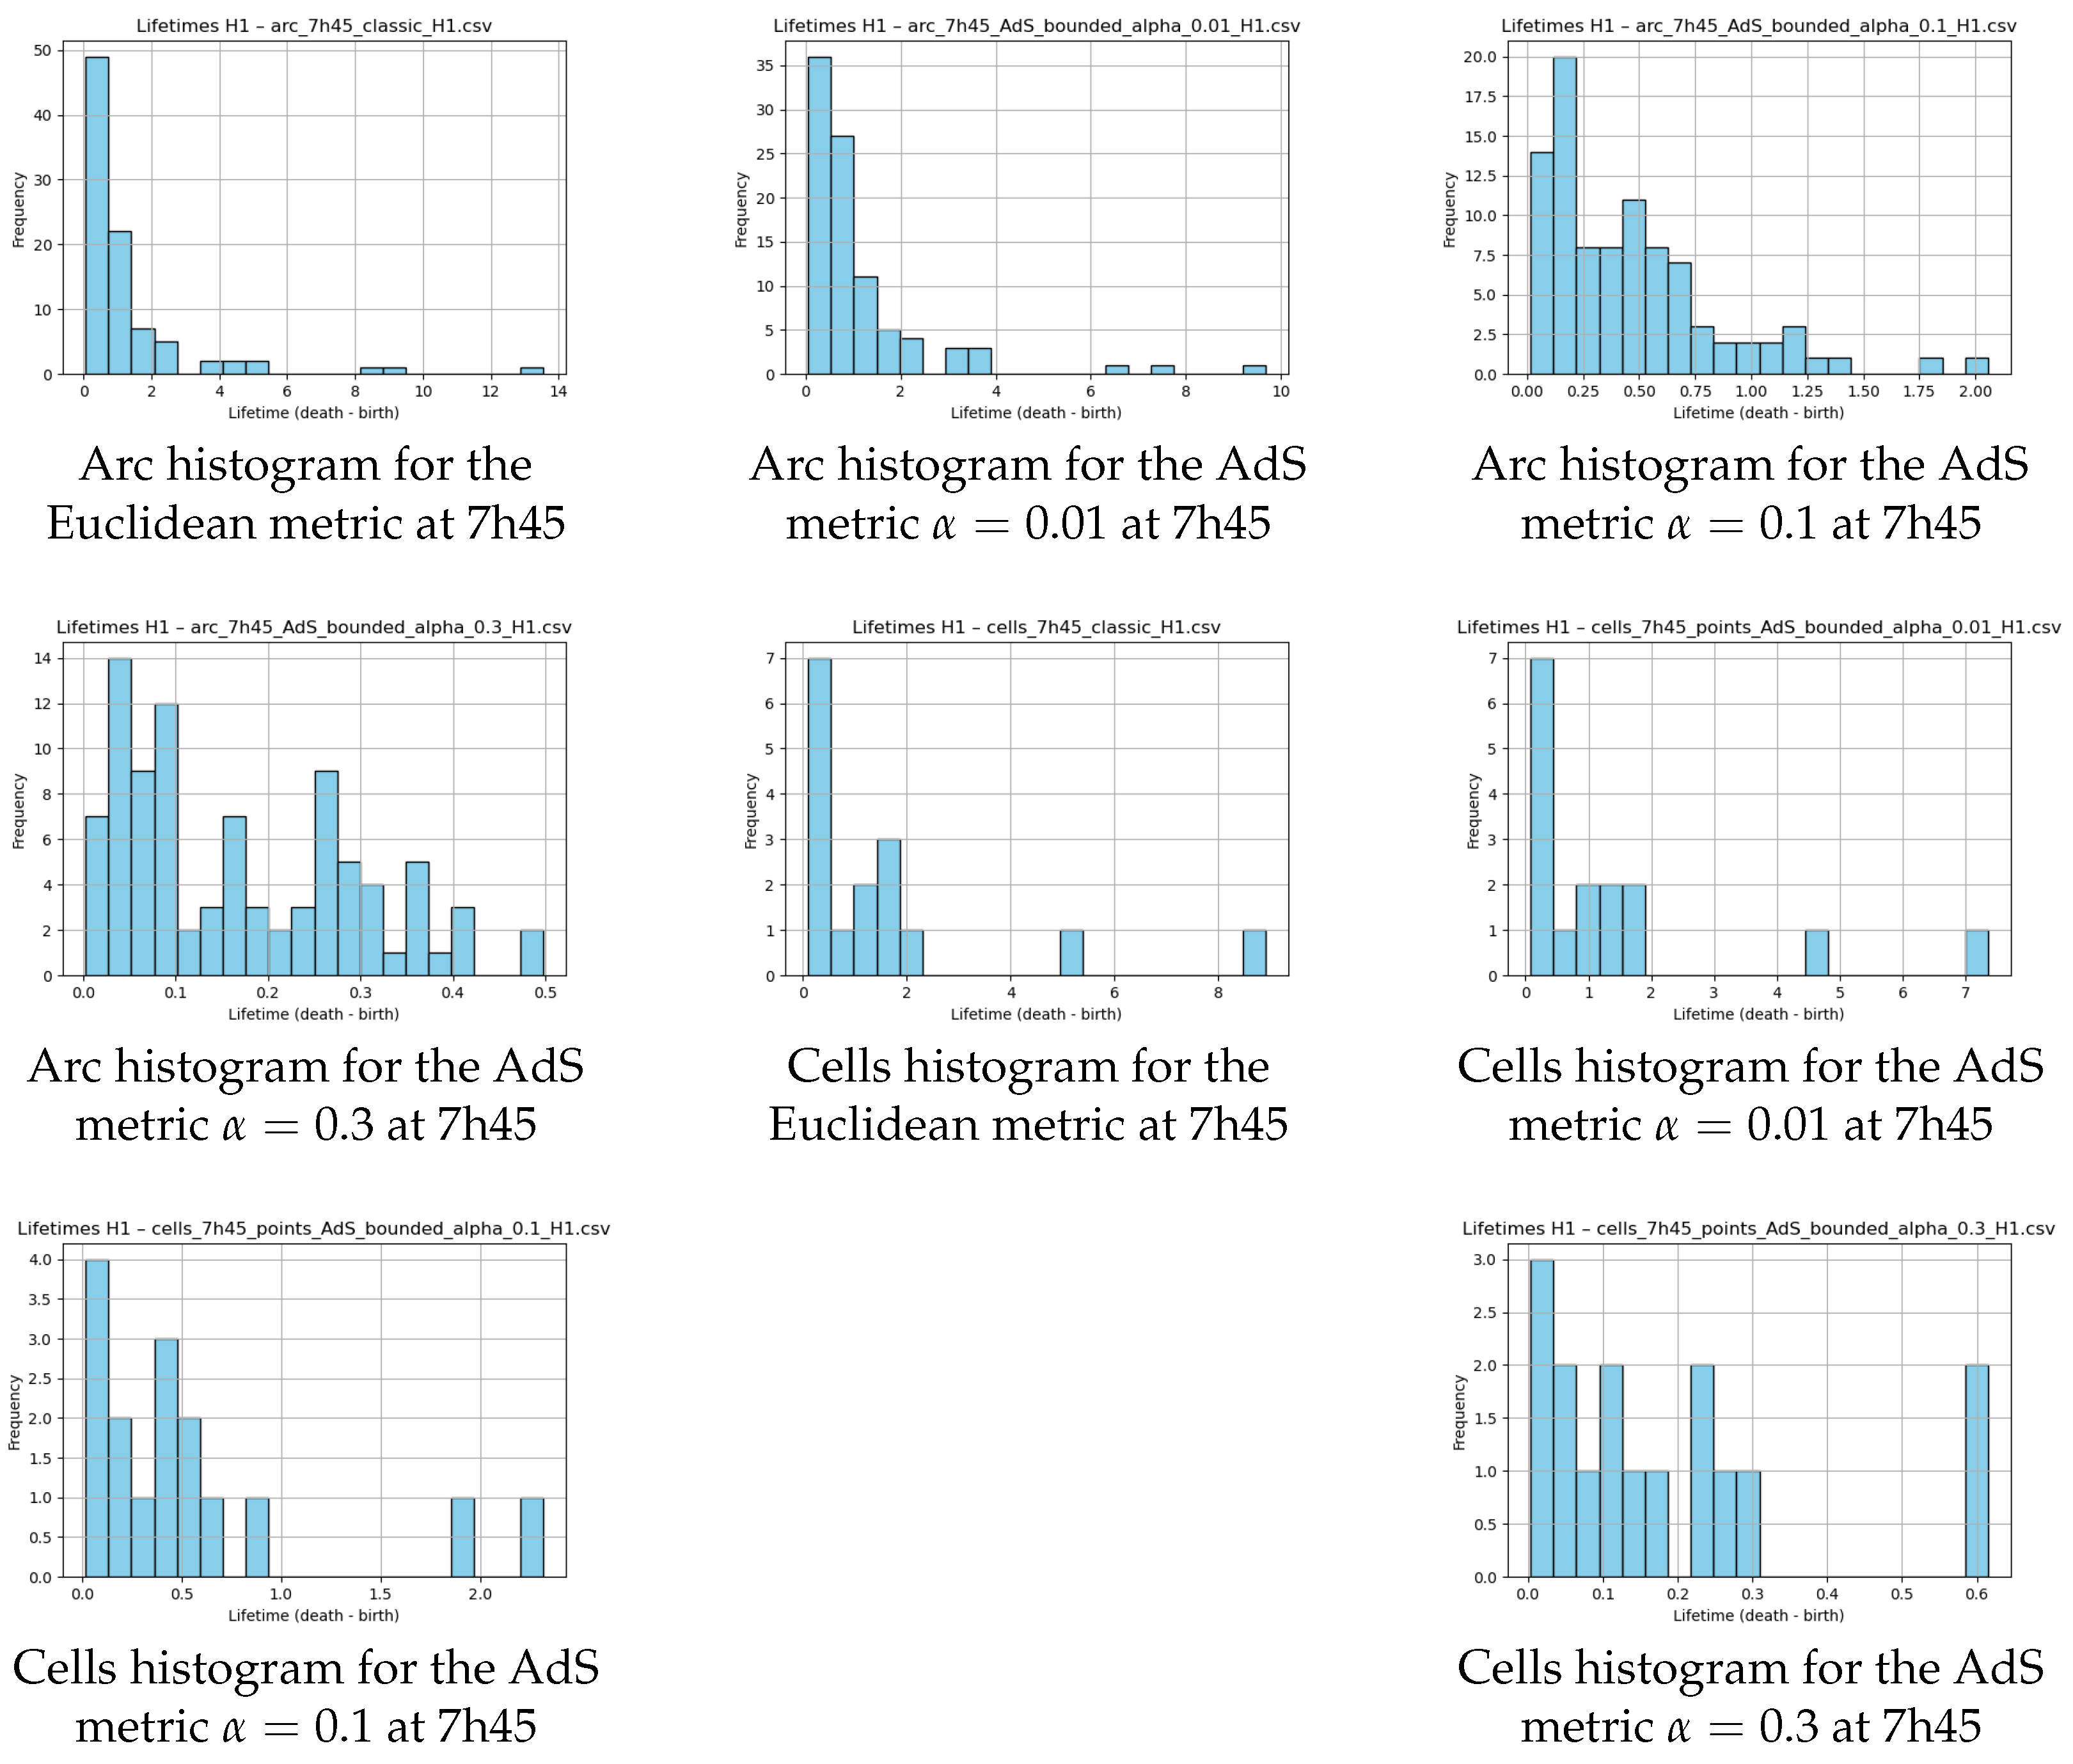
At 07h45, the Euclidean metric yields a broad spread of short lifetimes clustered near zero and lacking clear structure. AdS with α = 0.01 behaves similarly (compression too weak), whereas α = 0.3 is overly aggressive and suppresses robust cycles. The moderate setting α = 0.1 produces a well-defined peak separated from near zero noise, revealing the arc’s coherent organization.

3.5. Temporal Evolution of H 1 Lifetimes for the Arc (AdS, α = 0.1 )

Over 07h00–08h00 (Appendix C), the arc evolves from a diffuse state (few, very short lifetimes at 07:00) to a more organized phase (07:05–07:15) where lifetimes grow and a distinct mode emerges. Between 07:20 and 07:35, histograms broaden and show persistent modes, consistent with a mature arc. Toward 07h50–08h00, lifetimes decline and the distribution thins, indicating partial decay or spatial spreading.

3.6. Temporal Evolution of H 1 Lifetimes for Internal Cells (AdS, α = 0.1 )

Internal cells display more local variability than the arc. At 07h00–07h05, lifetimes are mostly short with few persistent cycles. Around 07h10–07h15, the distribution tightens near short values (temporary simplification), then diversifies again from 07h15 onward, with clear peaks by 07h30. Near 08h00, both counts and lifetimes decrease, signaling decay of cellular activity.
Beyond single-time histograms, we now examine the full distributions of H 1 lifetimes over 07h00–08h00, using boxplots to track central tendency, spread, and outliers under each metric.

3.7. Analysis of H 1 Lifetime Distributions

We analyze H 1 lifetime distributions under the metrics, Euclidean and AdS, with α { 0.01 , 0.1 , 0.3 } .

3.7.1. Arc Topology

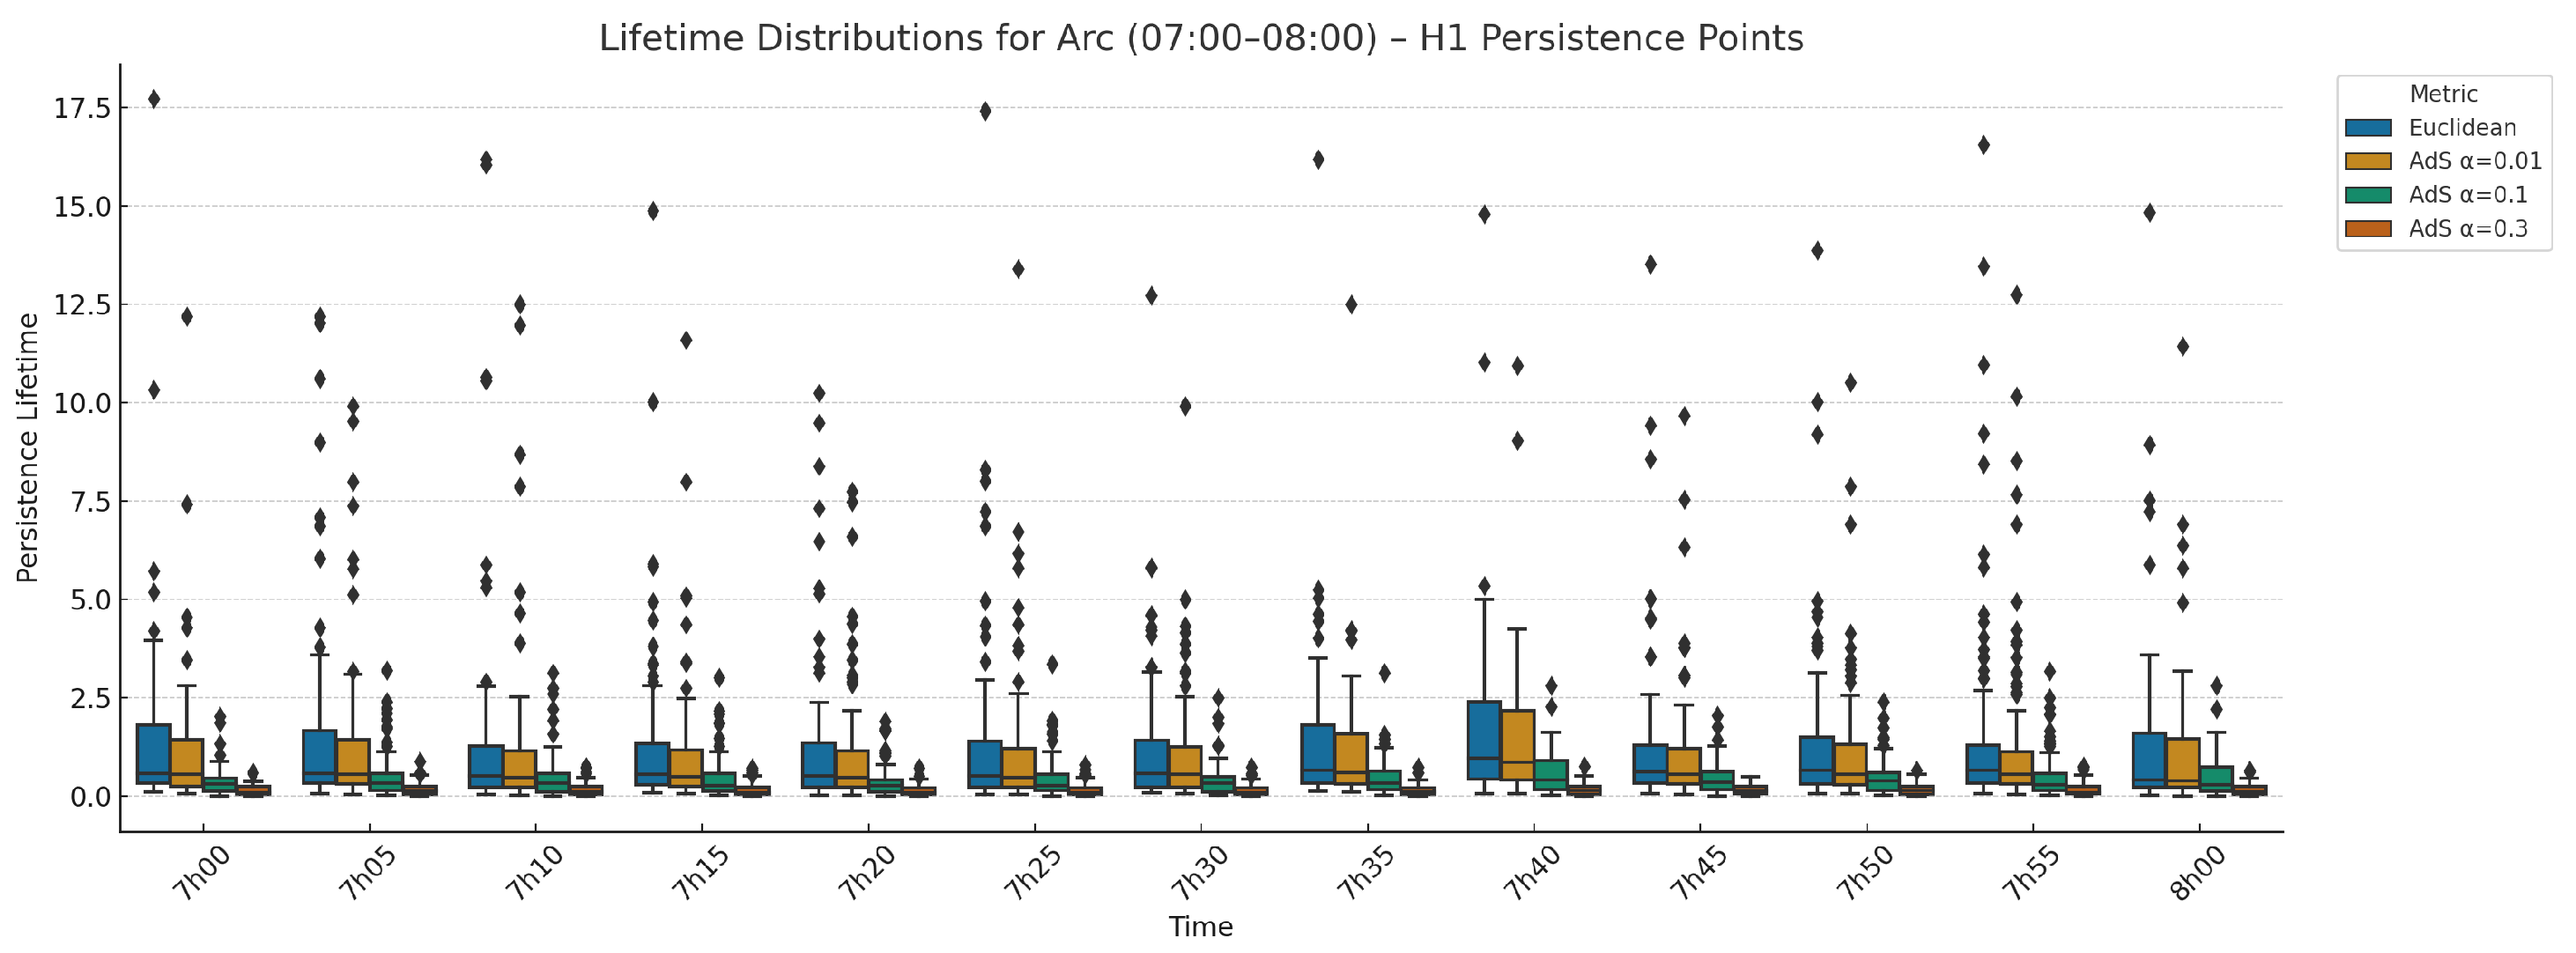
At 07h45 (Figure 10): Euclidean. Lifetimes are widely dispersed, with outliers up to ∼17 units, indicating a mixture of dominant structures and substantial topological noise; variability over time is high. AdS α = 0.01 . A mild compression: long-lived cycles remain (up to ∼7–8 units) and a few outliers are filtered, but small-scale noise persists. AdS α = 0.1 . Distributions are well centered and temporally stable (typically ∼1–5 units), with fewer outliers and good balance between preserving salient features and removing insignificant ones. AdS α = 0.3 . Compression is too strong: most lifetimes fall below ∼2 units; noise is reduced but mid-large-scale cycles are under-represented. AdS with α = 0.1 best preserves robust, long-lived arc features while suppressing weak cycles.

3.7.2. Internal Cell Topology

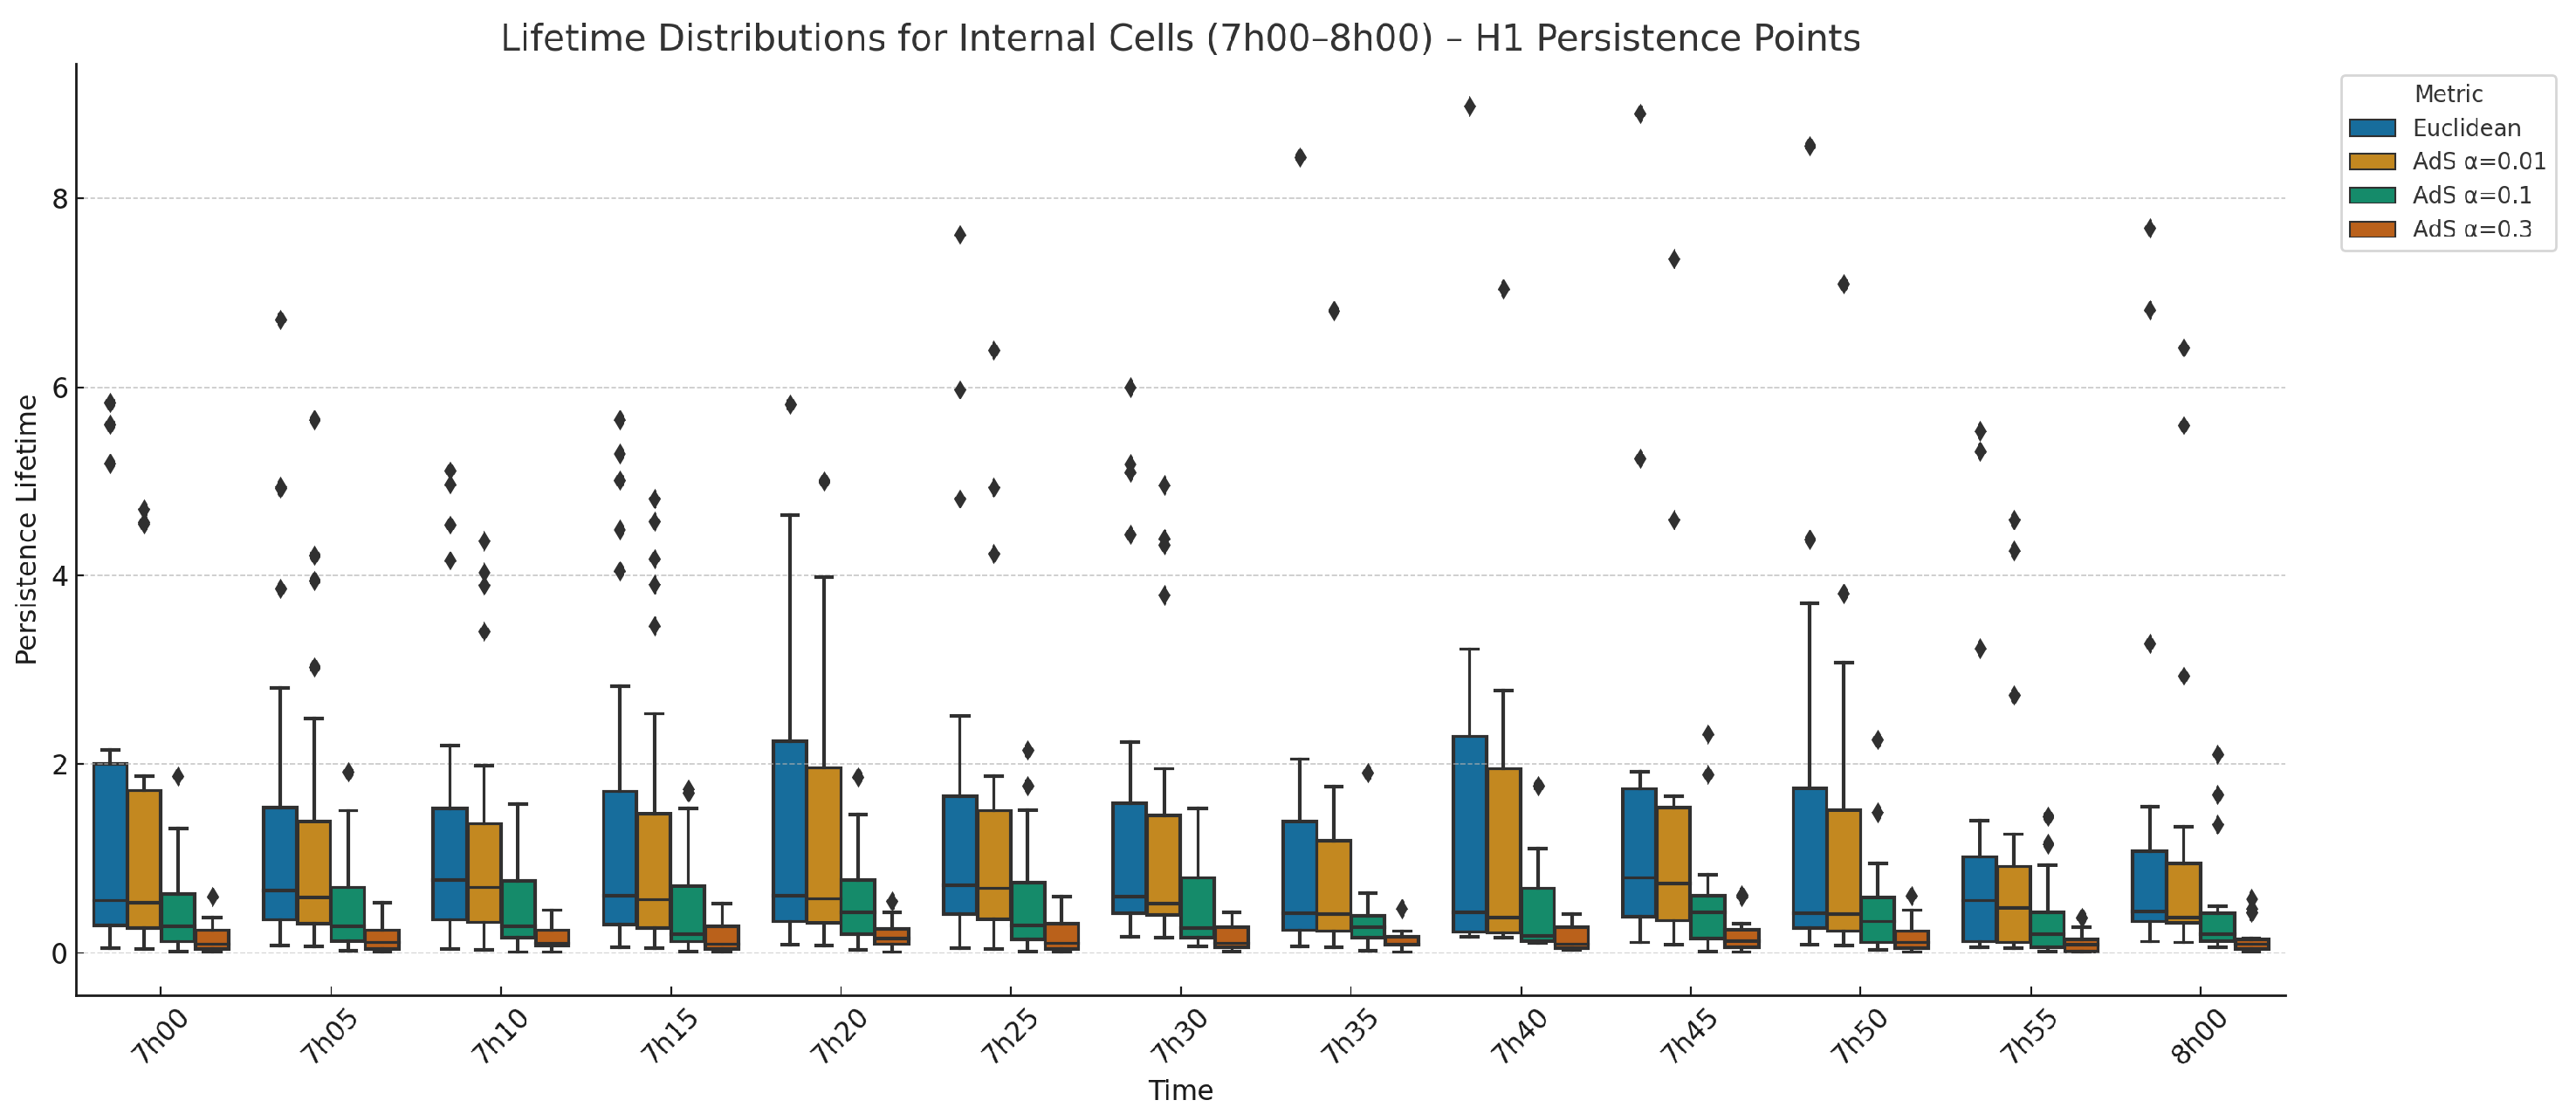
For internal cells, at 07h45 (Figure 10): Euclidean. Shorter lifetimes than for the arc, but still high variance with numerous outliers, reflecting sensitivity to local noise and uneven sampling. AdS α = 0.01 . Slight compression; early times (07h00 to 07h20) remain noisy with marked small-scale variability. AdS α = 0.1 . Best compromise: lifetimes are well centered (typically ∼1.5–3 units), few outliers, and stable behavior over time—consistent with organized cellular convection. AdS α = 0.3 . Over-compression eliminates many cycles; noise is minimal but meaningful structures may be missed. As for the arc, Ads α = 0.1 yields a topologically and geometrically consistent reading of the cells, isolating persistent features while suppressing unstable ones.
Figure 11 and Figure 12 report the time-resolved (7h00–8h00) boxplot distributions of H 1 lifetimes for the arc (Figure 11) and the internal cells (Figure 12) under the four metrics. For the arc, α = 0.1 yields the most balanced behavior—well-centered, temporally stable distributions with fewer outliers—whereas α = 0.3 over-compresses and the Euclidean metric remains outlier-sensitive. For the cells, lifetimes are overall shorter and less dispersed, and α = 0.1 again provides the best compromise for a robust interpretation of convective dynamics.

3.7.3. Comparative Analysis of Arc and Internal Cells (AdS α = 0.1 )

Figure 13 compares the distribution of lifetimes for H 1 persistence cycles between the arc and the internal convective cells, using exclusively the compressive AdS metric with α = 0.1 .
The arc consistently exhibits higher median lifetime values than the internal cells, with several long-lived outliers. This reflects the presence of persistent, connected, large-scale topological structures, typical of an organized storm system. In contrast, the internal cells show lower centered distributions with reduced spread. This indicates more localized dynamics, characteristic of spatially confined convective activity. The AdS metric with α = 0.1 acts here as a regularizing filter: it moderately compresses distances, removes spurious cycles, and retains only the stable topological features. As such, it enables a clear structural comparison across scales, without introducing excessive noise nor over-suppressing meaningful patterns.

3.8. Analysis of Wasserstein Distances Between H 1 Diagrams (Ads vs. Euclidean)

Before introducing the Wasserstein-based alert indicator, we first quantify how AdS warping modifies H 1 persistence (relative to Euclidean) and whether arcs and cells respond differently. We use the p–Wasserstein distance W p between persistence diagrams. For descriptive comparisons (metric effects, temporal evolution) we report W 1 due to its robustness and interpretability. For the alert indicator Δ ( t ) , we use W 2 so as to upweight rare, large deviations (quadratic cost). Stability results for persistence hold for all p 1 , and on bounded domains of diameter D one has W q D 1 p / q W p p / q ; under the AdS bound D 1 / α , this yields W 2 α 1 / 2 W 1 1 / 2 , ensuring consistent scaling across sections. We measure the 1-Wasserstein distance between each Euclidean H 1 diagram and its Ads counterpart over 07h00–08h00, for α { 0.01 , 0.1 , 0.3 } .

3.8.1. Arc

For each 5-min frame between 07h00 and 08h00, Figure 14 shows the 1-Wasserstein distance W 1 between the arc’s H 1 persistence diagram computed with the Euclidean metric and with the AdS metrics; larger values indicate a stronger AdS-induced deformation of the arc’s topological signature relative to Euclidean: (i) α = 0.01 yields small shifts (typ. ∼0.3), consistent with mild compression; (ii) α = 0.1 produces moderate distances (∼0.8–1.8), reflecting effective filtering of short-lived cycles while preserving structure; and (iii) α = 0.3 induces the largest shifts (often >1.2, up to ∼2.9), indicating over-compression and loss of mid/large-scale features. This supports α = 0.1 as a balanced setting.

3.8.2. Internal Cells

For cells (Figure 15), distances remain lower overall: (i) α = 0.01 stays very small (∼0.18–0.4); (ii) α = 0.1 increases modestly (∼0.8–1.2), affecting mainly short-lived cycles; and (iii) α = 0.3 reaches ∼1.2–1.5, still milder than for the arc. This lower sensitivity suggests intrinsically robust, localized topology.

3.9. Discussion

We use the bounded, monotone warping d AdS ( x , y ) = d E ( x , y ) / ( 1 + α d E ( x , y ) ) , which is 1-Lipschitz with respect to d E and preserves the edge order in Vietoris–Rips (therefore the persistence pairing), while reparameterizing birth/death scales. Empirically, this acts as a parametric filter on lifetimes: increasing α compresses large separations, pushes short-lived noise toward the diagonal, and enhances the readability of the diagrams without altering the algebraic machinery. Across 07h00–08h00, three regimes are observed: (i) α = 0.01 is too weak (diagrams close to Euclidean); (ii) α = 0.1 yields the best signal–noise trade-off (stable, well-centered lifetime distributions, clear separation from near-diagonal noise); and (iii) α = 0.3 over-compresses (many cycles are driven close to the diagonal and fall below detection or post-processing thresholds). Wasserstein distances between Euclidean and AdS diagrams grow with α , supporting α = 0.1 as a balanced setting. The arc exhibits higher median H 1 lifetimes and more outliers, reflecting large-scale organization; it is also more sensitive to compression (strong rise in Wasserstein at high α ). The internal cells show shorter, more localized lifetimes with lower sensitivity to AdS warping, indicating intrinsically compact topology.
Since d AdS = f d E with f strictly increasing, the Vietoris–Rips combinatorics (pairings) are unchanged; AdS improves interpretability via scale reparameterization and noise attenuation rather than by altering which features pair. Overly large α may under-represent mid-/large-scale cycles by pushing them near the diagonal. These trade-offs motivate the moderate choice α = 0.1 used in the sequel.

3.10. Perspectives

Future research may focus on (i) large-scale validation on additional cases (seasons/regions) and comparison with other stable metrics (DTM, diffusion distances); (ii) extension to anisotropic or data-adaptive warpings (weights by reflectivity, shear, altitude) that can modify edge order and thus the pairing combinatorics; and (iii) advanced spatio-temporal topology (vines/vineyards, multi-parameter persistence in scale×intensity) and uncertainty quantification.

4. Arc/Cell of Bow Echo Topological Interaction and Alert Triggering

4.1. Cross-Correlation of H 1 Persistence Lifetimes

To quantify the temporal interplay between the arc structure and its embedded convective cells, we compute the cross-correlation ρ ( τ ) of H 1 lifetimes. At each instant t, the arc and the cells are represented by lifetime vectors arc ( t ) and cells ( t ) . The function
ρ ( τ ) = 1 T | τ | t = 1 T | τ | corr arc ( t ) , cells ( t + τ ) ,
with τ a temporal lag (in steps of 5 min), measures the degree of topological alignment between the two systems. Negative lags ( τ < 0 ) probe whether the arc precedes and potentially drives the cells, whereas positive lags test for delayed feedback from the cells toward the arc.
Figure 16 shows the results for Euclidean and AdS-based metrics. The curves display an oscillatory pattern with three salient features: (i) a global maximum at τ = 1 , (ii) a strong minimum at τ = 0 , and (iii) a secondary maximum at τ = + 1 . The consistent peak at τ = 1 indicates that the arc topology at time t is optimally correlated with the cell topology observed five minutes later. This lagged alignment implies a predictive influence of the arc over the cellular structures. Conversely, the pronounced dip at τ = 0 highlights the absence of instantaneous correlation: the arc and the cells are not synchronized at the same radar frame, but rather exhibit a lead–lag relationship. The smaller maximum at τ = + 1 suggests a partial retroactive effect, where cells at time t exert some delayed feedback on the arc at t + 5 min. Such an alternating motif is characteristic of a time-asymmetric but reciprocal interaction.
Applied to the Corsica bow echo (07h00–08h00), the analysis yields a consistent maximum at τ = 1 across all metrics. For example, the arc structure at 07h15 is best aligned with the cells observed at 07h20, confirming that the arc acts as a topological precursor with a predictive horizon of one timestep (5 min). This finding is robust to metric choice, but the amplitude of the correlation increases with the AdS compression parameter α , indicating that curved metrics sharpen the causal signal by filtering spurious cycles and emphasizing structurally relevant features.
These results carry direct operational significance. The arc appears not only as a morphological signature of the bow echo but also as a “topological driver” that anticipates the organization of deep convection. Detecting the peak correlation at τ = 1 provides an actionable early-warning signal: a measurable topological change in the arc reliably foreshadows the emergence or intensification of internal cells within the following 5 min. Embedding this causal signature into a TDA-based monitoring pipeline thus offers a principled way to trigger pre-alerts before convective hazards become locally destructive.

4.2. Topological Alert Indicator Based on H 1 Lifetimes for AdS α = 0.1

We adopted the AdS metric with α = 0.1 as the reference setting for computing the Topological Alert Indicator Δ ( t ) .

Definition of the Indicator

To quantitatively monitor the divergence between the arc and the internal convective cells, we define a differential signal Δ ( t ) as the Wasserstein distance between their H 1 persistence diagrams at each time step t,
Δ p ( t ) = W p D arc ( t ) , D cells ( t ) ,
and use p = 2 in practice, which enhances the response to the appearance of highly persistent loops. Threshold θ * is calibrated on a validation window. The resulting time series measures the evolving topological contrast between the arc front and the embedded cellular system. To transform this continuous signal into a binary alert tool, we adopt a standard anomaly detection approach based on the mean plus one standard deviation rule. Specifically, deviations larger than one standard deviation above the mean are interpreted as topological anomalies of meteorological significance. Let
μ = 1 N i = 1 N Δ ( t i ) , σ = 1 N i = 1 N Δ ( t i ) μ 2 ,
with N as the number of time steps (here, N = 13 between 07h00 and 08h00). The threshold is then defined as
θ * = μ + σ .
Temporal alignment protocol. For each 5 min radar frame t i within 07h00–08h00, the differential indicator is Δ ( t i ) = W 2 D arc ( 1 ) ( t i ) , D cells ( 1 ) ( t i ) , where W 2 is the 2-Wasserstein distance between diagrams with diagonal matchings. We transform the continuous signal into a binary alert via θ * = μ + σ computed on the 07h00–08h00 window, and define the first persistent passage (FPT) t FPT as the earliest time such that Δ ( t i ) θ * for two consecutive frames. The visual bow echo onset t onset is the first frame where a continuous concave arc is unambiguously present and persists for at least two frames (07h40 in our case).

4.3. Results and Discussion

The alert threshold is set to θ * = μ + σ = 0.133 . In our case, illustrated in Figure 17, Δ ( t ) crosses θ * at 07h50 and persists above at 07h55, giving t FPT = 7h50. The visual onset of the bow echo, corresponding to the first unambiguous concave arc in radar reflectivity, is t onset = 07h40. The temporal offset is therefore
Δ T = t FPT t onset = + 10 min .
This latency arises mainly from the persistence criterion, which increases robustness against false alarms. The interpretation is consistent: while the arc is visible at 07h40, only by 07h50 does the topological divergence become statistically significant and durable. Low values of Δ ( t ) indicate that the topological organization of the cells remains synchronized with that of the arc, reflecting coherent mesoscale forcing. A persistent rise above θ * corresponds to a new dynamical regime in which the arc and cells decouple structurally: the arc reorganizes the leading convective line, while internal cells evolve with distinct cycles and lifetimes. The mean plus one standard deviation rule provides a natural compromise between sensitivity and specificity: for approximately Gaussian fluctuations, only 16% of points exceed μ + σ . Requiring two consecutive exceedances further reduces the false-alarm probability (to about 2–3% under independence). Threshold and persistence choices can be tuned: a lower threshold or shorter persistence would trigger earlier, while stricter parameters delay but secure the alert. The normalized formulation ensures comparability across events.
In this case study, the indicator Δ ( t ) appears to provide a simple and reproducible signal that may assist the triggering of a topological alert: an alarm could be considered when the divergence between the arc and the cells becomes statistically significant and persists over successive frames. For the Corsica bow echo, this heuristic points to a transition around 07h50 (about ten minutes after visual onset), which is consistent with the view that the arc may precede the organization of internal cells. These observations remain preliminary and specific to a single event; validation on independent cases and longer datasets is required before any operational claims.

5. Conclusions and Perspectives

In this study, we proposed a topological early-warning framework for severe convective systems, combining persistence diagrams, Wasserstein distances, and AdS-inspired metrics. We show that the arc leads the cells, and that Δ ( t ) gives a clear, data-driven signal of bow echo onset. In the Corsica case study, the first-passage time of Δ ( t ) occurred ten minutes after the radar onset, confirming that persistent topological divergence corresponds to the physical transition toward a mature bow echo regime.
Beyond this single case study, the results suggest several possible directions. The Δ ( t ) indicator could, in the future, be tested within near-real-time radar processing chains to evaluate its ability to complement expert visual inspection. Its robustness to local fluctuations and its structural grounding also indicate a potential for integration with other data sources (e.g., lightning, satellite, or numerical model outputs). Moreover, the AdS-based normalization provides a basis for comparing events, which may facilitate extended validation across seasonal or multi-regional datasets.
These perspectives will need to be substantiated by further studies: (i) exploration of adaptive thresholds and persistence criteria, possibly calibrated on climatological datasets, (ii) extension toward multiparameter persistence (e.g., intensity-scale joint filtrations or temporal vineyards), and (iii) investigation of integration into hybrid AI–TDA architectures for decision support. The longer-term objective would be to assess to what extent such a topological indicator could contribute to strengthening early detection and the reliability of operational severe weather alerts, while recognizing that this step still requires extensive validation.

Author Contributions

Conceptualization, H.C.; Methodology, H.C., P.D. and E.F.; Validation, E.F.; Formal analysis, H.C., P.D. and E.F.; Investigation, E.F.; Resources, H.C.; Writing—review & editing, H.C., P.D. and E.F.; Visualization, P.D. and E.F.; Supervision, P.D. All authors have read and agreed to the published version of the manuscript.

Funding

This research received no external funding.

Data Availability Statement

The original contributions presented in this study are included in the article. Further inquiries can be directed to the corresponding author.

Conflicts of Interest

The authors declare no conflicts of interest.

Appendix A. Persistence Diagrams H1

Figure A1. Persistence diagrams of the arc from 07h00 to 08h00 a.m. using the AdS metric with α = 0.1 .
Ijt 02 00019 g0a1

Appendix B. Persistence Diagrams for the Cells

Figure A2. Persistence diagrams of the cells from 7h00 to 8h00 a.m. using the AdS metric with α = 0.1 .
Ijt 02 00019 g0a2

Appendix C. Histograms of H1 Lifetimes for the Arc
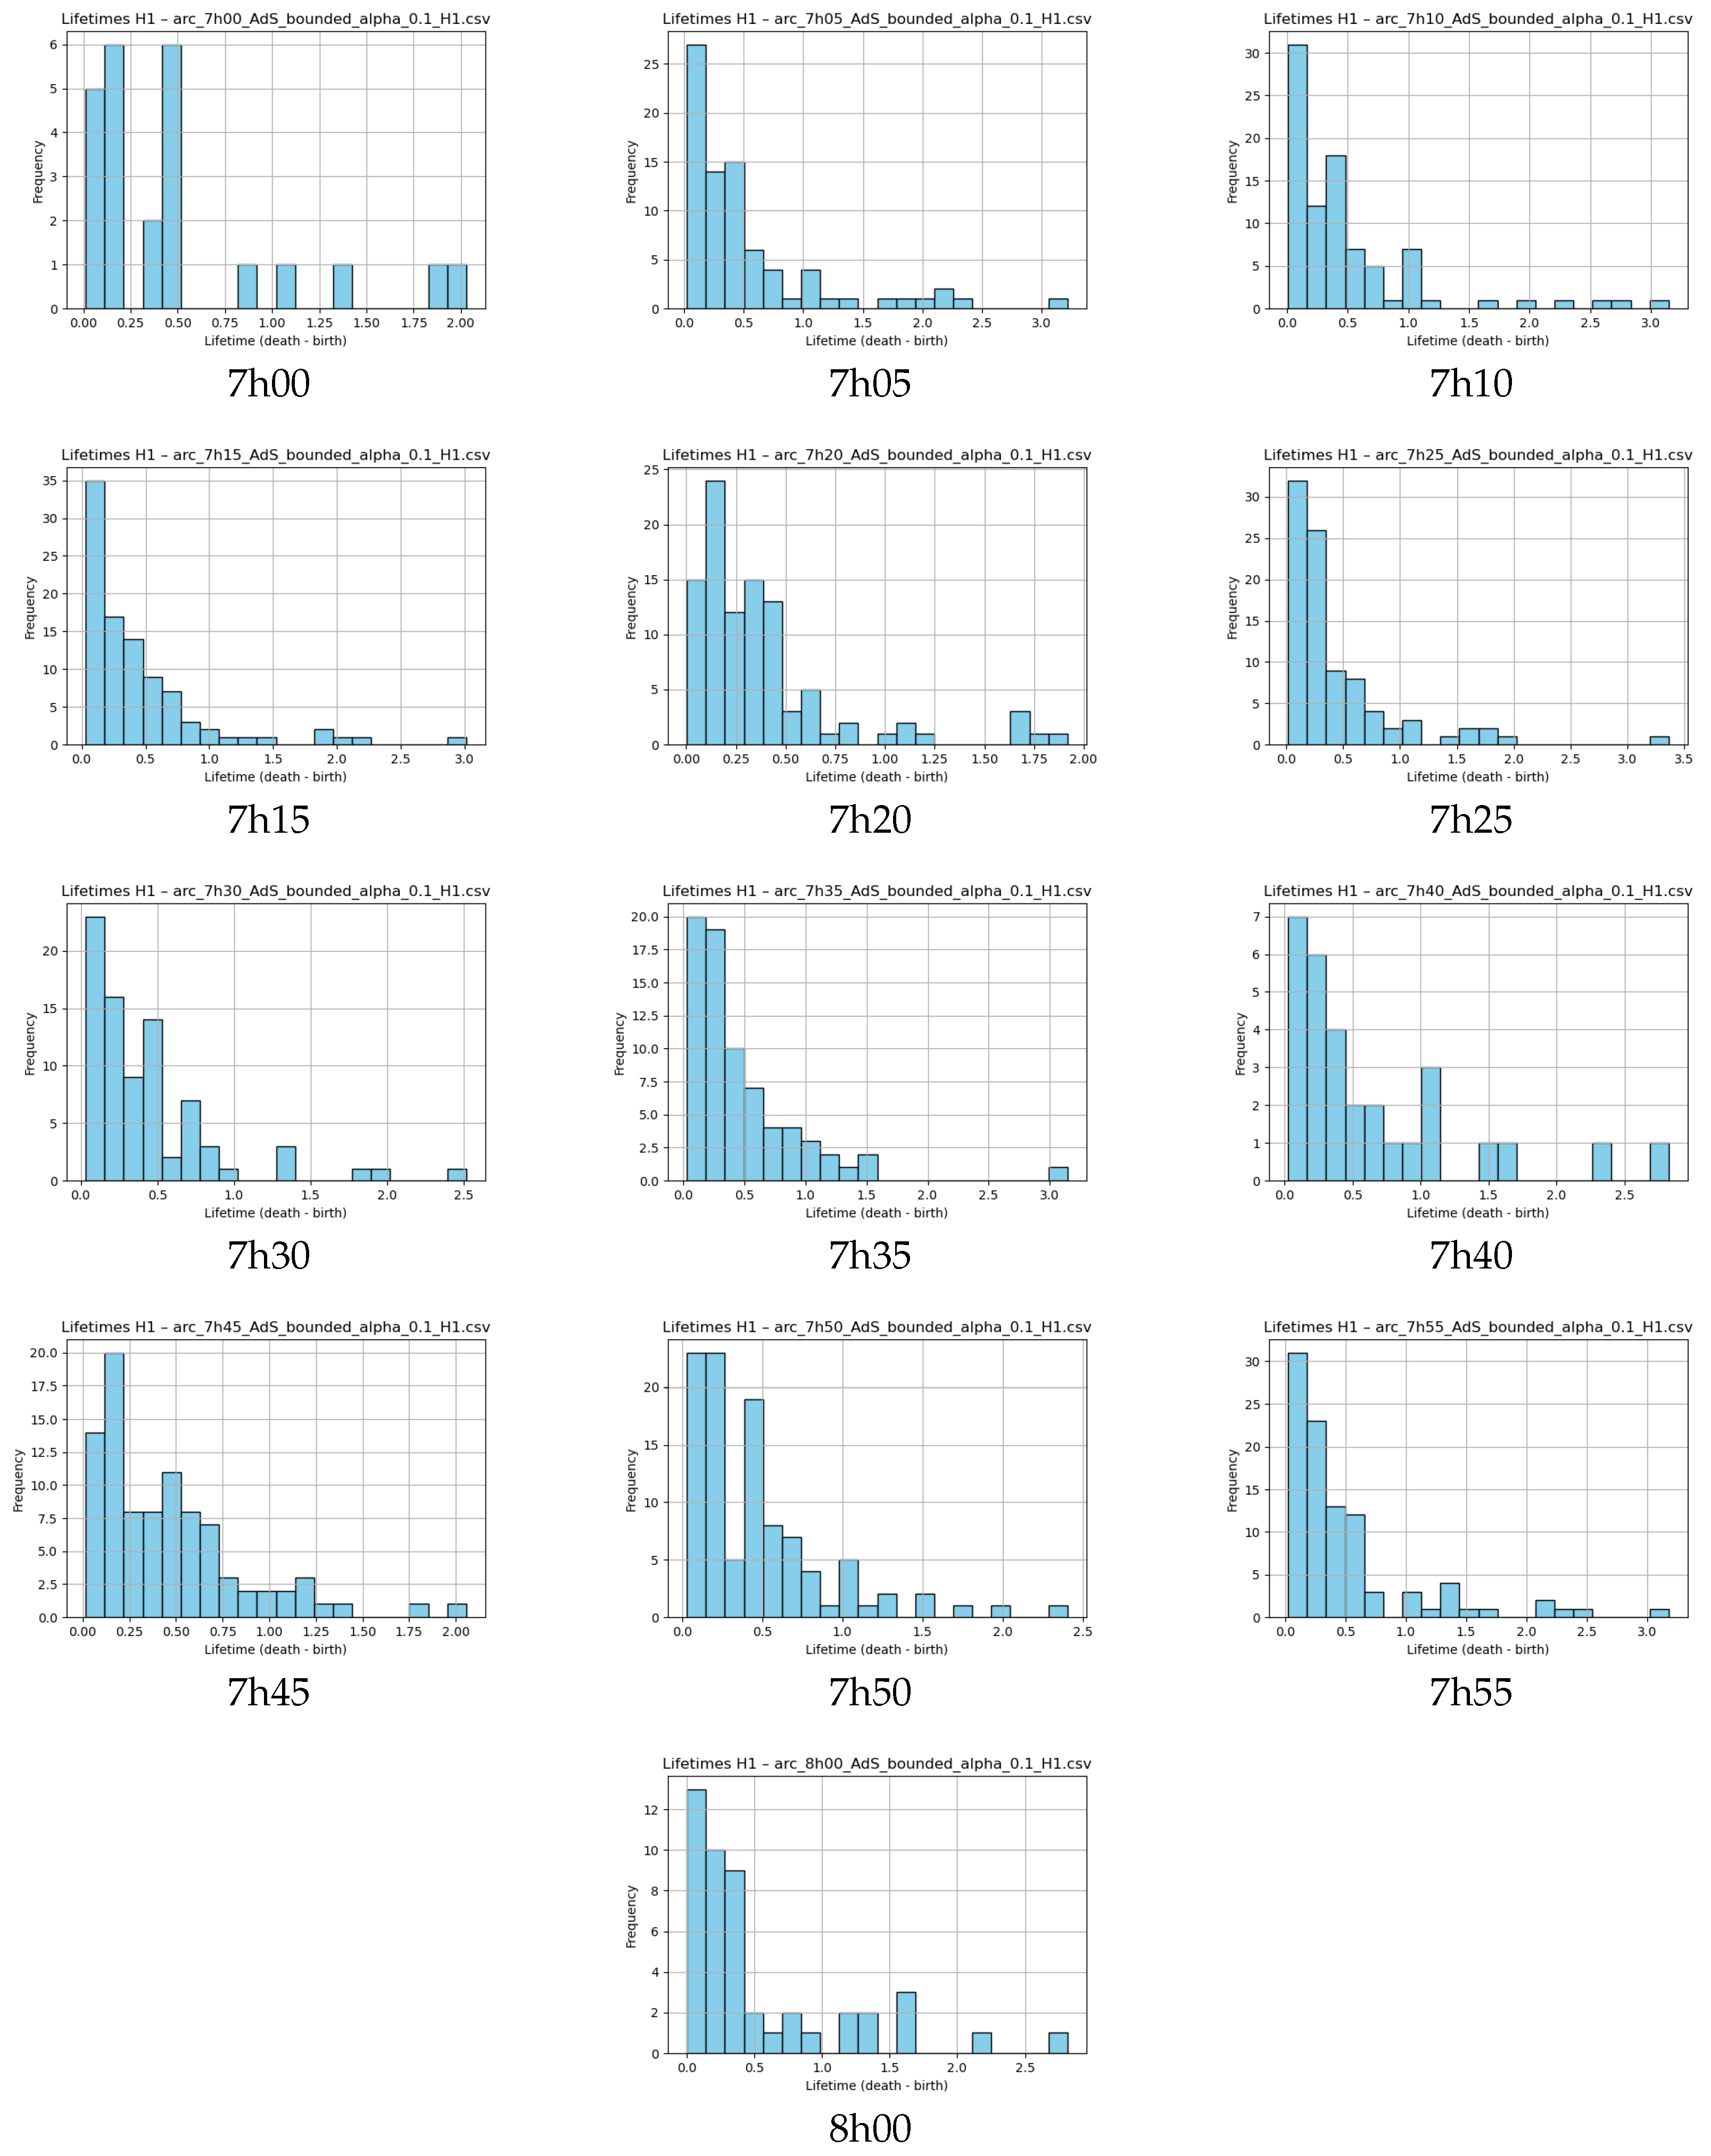
Figure A3. Histograms of H 1 lifetimes using AdS metric with α = 0.1 , from 7h00 a.m. to 8h00 a.m for the arc.
Ijt 02 00019 g0a3

Appendix D. Histograms of H1 Lifetimes for the Cells
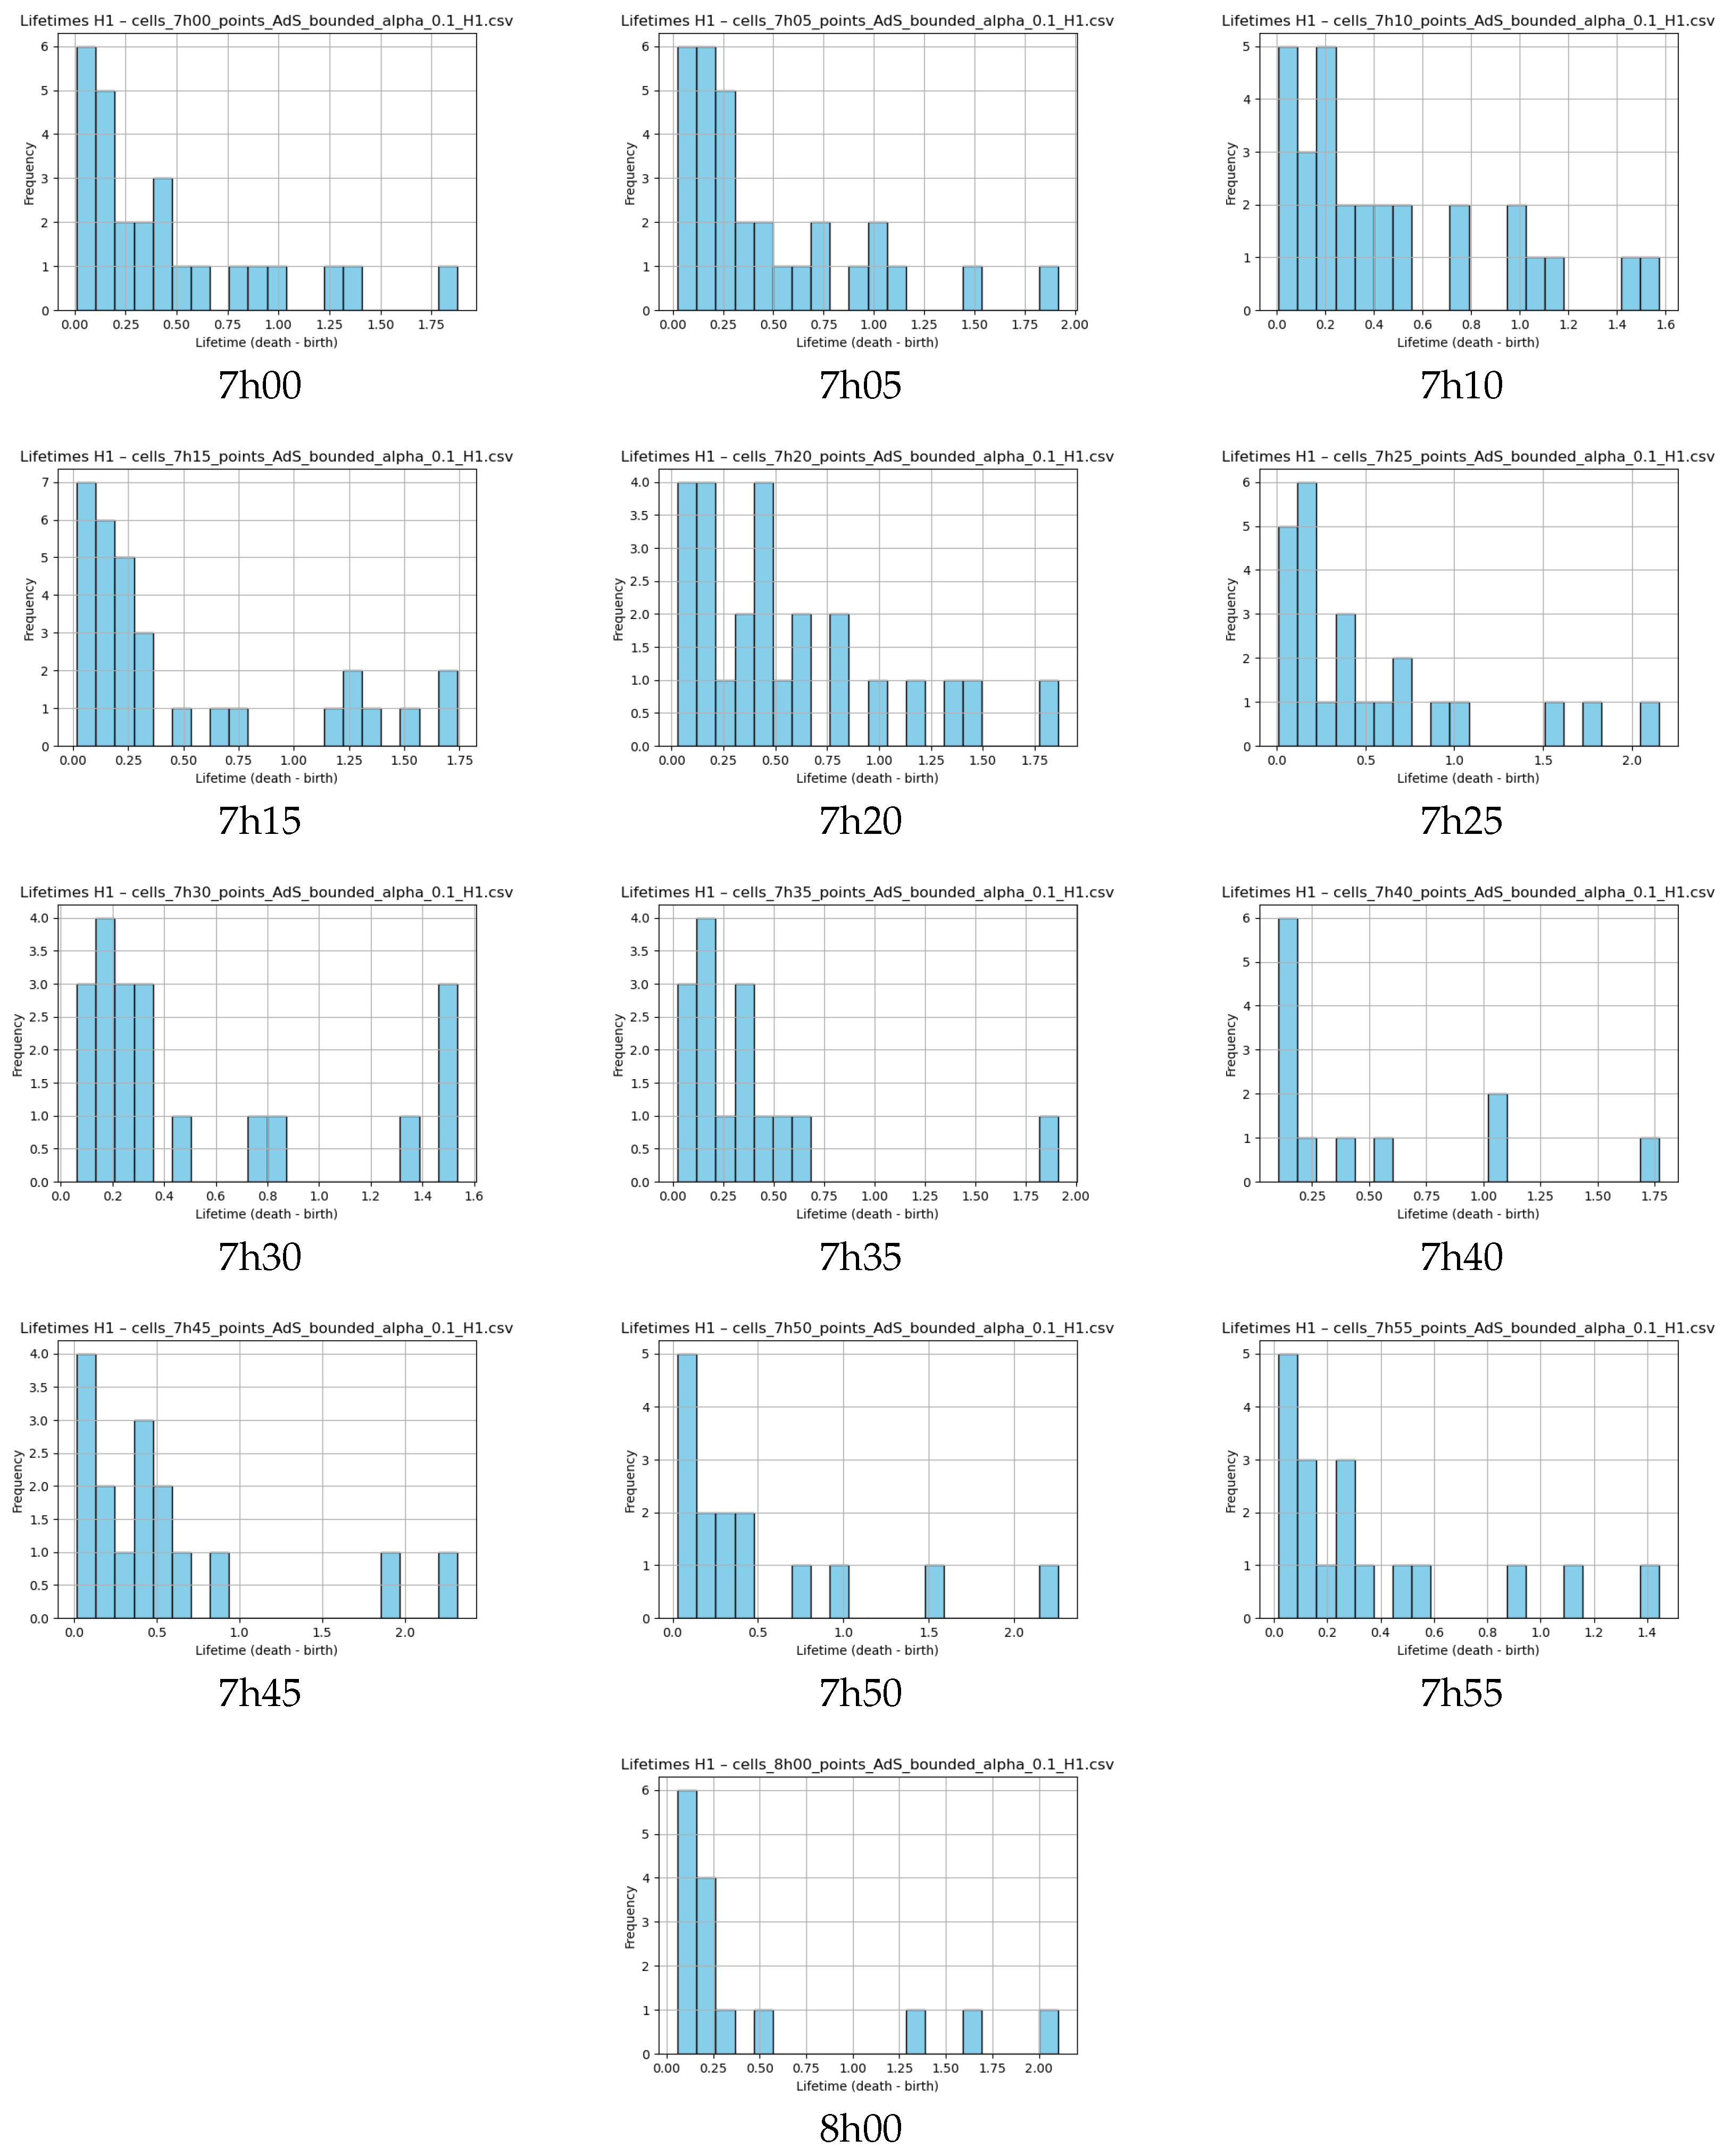
Figure A4. Histograms of H 1 lifetimes using AdS metric with α = 0.1 , from 7h00 a.m. to 8h00 a.m. for the cells.
Ijt 02 00019 g0a4

Appendix E. Temporal Evolution of Arcus Radar Images
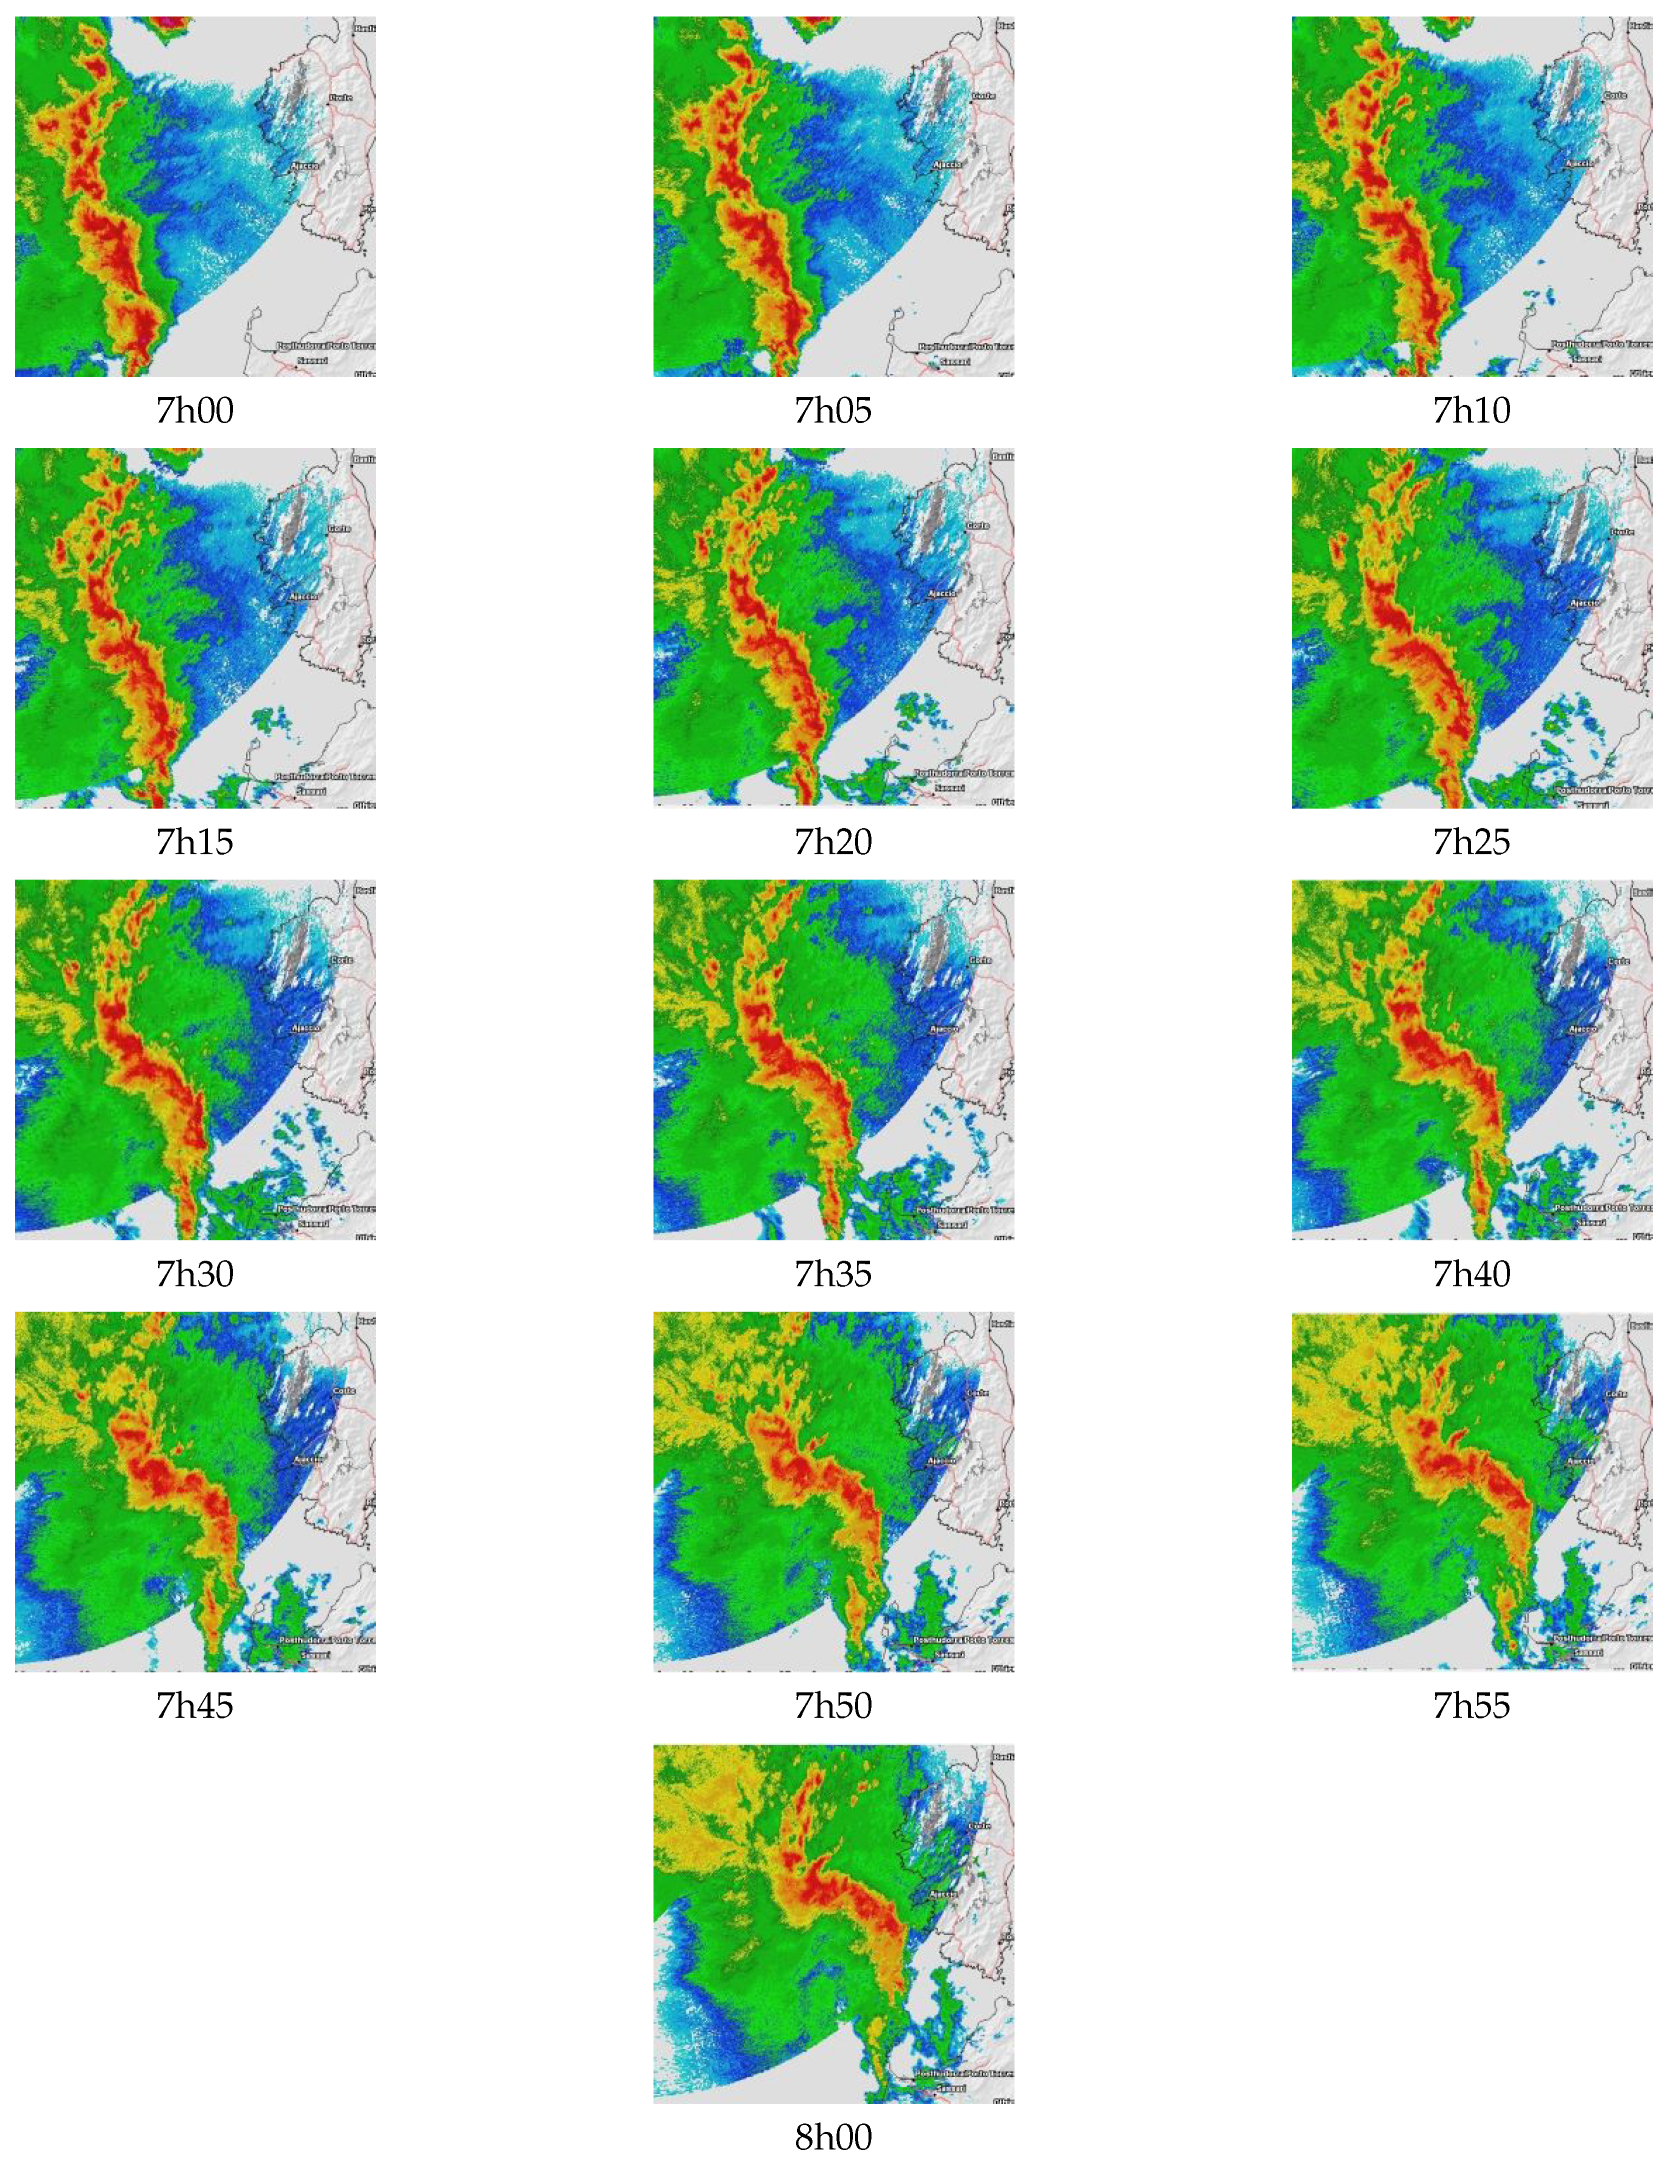
Figure A5. Temporal evolution of the bow echo (07h00–08h00, 5-min cadence). Sequence of Météo-France radar reflectivity maps for the arc between 07:00 and 08:00 (CEST). Some panels display partial basemap/legend information due to export cropping; this does not affect scientific understanding, as the quantitative analysis uses the reflectivity field only. Frames with unavailable data (if any) are marked “N/A” and were excluded from quantitative metrics; conclusions are unchanged. Data source: Météo-France radar mosaic (Corsica sector).
Ijt 02 00019 g0a5

References

  1. Fujita, T.T. Manual of Downburst Identification for Project NIMROD; University of Chicago: Chicago, IL, USA, 1978. [Google Scholar]
  2. Coniglio, M.C.; Stensrud, D.J. Simulation of a progressive derecho using a high-resolution mesoscale model. Weather. Forecast. 2001, 16, 686–705. [Google Scholar]
  3. Przybylinski, R.W. The bow echo: Observations, numerical simulations, and severe weather detection methods. Weather Forecast. 1995, 10, 203–218. [Google Scholar] [CrossRef]
  4. Weisman, M.L. The Genesis of Mesoscale Convective Systems: Interaction of Large-Scale Forcing and Convective Instabilities. J. Atmos. Sci. 1993. [Google Scholar]
  5. Weisman, M.L.; Trapp, R.J. Low-level mesovortices within numerically simulated bow echoes. Mon. Weather. Rev. 2003. [Google Scholar]
  6. Evans, J.S.; Doswell, C.A., III. Examination of derecho environments using proximity soundings. Weather. Forecast. 2001, 16, 329–342. [Google Scholar] [CrossRef]
  7. Kamani, M.M.; Farhat, F.; Wistar, S.; Wang, J.Z. Skeleton Matching with Applications in Severe Weather Detection. Appl. Soft Comput. 2018, 70, 1154–1166. [Google Scholar] [CrossRef]
  8. Britt, K.C.; Potvin, C.K.; Roberts, B.; Skinner, P.S.; Heinselman, P.L.; Potvin, C.K.; Flora, M.L.; Matilla, B.; Knopfmeier, K.H.; Reinhart, A.E. Verification of Quasi-Linear Convective Systems Predicted by the NSSL Warn-on-Forecast System Using Object-Based Methods. Weather Forecast. 2024, 39, 155–176. [Google Scholar] [CrossRef]
  9. Potvin, C.K.; Gallo, B.T.; Reinhart, A.E.; Roberts, B.; Skinner, P.S.; Sobash, R.A.; Wilson, K.A.; Britt, K.C.; Broyles, C.; Flora, M.L.; et al. An Iterative Storm Segmentation and Classification Algorithm for Convection-Allowing Models and Gridded Radar Analyses. J. Atmos. Ocean. Technol. 2022, 39, 999–1013. [Google Scholar] [CrossRef]
  10. Jergensen, G.E.; McGovern, A.; Lagerquist, R.; Smith, T. Classifying Convective Storms Using Machine Learning. Weather Forecast. 2020, 35, 537–559. [Google Scholar] [CrossRef]
  11. Sobash, R.A.; Gagne, D.J.; Becker, C.L.; Ahijevych, D.; Gantos, G.N.; Schwartz, C.S. Diagnosing Storm Mode with Deep Learning in Convection-Allowing Models. Mon. Weather. Rev. 2023, 151, 2009–2027. [Google Scholar] [CrossRef]
  12. Mounier, A.; Raynaud, L.; Rottner, L.; Plu, M.; Arbogast, P.; Kreitz, M.; Mignan, L.; Touzé, B. Detection of Bow Echoes in Kilometer-Scale Forecasts Using a Convolutional Neural Network. Artif. Intell. Earth Syst. 2022, 1, e210010. [Google Scholar] [CrossRef]
  13. McGovern, A.; Chase, R.J.; Flora, M.; Gagne, D.J.; Lagerquist, R.; Potvin, C.K.; Snook, N.; Loken, E. A Review of Machine Learning for Convective Weather. Artif. Intell. Earth Syst. 2023, 2, e220077. [Google Scholar] [CrossRef]
  14. Nugroho, G.A.; Halimurrahman; Awaludin, A.; Fathrio, I.; Trilaksono, N.J.; Maryadi, E.; Sinatra, T.; Renggono, F.; Renggono, D.; Makmur, E.; et al. A 4-years of radar-based observation of bow echo over Bandung basin Indonesia. Geoenviron. Disasters 2024, 11, 19. [Google Scholar] [CrossRef]
  15. Meteo-France. Données radar—Orage du 18 août 2022, Corse. 2022. Available online: https://meteofrance.com (accessed on 15 July 2025).
  16. Edelsbrunner, H.; Harer, J. Computational Topology: An Introduction; American Mathematical Society: Providence, RI, USA, 2010. [Google Scholar]
  17. Chazal, F.; Cohen-Steiner, D.; Glisse, M.; Guibas, L.J.; Oudot, S.Y. Proximity of persistence modules and their diagrams. In Proceedings of the 25th Annual Symposium on Computational Geometry, Aarhus, Denmark, 8–10 June 2009. [Google Scholar]
  18. Munch, E. A user’s guide to topological data analysis. J. Learn. Anal. 2020, 4, 47–61. [Google Scholar] [CrossRef]
  19. Carlsson, G. Topology and Data. Bull. Am. Math. Soc. 2009, 46, 255–308. [Google Scholar] [CrossRef]
  20. Ghrist, R. Barcodes: The Persistent Topology of Data. Bull. Am. Math. Soc. 2008, 45, 61–75. [Google Scholar] [CrossRef]
  21. Oudot, S.Y. Persistence Theory: From Quiver Representations to Data Analysis: AMS Mathematical Surveys and Monographs; American Mathematical Society: Providence, RI, USA, 2016; Volume 209. [Google Scholar]
  22. Gidea, M.; Katz, Y. Topological Data Analysis of Financial Time Series: Landscapes of Crashes. Phys. A Stat. Mech. Its Appl. 2018, 491, 820–834. [Google Scholar] [CrossRef]
  23. Perea, J.A. Topological time series analysis. Not. Am. Math. Soc. 2019, 66, 686–694. [Google Scholar] [CrossRef]
  24. Khasawneh, F.A.; Munch, E. Chatter detection in turning using persistent homology. Mech. Syst. Signal Process. 2016, 70, 527–541. [Google Scholar] [CrossRef]
  25. Lum, P.Y.; Singh, G.; Lehman, A.; Ishkanov, T.; Vejdemo-Johansson, M.; Alagappan, M.; Carlsson, J.; Carlsson, G. Extracting insights from the shape of complex data using topology. Sci. Rep. 2013, 3, 1236. [Google Scholar] [CrossRef]
  26. Ver Hoef, L.; Adams, H.; King, E.J.; Ebert-Uphoff, I. A Primer on Topological Data Analysis to Support Image Analysis Tasks in Environmental Science. Artif. Intell. Earth Syst. 2023, 2, e220039. [Google Scholar] [CrossRef]
  27. Sena, C.Á.P.; da Paixão, J.A.R.; de Almeida França, J.R. A Topological Data Analysis approach for retrieving Local Climate Zones patterns in satellite data. Environ. Chall. 2021, 5, 100359. [Google Scholar] [CrossRef]
  28. Muszynski, G.; Kashinath, K.; Kurlin, V.; Wehner, M.; Prabhat. Topological data analysis and machine learning for recognizing atmospheric river patterns in large climate datasets. Geosci. Model Dev. 2019, 12, 613–628. [Google Scholar] [CrossRef]
  29. Strommen, K.; Chantry, M.; Dorrington, J.; Otter, N. A topological perspective on weather regimes. Clim. Dyn. 2023, 60, 1415–1445. [Google Scholar] [CrossRef]
  30. Ma, T.; Su, Y.; Abdel Wahab, M.M.; Khalil, A.A.E. ZPDSN: Spatio-temporal meteorological forecasting with topological data analysis. Appl. Intell. 2025, 55, 9. [Google Scholar] [CrossRef]
  31. Tymochko, S.; Munch, E.; Dunion, J.; Corbosiero, K.; Torn, R. Using persistent homology to quantify a diurnal cycle in hurricanes. Pattern Recognit. Lett. 2020, 133, 137–143. [Google Scholar] [CrossRef]
  32. Canot, H.; Durand, P.; Frénod, E. Bow Echo Alarm System using Topological Data Analysis. Appl. Math. Mod. Challenges 2025, 3, 44–63. [Google Scholar] [CrossRef]
  33. Grande, V.P.; Schaub, M.T. Non-isotropic persistent homology: Leveraging the metric dependency of PH. arXiv 2022, arXiv:2201.06480. [Google Scholar]
  34. Chazal, F.; Cohen-Steiner, D.; Mérigot, Q. Geometric inference for probability measures. Found. Comput. Math. 2011, 11, 733–751. [Google Scholar] [CrossRef]
  35. Coifman, R.R.; Lafon, S.; Lee, A.B.; Maggioni, M.; Nadler, B.; Warner, F.; Zucker, S.W. Geometric diffusions as a tool for harmonic analysis and structure definition. Proc. Natl. Acad. Sci. USA 2005, 102, 7426–7431. [Google Scholar] [CrossRef]
  36. Silva, V.; Tenenbaum, J. Global versus local methods in nonlinear dimensionality reduction. Adv. Neural Inf. Process. Syst. 2003, 15, 721–728. [Google Scholar]
  37. Carrière, M.; Chazal, F.; Ike, Y.; Lacombe, T.; Royer, M.; Umeda, Y. PersLay: A neural network layer for persistence diagrams and new graph topological signatures. In Proceedings of the Twenty Third International Conference on Artificial Intelligence and Statistics (AISTATS), Online, 26–28 August 2020. [Google Scholar]
  38. Maldacena, J. The Large N Limit of Superconformal Field Theories and Supergravity. Adv. Theor. Math. Phys. 1998, 2, 231–252. [Google Scholar] [CrossRef]
  39. Moschella, U. The de Sitter and anti-de Sitter Sightseeing Tour. Semin. Poincaré 2005, 1, 1–12. Available online: http://www.bourbaphy.fr/moschella.pdf (accessed on 15 July 2025).
  40. Hooft, G. Dimensional Reduction in Quantum Gravity. arXiv 1993, arXiv:gr-qc/9310026. [Google Scholar]
  41. Susskind, L. The World as a Hologram. J. Math. Phys. 1995, 36, 6377. [Google Scholar] [CrossRef]
  42. Villani, C. Optimal Transport: Old and New; Springer: Berlin/Heidelberg, Germany, 2008. [Google Scholar]
  43. Chazal, F.; Cohen-Steiner, D.; Glisse, M.; Guibas, L.J.; Oudot, S.Y. The Wasserstein distance between persistence diagrams. In Proceedings of the 25th Annual Symposium on Computational Geometry (SoCG 2009), Aarhus, Denmark, 8–10 June 2009. [Google Scholar]
  44. Mileyko, Y.; Mukherjee, S.; Harer, J. Probability measures on the space of persistence diagrams. Inverse Probl. 2011, 27, 124007. [Google Scholar] [CrossRef]
  45. Bubenik, P. Statistical topological data analysis using persistence landscapes. J. Mach. Learn. Res. 2015, 16, 77–102. [Google Scholar]
  46. Cohen-Steiner, D.; Edelsbrunner, H.; Harer, J. Stability of persistence diagrams. Discret. Comput. Geom. 2007, 37, 103–120. [Google Scholar] [CrossRef]
  47. Bauer, U. Ripser: Efficient computation of Vietoris–Rips persistence barcodes. J. Appl. Comput. Topol. 2021, 5, 391–423. [Google Scholar] [CrossRef]
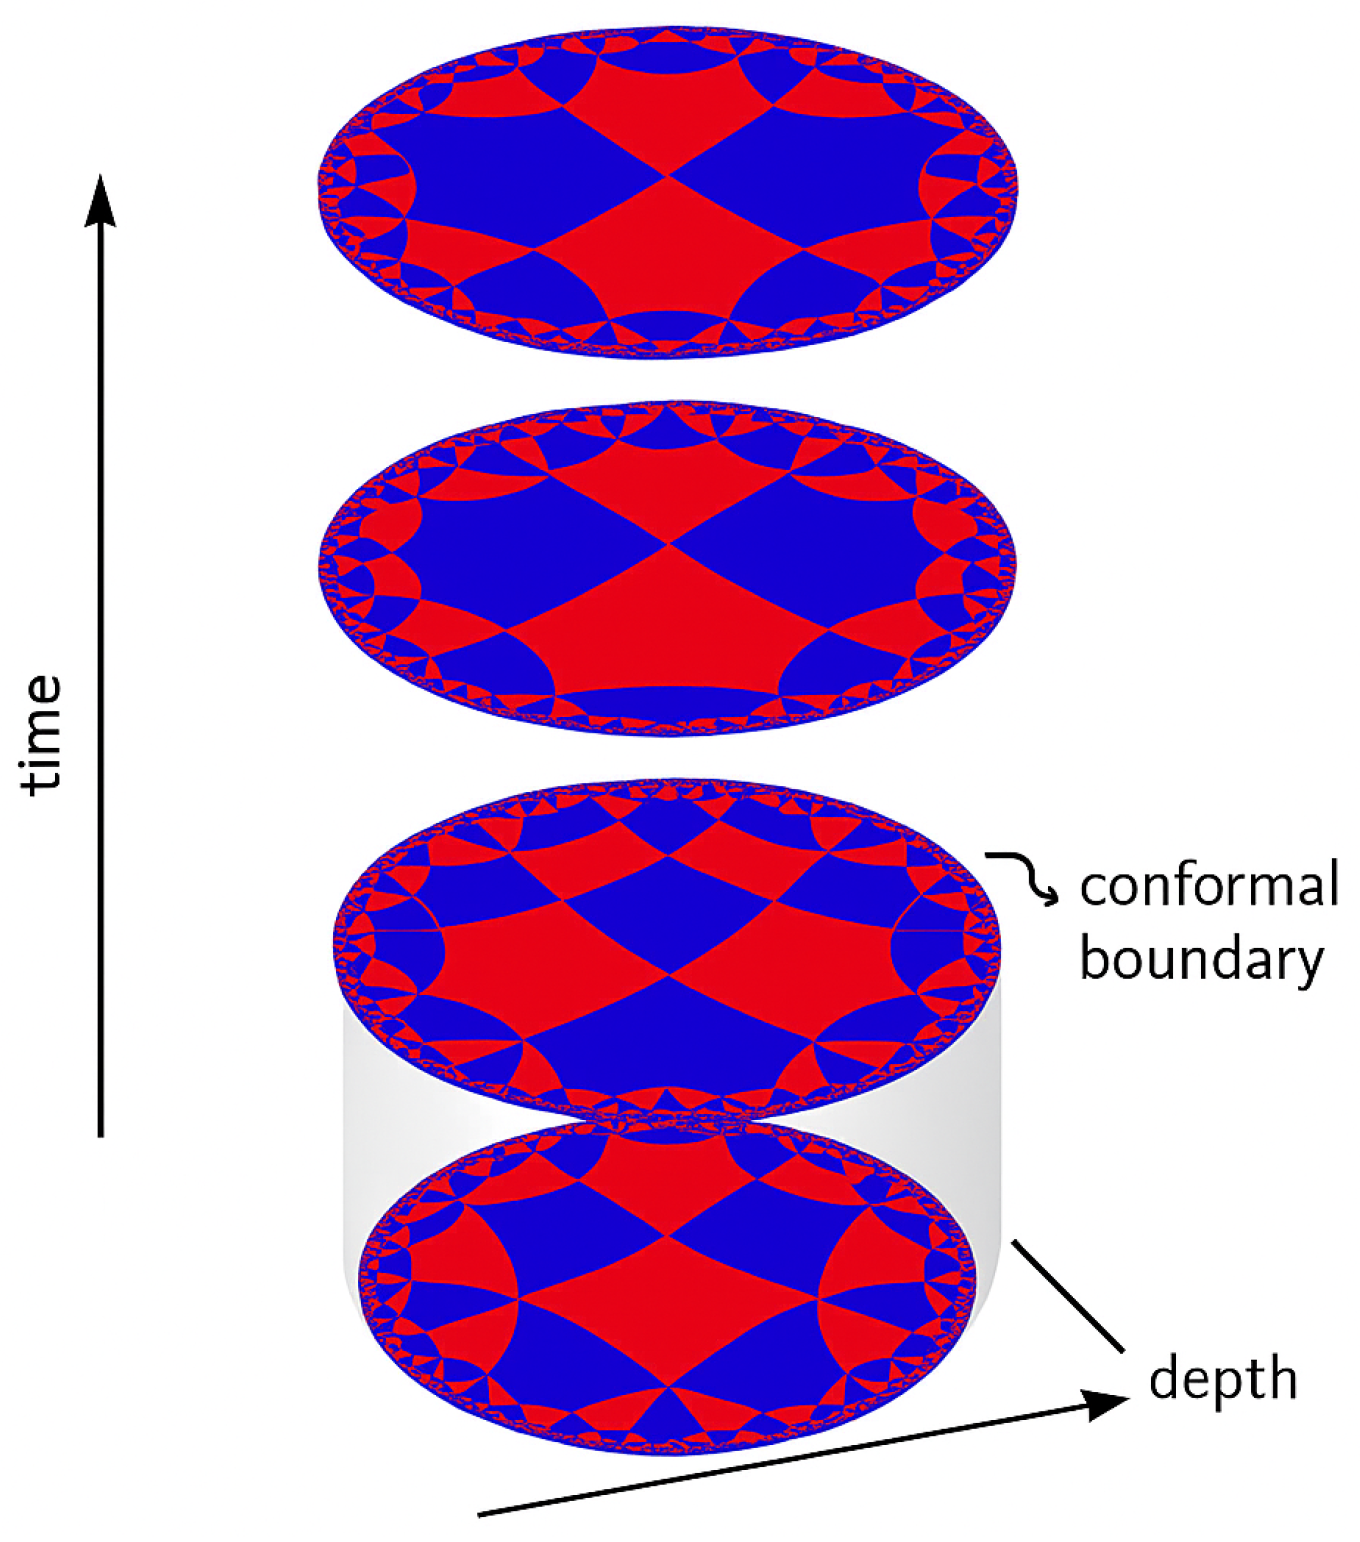
Figure 1. Anti-de Sitter space as stack of disks. The vertical arrow indicates increasing time; the diagonal arrow marks depth into the bulk (radial coordinate).
Ijt 02 00019 g001
Figure 2. Point cloud of a noisy circle.
Ijt 02 00019 g002
Figure 3. Thickening the point cloud X with ε -balls. (Left) small ε , disks (magenta) are mostly disjoint ⇒ many connected components. (Right) larger ε , disks overlap and the union forms an annulus, creating an H 1 loop. This construction yields the Vietoris–Rips filtration.
Ijt 02 00019 g003
Figure 4. Nerve of a cover by ε -balls. Light blue disks cover X. Vertices are the ball centers; an edge is added when two balls overlap (1–skeleton), and a filled triangle when a triple intersection is nonempty. The resulting simplicial complex is the nerve of the cover. Under the assumption of good cover, the nerve has the same homotopy type as the union of the balls.
Ijt 02 00019 g004
Figure 6. Illustrative example. (a) Arc point cloud X R 2 on which a Vietoris–Rips filtration is built. (b) Persistence diagram (on top) ( H 0 in blue, H 1 in orange) using the Euclidean distance. (c) Persistence diagram (on bottom) using the AdS metric d AdS with α = 0.1 . The AdS warping compresses large scales and de-emphasizes long links; topological invariants are preserved, while birth/death times are rescaled.
Ijt 02 00019 g006
Figure 7. Pipeline illustration.
Ijt 02 00019 g007
Figure 8. Persistence diagrams of the arc at 07h45. Layout (2 × 2): (top left) Euclidean metric; (top right) AdS α = 0.01 ; (bottom left) AdS α = 0.1 ; (bottom right) AdS α = 0.3 . Axes: birth (x)/death (y). Colors: H 0 in blue, H 1 in orange. Points farther from the diagonal indicate more persistent cycles; note the progressive compression as α increases.
Ijt 02 00019 g008
Figure 9. Persistence diagrams of the cells at 07h45. Layout (2 × 2): (top left) Euclidean metric; (top right) AdS α = 0.01 ; (bottom left) AdS α = 0.1 ; (bottom right) AdS α = 0.3 . Axes: birth (x)/death (y). Colors: H 0 in blue, H 1 in orange.
Ijt 02 00019 g009
Figure 10. H 1 lifetime histograms for the arc and the cells at 07h45 under various metrics (Euclidean and AdS with α { 0.01 , 0.1 , 0.3 } ).
Ijt 02 00019 g010
Figure 11. Persistence lifetimes of H 1 features in the arc structure from 07h00 to 08h00, computed under four metrics: Euclidean, and AdS with α = 0.01 , 0.1 , and 0.3 . Each boxplot summarizes the distribution of H 1 lifetimes at each time step. AdS α = 0.1 emerges as the most balanced configuration, preserving features while filtering noise. In contrast, α = 0.3 over-compresses the topological signal, and the Euclidean metric remains sensitive to outliers.
Ijt 02 00019 g011
Figure 12. Persistence lifetimes of H 1 features in internal convective cells from 07h00 to 08h00, for the same four metrics. Lifetimes are overall shorter and less dispersed than in the arc, consistent with smaller, more localized topological structures. AdS α = 0.1 again provides the best compromise between robustness and denoising, enabling a stable interpretation of convective dynamics.
Ijt 02 00019 g012
Figure 13. Comparison of topological lifetime distributions ( H 1 ) between the arc and the internal cells, from 07h00 to 08h00, using the compressive AdS metric with α = 0.1 . Each boxplot represents the statistical dispersion of H 1 lifetimes within each structure and at each time step. The arc displays more persistent and dispersed cycles than the cells, reflecting its global topological coherence. In contrast, the internal cells exhibit shorter and more localized cycles. The AdS metric with α = 0.1 provides an effective trade-off between denoising and preserving salient topological structures.
Ijt 02 00019 g013
Figure 14. Temporal Wasserstein evolution for the arc.
Ijt 02 00019 g014
Figure 15. Temporal Wasserstein evolution for the cells.
Ijt 02 00019 g015
Figure 16. Cross-correlation between H 1 lifetimes of arc and cells for different metrics. A consistent maximum at negative lag ( τ = 1 ) indicates that the arc topology at time t anticipates the cell topology at t + 1 (5 min later). The minimum at τ = 0 highlights the absence of instantaneous correlation, while a weaker maximum at τ = + 1 suggests a delayed feedback of the cells on the arc.
Ijt 02 00019 g016
Figure 17. Topological Alert Indicator Δ ( t ) based on H 1 lifetimes (AdS α = 0.1 ). The red dashed line indicates the threshold θ * = 0.133 , the green dotted line the radar onset (07h40), and the orange dashed line the first-passage time FPT (07h50).
Ijt 02 00019 g017
Disclaimer/Publisher’s Note: The statements, opinions and data contained in all publications are solely those of the individual author(s) and contributor(s) and not of MDPI and/or the editor(s). MDPI and/or the editor(s) disclaim responsibility for any injury to people or property resulting from any ideas, methods, instructions or products referred to in the content.