Abstract
The origin of glass formation has been one of the greatest mysteries of science. The first clues emerged in GexSe1-x glasses, where the bond-stretching and bond angle-bending constraints are countable, and it was found that the most favorable compositions for glass formation involved matching constraints with the degrees of freedom. Modulated-Differential Scanning Calorimetric (MDSC) studies on GexSe1-x chalcogenide glasses revealed two elastic phase transitions—a stiffness transition at x = 0.20 and a stress transition at x = 0.26—leading to the observation of three topological phases: a flexible phase at x < 0.20, an intermediate phase in the 0.20 < x < 0.26 range, and a stressed–rigid phase for compositions x > 0.26. The three topological phases (TPs) have now been generically observed in more than two dozen chalcogenides and modified oxide glasses. In proteins, the transition from the unfolded (flexible) to the folded (isostatically rigid intermediate) phase represents the stiffness transition. Self-organization causes proteins to display a dynamic reversibility of the folding process. The evolutions of protein dynamics may also exhibit stiffness phase transitions similar to those seen in glasses.
1. Introduction
Topology has come to mean features of qualitative geometry different from the quantitative relations of ordinary geometry [1]. Historically, its first example may be found with Euler’s Seven Bridges of Konigsberg (1736). Modern topology began early in the 20th century with algebraic topology, and today, this Journal recognizes 14 branches of mathematics as topological. Also listed are six other disciplines that utilize topology, including biology and physics. Here, we will outline two applications that were strongly influenced by the topological nature of their subjects: optimized glass networks, which are found as covers of mobile phones, and selected proteins, including those responsible for the COVID pandemic. Both examples involve natural self-organized networks and share several common topological features. The discovery of self-organization in intermediate phases of network glasses [2] was an important precursive step in this respect, and we comment on this central finding next.
2. Topology Explains Why Self-Organized Glasses Form in the Intermediate Phase
For some time, one of the great mysteries of science was the problem of why, upon cooling from the melt, only select materials form into a glass as opposed to crystallizing (also possibly accompanied by phase separation). It turned out that the first steps in answering this question were made possible by studying the simplest case first. That case was binary chalcogenide GexSe100-x glasses, where the bonding was almost entirely covalent, and the stretching and angle-bending constraints are countable, much like Euler’s polyhedron formula (1750) [1]. Later, the most favorable compositions for glass formation would involve matching constraints with degrees of freedom (Maxwell, 1868) [3]. This 1979 result for covalent glasses [4] was finally extended to optimized partially ionic quaternary silicate glasses (Pyrex) in 2008 [5].
Glasses remained an art practiced by ceramicists for centuries. Industrial glass manufacturers relied on patent arrays to exclude competition, and their proprietary data was protected by proprietary methods. Academic glass samples were obtained by rapid quenching from the melt and were often inhomogeneous. Change was initiated in an unexpected way—by topological constraint theory, which encouraged experiments that involved methods that produced steadily more homogeneous samples. In effect, “random” became a bad word for theory and experiment in glass science.
In academic practice, GexSe100-x alloys have been studied in the greatest detail, with their compositional variations again best understood by combining topology with chemical bonding concepts [6,7]. Initially, it seemed [8] that the network connectivity underwent a single stiffness transition near the x = 20% composition, in agreement with topological predictions [4]. For an atom possessing a coordination number ‘r’ > 2, we have r/2 bond-stretching ‘α’ constraint and 2r-3 bond-bending ‘β’ constraints. Thus, for a Ge atom possessing a coordination number of r = 4, we then have 7 constraints/atom, while for Se possessing a coordination number of r = 2, we have 2 constraints/atom. Therefore, in a binary GexSe100-x glass, we have the total count of ‘α’ and ‘β’ constraints/atom to be nc = 2 + 5x. One expects an isostatically rigid network to form, i.e., when the count of constraints per atom is nc = 3, which for GexSe100-x glass occurs when x = 0.2 or 20 mole % or <r> = 2(1 + x) = 2.40, leading to transition A, shown in Figure 1c. However, further Modulated-Differential Scanning Calorimetric (MDSC) [9,10,11] studies on chalcogenide glasses revealed two elastic phase transitions: the first exactly at x = 20%, or a mean coordination number <r> = 2.40, labelled as A in Figure 1c as the rigidity or stiffness transition, and a second one at x = 26%, or <r> = 2.52, labelled B in Figure 1c as the stress transition [12,13,14], once the self-organized intermediate phase was discovered [2,15,16,17,18]. The observation of the intermediate phase has stimulated both theoretical and experimental work [15,18,19,20,21,22,23,24,25]. Figure 1c. At x > 26%, corresponding to the labelled B location in (Figure 1c), the self-organized phase terminates as stressed–rigid building blocks of the Corner-Sharing (CS) GeSe4-δ (0 < δ < 2) tetrahedra first emerge in Raman scattering [12] and steadily increase in concentration, leading to the formation of the stressed–rigid phase. In the stressed–rigid phase, the sharp peak in ΔHnr observed at the location C of <r> = 2.63 constitutes evidence of nano-scale phase separation of the bulk glass into large Se-rich and small Ge-rich regions, leading to the broken chemical order of the stoichiometric glass. The intermediate phase (IP) glasses were found not to age, unlike the aging observed for the flexible compositions (x < 20%) below the IP and for the stressed–rigid ones above the IP, defining the reversibility window. The vanishing of the enthalpy of relaxation ΔHnr in the intermediate phase, measured at the glass transition temperature Tg, establishes the glass transition as thermally reversing. Here, ΔHnr in MDSC measures the open degrees of freedom for the glass to relax and, thus, age. It was concluded that the thermal reversing nature of the glass transition Tg and the lack of aging are paradigms of self-organization that molecular glasses share with protein structures.
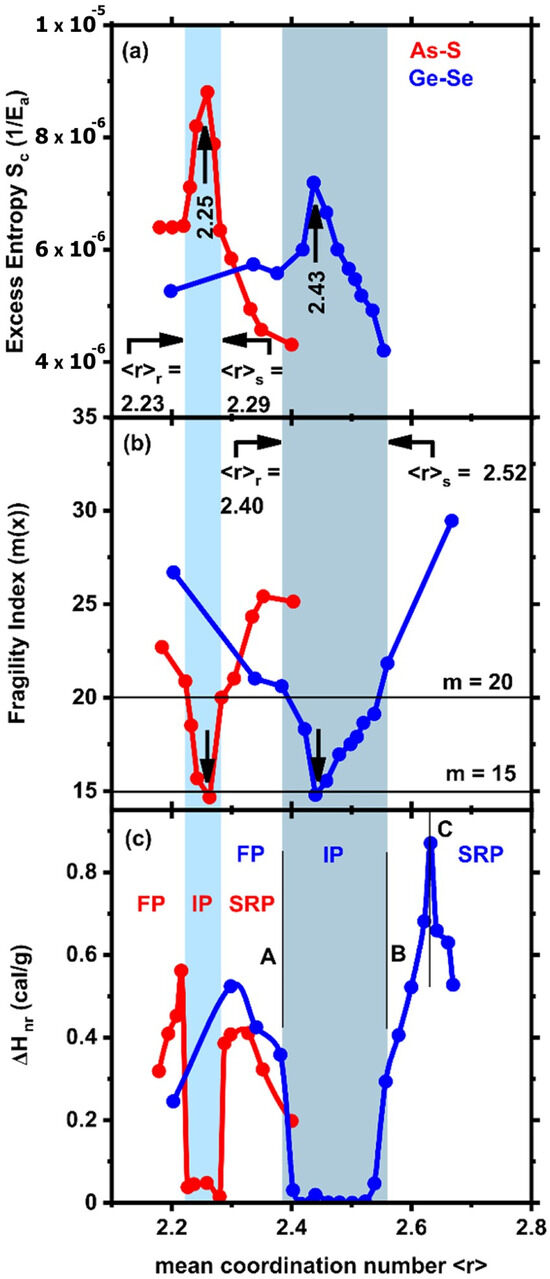
Figure 1.
Compositional variation of the (a) Adam–Gibbs configurational entropy, Sc, (b) melt fragility index, m, and (c) enthalpy of relaxation ΔHnr at Tg, in binary AsxS100-x (●) and GexSe100-x (●), illustrating the three topological phases: the flexible phase (FP), the stressed–rigid phase (SRP), and the blue panels describing the intermediate phase (IP). For GexSe1-x glasses, the mean coordination number <r> is related to composition <r> = 2(1 + x), since Ge and Se are 4- and 2-fold coordinated, while AsxS1-x glasses possess <r> = 2 + x, since As and S are 3-fold and 2-fold coordinated, respectively.
Fragility of a glassy melt is defined as m = d (log η)/d(Tg/T) as the temperature T approaches the glass transition Tg. The Maxwell relation is represented as η = G∞ τ, where G∞ represents the infinite frequency shear modulus, which is independent of temperature, and τ is the shear relaxation time. Thus, the melt fragility index, m, is directly accessible from MDSC experiments on GexSe100-x glasses by measuring τ, the shear relaxation time. MDSC thus permits measuring both the glass enthalpy of relaxation ΔHnr and the melt fragility index m using the same glass sample. In addition, one finds the fragility index to reveal a global minimum of m = 15, near x = 23% of the center composition of the IP (Figure 1b). Such a dynamic anomaly in the molecular diffusivities of Ge and Se in GexSe100-x glasses near x = 23% was independently confirmed by molecular dynamic simulations [26]. The fragility index minimum of m = 15 is a result that is found to be a general feature in covalent glasses [27], and, remarkably, it coincides with the minimum value of m expected for strong glasses based on the fragile–strong classification of melts deduced from the Mauro–Yue–Ellison–Gupta–Allen (MYEGA) relationship linking the melt fragility index with viscosity for glasses of different Tg’s [28].
Molecular Origin of Fragility in Glasses. The structural origin of the fragility index, m, has been a subject of continued interest in glass science since the concept of fragility first emerged [29,30,31,32]. The strong–fragile classification of melts has been investigated in inorganic polymers [30,31] and metallic glasses [33]. The structural origin of fragility has remained less clear, as correlations were sought across multiple glass systems within which the structural evolution of glass structure was, at best, difficult to quantify in terms of non-ergodicity. In these previous reports, the melt fragility index m was found to vary in the 20 < m < 60 range, with the lowest fragility of m = 20 being for SiO2. This is in sharp contrast with the present work, which reveals that the minimum of the fragility index in chalcogenide glasses is found to vary in the 7.7 < m < 20 range, a characteristic of IP glassy melts, because glassy melts in the IP are composed of IRSs possessing no open degrees of freedom (nODF). Such structures suppress melt diffusion because they are built of rigid and stress-free building blocks. Thus, we suspect that in the previous reports [30,31,33], the results were exclusively related to glasses in either the flexible phase or the stressed–rigid phase. In these phases, the fragility index will be determined [34] by the open degrees of freedom, nODF = nd − nc, where nd = 3 for 3D networks and nc is the number of constraints/atoms, which would be less than 3 both in the flexible phase and in the stressed–rigid phase [34].
Synthesis of Homogeneous glasses by FT-Raman profiling. If glasses are homogeneous, a minimum in the fragility index of m = 15 is observed near the IP center composition. If glasses are, however, heterogeneous, one does not observe a clear reversibility window, and further, the minimum of the fragility index m is found closer to m = 30, as noted in three separate studies [35,36,37]. It was not until the method of ex situ Raman profiling was introduced [12] that the recognition first emerged regarding how to quantitatively distinguish homogeneous glasses from their heterogeneous counterparts. The distinction was made possible in a quantitative fashion by the FT-Raman profiling of glasses as they were synthesized in the following manner. For even rather small-sized batch compositions of 1.5 g of the most extensively investigated binary GexSe100-x glasses, it can take nearly 10 days of alloying at 950 °C for the Ge compositional variance, <Δx>Ge, along a 2.5 cm long glass column encapsulated in a 5 mm ID quartz tube, to reduce the heterogeneity to a stoichiometric variance of below 0.1%. At this point, the Raman lineshapes were taken at ten locations along the length of the glass column with a 1064 nm laser beam of 50 μm spot size, and, when homogenized, they became indistinguishable from each other. It was further found that the melt fragility index corresponding to the mid-IP glass composition Ge23Se77 revealed a global minimum of m = 15. The low fragility index of these melts at x = 23% leads the melt viscosity η(x) to increase by nearly 2 orders of magnitude in the narrow composition range, going from x = 19% to x = 23%, which renders achieving homogeneity of these glasses challenging with larger-sized batch compositions. Indeed, when GexSe100-x melts were alloyed for only 2 days at 950 °C, the enthalpy of relaxation at Tg displayed a triangular reversibility window [12] rather than a square-well-like one, as shown in Figure 1c. Several research groups [38,39,40] who typically worked with larger batch sizes (>2 g) and who alloyed these for typically 2 days or less in the vicinity of 950 °C were unable to observe a square-well-like reversibility window (Figure 1c) in the 20% < x < 26% range. The viscosity of GexSe100-x glassy melts synthesized using 20 g sized batches typically showed [35] a melt fragility index of m = 30 near x = 23%, a result that strongly suggested that these glassy melts were heterogeneous. In homogeneous melts, one therefore expects the fragility index to display a Gaussian-like global minimum with m = 15 near the IP center composition (Figure 1b). Such glasses will, in general, display sharp rigidity transitions and stress–elastic phase transitions at x = 20% and x = 26%, as noted in the homogeneous and dry glasses (Figure 1c). The constraint theory of glasses shows that the rigidity transition and the stress–elastic phase transition are both percolative in nature [41], and for that reason, in homogeneous glasses, one expects to observe a square-well-like nature of the reversibility window (Figure 1c).
Stress-free nature of Intermediate Phases probed in Pressure Raman scattering experiments. The isostatically rigid nature of glass networks formed in the IP implies that the count of chemical bonding constraints due to bond-stretching and bond-bending forces/atom, nc, fully exhausts the three available degrees of freedom per atom in 3D networks. An important consequence of this condition is that IP glassy networks are stress-free. The stress-free character of the IP glass networks in GexSe100-x glasses was directly confirmed in pressure Raman experiments [42]. In such experiments, one examines the blue-shift of Raman modes as a glass specimen is subjected to hydrostatic pressure in a diamond anvil cell. And one found that for glass compositions outside the IP, the applied pressure P must exceed a residual pressure, Pr, in the glass for the symmetric stretch mode of GeSe4 tetrahedra to blue-shift. Prior to this work, the finite value of Pr observed in glasses was recognized by K. Murase [43,44] to be a measure of internal stress in a glass network. However, for GexSe100-x glasses investigated by Fei Wang [45], one directly observed Pr = 0 across the IP, and a finite Pr was manifested and steadily increased in both the flexible phase (at x < 20%) and the stressed–rigid phase (x > 26%) as one moved away from the IP. Thus, the vanishing of Pr for glasses in the IP composition range directly confirmed that IP glass networks are indeed unique in that even though they form glass networks, their disordered networks are stress-free, a feature they share with crystalline solids.
Strong nature of Intermediate Phase melts of GexS100-x glasses. The challenges in homogenizing binary GexS100-x glasses [34] far exceed those encountered in the corresponding binary selenides, GexSe100-x. Here, one must remember that the S-S Pauling single-bond energy of 50.9 kcal/mole exceeds the Se-Se Pauling single-bond energy of 44 kcal/mole, leading to the formation of the S8 rings in the sulfide glasses. The clearest evidence of the underlying challenges emerged from the work of Zhu et al. [46], who compared Tg(x) variation in GexS100-x glasses reported by six research groups [46,47,48,49,50,51,52] spanning over 48 years of glass research. One found that in the S-rich glasses, x < 33.3%, the largest variation of Tg among the six research groups was 350 °C and occurred across the composition range 20% < x < 26%. Most remarkably for glass compositions in the Ge-rich compositions in the range of 33.3% < x < 50.0%, the variation in Tg among the different research groups was minuscule by comparison, i.e., less than 10 °C. Why is there such a large variation in Tg in the 20% < x < 26% range? The issue was recently addressed in detail by Boolchand et al. [34], who showed that the IP in GexS100-x glasses is manifested in that special composition range wherein the melt viscosity increases by nearly three orders of magnitude across the IP. It is for this reason that the large spread in Tg results because of glass heterogeneity. To synthesize homogeneous glasses, one must use the FT-Raman profiling of these glasses while synthesizing even small-sized (1.5 g) batches and achieve a Ge variance of <Δx>Ge of 0.1% by alloying the starting materials for nearly 3 weeks at 950 °C [52]. When homogenized, these GexS100-x glasses not only displayed the highest Tg out of the results of the six research groups but also displayed no evidence of phase separation between Ge-rich and S-rich regions, as widely observed by four of the six research groups across the IP range especially. The homogeneity of these glasses also led [52] to a square-well-like reversibility window in ΔHnr(x) to reside in the 20% < x < 26% range. Further, these glasses also revealed a saw-tooth-like variation in the melt fragility index m, showing a minimum of m = 15 near x = 26% at the stress transition. This feature of a saw-tooth-like variation in the fragility index m(x) is found to be closely correlated with the appearance of S8 rings to be populated across the IP in the 20% < x < 26% range, with the S8 ring concentration vanishing near the edge of the reversibility window near x = 26%. The presence of these S8 rings led to a decoupling of the glass backbone, and one found that the concentration of these rings linearly decreased across the IP, with the consequence that one observed a saw-tooth-like variation of the fragility index across the IP [52].
Optimization of Glass-Forming Tendency near IP melt composition center. The Adam–Gibbs configurational entropy [53], Sc, is inversely proportional to fragility index m, and thus shows a maximum (Figure 1a) when m shows a minimum (Figure 1b). The finding is in harmony with thermodynamic considerations that highlight the role of entropy in stabilizing the IP [18]. As one would expect, one finds the select glass composition corresponding to the maximum in Sc to be closely linked with the maximum of the bulk glass-forming tendency, as recently recognized [34]. A parallel set of results has emerged for binary AsxS100-x glasses [54], wherein the IP occurs in the 23% < x < 29% range (Figure 1c) and the melt fragility index (Figure 1b) shows a global minimum of m = 15 near the IP center composition (Figure 1b), leading the Adam–Gibbs configuration entropy Sc to display a maximum near x = 25% or a mean coordination number of <r> = 2.25 (Figure 1a).
Topology also permits one to understand why the reversibility window for AsxS100-x network glasses in Figure 1c is shifted to a lower network connectivity <r> in relation to the one in GexSe100-x network glasses. The molecular structures contributing to the formation of the intermediate phase in AsxS100-x glasses consist of the two isostatic [54] (nc = 3) structures, pyramidal As(S1/2)3 local units (Figure 2d) and quasi-tetrahedral S = As(S1/2)3 local units (Figure 2c) possessing a connectivity <r> of 2.28 and 2.40, respectively [55]. For the pyramidal As(S1/2)3 and quasi-tetrahedral S = As(S1/2)3 local units, constraint counting algorithms show them to be isostatically rigid, with a total count of constraints per atom nc = 3. For the pyramidal unit, we have 7.5 constraints and 2.5 atoms per formula unit, leading to nc = 7.5/2.5 = 3, as illustrated in Figure 2d. The quasi-tetrahedral local unit represents the As5+ state oxidation. For the 1-fold coordinated S, we would count ½ of a bond-stretching constraint but no bond-bending constraint. For the 4-fold As and 2-fold bridging S, we would have 7 and 2 constraints, leading the total count of constraints per formula unit to be 10.5 constraints with 3.5 atoms, leading to nc = 10.5/3.5 = 3, as illustrated in Figure 2c. The observed intermediate phase in AsxS100-x resides in the 2.23 < <r> < 2.28 range, as shown in Figure 1c. It differs from the intermediate phase in corresponding group V selenides. The underlying molecular structure consequences of the shift are also well understood [54,55] and stem from the high Pauling single bond strength of S-S bonds of 50.9 kcal/mole in relation to the Se-Se bond strength of 44.1 kcal/mole. On the other hand, the molecular structures contributing to the formation of the intermediate phase in GexSe100-x glasses are composed [12] of the two isostatic (nc = 3) molecular structures of corner-sharing GeSe4 (Figure 2a) and edge-sharing GeSe2 (Figure 2b) tetrahedra possessing a mean coordination number <r> of 2.40 and 2.67, respectively. Thus, the shift of the reversibility window between GexSe100-x and AsxS100-x glasses is of topological origin; it is related to the connectivity <r> of the isostatically rigid building blocks of their respective IP glass networks.
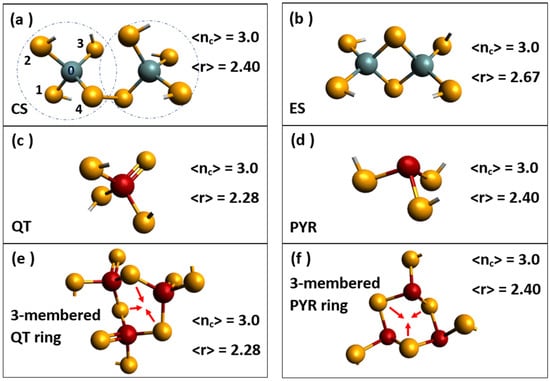
Figure 2.
Isostatically rigid local structures forming the building blocks of the GexSe1-x glasses; (a) corner-sharing Ge(Se1/2)4 and (b) edge-sharing Ge(Se1/2)2 tetrahedra. The corresponding building blocks for the AsxS1-x glasses include the (c) quasi-tetrahedral S = As(S1/2)3 and (d) the pyramidal As(S1/2)3. The mean coordination number <r> and the count of constraints/atom, nc, are included for each building block. The building blocks of PxSe1-x glasses consist of (e) 3-membered QT rings and (f) 3-membered PYR rings.
Further, wider intermediate phases have been found by examining the topological networks formed of equimolar alloys of Group IV (Ge) and Group V (P) selenide glasses, such as observed in the GexPxSe100-2x [56] or GexAsxSe100-2x [57,58] and GexAsxS100-2x [59] ternary glasses, where one finds that the intermediate phase is additive and due to the IP of group V selenide glass, which ranges from 2.28 < <r> < 2.40, adding to the intermediate phase of the Group IV selenide glass occurring in the 2.40 < <r> < 2.52 range, which leads to the widest known intermediate phase width reported to date. Separately, one also finds the fragility index variation across the IP to display a rather wide Gaussian-like global minimum of m = 15. The global fragility index of m = 15 near the IP center is closely tied to the isostatically rigid nature of the four-network building blocks formed in the IP of these chalcogenide glasses, as shown in Figure 2a–d. These molecular building blocks are topologically rigid but stress-free in nature, and this leads to the formation of structurally stable glasses that have correspondingly low melt diffusivities. These observations underscore, again, the topological nature of the three elastic phases formed in covalently bonded chalcogenide glasses.
We now conclude this section with a final comment. Recently, Burger et al. [60,61] have observed a fragility index in binary PxSe100-x glasses that displays a Gaussian-like variation of the fragility index, with a global minimum across the IP of m = 7.7. The fragility index of m = 7.7 is the lowest reported to date in any glass system. Close examination of the molecular structure of these specially homogenized glasses by Raman scattering reveals the occurrence of 3-membered rings of QT Se-P(Se1/2)3 units (Figure 2e) and 3-membered rings of pyramidal P(Se1/2)3 units (Figure 2f) to be formed across the IP range. These extended range isostatically rigid structures hinder melt diffusion qualitatively, underscoring that the molecular origin of the fragility index in chalcogenide-based glasses is again topological. As a final remark, we add that intermediate phases have also been observed in alkali–borate [62] and alkali–phosphate [27] glasses with characteristic IRSs composed of “structural groupings” in the former and Q2 bearing long chains in the latter. The Q2 symbol represents a phosphorus atom having two bridging and two terminal oxygen near neighbors. Solid electrolyte glasses such as (AgI)x(AgPO3)100-x [63] also display the three topological phases [64], including a rather wide square-well-like reversibility window, where the ionic conductivity is found to display a substantially higher ionic conductivity, particularly in the flexible phase.
3. Topology and Gorilla Glass
Connecting iPhone technology to suitable industrial glass covers was not an easy task. The original iPhone had a plastic display, which, Steve Jobs discovered the day after he announced it in January 2007, was already scratched. For years, Apple tried to invent a glass cover that was both strong and flexible, with little progress. In desperation, Apple called Corning’s CEO, Wendell Weeks, who said that Corning might already have something, and after a few months, it provided a glass cover that was both flexible and scratch-resistant for the first generation of Gorilla glass [65]. As of this writing, Corning has produced 12 versions of Gorilla glass, with a variety of chemical modifications. In addition to silica, it contains Al, Mg, and Na ionic modifiers, and it may have its surface layer strengthened by Na-K exchange [66].
Corning viewed topological constraint theory as a key to understanding the temperature and composition dependence of the dynamics of covalent glass-forming liquids, but it was not the best way to fit silica-based glasses containing ionic modifiers. A phenomenological model based on the temperature dependence of the network constraints with only two empirical fitting parameters per oxide component fitted 7141 viscosity measurements for 1000 K < T < 1900 K, with an accuracy of 7 K [67].
4. Topology and Window Glass
The production of window glass has been perfected by human civilization since the 13th century, when the Venetians first developed cristallo [68], a colorless glass produced by refining silica (SiO2) with soda (Na2O) and lime (CaO). Window glass has qualitatively altered life on the planet, starting in the 16th century with the invention of the telescope, which permitted J. Kepler to quantitatively examine planetary motion, which allowed Sir Issac Newton to formulate the principles of classical mechanics in his Principia. The optical microscope soon followed, and today, progress in window glass has revolutionized flat panel displays for TVs, Jumbotrons, and the tempered glass of solar panels. The stability and quality of the glass used in these optical devices are intrinsically linked with the isostatically rigid and self-organized nature of their glass networks, which reside in the intermediate topological phase. The stability of IP glasses has been widely recognized in controlled laboratory experiments [12,13,27,69,70,71,72]. In Figure 3, we display the phase diagram of the SiO2-Na2O-CaO ternary system, displaying the glass-forming tendency as the light gray region taken from [73].
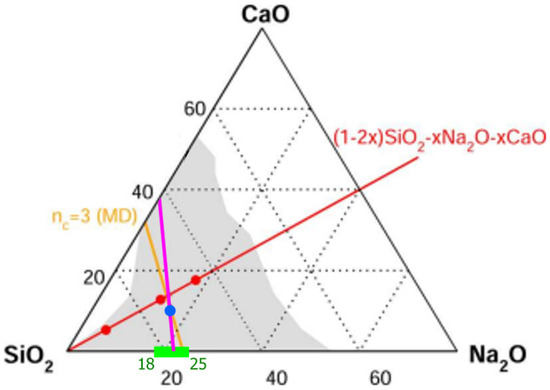
Figure 3.
The glass-forming tendency in the SiO2-Na2O-CaO ternary is depicted by the light grey region. The green region depicts the intermediate phase in the (SiO2)x(Na2O)100-x binary to be in the 18% < x < 25% range of soda. The pink line, linking the green IP center composition, x = 21.5%, with the blue-filled circle, corresponds to the window glass composition of Kerner–Phillips [5] and represents the nc = 3 tie line. The three filled red compositions at x = 6%, 12%, and 18% in the equimolar (1-2x)SiO2.xNa2O.xCaO ternary, the red line, were investigated in MD simulations [73], and the amber line represents the nc = 3 composition tie line deduced from the MD simulations. The vicinity of the x = 12% red-filled circle to the blue-filled circle convincingly demonstrates that window glass is an isostatically rigid glass network, accounting for its stability.
Binary (SiO2)1-x(Na2O)x Glasses: Sodium silicate glasses have been examined in modulated-DSC experiments, and the green band shown in Figure 3 and the blue band in Figure 4 define the isostatically rigid intermediate phase to reside in the 18% < x < 25% range. In binary (SiO2)1-x(Na2O)x glasses, the Na atom is 1-fold coordinated and has a coordination number r = 1, leading there to be r/2 = ½ of a bond-stretching constraint but no bond-bending constraints. For an oxygen atom that is 2-fold coordinated, the coordination number is r = 2, and we therefore have 1 bond-stretching constraint (r/2) and 1 bond-bending constraint per oxygen atom (2r − 3 = 1), whereas for an Si that is 4-fold coordinated, r = 4, and we have r/2 = 2 bond-stretching and 2r − 3 = 5 bond-bending constraints, leading to the total count of constraints nc per atom to be
where the first term in square brackets on the RHS of Equation (1) represents the constraints due to the Na atoms, the second term due to the O atoms, and the third term due to the Si atoms. Upon requiring that the (SiO2)1-x(Na2O)x glass network be isostatically rigid, i.e., nc = 3, one obtains the following result:
nc = (1/3) {[2x (½)] + [2x + 4(1 − x)] + [7(1 − x)]} = (11 − 8x)/3
3 = (1/3) (11 − 8x) or x = 0.25
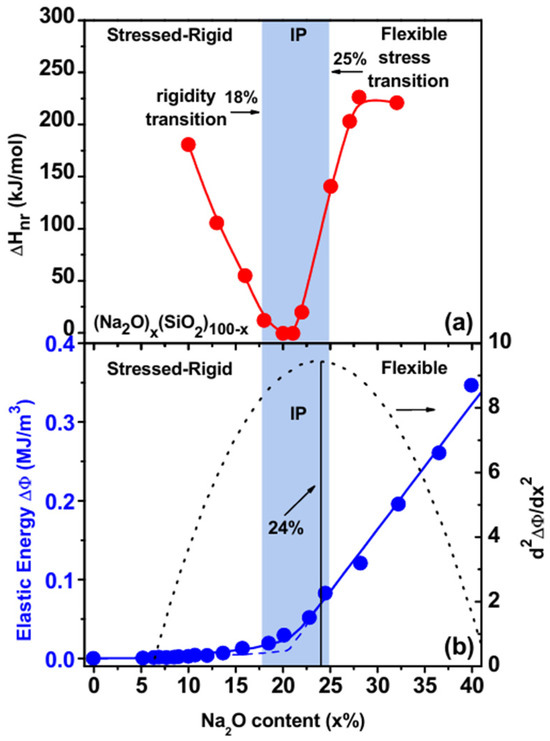
Figure 4.
(a) The observed variation of the enthalpy of relaxation ΔHnr at Tg in (Na2O)x(SiO2)100-x glasses reveals that the intermediate phase is in the 18% < x < 23% range. (b) Brillouin scattering measurements suggest the onset of rigidity to occur near x = 24%, where the elastic energy departs from linearity [70]. The onset of rigidity near x = 23% in calorimetric measurements and near x = 24% in Brillouin scattering measurements is quite close to the theoretically expected transition near x = 25%. See Text.
Therefore, topological constraint theory shows that the rigidity transition in sodium silicate glasses should occur at a composition of x = 25% of Na2O. Modulated-DSC results [70] on these glasses (Figure 4a) performed in 2005 show that the enthalpy of relaxation at the glass transition temperature, ΔHnr, does display a reversibility window in the 18% < x < 23% range of soda, thus defining the intermediate phase. Brillouin light scattering [70] results showed that the elastic energy (Δφ)
of (SiO2)1-x(Na2O)x glasses also displays a sharp change in slope near x = 24%, with the elastic energy Δφ increasing linearly as x > 24%; this feature was identified with the rigidity transition. In Equation (3), C11 and C44 represent the longitudinal and shear elastic constants, and ρ represents the mass density. The three topological phases of stressed–rigid, intermediate, and flexible are illustrated in Figure 4a. There exists a small discrepancy in the rigidity transition predicted at x = 25% and observed near x = 24% in Brillouin scattering, and near x = 23% in the MDSC measurements. In 2005 [70], we were unaware that water impurities and inhomogeneity could lead to a compositional smearing of the rigidity and stress–elastic phase transitions. However, in 2013, a remarkable change occurred when FT-Raman profiling of glasses was introduced [12] to synthesize homogeneous glasses. Today, one recognizes with considerable confidence [34] that the sharpness of the rigidity transition and the stress transition that defines the intermediate phase requires the glasses to be compositionally homogeneous, in which the variance of the atom concentration of a species (E), <Δx>E across the synthesized batch should be 0.1% or less [12]. This requirement is fully consistent with the percolative nature [41] of these two elastic phase transitions. In dry and homogenous glasses, the reversibility window then displays a square-well-like variation characteristic of the sharply defined nature of the rigidity and the stress transitions, as illustrated experimentally in more than a dozen glass systems synthesized [12,69,71] once homogeneous glasses are synthesized. On the other hand, in heterogeneous glasses, one often encounters a more Gaussian-like global minimum in the enthalpy of relaxation ΔHnr(x) (Figure 4a).
Δφ = (1/6)(Δρ/ρ)2 (3C11 − 4C44)
The first example of a square-well-like reversibility window was observed in the GexSe100-x binary [12] glass system in 2013. In this binary glass, the intrinsically flexible Se (r = 2) chains, when cross-linked by the Ge (r = 4) additive, lead the glass to steadily stiffen. If the Ge crosslinks are uniformly distributed across the batch composition, one expects a rigidity transition to occur near x = 20% of Ge and to be sharply defined in terms of composition, as found in Lamb–Mössbauer measurements [12], and separately through enthalpy of relaxation ΔHnr at the glass transition measurements using MDSC experiments [12,14]. The Mössbauer-effect experiments typically made use of a small 100 mg batch size of GexSe100-x glass doped with 1 at. % of 119Sn tracer. Such small-sized batches easily homogenize [12] in less than 6 h when alloyed at 960 °C, as revealed by FT-Raman profiling experiments [12]. In Raman scattering and MDSC measurements, one requires larger-sized batches, however, typically 2 g in size. Such large batches require almost 9 days of alloying at 960 °C to adequately and fully homogenize. The delayed homogenization is directly traced to the super-strong nature of IP melts possessing a low fragility index m = 15 [14,34,54,56,59].
Returning to the case of sodium silicates, the small differences between the predicted and observed rigidity transition from calorimetric and Brillouin light scattering measurements can be traced to the lack of glass homogeneity. In these experiments on sodium silicate glasses, 18 g batches were alloyed at 1500–1650 °C for 4 h [70]. Such large batch sizes pose challenges to homogenize because of the low fragility index of IP melts (m = 15), as discussed above [34]. The ideal isostatically rigid composition (nc = 3), where the glass-forming tendency is optimized, resides near the IP center composition in most cases, where the lowest fragility index is manifested in a square-well-like variation [12] of the enthalpy of relaxation at Tg. As shown earlier in Section 2, the lowest fragility index also possesses the highest glass-forming tendency because of the highest Adam–Gibbs configurational entropy. These results on (SiO2)1-x(Na2O)x permit one to recognize that in the ternary diagram of Figure 3, the pink line drawn separates the composition triangle into the flexible phase and the stressed–rigid phase.
(SiO2)1-x-y(Na2O)x(CaO)y Glasses: Kerner and Phillips [5,74] examined the ring topology in SiO2 glass and compared it to the ring topology of window glass (SiO2)1-x-y(Na2O)x(CaO)y, allowing them to establish the chemical composition of the latter by requiring that each system possess the same ring topology. Thus, for example, in pure SiO2, tetrahedrally coordinated Si bonds to four oxygen near neighbors, which leads to six rings existing around each Si atom. In window glass, (SiO2)1-x-y(Na2O)x(CaO)y, since each Na+ cation is 1-fold coordinated to oxygen, its presence reduces the count of the rings of a base SiO2 glass network to three rings, and since there are two Na atoms in the window glass formula, we expect six rings to form around Si in the glass formula unit. On the other hand, a single Ca2+ cation in SiO2 would be 2-fold coordinated with oxygen and would thus zip two tetrahedra to create a sixfold unit, which would produce 15 rings around it. Thus, in a base SiO2 glass, for each Na2O molecule alloyed, topologically, one reduces six rings, while for each CaO molecule alloyed, one creates nine additional rings. Thus, to keep the count of rings fixed at six in the window glass of (SiO2)1-x-y(Na2O)x(CaO)y stoichiometry, the ratio of x/y = 9/6. The requirement of having 6 rings around each Si atom in window glass leads the chemical composition of window glass to be (SiO2)74(Na2O)16(CaO)10, and this is illustrated in Figure 3 by the blue-filled circle (●). This glass composition is quite close [5] to the composition of window glass. All of the evidence accrued so far strongly suggests that window glass possesses a self-organized network. The presence of the filled blue circle on the pink line corresponding to nc = 3 suggests that the glass composition possesses an IRS and is self-organized. In our opinion, what remains to be demonstrated is to establish the enthalpy of relaxation ΔHnr at Tg in an MDSC experiment and directly confirm that the calorimetric term vanishes.
More recently, Micoulaut [73] and collaborators have performed detailed molecular dynamic simulations on three compositions, x = 6%, 12%, and 18%, of the equimolar soda-lime silicate glass compositions (SiO2)1-2x(Na2O)x(CaO)x. These compositions are designated by the red-filled circles in Figure 3. MD simulations of the soda–lime silicate glasses were undertaken in the NPT ensemble at zero pressure. The systems were first homogenized at elevated temperature prior to a quench to room temperature (300 K). Details of the structural analysis and validation of the model from experimental scattering functions can be found in Ref. [73]. The interaction potential included a two-body potential of Buckingham type [75], and it contains an attractive dispersive term in 1/r6, a Coulombic term, and a repulsive term. From a detailed analysis, they concluded that the composition x = 6% is stressed–rigid, with a constraint number nc in the 3.33 < nc < 3.36 range; the composition x = 12% is nearly isostatically rigid, 3.03 < nc < 3.10; and the x = 16% composition is flexible, with nc in the 2.70 < nc < 2.80 range. The proximity of the red-filled circle at x = 16% to the Kerner–Phillips estimate of the window glass composition shown by the blue-filled circle (●) suggests that both glasses are close to the window glass compositions and are nearly isostatically rigid. Perhaps the most impressive feature of the MD simulations is that the angular variance or second moment σϑ of the bridging oxygen (BO) and Si atoms are rather narrowly defined, with σϑ < 5 degrees (Figure 5), which shows that these species contribute to the bond-bending rigidity of the glass network. On the other hand, both the Ca- and Na-centered bond angle distributions display a large variance, σϑ ~ 30 degrees, underscoring little or no directional bonding (Figure 5). The bond-bending constraints associated with the Ca- and Na-modifiers are thus intrinsically broken.
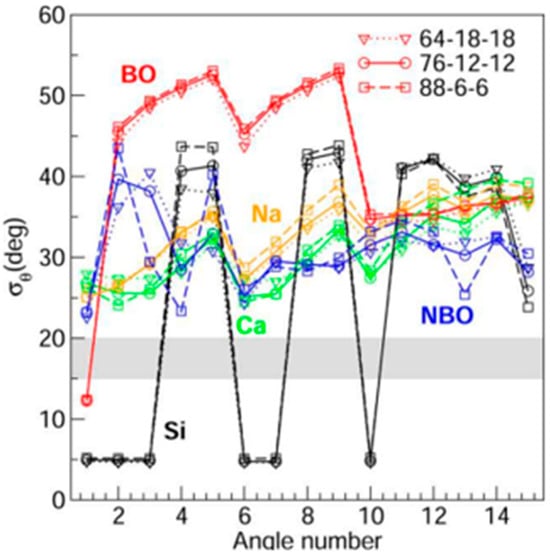
Figure 5.
Second moments σϑ of the species-dependent (Si, BO, NBO, Ca, Na) PBADs as a function of the arbitrary angle number (here, N = 15) for the three glass compositions of interest. See text.
It is well known that glasses are out-of-equilibrium systems and that they display aging. This also applies to numerical glasses investigated from MD simulations. In the present case, we have realized a similar procedure as in experiments, i.e., equilibrated high-temperature liquids were quenched to 300 K before statistical analysis. Typical thermal quantities (density, energy) were found to be constant on average. Nevertheless, such systems exhibited aging effects, i.e., two-time correlation functions will depend on the waiting time tw before the calculation is performed [76]. However, noteworthy is the fact that aging does not modify the short-range structure (i.e., the base silica tetrahedra are preserved under ageing), so MD-derived constraint counting algorithms based on standard deviations can be safely used. In conclusion, for theorists, the first step in understanding the structure of network glasses was finding qualitative improvements on the random network model (Zachariasen, 1932) [77], suggested by diffraction experiments. Because stiffness and stress phase transitions were known, two non-random 5000-atom models were studied: a geometrical one with no small rings, and a physical one with minimized internal stresses [78]. The latter gave two phase transitions and an intermediate phase that is rigid but stress-free, in agreement with the experiment. Meanwhile, a topological model explained the compositions of stiffness transitions in window glass [74] and Pyrex [5]. Recent results with 3000-atom simulations using realistic interatomic forces provide details confirming previous topological models, with an excellent quantitative fit to neutron diffraction data [73].
5. Topology, Dynamical Protein Structure, and Self-Organization
The subject of static protein structures has been studied for decades using powerful tools, especially synchrotron X-ray diffraction [79]. Most protein functions involve dynamical interactions with different structures. This has led to various descriptions of the static or resting structures as folded, and it was suggested that “a protein solves its large global optimization problem as a series of smaller local optimization problems” [80]. Recently, the number-crunching of triangular bits of known protein structures, using an artificial intelligence (AI) system developed by DeepMind, has enabled the prediction of three-dimensional (3D) structures of proteins from amino acid sequences [81]. However, proteins function in an activated (topological saddle point) state different from their minimal energy resting state, and it is unclear how these states can be connected. Many aspects of this problem have been clarified by realizing that both network glasses and proteins are self-organized networks. Moreover, proteins evolve towards phase transitions. As we shall now briefly review, both covalent glass stiffness transitions have recently been identified in the extremely well-studied case of mutations of the spike of the virus responsible for the COVID pandemic. Stiffness is a dynamical property, and for proteins, it has turned out that this property can be quantified through topological shaping effects driven by the water film surrounding the spike. An early way of studying strain effects counted constraints due to interunit connections. Already, this is a task for computers, first undertaken by Michael F. Thorpe and co-workers, initially for glasses and then for proteins [82]. Thorpe et al. studied this process for 26 proteins with a range of architectures and sizes (58–1332 residues). They found many quantitative similarities between proteins and network glasses, concluding that the protein folding transition can be viewed as a flexible to rigid phase transition, like that observed for network glass alloys, as illustrated in Figure 6.
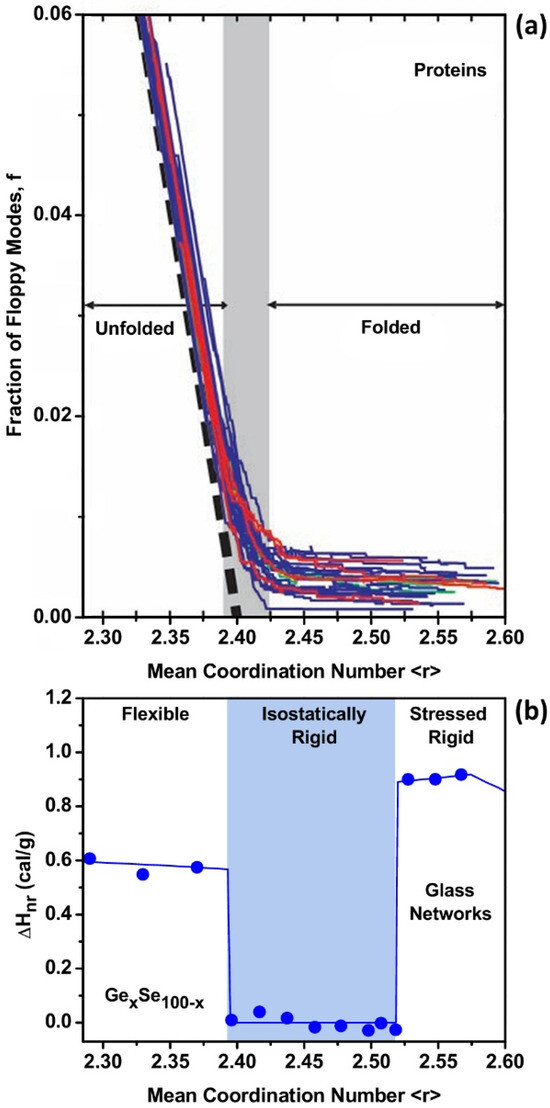
Figure 6.
(a) In proteins, the unfolded (flexible) to folded (isostatically rigid) transition causes the floppy mode fraction in a set of 26 structurally diverse proteins to nearly vanish once the mean coordination number is <r> = 2.41, as the proteins self-organize [82]. (b) The behavior is replicated in GexSe1-x glasses, where one observes a 4a reversibility window [12] defining the rigidity transition near <r> = 2.40 and the stress transition near <r> = 2.52. The observed enthalpy of relaxation ΔHnr(x) at the glass transition derives from floppy modes in the Se-rich flexible glasses and vanishes in the isostatically rigid glasses formed in the 2.40 < <r> < 2.52 range of connectivity <r>. At <r> > 2.52, in the stressed–rigid glasses, some of the GeSe4 tetrahedral bond-angle constraints are partially broken, causing the ΔHnr(x) term to reappear [34].
This transition is shared among diverse proteins ranging from all- to all- folds, and from monomers to tetramers, and it occurs once the protein denatures to a mean coordination <r> of 2.41, which is very similar to the value found in network glasses [2], as illustrated in Figure 6. In Figure 6b, we show that the observed count of floppy modes in a binary chalcogenide glass GexSe100-x displays a sharply defined drop when the glass undergoes a stiffness transition from the flexible phase to the isostatically rigid phase near <r> = 2.40. In Figure 6a [82], we show 26 structurally diverse proteins in which the unfolding to folding transition occurs as <r> exceeds 2.41. The folded state of the proteins and the intermediate phase of glass are both self-organized states of these systems (Figure 6), as illustrated by the near vanishing count in the fraction of floppy modes.
Molecular biologists have found water effects in proteins to be problematic, even with the largest computers. The key variable here is the residues’ Solvent Accessible Surface Areas (SASAs). Ideally, one could quantify the SASA with an amino acid hydrophobicity scale abbreviated as (aa). Over 100 of these have been proposed, but almost all are only qualitative. The sole exception is the MZ scale obtained by two Brazilian physicists, Moret and Zebende (MZ), where the residue was in turn centered in curved segments at a length of L = 2N + 1 long. Averaging > 5000 high-resolution protein segments, their data displayed a surprisingly simple linear behavior of log φ(aa,N) against N for all 20 aa for 4 ≤ N ≤ 17. The slopes here are called fractals [83]. The fact that such a universal correlation is obtained for all 20 aa shows that living proteins have already evolved to be self-organized near second-order phase transitions (Figure 7). The dominant factor in most protein structures is this strong correlation of the SASA with a self-similar protein curvature.
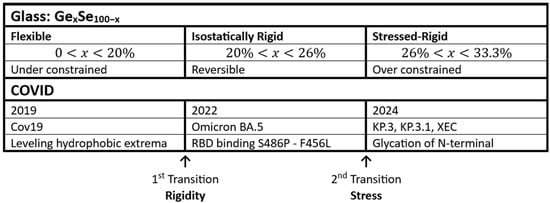
Figure 7.
Parallels between the phase transitions observed in GexSe100-x glasses and COVID.
The rigidity transition observed at x = 0.20 in GexSe100-x glasses parallels the one observed in Cov 19. The common feature between glasses and proteins is, briefly, as follows. The stress transition observed in GexSe100-x glasses parallels the behavior observed in Omicron and BA.5. The unifying aspect of parallel phase transitions is emphasized. While these phase transitions began to be seen in covalent glasses four decades ago, their discovery in proteins, using the Brazilian exact hydrophobicity scale, became possible less than two decades ago. The common features between glasses and proteins are, briefly, as follows. Constraint counting is easiest in predominantly covalent glasses. Protein bonding is predominantly covalent, and it occurs primarily in hydrophobic regions.
Many self-similar geometrical examples of fractals are known (see the fractal Wiki). Because the phase transition concept is so precise, MZ fractals can be used to study protein evolution connected with domain motion. The software used is an EXCEL macro, available from JCP on request. The first covalent glass phase transition to the isostatically rigid phase occurred in 2021 (Figure 7), and it caused the pandemic to end abruptly [84]. By 2024, a few more mutations had been added (Figure 7), and these turned out to include an external constraint, called glycation [85]. This is clearly a first-order phase transition corresponding to the stress transition. These trends show that the topological similarities between constraints in network glasses and proteins may be extremely close (Figure 7).
To summarize, the first model of protein stiffness transitions was a computer model [82]. The specific applications to COVID came later and are evident in [84], which includes references to arXiv papers that date to SARS. The spike (S) protein of SARS-CoV-2, which plays a key role in the receptor recognition and cell membrane fusion process, is long and slender, and it is immersed in water. It contains 1200 amino acids, and 300 of these were mutated between SARS and COVID. This made it easy to identify the shape synchronization effects, which increase contagiousness. Subsequent mutations were fewer, but they always improved the leveling of hydrophobic domain edges, up to Omicron (2022). Abruptly, the hydrophobic mutations switched to the small Receptor Binding Domain. This blocked the cooperative trigenic fusion mechanism, which had made COVID so dangerous.
6. Concluding Remarks
Why some materials form glasses, even when slowly cooled, has been one of the greatest mysteries of science. The first clue emerged in covalent GexSe1-x glasses, where the interatomic forces are short-range, and stretching and angle-bending constraints are countable. The most favorable compositions for glass formation involved matching constraints with degrees of freedom. Modulated-Differential Scanning Calorimetric (MDSC) studies on GexSe1-x chalcogenide glass revealed two elastic phase transitions—a stiffness transition at x = 0.20, and a stress transition at x = 0.26—leading to three topological phases: a flexible phase for compositions below x < 0.20, an intermediate phase in the 0.20 < x < 0.26 range, and a stressed–rigid phase for compositions above x > 0.26. These topological phases (TPs) have now been observed in more than two dozen chalcogenides and modified oxide glasses.
In proteins, the unfolded (flexible phase) to the folded (isostatically rigid intermediate phase) transition is also a stiffness or rigidity transition. In proteins, the counting of constraints is made possible by the shaping effects of water, which can be calculated using the recently discovered hydrophobicity scale, which exhibits self-similar scaling, which is characteristic of second-order phase transitions. The most detailed results of mutations on protein dynamics have been obtained for the pandemic virus because of its rapid and accurately reported evolution. Here, topology and thermodynamics are combined to explain why the pandemic disappeared abruptly [84]. The results described here are far from Euler’s Seven Bridges, yet they are connected by the special way of thinking that topology involves.
Author Contributions
Conceptualization, J.C.P. and P.B.; methodology, J.C.P., P.B. and M.M.; software, J.C.P., P.B. and M.M.; validation, J.C.P., P.B., M.M. and A.W.; formal analysis, J.C.P., P.B., M.M. and A.W.; investigation, J.C.P., P.B., M.M. and A.W.; resources, J.C.P., P.B., M.M. and A.W.; data curation, J.C.P., P.B., M.M. and A.W.; writing—original draft preparation, J.C.P., P.B., M.M. and A.W.; writing—review and editing, J.C.P., P.B., M.M. and A.W.; visualization, J.C.P., P.B., M.M. and A.W.; supervision, J.C.P. and P.B.; project administration, J.C.P. and P.B.; funding acquisition, P.B. All authors have read and agreed to the published version of the manuscript.
Funding
This research was funded by US National Science Foundation grant DMR 08-53957. Matthieu Micoulaut acknowledges support from Chaire d’Excellence Sorbonne Universi-té—Universidad Autónoma de Mexico, and from Fondation MAIF pour la recherche. M.M. acknowledges continuous support from CNRS and Sorbonne Université.
Institutional Review Board Statement
Not applicable.
Informed Consent Statement
Not applicable.
Data Availability Statement
The data presented in this study are available on request from the corresponding author.
Conflicts of Interest
The authors declare no conflict of interest.
References
- Topology. Wikipedia. 2 January 2025. Available online: https://en.wikipedia.org/w/index.php?title=Topology&oldid=1266885386 (accessed on 3 January 2025).
- Boolchand, P.; Georgiev, D.G.; Goodman, B. Discovery of the intermediate phase in chalcogenide glasses. J. Optoelectron. Adv. Mater. 2001, 3, 703–720. [Google Scholar]
- Rigidity Theory (Physics). Wikipedia. 16 July 2024. Available online: https://en.wikipedia.org/w/index.php?title=Rigidity_theory_(physics)&oldid=1234898467 (accessed on 3 January 2025).
- Phillips, J.C. Topology of covalent non-crystalline solids I: Short-range order in chalcogenide alloys. J. Non-Cryst. Solids 1979, 34, 153–181. [Google Scholar] [CrossRef]
- Phillips, J.C.; Kerner, R. Structure and function of window glass and Pyrex. J. Chem. Phys. 2008, 128, 174506. [Google Scholar] [CrossRef]
- Micoulaut, M. Topological ordering during flexible to rigid transitions in disordered networks. Comptes Rendus Phys. 2023, 24, 133–154. [Google Scholar] [CrossRef]
- Mauro, J.C. Topological constraint theory of glass. Am. Ceram. Soc. Bull. 2011, 90, 7. [Google Scholar]
- Feng, X.; Bresser, W.J.; Boolchand, P. Direct Evidence for Stiffness Threshold in Chalcogenide Glasses. Phys. Rev. Lett. 1997, 78, 4422–4425. [Google Scholar] [CrossRef]
- Thomas, L. Modulated DSC Technology; T.A. Instruments: New Castle, DE, USA, 2005; Chapters 1–9. [Google Scholar]
- Thomas, L.C.; Instruments, T.; Drive, L.; Castle, N. Modulated DSC® Paper #3 Modulated DSC® Basics; Optimization of MDSC® Experimental Conditions; T.A. Instruments: New Castle, DE, USA, 2005; p. 10. [Google Scholar]
- Thomas, L.C. Modulated DSC® Paper #5 Measurement of Glass Transitions and Enthalpic Recovery; white paper 5; TA Instruments: New Castle, DE, USA, 2005; Available online: http://www.tainstruments.com/pdf/literature/TP_010_MDSC_num_5_Measurement_of_Glass_Transition_and_Enthalpic_Recovery.pdf (accessed on 21 August 2025).
- Bhosle, S.; Gunasekera, K.; Boolchand, P.; Micoulaut, M. Melt Homogenization and Self-Organization in Chalcogenides-Part II. Int. J. Appl. Glass Sci. 2012, 3, 205–220. [Google Scholar] [CrossRef]
- Bhosle, S.V. Direct Evidence for Abrupt Rigidity and Stress Transitions in Dry and Homogeneous Bulk GexSe100-x Glasses. Master’s Thesis, University of Cincinnati, Cincinnati, OH, USA, 2011. Available online: https://etd.ohiolink.edu/acprod/odb_etd/etd/r/1501/10?clear=10&p10_accession_num=ucin1307106143 (accessed on 23 June 2021).
- Gunasekara, K. Fragility, Melt/Glass Homogenization, Self-Organization in Chalcogenide Alloy Systems. Ph.D. Thesis, University of Cincinnati, Cincinnati, OH, USA, 2013. Available online: https://etd.ohiolink.edu/acprod/odb_etd/etd/r/1501/10?clear=10&p10_accession_num=ucin1382372615 (accessed on 23 June 2021).
- Barré, J.; Bishop, A.R.; Lookman, T.; Saxena, A. Adaptability and “Intermediate Phase” in Randomly Connected Networks. Phys. Rev. Lett. 2005, 94, 208701. [Google Scholar] [CrossRef]
- Mousseau, N.; Drabold, D.A. Numerical studies of the vibrational isocoordinate rule in chalcogenide glasses. Eur. Phys. J. B-Condens. Matter Complex Syst. 2000, 17, 667–671. [Google Scholar] [CrossRef][Green Version]
- Chubynsky, M.V.; Brière, M.-A.; Mousseau, N. Self-organization with equilibration: A model for the intermediate phase in rigidity percolation. Phys. Rev. E 2006, 74, 016116. [Google Scholar] [CrossRef][Green Version]
- Yan, L. Entropy favors heterogeneous structures of networks near the rigidity threshold. Nat. Commun. 2018, 9, 1359. [Google Scholar] [CrossRef]
- Kirchner, K.A.; Mauro, J.C. Statistical Mechanical Model of the Self-Organized Intermediate Phase in Glass-Forming Systems With Adaptable Network Topologies. Front. Mater. 2019, 6, 11. [Google Scholar] [CrossRef]
- Kirchner, K.A.; Bødker, M.S.; Smedskjaer, M.M.; Kim, S.H.; Mauro, J.C. Statistical Mechanical Model of Topological Fluctuations and the Intermediate Phase in Binary Phosphate Glasses. J. Phys. Chem. B 2019, 123, 7640–7648. [Google Scholar] [CrossRef] [PubMed]
- Nordell, B.J.; Nguyen, T.D.; Caruso, A.N.; Lanford, W.A.; Henry, P.; Li, H.; Ross, L.L.; King, S.W.; Paquette, M.M. Topological Constraint Theory Analysis of Rigidity Transition in Highly Coordinate Amorphous Hydrogenated Boron Carbide. Front. Mater. 2019, 6, 264. [Google Scholar] [CrossRef]
- Toledo-Marín, J.Q.; Yan, L. Competition Between Entropy and Energy in Network Glass: The Hidden Connection Between Intermediate Phase and Liquid-Liquid Transition. Front. Mater. 2019, 6, 196. [Google Scholar] [CrossRef]
- Brière, M.-A.; Chubynsky, M.V.; Mousseau, N. Self-organized criticality in the intermediate phase of rigidity percolation. Phys. Rev. E 2007, 75, 056108. [Google Scholar] [CrossRef]
- Jacobs, D.J.; Thorpe, M.F. Generic Rigidity Percolation: The Pebble Game. Phys. Rev. Lett. 1995, 75, 4051–4054. [Google Scholar] [CrossRef] [PubMed]
- Moukarzel, C.F. Two rigidity-percolation transitions on binary Bethe networks and the intermediate phase in glass. Phys. Rev. E 2013, 88, 062121. [Google Scholar] [CrossRef][Green Version]
- Yildirim, C.; Raty, J.-Y.; Micoulaut, M. Revealing the role of molecular rigidity on the fragility evolution of glass-forming liquids. Nat. Commun. 2016, 7, 11086. [Google Scholar] [CrossRef]
- Mohanty, C. Direct Evidence for Topological Phases in Sodium Phosphate Glasses from Raman Scattering, Infrared Reflectance and Modulated DSC. Master’s Thesis, University of Cincinnati, Cincinnati, OH, USA, 2018, (unpublished). [Google Scholar]
- Mauro, J.C.; Yue, Y.; Ellison, A.J.; Gupta, P.K.; Allan, D.C. Viscosity of glass-forming liquids. Proc. Natl. Acad. Sci. USA 2009, 106, 19780–19784. [Google Scholar] [CrossRef]
- Williams, M.L.; Landel, R.F.; Ferry, J.D. The Temperature Dependence of Relaxation Mechanisms in Amorphous Polymers and Other Glass-forming Liquids. J. Am. Chem. Soc. 1955, 77, 3701–3707. [Google Scholar] [CrossRef]
- Novikov, V.N.; Sokolov, A.P. Poisson’s ratio and the fragility of glass-forming liquids. Nature 2004, 431, 7011. [Google Scholar] [CrossRef] [PubMed]
- Ryu, C.W.; Egami, T. Origin of liquid fragility. Phys. Rev. E 2020, 102, 042615. [Google Scholar] [CrossRef] [PubMed]
- Debenedetti, P.G.; Stillinger, F.H. Supercooled liquids and the glass transition. Nature 2001, 410, 259–267. [Google Scholar] [CrossRef] [PubMed]
- Bendert, J.C.; Gangopadhyay, A.K.; Mauro, N.A.; Kelton, K.F. Volume Expansion Measurements in Metallic Liquids and Their Relation to Fragility and Glass Forming Ability: An Energy Landscape Interpretation. Phys. Rev. Lett. 2012, 109, 185901. [Google Scholar] [CrossRef]
- Boolchand, P.; Dash, S.; Welton, A. Understanding the molecular origin of aging in the three topological phases of network glasses. Philos. Mag. 2024, 104, 977–1010. [Google Scholar] [CrossRef]
- Senapati, U.; Varshneya, A.K. Viscosity of chalcogenide glass-forming liquids: An anomaly in the ‘strong’ and ‘fragile’ classification. J. Non-Cryst. Solids 1996, 197, 210–218. [Google Scholar] [CrossRef]
- Böhmer, R.; Angell, C.A. Correlations of the nonexponentiality and state dependence of mechanical relaxations with bond connectivity in Ge-As-Se supercooled liquids. Phys. Rev. B 1992, 45, 10091–10094. [Google Scholar] [CrossRef]
- Tatsumisago, M.; Halfpap, B.L.; Green, J.L.; Lindsay, S.M.; Angell, C.A. Fragility of Ge-As-Se glass-forming liquids in relation to rigidity percolation, and the Kauzmann paradox. Phys. Rev. Lett. 1990, 64, 1549–1552. [Google Scholar] [CrossRef]
- Yang, G.; Gueguen, Y.; Sangleboeuf, J.-C.; Rouxel, T.; Boussard-Plédel, C.; Troles, J.; Lucas, P.; Bureau, B. Physical properties of the GexSe1−x glasses in the 0. J. Non-Cryst. Solids 2013, 377, 54–59. [Google Scholar] [CrossRef]
- Zhao, H.Y.; Koh, Y.P.; Pyda, M.; Sen, S.; Simon, S.L. The kinetics of the glass transition and physical aging in germanium selenide glasses. J. Non-Cryst. Solids 2013, 368, 63–70. [Google Scholar] [CrossRef]
- Zeidler, A.; Salmon, P.S.; Whittaker, D.A.J.; Pizzey, K.J.; Hannon, A.C. Topological Ordering and Viscosity in the Glass-Forming Ge–Se System: The Search for a Structural or Dynamical Signature of the Intermediate Phase. Front. Mater. 2017, 4, 32. [Google Scholar] [CrossRef]
- Thorpe, M.F. Rigidity percolation in glassy structures. J. Non-Cryst. Solids 1985, 76, 109–116. [Google Scholar] [CrossRef]
- Feng, X. Physical nature of stiffness transition in glassy networks. Master’s Thesis, University of Cincinnati, Cincinnati, OH, USA, 1997. [Google Scholar]
- Murase, K.; Fukunaga, T. Optical Effects in Amorphous Semiconductors; American Institute of Physics: New York, NY, USA, 1984; p. 120. [Google Scholar]
- Murase, K.; Fukunaga, T. Percolation Transition and Accumulation of Strain in Chalcogenide Glasses. MRS Online Proc. Libr. OPL 1985, 61, 101. [Google Scholar] [CrossRef]
- Wang, F. Self-Organization and Stress in Network Glasses. Ph.D. Thesis, University of Cincinnati, Cincinnati, OH, USA, 2005. Available online: https://etd.ohiolink.edu/acprod/odb_etd/etd/r/1501/10?clear=10&p10_accession_num=ucin1105424948 (accessed on 26 August 2025).
- Zhu, E.; Liu, Y.; Sun, X.; Yin, G.; Jiao, Q.; Dai, S.; Lin, C. Correlation between thermo-mechanical properties and network structure in GexS100–x chalcogenide glasses. J. Non-Cryst. Solids X 2019, 1, 100015. [Google Scholar] [CrossRef]
- Kawamoto, Y.; Tsuchihashi, S. Properties and Structure of Glasses in the System Ge-S. J. Am. Ceram. Soc. 1971, 54, 131–135. [Google Scholar] [CrossRef]
- Kawamoto, Y.; Tsuchihashi, S. Thermal Analysis of Ge-S Glasses. J. Am. Ceram. Soc. 1971, 54, 526–527. [Google Scholar] [CrossRef]
- Hrubý, A. Glass-forming tendency in the GeSx system. Czechoslov. J. Phys. B 1973, 23, 1263–1272. [Google Scholar] [CrossRef]
- Bychkov, E.; Miloshova, M.; Price, D.L.; Benmore, C.J.; Lorriaux, A. Short, intermediate and mesoscopic range order in sulfur-rich binary glasses. J. Non-Cryst. Solids 2006, 352, 63–70. [Google Scholar] [CrossRef]
- Saffarini, G. On topological transitions and chemical ordering in network glasses of the Ge-Ga-S system. Solid State Commun. 1994, 91, 577–580. [Google Scholar] [CrossRef]
- Chakraborty, S. Topological Origin of Glass Formation, Rigidity and Stress Transitions, Conductivity and Fragility in Specially Homogeneous Heavy Metal Oxide and Chalcogenide Systems. Ph.D. Thesis, University of Cincinnati, Cincinnati, OH, USA, 2014. Available online: https://etd.ohiolink.edu/acprod/odb_etd/etd/r/1501/10?clear=10&p10_accession_num=ucin1393237827 (accessed on 26 August 2025).
- Adam, G.; Gibbs, J.H. On the Temperature Dependence of Cooperative Relaxation Properties in Glass-Forming Liquids. J. Chem. Phys. 1965, 43, 139–146. [Google Scholar] [CrossRef]
- Chakravarty, S.; Chbeir, R.; Chen, P.; Micoulaut, M.; Boolchand, P. Correlating Melt Dynamics and Configurational Entropy Change With Topological Phases of AsxS100-xGlasses and the Crucial Role of Melt/Glass Homogenization. Front. Mater. 2019, 6, 166. [Google Scholar] [CrossRef]
- Chakravarty, S. Correlating Melt Dynamics and Configurational Entropy Change with Topological Phases of AsxS100-x Glasses and the Crucial Role of Melt/Glass Homogenization. Ph.D. Thesis, University of Cincinnati, Cincinnati, OH, USA, 2021. Available online: https://etd.ohiolink.edu/acprod/odb_etd/etd/r/1501/10?clear=10&p10_accession_num=ucin1623241710778164 (accessed on 18 August 2025).
- Welton, A.; Chbeir, R.; McDonald, M.; Burger, M.; Almutairi, B.S.; Chakravarty, S.; Boolchand, P. Unusual Role of P–P Bonds on Melt Dynamics and Topological Phases of the Equimolar GexPxSe100−2x Glass System. J. Phys. Chem. C 2020, 124, 25087–25106. [Google Scholar] [CrossRef]
- Chbeir, R.; Bauchy, M.; Micoulaut, M.; Boolchand, P. Evidence for a Correlation of Melt Fragility Index With Topological Phases of Multicomponent Glasses. Front. Mater. 2019, 6, 173. [Google Scholar] [CrossRef]
- Chbeir, R. Correlating Melt Dynamics with Topological Phases of Homogeneous Chalcogenide- and Modified Oxide- Glasses Using Raman Scattering, Infra-Red Spectroscopy, Modulated-Differential Scanning Calorimetry and Volumetric Experiments. Ph.D. Thesis, University of Cincinnati, Cincinnati, OH, USA, 2019. Available online: https://etd.ohiolink.edu/acprod/odb_etd/etd/r/1501/10?clear=10&p10_accession_num=ucin1573224465185235 (accessed on 18 August 2025).
- Almutairi, B.S. Correlating Melt Dynamics with Glass Topological Phases in Especially Homogenized Equimolar GexAsxS100-2x Glasses using Raman Scattering, Modulated- Differential Scanning Calorimetry and Volumetric Experiments. Ph.D. Thesis, University of Cincinnati, Cincinnati, OH, USA, 2020. Available online: https://etd.ohiolink.edu/acprod/odb_etd/etd/r/1501/10?clear=10&p10_accession_num=ucin1593272974284834 (accessed on 18 August 2025).
- Burger, M.; Welton, A.; McDonald, M.; Chbeir, R.; Chakravarty, S.; Almutairi, B.S.; Mamedov, S.; Boolchand, P. Evidence for 3-D network of P-centered pyramidal P(Se1/2)3 and quasi-tetrahedral SeP(Se1/2)3 local structures and their 3-membered ring super structure counterparts decoupled from quasi 1D- ethylene-like P2Se2+x (x = 2,1,0) chains in PxSe100−x glasses. J. Alloys Compd. 2022, 895, 162645. [Google Scholar] [CrossRef]
- Burger, M.S. Evidence for the 3-D network of P-centered Pyramidal P(Se1/2)3 and Quasi-tetrahedral Se=P(Se1/2)3 Local Structures and their 3-membered Ring Counterparts Decoupled from the Quasi-1-D Ethylene-like P2Se2+x (x = 2,1,0) Chains in Bulk PxSe100-x Glasses. Master’s Thesis, University of Cincinnati, Cincinnati, OH, USA, 2021. Available online: https://etd.ohiolink.edu/acprod/odb_etd/etd/r/1501/10?clear=10&p10_accession_num=ucin1627664642854937 (accessed on 18 August 2025).
- Vignarooban, K.; Skipper, C.; Welton, A.; Boolchand, P. Linking the ring-morphology of (Li2O)x(B2O3)100-x and (Na2O)x(B2O3)100-x borate glasses with topological phases and melt dynamics. J. Non-Cryst. Solids 2025, 654, 123450. [Google Scholar] [CrossRef]
- Novita, D.I. Evidence for Intermediate Phase in Solid Electrolyte Glasses. Ph.D. Thesis, University of Cincinnati, Cincinnati, OH, USA, 2009. Available online: https://etd.ohiolink.edu/acprod/odb_etd/etd/r/1501/10?clear=10&p10_accession_num=ucin1234751813 (accessed on 29 February 2020).
- Novita, D.I.; Boolchand, P.; Malki, M.; Micoulaut, M. Fast-Ion Conduction and Flexibility of Glassy Networks. Phys. Rev. Lett. 2007, 98, 195501. [Google Scholar] [CrossRef] [PubMed]
- What Happened to the Original iPhone’s Plastic Screen? The Verge. Available online: https://www.theverge.com/2019/7/9/20687299/plastic-iphone-gorilla-glass-origin-story-steve-jobs (accessed on 3 January 2025).
- Gorilla Glass. Wikipedia. 9 December 2024. Available online: https://en.wikipedia.org/w/index.php?title=Gorilla_Glass&oldid=1262089054 (accessed on 3 January 2025).
- Mauro, J.C.; Ellison, A.J.; Allan, D.C.; Smedskjaer, M.M. Topological Model for the Viscosity of Multicomponent Glass-Forming Liquids. Int. J. Appl. Glass Sci. 2013, 4, 408–413. [Google Scholar] [CrossRef]
- Cristallo. Wikipedia. 12 November 2024. Available online: https://en.wikipedia.org/w/index.php?title=Cristallo&oldid=1257012919 (accessed on 11 February 2025).
- Chbeir, R.; Welton, A.; Burger, M.; Chakravarty, S.; Dash, S.; Bhosle, S.; Gunasekera, K.; Almutairi, B.S.; Goodman, B.; Micoulaut, M.; et al. Glass transition, topology, and elastic models of Se-based glasses. J. Am. Ceram. Soc. 2023, 106, jace.19003. [Google Scholar] [CrossRef]
- Vaills, Y.; Qu, T.; Micoulaut, M.; Chaimbault, F.; Boolchand, P. Direct evidence of rigidity loss and self-organization in silicate glasses. J. Phys. Condens. Matter 2005, 17, 4889–4896. [Google Scholar] [CrossRef]
- Vignarooban, K. Boson Mode, Dimensional Crossover, Medium Range Structure and Intermediate Phase in Lithium-and Sodium-Borate Glasses. Ph.D. Thesis, University of Cincinnati, Cincinnati, OH, USA, 2012. [Google Scholar]
- Skipper, C. Melt Dynamics Correlated with Glass Topological Phases in dry Li- and Na- Borates. Master’s Thesis, University of Cincinnati, Cincinnati, OH, USA, 2019. Available online: https://etd.ohiolink.edu/acprod/odb_etd/etd/r/1501/10?clear=10&p10_accession_num=ucin1562672753116725 (accessed on 24 February 2020).
- Laurent, O.; Mantisi, B.; Micoulaut, M. Structure and Topology of Soda-Lime Silicate Glasses: Implications for Window Glass. J. Phys. Chem. B 2014, 118, 12750–12762. [Google Scholar] [CrossRef] [PubMed]
- Kerner, R.; Phillips, J.C. Quantitative principles of silicate glass chemistry. Solid State Commun. 2000, 117, 47–51. [Google Scholar] [CrossRef]
- Xiang, Y.; Du, J. Effect of Strontium Substitution on the Structure of 45S5 Bioglasses. Chem. Mater. 2011, 23, 2703–2717. [Google Scholar] [CrossRef]
- Micoulaut, M. Relaxation and physical aging in network glasses: A review. Rep. Prog. Phys. 2016, 79, 066504. [Google Scholar] [CrossRef] [PubMed]
- Zachariasen, W.H. The Atomic Arrangement in Glass. J. Am. Chem. Soc. 1932, 54, 3841–3851. [Google Scholar] [CrossRef]
- Thorpe, M.F.; Jacobs, D.J.; Chubynsky, M.V.; Phillips, J.C. Self-organization in network glasses. J. Non-Cryst. Solids 2000, 266–269, 859–866. [Google Scholar] [CrossRef]
- Hendrickson, W.A. Synchrotron crystallography. Trends Biochem. Sci. 2000, 25, 637–643. [Google Scholar] [CrossRef]
- Dill, K.A.; Ozkan, S.B.; Shell, M.S.; Weikl, T.R. The Protein Folding Problem. Annu. Rev. Biophys. 2008, 37, 289–316. [Google Scholar] [CrossRef] [PubMed]
- Yang, Z.; Zeng, X.; Zhao, Y.; Chen, R. AlphaFold2 and its applications in the fields of biology and medicine. Signal Transduct. Target. Ther. 2023, 8, 115. [Google Scholar] [CrossRef]
- Rader, A.J.; Hespenheide, B.M.; Kuhn, L.A.; Thorpe, M.F. Protein unfolding: Rigidity lost. Proc. Natl. Acad. Sci. USA 2002, 99, 3540–3545. [Google Scholar] [CrossRef]
- Phillips, J.C. Fractals and self-organized criticality in proteins. Phys. A Stat. Mech. Its Appl. 2014, 415, 440–448. [Google Scholar] [CrossRef]
- Moret, M.A.; Phillips, J.C. Why and how did the COVID pandemic end abruptly? Eur. Phys. J. B 2024, 97, 123. [Google Scholar] [CrossRef]
- Liu, J.; Yu, Y.; Jian, F.; Yang, S.; Song, W.; Wang, P.; Yu, L.; Shao, F.; Cao, Y. Enhanced immune evasion of SARS-CoV-2 variants KP.3.1.1 and XEC through N-terminal domain mutations. Lancet Infect. Dis. 2025, 25, e6–e7. [Google Scholar] [CrossRef] [PubMed]


Disclaimer/Publisher’s Note: The statements, opinions and data contained in all publications are solely those of the individual author(s) and contributor(s) and not of MDPI and/or the editor(s). MDPI and/or the editor(s) disclaim responsibility for any injury to people or property resulting from any ideas, methods, instructions or products referred to in the content. |
© 2025 by the authors. Licensee MDPI, Basel, Switzerland. This article is an open access article distributed under the terms and conditions of the Creative Commons Attribution (CC BY) license (https://creativecommons.org/licenses/by/4.0/).