1. Introduction
Topological data analysis (TDA) has emerged as a transformative framework for studying the shape and structure of complex datasets, particularly in biological contexts where high-dimensional, noisy, and incomplete data are prevalent [
1]. Unlike traditional statistical methods that often focus on local or linear structures, TDA offers a global perspective by capturing the intrinsic geometric and topological properties of data. This unique ability makes it especially valuable in fields such as systems biology and network science, where understanding the relationships between entities—such as proteins in PPI networks—is critical for uncovering functional and structural insights.
A cornerstone of TDA is persistent homology, a mathematical tool rooted in algebraic topology that enables the analysis of data at multiple scales [
2,
3]. Persistent homology identifies robust topological features, including connected components, loops, and voids, which are characterized by their “birth” and “death” across varying scales. These features provide a quantitative description of the underlying data’s shape and stability, offering a deeper understanding of its structural organization. Visualization tools such as persistent diagrams and barcodes facilitate the interpretation of these features, revealing patterns that might remain obscured using conventional statistical techniques [
4].
In this work, we apply persistent homology to PPI networks, which represent physical interactions between proteins within a cell. These networks are fundamental to understanding cellular functions, signaling pathways, and disease mechanisms [
5]. Analyzing the topology of PPI networks can reveal critical proteins (hubs), functional modules, and the network’s overall robustness, all of which are essential for drug discovery and systems biology research [
6]. By leveraging TDA, we aim to uncover hidden structural and functional properties of PPI networks that traditional graph-theoretic approaches may overlook.
To achieve a comprehensive understanding of PPI network topology and robustness, we integrate persistent homology with algebraic connectivity. Algebraic connectivity, derived from the second smallest eigenvalue of the Laplacian matrix of a graph, quantifies the network’s overall connectedness and resilience to perturbations such as node or edge removal [
7]. By correlating topological features identified through persistent homology with algebraic connectivity metrics, we gain a multi-faceted view of the network’s structure and stability. This combined approach bridges the gap between topological and spectral graph theory, providing novel insights into the interplay between network topology and function.
Our methodology begins with the construction of simplicial complexes from PPI networks, typically using the Vietoris–Rips complex. In this framework, simplices represent higher-order interactions among proteins, allowing us to capture more nuanced relational structures beyond pairwise interactions [
3]. We then compute persistent homology to identify significant topological features across different interaction thresholds. By analyzing these features alongside algebraic connectivity measures, we can detect structural vulnerabilities such as fragile subnetworks and functional clusters such as densely connected protein communities.
The results of this study are expected to advance our understanding of PPI network dynamics, identify potential biomarkers, and suggest therapeutic targets for intervention. Furthermore, the integration of TDA with algebraic connectivity offers a versatile framework that can be generalized to other biological networks, such as gene regulatory networks and metabolic networks. This approach not only enhances our ability to analyze complex biological systems but also provides a foundation for addressing broader challenges in network science and computational biology.
2. Mathematical Foundations of Persistent Homology
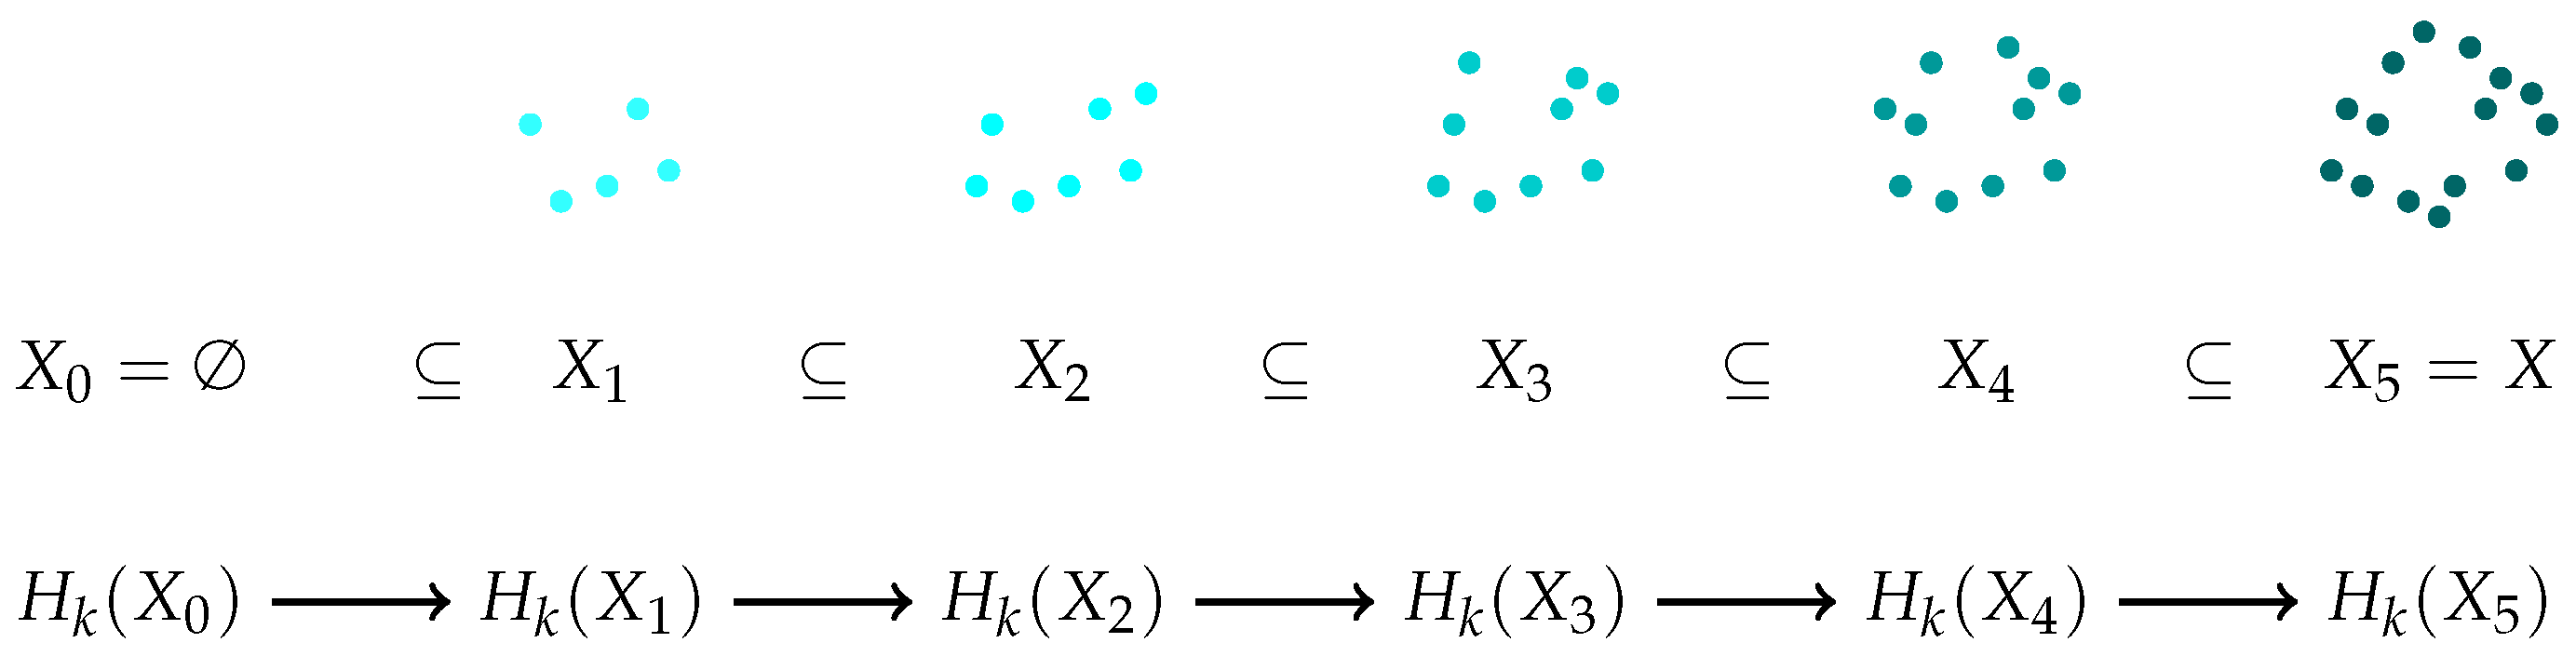
Persistent homology is based on the concept of a
filtration, which is a nested sequence of topological spaces:
This sequence typically arises from data, where each space () represents the structure of the data at a particular scale or threshold. Filtrations can be constructed in various ways, such as Vietoris–Rips complexes, Čech complexes, or sublevel sets of a scalar function.
For each space (), we compute its homology groups (), which capture topological features across different dimensions:
These homology groups are typically computed over a field, such as , also known as the finite field with two elements (0 and 1), to simplify calculations. Over , homology groups can have complicated torsion subgroups (elements of finite order). Working over a field, especially for a prime p, eliminates torsion-related issues because all modules over a field are vector spaces, which are simpler to handle.
As the filtration progresses, topological features are born (appear) and die (disappear). Persistent homology tracks these features across the filtration, recording their birth and death indices, which correspond to the scales at which the features emerge and vanish.
The output of persistent homology is a persistence diagram, which is a multiset of points in plane . Each point represents a topological feature:
The persistence of a feature is given by , which measures its lifespan within the filtration. Features with long persistence are typically considered to reflect meaningful topological structures in the data, while those with short persistence may be attributed to noise.
Mathematically, persistent homology can be formalized using the language of algebraic topology and category theory. A filtration induces a sequence of homology groups connected by homomorphisms:
These maps allow us to track the evolution of homology classes across the filtration. The structure of persistent homology can be described using persistence modules, which are sequences of vector spaces connected by linear maps. The classification of these modules leads to the representation of persistent homology as barcodes or persistence diagrams.
An alternative visualization is the barcode, where each feature is represented by a horizontal line spanning its birth and death indices. Barcodes and persistence diagrams provide complementary perspectives on the topological features present in the data.
Persistent homology has broad applications in data analysis, including shape recognition, sensor networks, image processing, and biological data analysis. Its robustness to noise and invariance under continuous transformations make it a powerful tool in topological data analysis.
Figure 1 illustrates such a filtration using colored clouds of dots, where each color represents a step in the filtration process. The top row of the diagram shows how the space grows, while the bottom row represents the evolution of homology (
2).
3. Protein–Protein Interaction Networks
Protein–protein interaction networks are fundamental constructs in systems biology, providing a framework for understanding the intricate web of physical interactions between proteins within a cell. These networks can be mathematically represented as graphs:
, where
V denotes the set of proteins (nodes) and
E represents the interactions (edges) between them [
8]. PPI networks serve as a cornerstone for deciphering cellular processes, as they encapsulate how proteins collaborate to execute essential biological functions such as in signal transduction, metabolic pathways, and regulatory mechanisms.
The study of PPI networks has evolved significantly over the past few decades, driven by advances in experimental techniques and computational methodologies. Early work in this field laid the groundwork for understanding the modular organization of PPI networks. For instance, seminal studies by Hartwell et al. [
9] introduced the concept of “modules” as functional units within biological networks, emphasizing the importance of densely connected subgraphs that correspond to protein complexes or functional pathways. This modular architecture has since been corroborated by numerous studies, which have demonstrated that PPI networks exhibit scale-free properties, characterized by a small number of highly connected hub proteins and a large number of sparsely connected nodes [
6].
Hub proteins, which are central to many interactions, play a pivotal role in maintaining the structural and functional integrity of PPI networks. The removal of these hubs often leads to significant disruptions in network functionality, underscoring their critical importance in biological processes [
10]. This observation has profound implications for understanding disease mechanisms, as mutations and dysregulation of hub proteins are frequently associated with pathological conditions, including cancer and neurodegenerative disorders [
11].
Recent years have witnessed a surge in computational methods aimed at addressing the inherent complexity of PPI networks. These networks are typically large, comprising thousands of nodes and edges, and are prone to noise due to false-positive interactions arising from experimental limitations [
12]. To overcome these challenges, researchers have developed sophisticated algorithms for predicting interactions, filtering out noise, and identifying functional modules. Clustering algorithms, such as Markov Clustering (MCL) and spectral clustering, have proven effective in detecting densely connected regions within PPI networks [
13]. Machine learning techniques, including supervised and unsupervised learning, have also been employed to predict novel interactions and classify proteins based on their functional roles [
14].
Network-based approaches, such as Flux Balance Analysis (FBA), have further enriched our understanding of PPI networks by integrating metabolic data into network models. FBA evaluates the flow of metabolites through a network, providing insights into the robustness and stability of metabolic pathways. A key metric in this context is algebraic connectivity, which quantifies the structural stability of a network [
8]. Recent studies have demonstrated that metabolic networks depend on specific key reactions to maintain functional integrity, revealing potential weak points that could be targeted for therapeutic intervention [
8]. This interplay between network topology and metabolic function highlights the importance of PPI networks in bridging structural and functional analyses.
The robustness of PPI networks—a measure of their ability to withstand perturbations—has emerged as a central theme in biological research. Robustness is closely tied to the network’s topological properties, such as degree distribution, clustering coefficient, and modularity [
15]. For example, the presence of redundant pathways and alternative routes in PPI networks enhances their resilience to random failures or targeted attacks. This redundancy is particularly evident in metabolic networks, where flux redistribution can compensate for the loss of specific reactions [
16].
In addition to robustness, the application of PPI networks in drug discovery has gained significant attention. By identifying hub proteins and critical interactions, researchers can pinpoint potential drug targets that disrupt disease-associated pathways while minimizing off-target effects [
17]. Furthermore, the integration of PPI data with omics technologies, such as transcriptomics and proteomics, has enabled a more comprehensive understanding of cellular dynamics and disease mechanisms [
18].
Protein–protein interaction networks are graphs: , where V is the set of proteins (nodes) and E is the set of interactions (edges). These networks play a crucial role in understanding cellular processes, as they represent the physical interactions between proteins. The topology of PPI networks is often characterized by the presence of functional modules or protein complexes, which correspond to densely connected subgraphs.
PPI networks are essential for studying the functional organization of the cell. They provide insights into how proteins work together to perform biological functions, such as in signal transduction, metabolic pathways, and regulatory mechanisms. By analyzing these networks, researchers can identify key proteins that are central to many interactions, often referred to as “hubs”. These hub proteins are critical for maintaining the integrity and functionality of the network.
One of the challenges in studying PPI networks is their inherent complexity. The networks are often large, with thousands of nodes and edges, and they can be noisy due to false-positive interactions. To address these challenges, various computational methods have been developed to predict interactions, filter out noise, and identify functional modules. These methods include clustering algorithms, machine learning techniques, and network-based approaches.
3.1. Applications of PPI Networks
PPI networks have a wide range of applications in bioinformatics and systems biology. They are used to predict protein function, identify drug targets, and understand disease mechanisms. For example, by comparing PPI networks of healthy and diseased tissues, researchers can identify proteins that are differentially expressed or interact differently in disease states. These proteins can then be targeted for therapeutic intervention.
Another important application of PPI networks is in the study of evolutionary biology. By comparing PPI networks across different species, researchers can gain insights into the conservation of protein interactions and the evolution of cellular processes. This comparative analysis can reveal how proteins and their interactions have evolved over time and how they contribute to the diversity of life.
PPI networks serve as powerful tools for elucidating the complex interactions among proteins within a cell. They offer a valuable framework for exploring the functional organization of cellular systems and hold wide-ranging applications in biomedical research. With ongoing advancements in computational methodologies, the capacity to analyze and interpret these networks is steadily increasing, paving the way for novel insights and breakthroughs in systems biology.
3.2. Example of a PPI Network
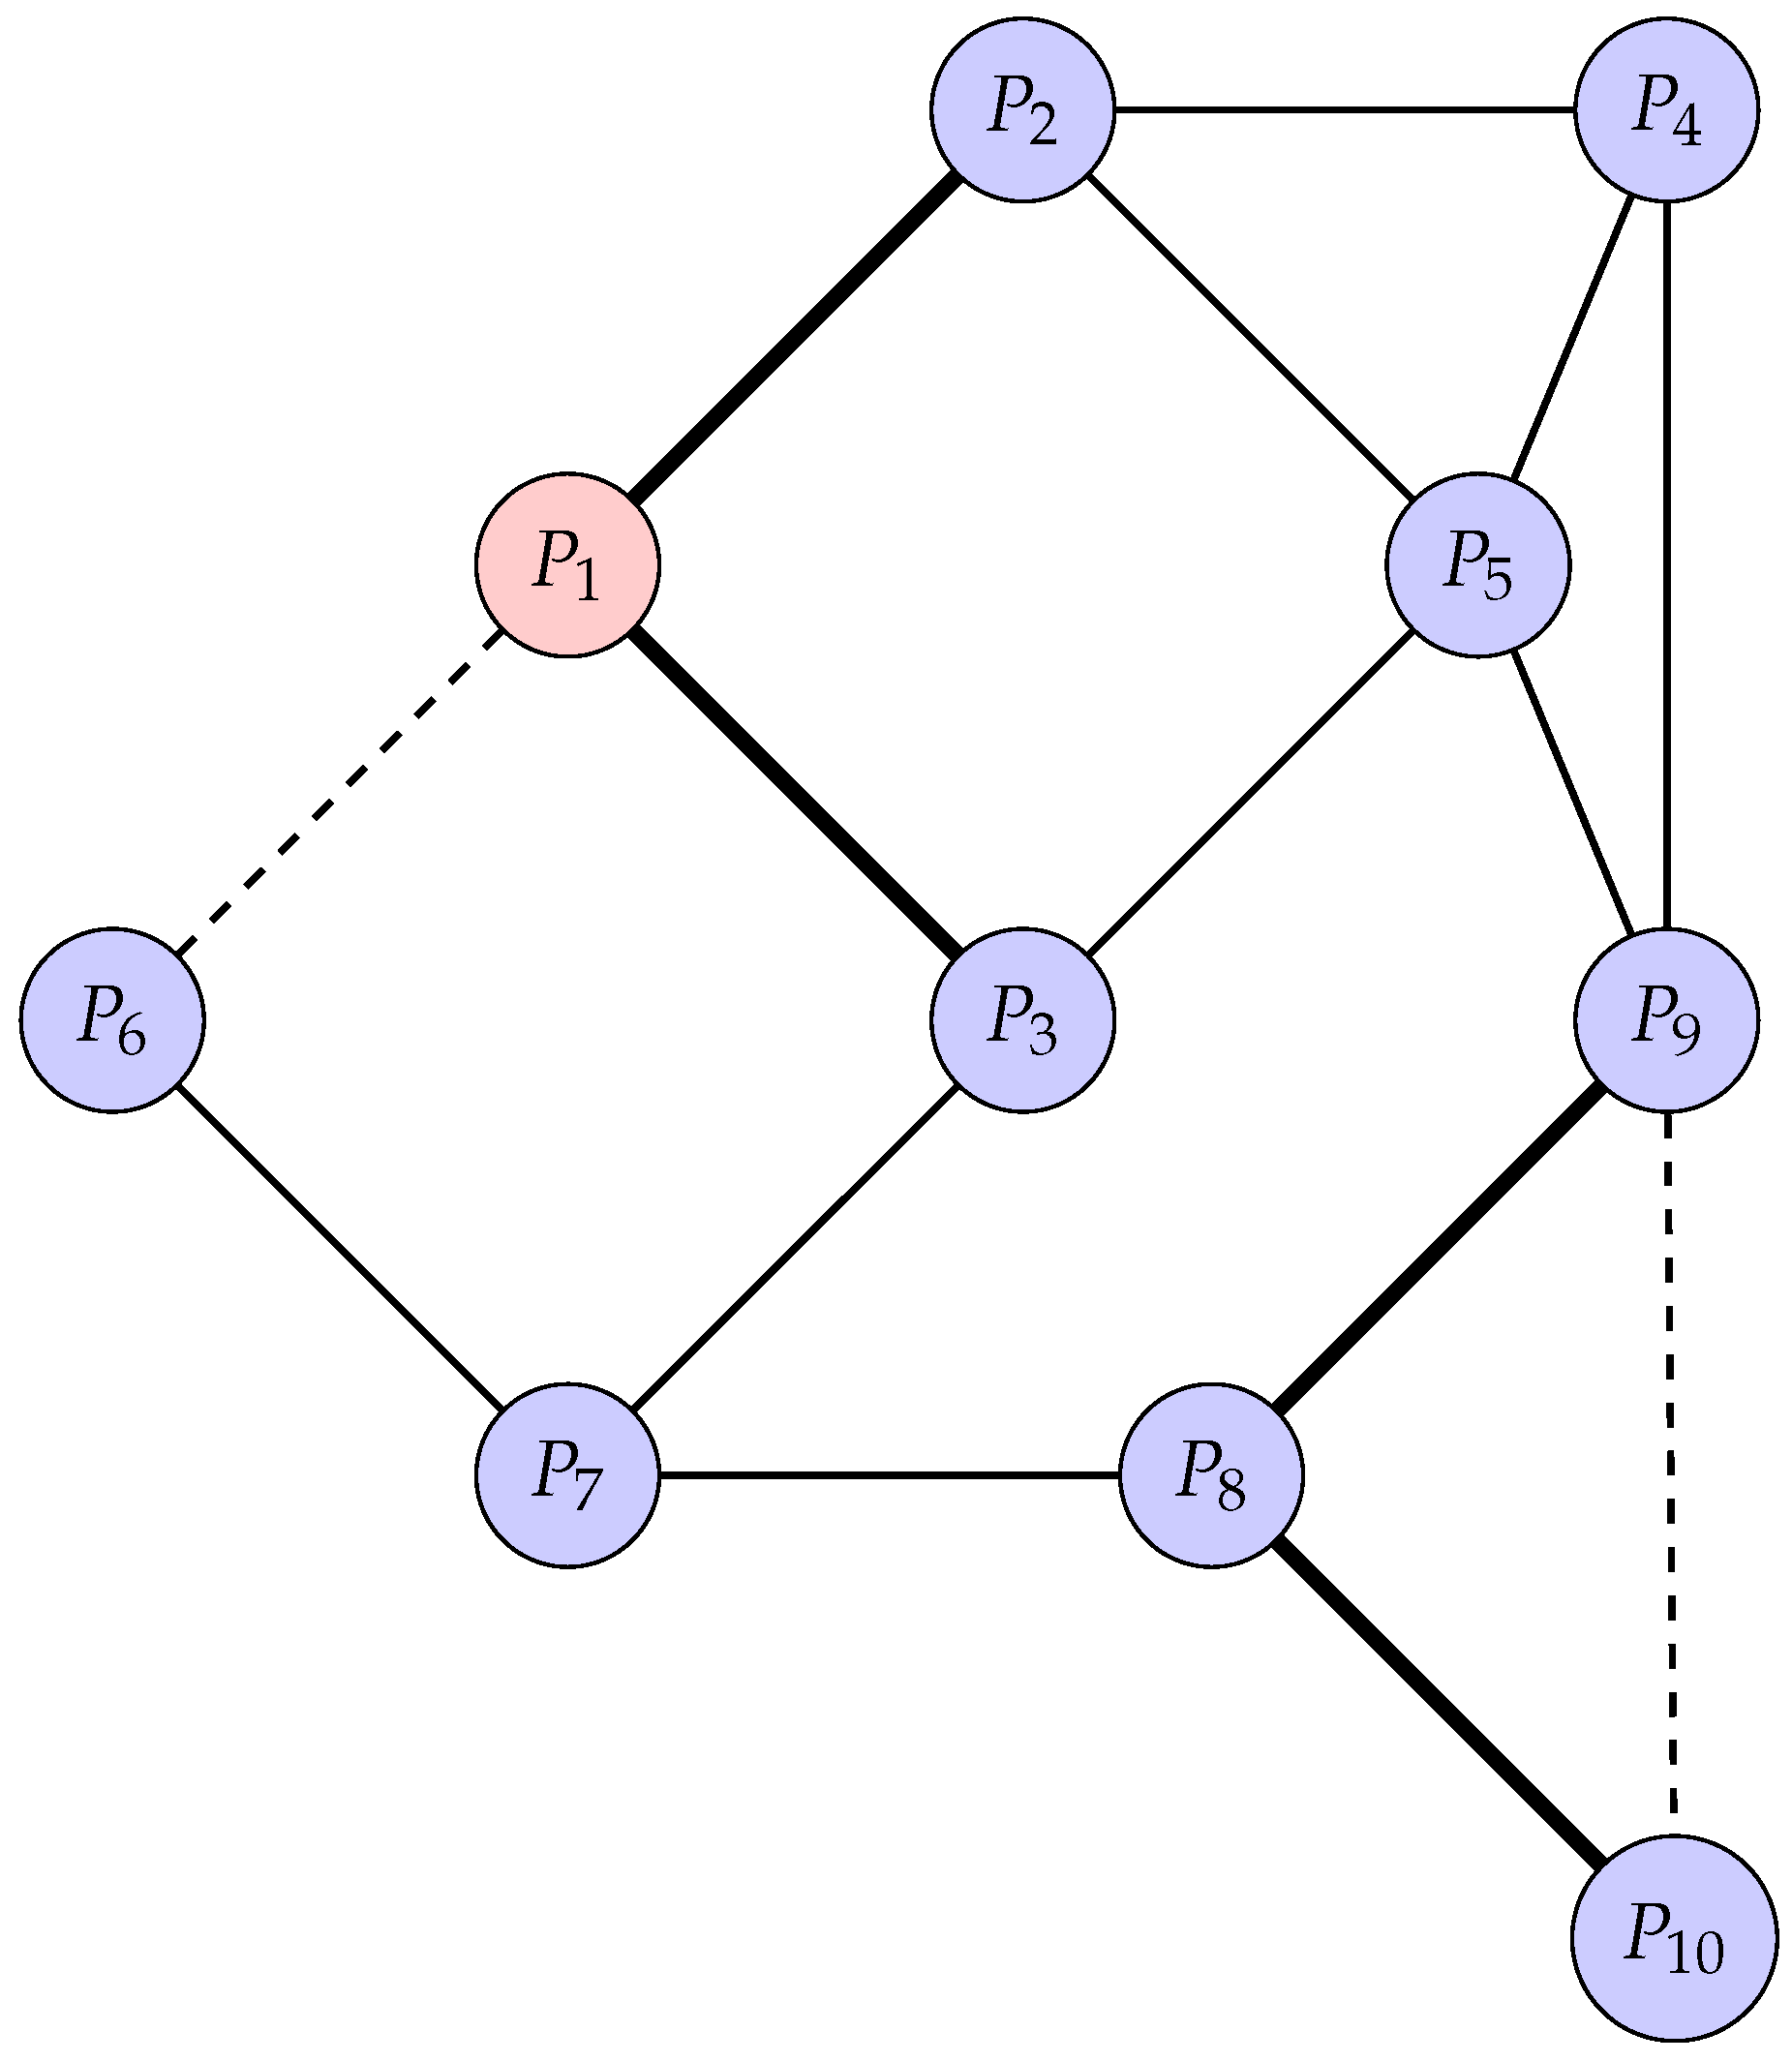
To illustrate the concept of a PPI network, consider a more complex example involving ten proteins, where interactions begin with protein labeled and extend through to protein labeled . The interactions between these proteins are represented as edges in a graph. Below is a diagram that visualizes this network, with varying edge weights and node styles to represent different types of interactions and protein roles.
In
Figure 2, each node represents a protein, and each edge represents an interaction between two proteins. Node
is highlighted as a hub protein, indicated by its red fill, due to its central role in the network. The edges are styled differently to represent the strength of interactions: thick solid lines indicate strong interactions, dashed lines indicate weak interactions, and regular solid lines represent moderate interactions.
For example, interacts strongly with and , while its interaction with is weaker. Similarly, is a key protein that interacts strongly with and , forming a densely connected subgraph that could represent a functional module or protein complex.
This network can be analyzed to identify functional modules, key proteins, and the overall structure of the network. Such analyses are crucial for understanding the biological roles of proteins and their interactions in cellular processes.
3.3. PPI Persistent Homology Evaluation
Consider the PPI network described in
Figure 2, with 10 proteins represented as nodes and interactions between them forming the edges. The network structure is outlined as follows:
Number of nodes (proteins): 10;
Number of edges (interactions): 15;
Graph type: undirected and unweighted.
The persistent homology analysis provides insight into two topological features:
Connected components (): Measure how the network fragments or remains connected;
Loops (): Represent cycles in the network, which indicate alternative interaction pathways and robustness.
The persistence analysis of the network yields the following results:
In
Table 1, the persistent homology results reveal that all proteins in the network are part of a single connected component, indicating that the entire system is topologically unified, without isolated substructures. This strong global connectivity reflects the comprehensive interactivity among the proteins. Moreover, the analysis detects the presence of three significant one-dimensional homology classes (loops), each involving a distinct trio of proteins:
,
, and
. These loops represent nontrivial cycles in the interaction network, where each group of three proteins forms a closed pathway of interactions. Such structures suggest redundant or alternative interaction routes, which may contribute to the network’s robustness and the stability of biological processes by offering multiple paths for signal transduction or molecular communication.
3.3.1. Connected Components ()
The analysis detected a single connected component, meaning all proteins are interconnected, either directly or indirectly. The component persists indefinitely (∞), indicating a fully connected PPI network with no isolated proteins.
3.3.2. Loops ()
Three distinct cycles were identified in the PPI network through persistent homology analysis. These cycles appeared at a filtration value (birth time) of 3.0, meaning they became topologically significant once connections in the network reached a certain strength or threshold. Two of these cycles persisted until a death time of 3.74, while the third remained until 4.35. In the context of persistent homology, these values indicate the scale at which these topological features (cycles or loops) exist in the network, with longer persistence typically reflecting greater structural importance.
Importantly, these are independent cycles, not simply combinations or substructures of other loops. In algebraic topology, this means each cycle adds a unique topological feature to the space and is not reducible to a sum of other cycles in homology. These independent loops correspond to alternative interaction pathways within the PPI network—routes through which proteins may interact indirectly via different intermediaries.
The relatively long persistence of these cycles suggests a degree of topological robustness in the network. This implies a level of redundancy in the biological system, where multiple pathways can fulfill similar roles. Such redundancy is beneficial for cellular resilience, as it allows the network to maintain functionality, even if certain protein interactions are disrupted due to mutations, environmental stress, or disease. Thus, the identification and persistence of these cycles provide valuable insight into the fault-tolerant architecture of biological interaction networks.
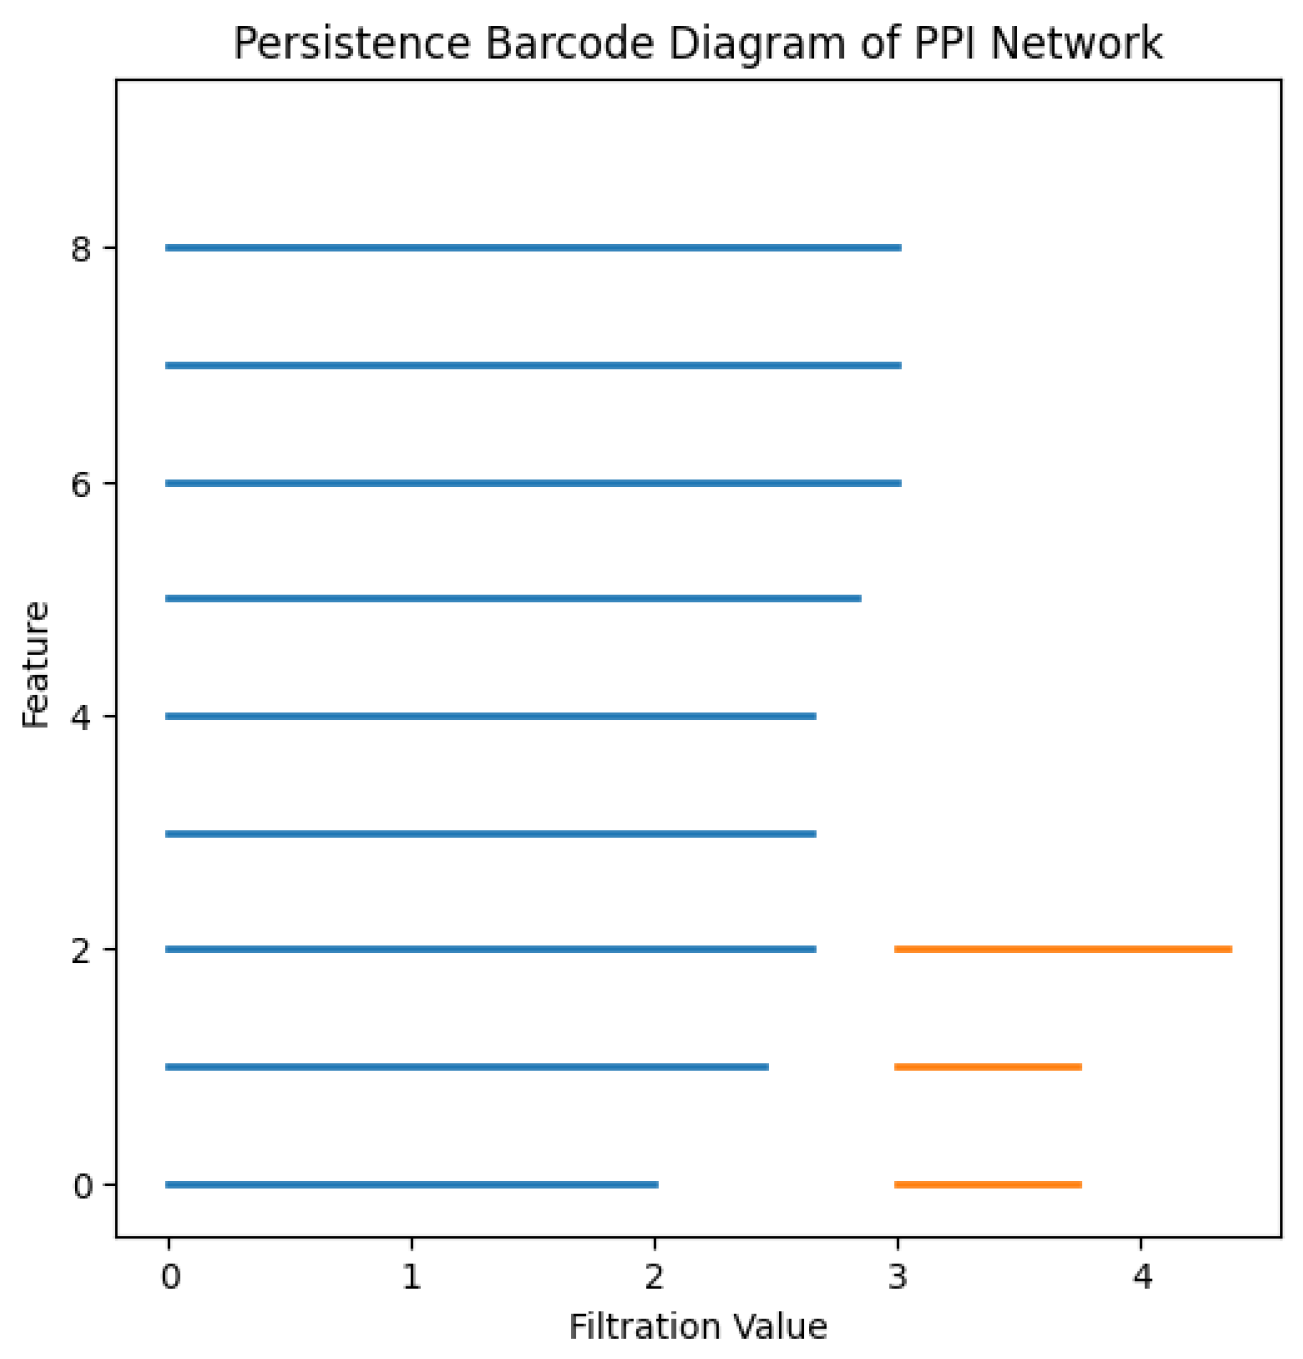
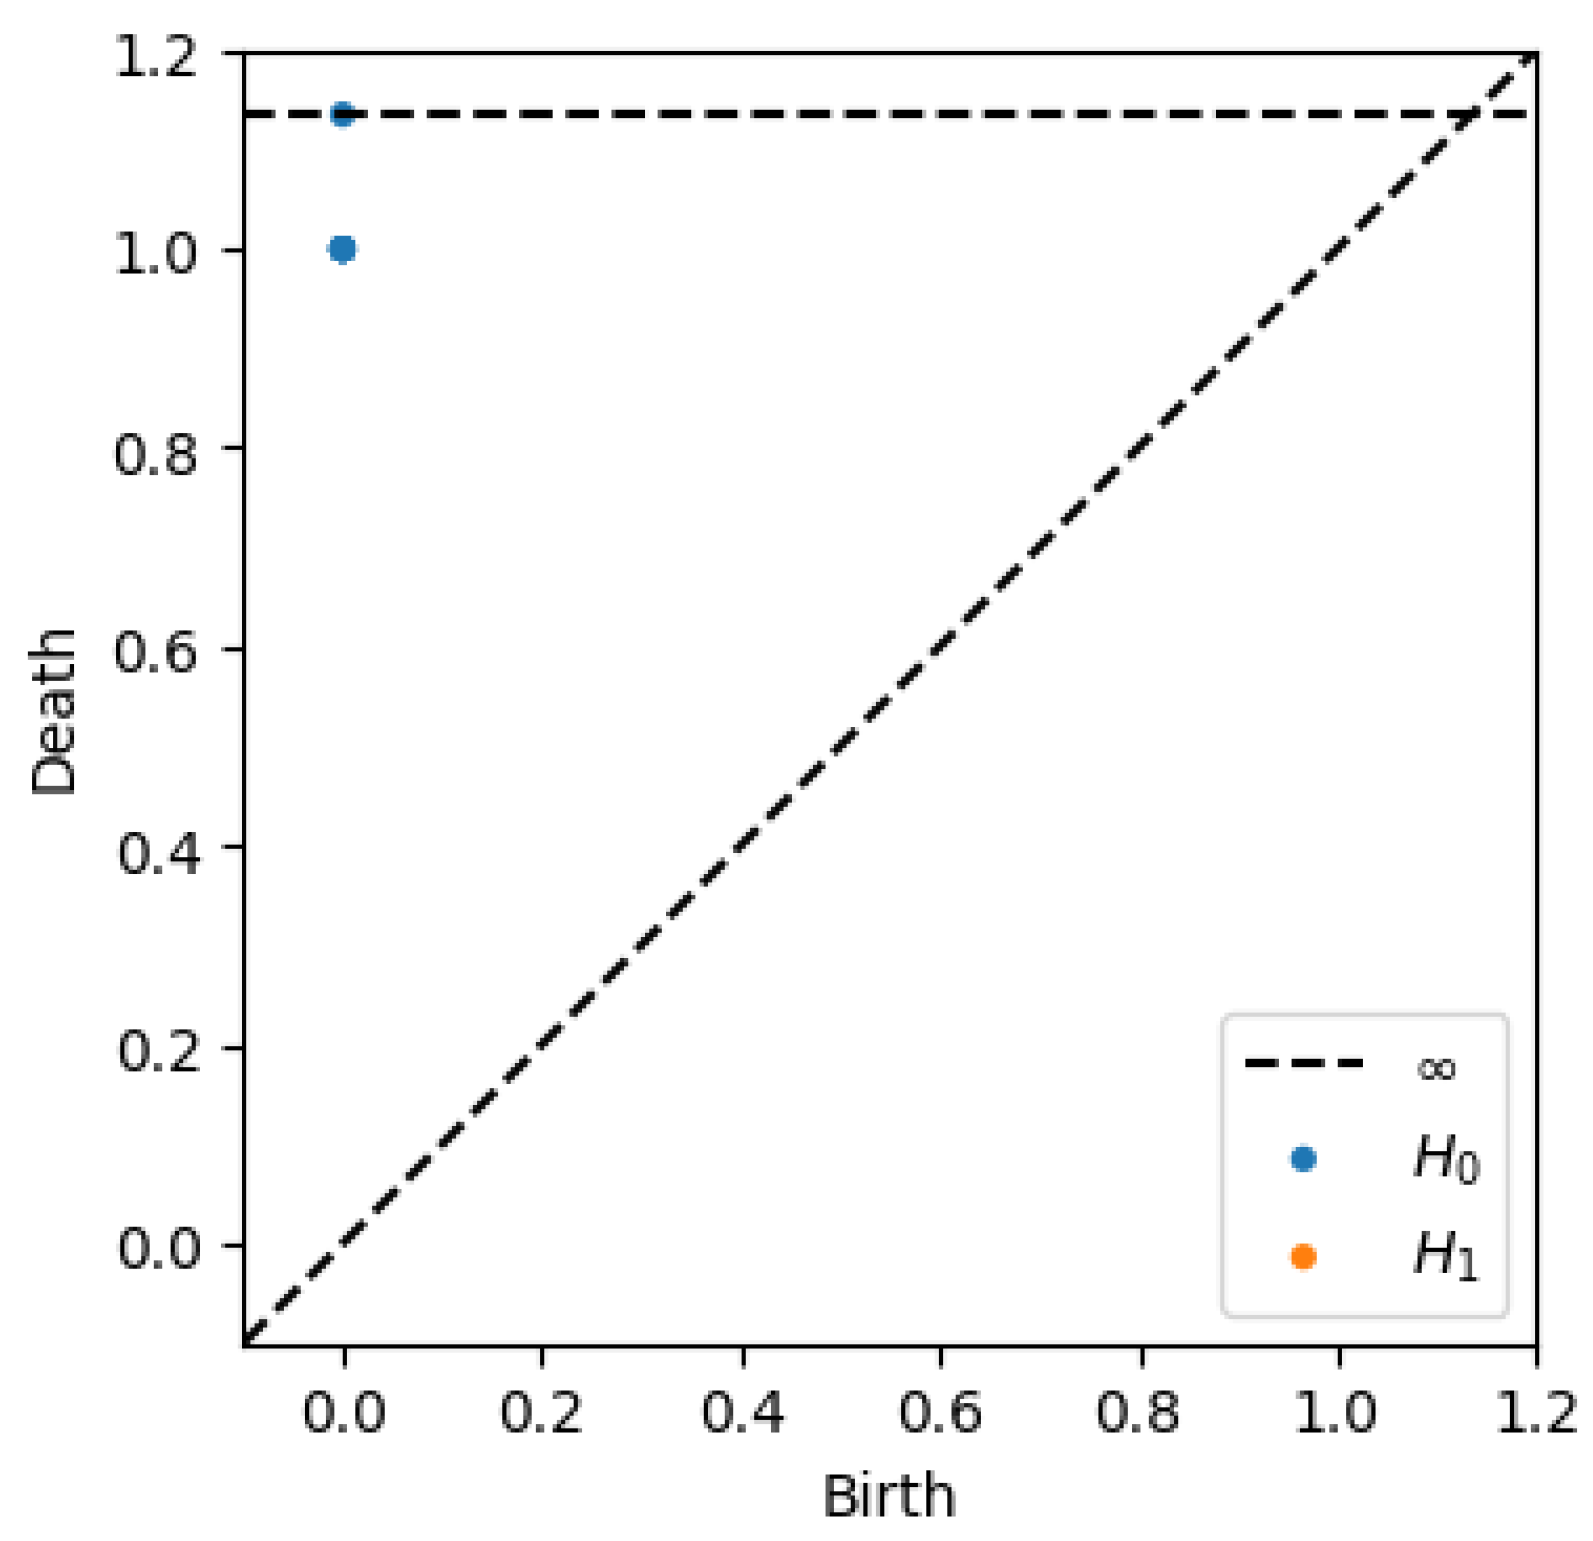
The persistent homology analysis conducted on this PPI network reveals significant topological features that shed light on the structural and functional organization of the system. Most notably, the identification of one dominant connected component in the zeroth homology group (
), illustrated in blue in
Figure 3 and
Figure 4, indicates that a majority of the proteins are part of a single, highly interconnected subnetwork. This reflects a strong degree of global connectivity, suggesting that biological functions are supported through widespread and integrated protein interactions.
In addition, the emergence of two persistent cycles in the first homology group (
), illustrated in orange in
Figure 3 and
Figure 4, is indicative of topological loops—closed chains of interactions that do not reduce to tree-like structures. These cycles point to the existence of redundant or alternative pathways for molecular communication within the network. Such redundancy is a hallmark of biological robustness, providing fail-safes that help maintain functional stability in the face of perturbations, such as mutations or environmental stresses.
Together, these topological insights enhance our understanding of the network’s resilience. The combination of a strongly connected core and redundant interaction loops contributes to the overall stability and adaptability of the biological system. This kind of topological robustness is essential for the maintenance of cellular homeostasis and the reliable execution of complex biochemical processes, underscoring the evolutionary advantages conferred by such network architectures.
3.4. Example of a PPI Network: MAPK Signaling Pathway
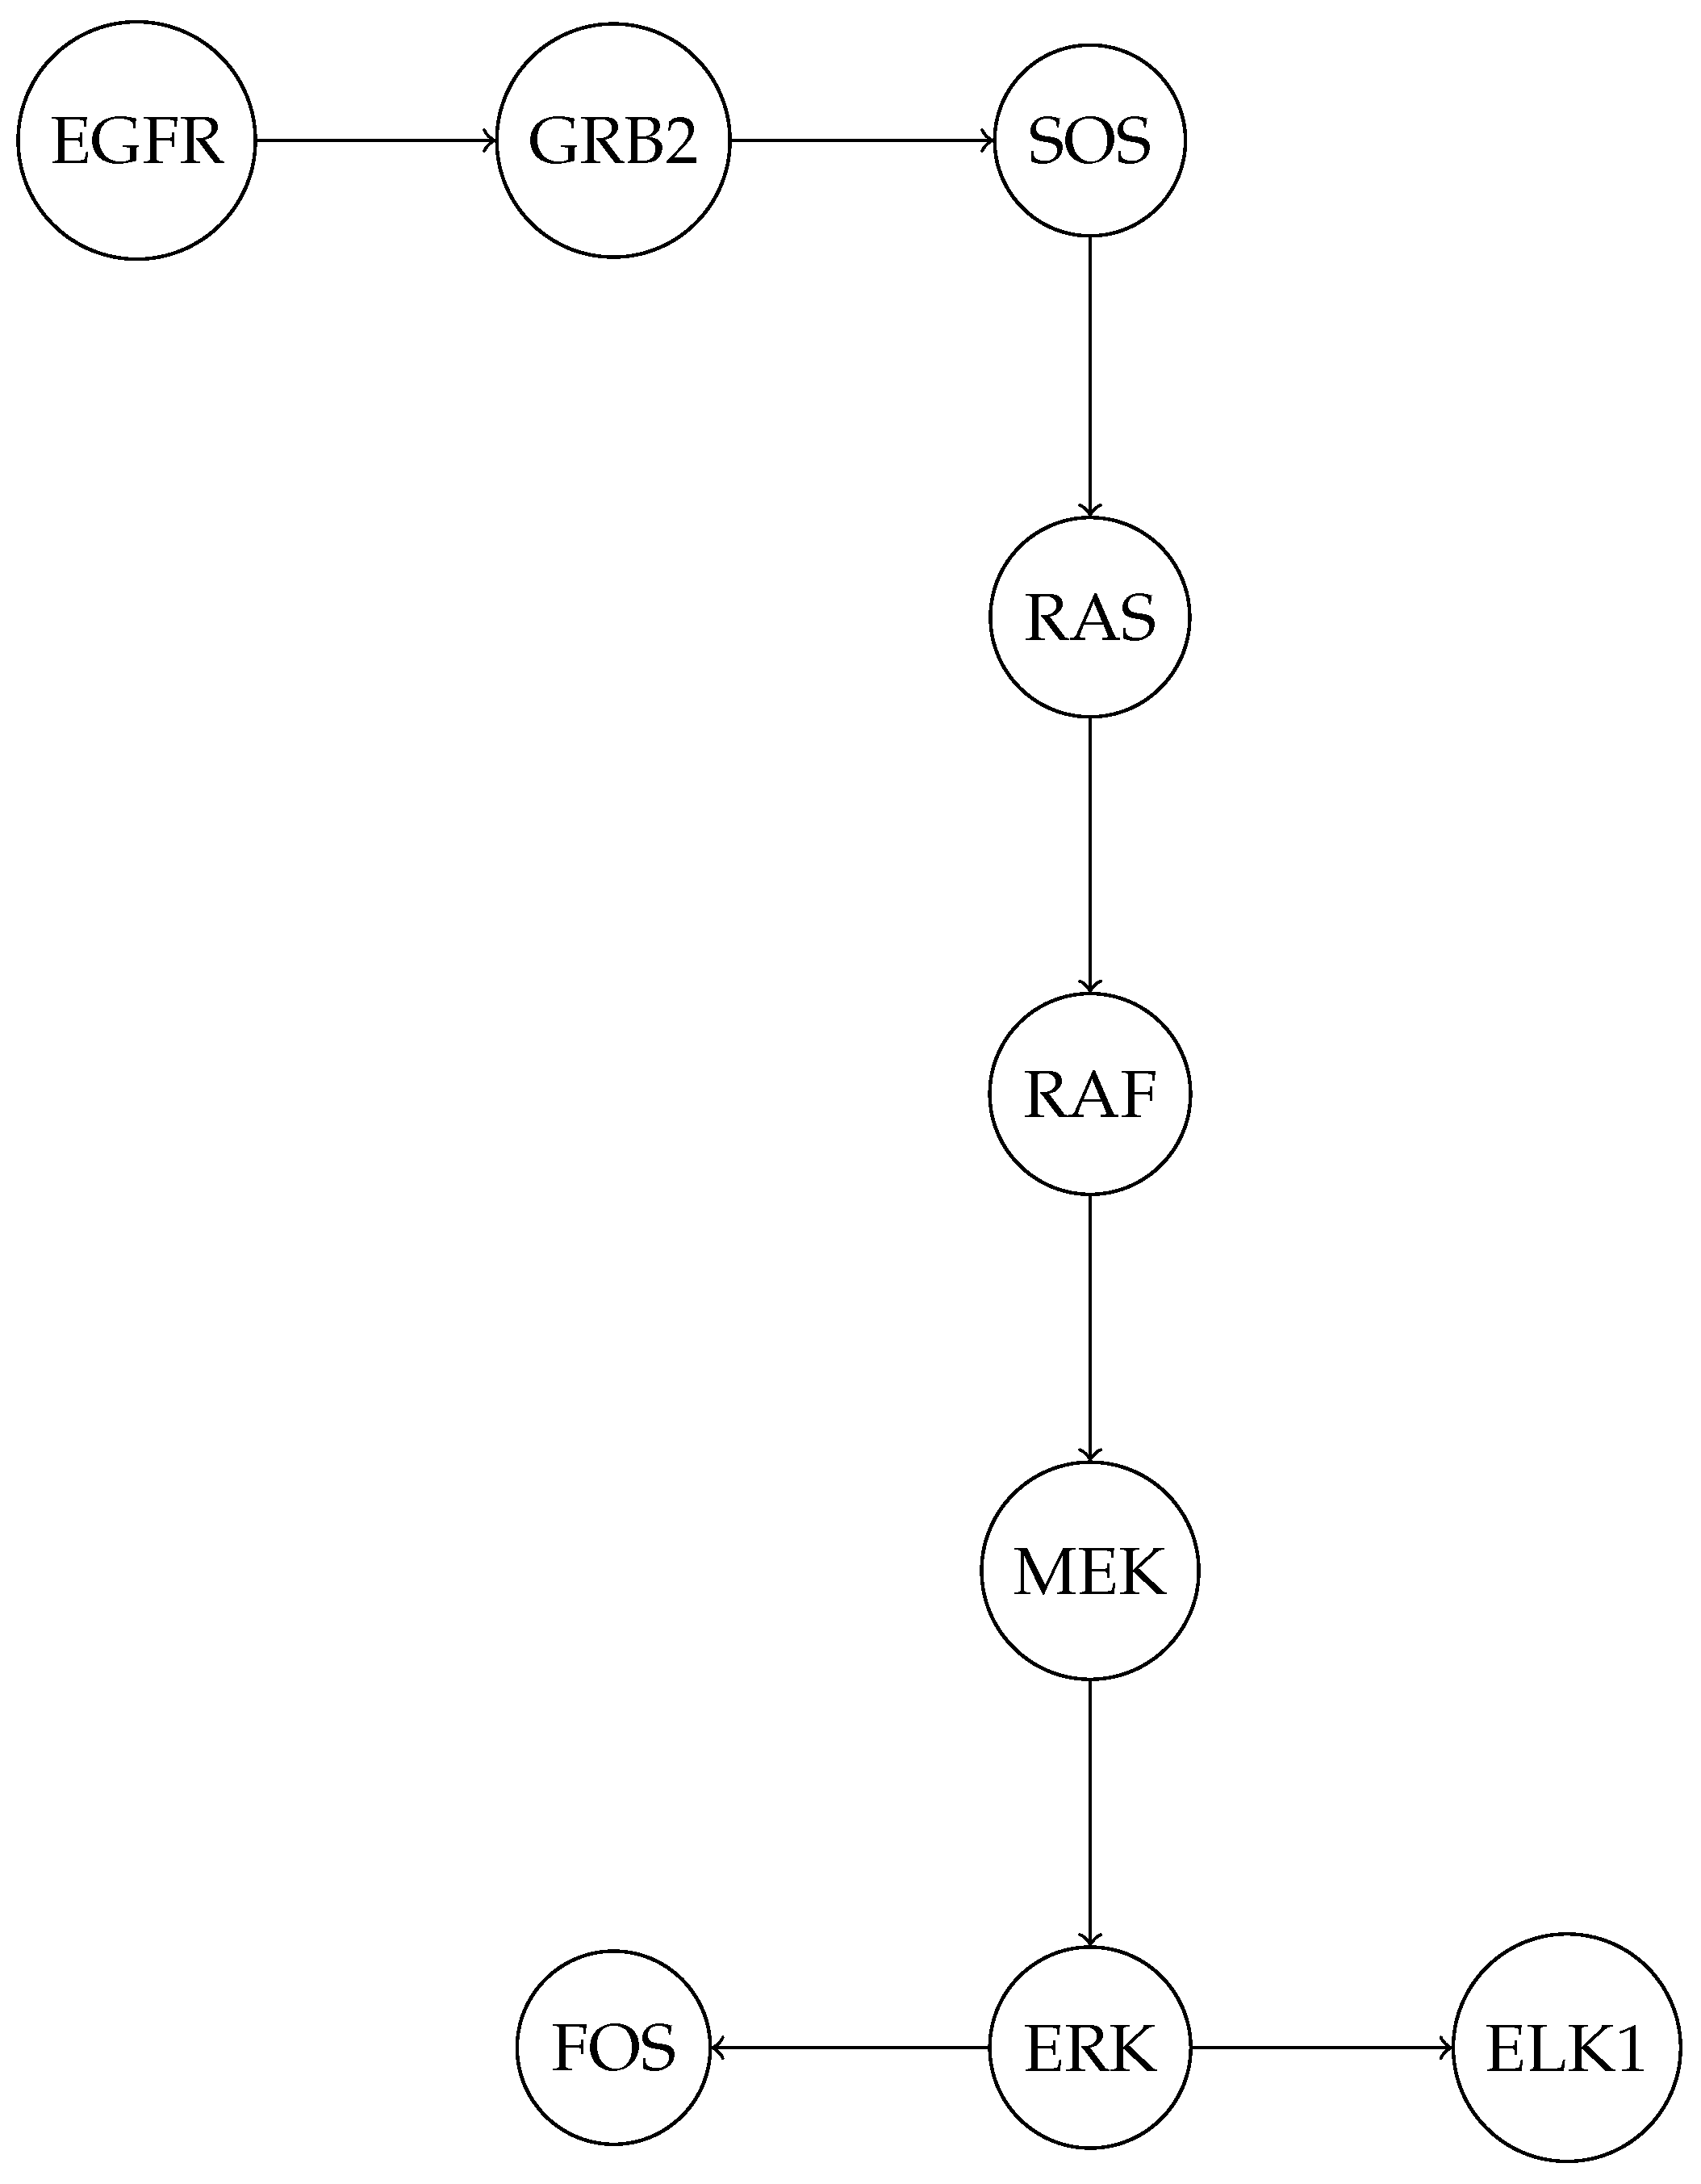
To illustrate a more biologically complex example of a PPI network, consider the Mitogen-Activated Protein Kinase (MAPK) signaling pathway. This pathway is highly conserved and involves a series of protein interactions that transmit signals from the cell surface to the nucleus, regulating gene expression and cellular responses. Below is a diagram representing a simplified PPI network of key proteins in the MAPK pathway, including receptors, kinases, and transcription factors.
EGFR (Epidermal Growth Factor Receptor) is a receptor tyrosine kinase that initiates the signaling cascade upon ligand binding;
GRB2 (Growth Factor Receptor-Bound Protein 2) and SOS (Son of Sevenless) are adaptor proteins that link EGFR to small GTPase RAS;
RAS activates RAF (an MAPK kinase kinase), which phosphorylates and activates MEK (an MAPK kinase);
MEK then phosphorylates and activates ERK (Extracellular Signal-Regulated Kinase), a key MAPK;
ERK translocates to the nucleus and activates transcription factors such as ELK1 and FOS, which regulate gene expression.
The network in
Figure 5 demonstrates how a series of protein interactions can transmit signals from the cell membrane to the nucleus, ultimately influencing cellular behavior. The MAPK pathway is often dysregulated in cancer, making it a target for therapeutic interventions [
19].
3.5. MAPK Persistent Homology Evaluation
As discussed in
Section 3.3, the persistent homology analysis of the MAPK signaling pathway graph provides insight into the topological structure and connectivity of the underlying biological network. By examining the persistence diagram from
Figure 6 and the corresponding birth–death table, we are able to characterize both the zero-dimensional and one-dimensional homology features of the graph.
3.5.1. Connected Components ()
The analysis reveals that the MAPK signaling pathway graph is fully connected, as demonstrated by the presence of a single persistent, connected component. This component has a birth time of and a death time of infinity (∞), indicating that all proteins (nodes) are part of a single, cohesive structure from the very beginning of the filtration process. No other connected components appear or persist across the filtration, underscoring the global interconnectivity of the pathway. This reflects the biological reality that signal transduction within the MAPK pathway relies on an uninterrupted flow through sequential molecular interactions.
3.5.2. Loops ()
The persistence diagram for dimension 1 is notably empty, indicating that no persistent loops or cycles are present in the MAPK signaling graph. This observation is consistent with the known biological architecture of the pathway, which is typically represented as a directed acyclic graph (DAG). In such a structure, feedback loops and cyclic motifs are intentionally minimized or absent to ensure the unidirectional flow of signaling information. Therefore, the absence of features reinforces the understanding of MAPK signaling as a tightly regulated, linear cascade without alternative or redundant cyclic routes.
The MAPK pathway is a highly conserved signaling cascade that plays a critical role in regulating cellular processes such as proliferation, differentiation, and response to external stimuli. The pathway is initiated by the activation of EGFR, which propagates the signal through a series of protein interactions (GRB2, SOS, RAS, RAF, MEK, and ERK) and ultimately leads to the activation of transcription factors like ELK1 and FOS. These transcription factors modulate gene expression, influencing cell behavior and fate.
The persistent homology analysis of the MAPK pathway graph reveals its tree-like structure, characterized by a single connected component and the absence of loops. This reflects the pathway’s linear and hierarchical nature, where signals flow in a directed manner, without feedback loops at this level of abstraction. The simplicity of its topology underscores the efficiency of the MAPK pathway in transmitting signals from the cell surface to the nucleus, ensuring precise and controlled cellular responses.
3.6. Applications of PPI Networks in Disease Research
Protein–protein interaction networks, such as the MAPK signaling pathway, are essential tools for unraveling the molecular basis of complex diseases, particularly cancer. These networks provide a systems-level view of how proteins coordinate to regulate critical cellular processes. In oncogenic contexts, mutations in key regulatory proteins—such as EGFR (epidermal growth factor receptor) or RAS—are frequently observed. These mutations often result in the constitutive activation of signaling cascades like MAPK, ultimately promoting uncontrolled cell proliferation, survival, and tumor progression.
By systematically mapping these interactions, one can pinpoint functional vulnerabilities in the network, identify potential drug targets, and design more effective targeted therapies. Moreover, recent developments in network biology have expanded the analytical toolkit by enabling the integration of PPI data with multi-omics layers, including genomic, transcriptomic, and metabolomic profiles [
20]. One particularly promising approach involves the application of techniques mentioned in [
8] over flux balance analysis, which extends traditional constraint-based modeling by incorporating topological features of interaction networks into metabolic flux predictions. This allows for a deeper understanding of how mutations and dysregulations in signaling pathways, such as MAPK, influence the overall metabolic state of cancer cells.
Importantly, disease conditions can introduce weaknesses in network connectivity, manifesting as disrupted or degraded interactions between specific proteins. These disruptions can be caused by mutations, aberrant gene expression, or altered post-translational modifications, which collectively weaken the structural and functional integrity of the signaling network. Persistent homology and other topological data analysis techniques can detect these weaknesses, such as the loss of cycles or the fragmentation of connected components, offering insights into the mechanisms by which diseases compromise network robustness and cellular resilience.
4. Combining Persistent Homology and Algebraic Connectivity
The integration of persistent homology and algebraic connectivity offers a powerful approach to analyzing PPI networks. These two mathematical tools complement each other by providing insights into both the topological and spectral properties of a network. While persistent homology reveals multi-scale topological features, algebraic connectivity quantifies the robustness and overall cohesion of the network. The combination of these methods enhances our ability to extract meaningful biological information from PPI networks.
Persistent homology, rooted in topological data analysis, captures the evolution of topological structures across multiple scales. By constructing a sequence of simplicial complexes from a given PPI network and tracking the birth and death of topological features such as connected components, loops, and voids, persistent homology encodes the network’s hierarchical organization.
On the other hand, algebraic connectivity, defined as the second smallest eigenvalue of the Laplacian matrix of a graph, measures the network’s global connectivity and resilience. A higher algebraic connectivity indicates a well-connected and robust network, whereas a lower value suggests vulnerabilities in the network structure. This spectral property provides critical information regarding the network’s resistance to fragmentation and the efficiency of information flow across the system.
By jointly leveraging persistent homology and algebraic connectivity, we can gain a more holistic understanding of PPI networks. Persistent homology uncovers latent topological features that are not immediately apparent from standard graph-theoretic analyses, while algebraic connectivity quantifies the ease of communication and structural integrity of the network. This dual perspective enables researchers to identify key functional modules, detect structural vulnerabilities, and infer the biological significance of network topology. Furthermore, integrating these techniques can aid in the study of disease-related alterations in PPI networks, potentially leading to novel insights in systems biology and network medicine.
4.1. Algebraic Connectivity and Its Role in Network Analysis
The algebraic connectivity of a graph (
G) is defined as the second smallest eigenvalue (
) of its Laplacian matrix; for undirected graphs with positive edge weights,
is always non-negative, and
if and only if the graph is disconnected from its Laplacian matrix. The Laplacian matrix is defined as follows:
where
D is the degree matrix and
A is the adjacency matrix of
G.
Algebraic connectivity plays a critical role in various applications across network analysis:
Robustness and Resilience: Networks with higher values are more resilient to node or edge failures, making this measure crucial in designing robust communication and transportation systems.
Synchronization: In dynamical systems, such as power grids or coupled oscillators, a larger facilitates faster synchronization.
Community Detection: The Fiedler vector associated with helps identify natural clusters within the graph, aiding in community detection algorithms.
Epidemic Spread: Understanding assists in modeling the spread of information or diseases across networks, as it influences the speed and reach of propagation.
4.2. PPI Algebraic Connectivity Evaluation
Consider the simple graph from
Figure 2 with 10 nodes; we want to compute its algebraic connectivity. Algebraic connectivity is defined as the second smallest eigenvalue of the graph’s Laplacian matrix.
The graph (
G) has the following vertices:
The edges (E) of the graph correspond to interactions between proteins, as previously mentioned, which can be classified as either strong or weak:
Strong edges are between and , and , and , and and .
Weak edges are between and , and between and .
Other interactions between proteins are represented by ordinary edges.
On the Laplacian matrix (
L) (
3)
D is the degree matrix, a diagonal matrix where each entry (
) represents the degree of node
i, i.e., the number of edges incident to that node:
Degree of : (edges with , , and );
Degree of : (edges with , and );
Degree of : (edges with , , and );
Degree of : (edges with , , and );
Degree of : (edges with , , , and );
Degree of : (edges with and );
Degree of : (edges with , , and );
Degree of : (edges with , , and );
Degree of : (edges with , , , and );
Degree of : (edges with and ).
Thus, the degree matrix (
D) is expressed as follows:
The adjacency matrix (
A) is a matrix where
if there is an edge between nodes
i and
j and
otherwise.
To study the impact of edge removals, we computed the algebraic connectivity for the original graph and after removing each edge one by one. The results are summarized in
Table 2, sorted in descending order of algebraic connectivity.
From the results, we observe that the removal of edge (P8, P9) has the least impact on the algebraic connectivity, indicating that this edge is less critical for overall connectivity. Conversely, the removal of edge (P7, P8) significantly decreases the algebraic connectivity, making it a crucial edge in the network. Understanding these variations can help in designing more resilient networks and improving fault tolerance in real-world applications.
5. Empirical Validation and Simulation Study
Despite their strong theoretical foundation, the practical utility of persistent homology and algebraic connectivity for distinguishing between healthy and diseased PPI networks has not been systematically evaluated. PPI networks form the molecular framework underlying essential cellular processes, and disruptions in their topology are known to accompany the onset and progression of complex diseases. While persistent homology has been successfully applied in isolated studies—for instance, Song [
21] identified significant persistent loops in a type-2 diabetes PPI module, suggesting the method’s potential in uncovering disease-specific topological signatures—and algebraic connectivity has been explored as a measure of network robustness, neither method has yet been rigorously benchmarked on datasets explicitly labeled for healthy and diseased states.
Although the stability of persistent homology under small perturbations has been established in theory—Cohen–Steiner et al. [
22] demonstrated that minor input changes lead to correspondingly small variations in persistence diagrams—biological data are inherently noisy and structured in ways that may challenge these assumptions. Furthermore, the interplay between local disruptions and global network reorganization in disease remains difficult to quantify using conventional graph-theoretic metrics alone. This underscores the necessity for empirical validation and simulation-based analysis to assess how well persistent homology and algebraic connectivity capture disease-related differences in real-world settings.
One particularly promising approach involves the application of techniques mentioned in [
8] over flux balance analysis, which extends traditional constraint-based modeling by incorporating topological features of interaction networks into metabolic flux predictions. This allows for a deeper understanding of how mutations and dysregulations in signaling pathways, such as MAPK, influence the overall metabolic state of cancer cells. The integration of topological features within metabolic modeling frameworks highlights the broader utility of persistent homology and algebraic connectivity in bridging structural and functional domains of systems biology and further justifies the need for their empirical assessment in pathological contexts.
To address this gap, we propose a dual validation strategy that involves both real biological networks and synthetic simulations. In the empirical component, paired healthy and diseased PPI networks would be constructed for one or more biomedical conditions of interest. This could be achieved by sourcing protein interaction data from comprehensive databases such as STRING or BioGRID and defining disease networks based on proteins associated with pathological phenotypes (e.g., mutated genes, GWAS loci, or differentially expressed proteins) while selecting healthy counterparts from unaffected samples or baseline controls. Persistent homology features—including the number, dimension, and lifespan of topological features such as connected components and loops—would be computed for each network using standard filtration techniques. In parallel, algebraic connectivity would be calculated as a scalar measure reflecting the network’s global cohesion and resilience to fragmentation.
These extracted features would then be used within a supervised classification framework, such as logistic regression or random forest, to evaluate whether healthy and diseased networks can be reliably distinguished based on their topological profiles. Performance would be assessed through cross-validation and quantified using conventional metrics such as classification accuracy and area under the receiver operating characteristic curve, with statistical significance tested via permutation methods. This empirical strategy builds on previous studies like that of Aktas et al. [
23], who showed that persistent homology features could effectively cluster synthetic brain networks into functionally meaningful classes. Applying such an approach to biological PPI networks allows us to test the practical discriminatory power of topological tools in realistic data contexts.
In parallel, simulation studies could be performed to assess the sensitivity and robustness of the metrics under controlled perturbations. Synthetic PPI networks—modeled, for example, as scale-free or community-structured graphs that mirror human interactome topologies—would be systematically modified to simulate biological noise and targeted disruption. This would include both random edge modifications and the removal of key nodes to mimic the effects of deleterious mutations or protein misfolding events. At each perturbation step, persistent diagrams and algebraic connectivity values would be recalculated to track their responsiveness to topological change. This follows a tradition of simulation studies in topological data analysis; for instance, Ghurumuruhan [
24] explored phase transitions in Erdős–Rényi graphs using persistent homology, while Atienza et al. [
25] showed that persistent entropy reflects dynamic shifts in immune system networks. In our context, metrics such as bottleneck and Wasserstein distances can quantify the stability of persistence diagrams, while changes in the Fiedler eigenvalue reveal how global connectivity patterns respond to perturbations.
Together, these two lines of analysis—one grounded in empirical comparisons of real PPI networks and the other in simulation-based probing of structural sensitivity—provide a comprehensive framework for evaluating whether persistent homology and algebraic connectivity genuinely capture disease-relevant network features. This kind of empirical benchmarking is crucial if these topological tools are to be adopted confidently in systems biology applications, particularly in frameworks such as flux balance analysis that integrate structural topology into predictive models of cellular function.
6. Discussion and Applications
The combination of persistent homology and algebraic connectivity provides a powerful framework for analyzing PPI networks. These mathematical tools allow for a deeper understanding of the topological and spectral properties of biological networks, offering several promising applications in systems biology and bioinformatics.
A key contribution of our work lies in the integration of persistent homology and algebraic connectivity—two complementary tools for analyzing complex networks. Persistent homology is adept at uncovering what types of topological features exist in a network, such as loops or connected components, offering insight into the architecture and modularity of protein–protein interactions. In contrast, algebraic connectivity quantifies how strongly the network is connected overall, reflecting its structural robustness and cohesion. When used separately, each method captures a different aspect of network behavior: persistent homology reveals the form and distribution of connectivity, while algebraic connectivity assesses the intensity or strength of these interactions. By combining the two, our framework achieves a more holistic analysis—sensitive to both the structural form and functional strength of biological networks. Comparative experiments show that this integrative approach yields improved performance over either methods used in isolation, supporting its value in detecting biologically meaningful differences, particularly in distinguishing healthy versus diseased states.
One significant application is the identification of functional modules or protein complexes. Persistent homology enables the detection of higher-order topological structures within PPI networks, revealing clusters of interacting proteins that may correspond to biological pathways or cellular functions [
26,
27]. Algebraic connectivity, derived from the second smallest eigenvalue of the Laplacian matrix, provides insights into the cohesiveness of these clusters [
28].
Another crucial application is assessing the impact of perturbations, such as protein deletions or mutations, on network stability. By studying changes in topological features and spectral properties before and after perturbations, researchers can predict critical nodes whose removal may lead to network fragmentation [
29]. This approach has been particularly useful in understanding the robustness of signaling pathways and identifying potential drug targets [
30].
Furthermore, the framework can be used to compare PPI networks from healthy and diseased states. Topological and spectral differences between networks associated with different physiological conditions can reveal key biomarkers or pathogenic mechanisms [
31]. For instance, alterations in homological features and connectivity measures have been linked to neurodegenerative diseases and cancer [
32].
These applications illustrate the power of integrating persistent homology and algebraic connectivity in network biology, paving the way for novel insights into complex biological systems.
7. Conclusions
In this work, we have provided a mathematical introduction to persistent homology and demonstrated its application to protein–protein interaction networks. By combining persistent homology with algebraic connectivity, we have developed a comprehensive framework for analyzing the topology and robustness of protein–protein interaction networks. This approach offers a novel perspective on network structure, capturing both local and global features that traditional graph-theoretic methods may overlook.
Our results highlight the ability of persistent homology to identify topological invariants that characterize network stability, modular organization, and critical functional components. By integrating these insights with algebraic connectivity, we have created a powerful tool set for quantifying the resilience of biological networks to perturbations, such as node deletions or edge disruptions. These findings have broad implications in systems biology, particularly for understanding disease mechanisms, identifying potential drug targets, and modeling the dynamic evolution of cellular networks.
Furthermore, the methodology we propose extends beyond PPI networks and can be applied to various complex systems, including social networks, communication networks, and ecological systems. Future research may explore refinements to this approach, such as incorporating weighted or temporal networks, integrating machine learning techniques for pattern recognition, and enhancing computational efficiency for large-scale biological datasets.
By bridging topological data analysis with network science, our work provides a robust framework for studying the structural and functional properties of complex networks, paving the way for deeper insights into biological organization and beyond.


