Article

Altered iso- and oxo-Fecal Bile Acid Concentrations in Dogs with Chronic Enteropathy

by
Amanda B. Blake
1,*,
Linda C. Toresson
1,2,
Chih-Chun Chen
1,
Patricia E. Ishii
1,
Robert Kyle Phillips
1,
Paula R. Giaretta
1,
Joao P. Cavasin
1,
Jonathan A. Lidbury
1 and
Jan S. Suchodolski
1
1
Gastrointestinal Laboratory, Department of Small Animal Clinical Sciences, Texas A&M University, College Station, TX 77843, USA
2
Evidensia Specialist Animal Hospital, Bergavagen 3, 25466 Helsingborg, Sweden
*
Author to whom correspondence should be addressed.
Submission received: 12 February 2025 / Revised: 3 April 2025 / Accepted: 11 April 2025 / Published: 18 April 2025

Abstract

:
Bile acids (BAs) are important signaling molecules in the gastrointestinal (GI) tract and are associated with health and disease in humans and animals. Intestinal bacteria transform BA through deconjugation, dehydroxylation, and epimerization reactions, producing various isoforms, many of which have not been investigated in companion animal diseases. We aimed to develop and analytically validate a novel liquid chromatography–tandem mass spectrometry (LC-MS/MS) method for the quantification of 30 BAs in dog feces, with a simple extraction procedure and on-line solid-phase extraction. Validation demonstrated good accuracy, precision, sensitivity, spiking recovery, dilution, and stability for 29 BAs. The method was applied to fecal samples from healthy dogs (H; n = 121) and dogs with chronic enteropathy (CE; n = 58). The immediate and downstream products of bacterial 7α-dehydroxylation reactions with cholic acid were lower in concentration in dogs with CE when compared to healthy dogs (deoxycholic acid, 3-oxo-deoxycholic acid, and 12-oxo-lithocholic acid; q < 0.001). Across all fecal samples, the products of hydroxysteroid dehydrogenase (including oxo- and iso-BA) made up an average of 30% of the total measured fecal BA pool (glycine-BA, 0.1%; taurine-BA, 2.2%; unconjugated BA, 53%).

1. Introduction

Chronic gastrointestinal (GI) diseases in pet dogs present a significant cost burden to pet owners, with full diagnostic evaluations costing hundreds to thousands of dollars, and in severe cases, involving invasive procedures for endoscopic biopsy evaluation. Recommended treatments, such as therapeutic diets or immunosuppressive therapies, are trialed, and the responses are monitored, sometimes taking multiple trials to obtain a successful treatment regime. Current research in dogs often follows human medical research on chronic GI diseases like Crohn’s disease and ulcerative colitis. This research is focused on identifying novel biomarkers to aid in the identification of individualized treatment options, with the goals of reducing the time to the resolution of symptoms, reducing the financial burden on pet owners, and reducing the invasiveness of diagnostic procedures. Biomarkers present in the feces are preferred due to their collection being minimally invasive. Measuring the concentrations of several related compounds can help elucidate the biomolecular pathways and the potential future therapeutic targets of GI diseases in dogs.
Fecal bile acids (BAs) have been increasingly used to help define relationships between the intestinal microbiota and the host, both in healthy and diseased states. Bile acids are formed in the liver from cholesterol, where they are then conjugated to taurine and glycine, transported to the gallbladder, and excreted into the intestine through bile. There, they aid in the absorption of fat and fat-soluble vitamins. The majority of BAs are reabsorbed into enterohepatic circulation in the distal small intestine. Intestinal bacteria transform the remaining luminal BA through deconjugation, dehydroxylation, and epimerization reactions, producing various species of BA. Others have summarized various bacterial groups that have these enzymes in human intestinal microbiota [1,2]. Bile salt hydrolase (BSH) enzymes for the deconjugation of BA are found in all major intestinal bacterial phyla. 7α-dehydroxylase enzymes are found in Eubacterium and Clostridium species, with Peptoacetobacter (Clostridium) hiranonis being the main bacterium capable of this conversion in dogs [3,4,5]. Many groups of bacteria have hydroxysteroid dehydrogenase (HSDH) enzymes that can epimerize hydroxy groups at C-3, 6, 7, and 12 positions [1]. In humans, there are 48 possible BAs from the host (considering glycine and taurine conjugations), and when bacterial metabolism comes into play, these 48 can become 384 possible BAs [6]. This does not consider the vast number of possible alternate conjugations of BAs with other amino acids, sugars, etc. The elucidation of the roles these BAs play in health and disease has mainly been focused on cholic acid (CA), chenodeoxycholic acid (CDCA), deoxycholic acid (DCA), and lithocholic acid (LCA) and their glycine and taurine conjugates. However, as more of these BA species become commercially available, allowing assay development, more studies are looking into their roles and functions.
Recent evidence has shown that BAs are important signaling molecules in the GI tract, having physiological impacts on motility, inflammation, and host metabolism, and they are increasingly being looked at as future therapeutic targets for cardiometabolic, inflammatory, and neoplastic diseases [7]. BAs act as ligands for the farnesoid X receptor (FXR) and the Takeda G protein-coupled receptor 5 (TGR5), thus having many downstream signaling effects [8,9,10]. With many dogs with chronic GI disease or chronic enteropathy (CE) having an inflammatory component of disease [11], BAs may serve as a potential therapeutic target for reducing inflammation.
Humans with ulcerative colitis and Crohn’s disease have decreased intestinal expression of bile acid transporters and altered BA pools in serum and feces that are typically characterized by an increase in primary BA CA and CDCA and a decrease in secondary BA DCA and LCA [12]. In dogs, similar results have been observed across various studies [5]. Most of these previous studies only examined primary deconjugated BA and secondary BA produced by 7α-dehydroxylation and showed that the proportion of secondary BA decreases in dogs with CE, likely due to a decrease in the abundance of the main converting bacterium, P. hiranonis. Studies are increasingly measuring oxo- and iso-BA. These additional BAs may be able to reveal further insights into bacterial transformation pathways and how they may be altered in disease states.
BA can be measured with several different types of instrumentation. Gas chromatography–mass spectrometry has been used widely in the past; however, BAs are not readily volatile and must be derivatized prior to analysis, adding lengthy steps to sample preparation. More popular is the use of liquid chromatography–mass spectrometry. There are many iterations of using LC-MS for BA measurement in the literature [6,13,14,15,16,17,18,19,20,21,22,23,24,25,26,27,28,29,30,31,32,33,34,35,36,37,38,39,40,41,42,43,44], but the majority utilize C18 reverse-phase analytical columns and some combination of water, methanol, and/or acetonitrile with formic acid or ammonium acetate modifier as the mobile phases. Sample preparation ranges from complex protocols involving mixing, centrifugation, solid-phase extraction (SPE), evaporation, and reconstitution, to very simple dilute-and-shoot methods, where samples are simply diluted and then analyzed. Protocols designed for feces tend to be more complicated due to the complex nature of the sample. Elaborate sample preparation does not translate well to high-throughput assays or assays that can be used in a wide variety of laboratory or clinic settings. On-line SPE can be utilized to reduce the bench time for sample preparation while maintaining the clean-up of the sample.
One often overlooked challenge is quantifying both very high and very low concentrations of individual BAs, which may be present in healthy and diseased populations. High concentrations of BA can suppress the signal from the deuterated internal standards of the same BA. Our solution to this challenge was to use glycine-conjugated internal standards, as glycine-conjugated BAs are generally low in abundance in dogs, in order to obtain a semi-quantitative assay. We injected samples at two different dilutions to obtain more accurate quantitation at extremely low and high concentrations. We utilized on-line SPE and simple sample preparation to be amenable to high throughput, and the assay validation was successful. We then used this method to identify differences in fecal bile acid pools between dogs with chronic enteropathy and healthy dogs.

2. Materials and Methods

2.1. Reagents

HPLC- and MS-grade solvents were used to make mobile phases and were purchased from various vendors. Water was either purchased as 0.1% formic acid water (Thomas Scientific C761U01, Chadds Ford Township, PA, USA), or Milli-Q ultrapure Type I+ water (ELGA PURELAB® Ultra, Darmstadt, Germany). Formic acid was purchased from Sigma-Aldrich (St. Louis, MI, USA) and was hyper grade for LC-MS (LiChrosolv®). Bile acids, including 30 unlabeled and 6 deuterated compounds, were purchased individually from vendors listed in Table S1. Compound structures are shown in Figure S1.

2.2. Working Solutions and Standards

Individual stock solutions were prepared for each compound at a concentration of 0.2 or 2 mg/mL methanol and kept in a flammable freezer at −20 °C. From these stocks, dilutions were prepared at 0.8 µg/mL of methanol for method optimization. As indicated in Table S2, the volumes of stock solutions were combined into standard mix A and standard mix B, dried under nitrogen at 25 °C, and reconstituted in the indicated volumes of methanol. Mixes were vortexed on high for 1 min prior to serially diluting in methanol to 15 standard levels. An internal standard mixture was prepared prior to sample extraction batches. The 40 µL internal standard mix (prepared using 0.2 mg/mL of stocks) contained 4 µL each of d4- cholic acid, d4-lithocholic acid, and d4-glycocholic acid; 3 µL of d4-glycolithocholic acid; 2 µL of d4-taurocholic acid; 1 µL of d4-taurolithocholic acid; all combined with 22 µL of methanol. Zero blanks, one mid-level standard from mix A, and a laboratory control sample (LCS) were prepared with each batch of samples to ensure consistency across batches.

2.3. Animals and Fecal Samples

All fecal samples utilized in assay analytical validation were excess samples submitted to the Gastrointestinal Laboratory at Texas A&M University for routine diagnostic purposes or were naturally voided fecal samples for which Institutional Animal Care and Use Committee approval is not needed. Dog owners from all dogs included in the healthy and disease comparisons consented to having their pet’s feces collected and stored for research purposes.
Healthy pet dogs (H; n = 109) were recruited via emails to staff and students at Texas A&M University in October 2018, August 2021, and January 2024. Dogs were screened via an owner-completed questionnaire. If overt illness was not determined, dogs were scheduled for an appointment for a blood draw and a veterinarian physical exam. The complete blood count (CBC), serum biochemistry, triglycerides, cobalamin, folate, pancreatic lipase immunoreactivity, trypsin-like immunoreactivity, and dysbiosis index were evaluated. Exclusion criteria included clinical abnormalities on the physical exam or bloodwork, a dysbiosis index > 2, GI signs like diarrhea or vomiting, and antibiotic use in the previous 6 months. Samples collected in this group were approved by the TAMU Institutional Animal Care and Use Committee (animal use protocol 2018-0112, 2020-0061, and 2023-0187). Owners were instructed to freeze feces immediately after collection; however, if feces were collected on site, they were placed in 4 °C for no longer than 24 h prior to aliquoting.
Additional healthy pet dogs (n = 12) were also recruited during screening to potentially become fecal transplant donors at Evidensia Specialist Animal Hospital in Sweden in 2019–2020. All dogs had a canine inflammatory bowel disease activity index (CIBDAI; [45]) below 3, were free of parasites (fecal flotation and Giardia SNAP), and had a BCS between 4 and 6 out of 9. The majority had also been screened by measurements of serum cobalamin and albumin concentrations. Exclusion criteria included clinical abnormalities on the physical exam or bloodwork, a dysbiosis index > 2, GI signs like diarrhea or vomiting, and antibiotic use in the previous 6 months. Naturally voided fecal samples were collected and stored at −80 °C, then shipped to Texas A&M frozen on dry ice where they were stored at −80 °C upon arrival.
Pet dogs with chronic enteropathy (CE; n = 47) were seen at the same clinical practice in Sweden from 2019 to 2023, and fecal samples were stored and shipped under the same conditions. These dogs had GI signs for more than 3 weeks, and extraintestinal causes of disease, endoparasitism, and infectious causes of enteritis were ruled out. All dogs had failed to respond to a dietary trial of a hydrolyzed commercial dog food for 4 weeks, and none of these dogs had been treated with antibiotics in the previous 6 months. In total, 43 out of 47 dogs were on immunosuppressive therapy at the time of sampling. Institutional ethical approval was not needed for most dogs since only spontaneously voided feces were collected for the study. A few dogs went on to participate in a prospective FMT study—the Uppsala Animal Ethics Committee approval number is 5.8.18-13877/2021.
More pet dogs with CE (n = 11) were retrospectively included from a study at Texas A&M University between 2014 and 2020. These dogs had GI signs for more than 3 weeks, and extraintestinal causes of disease, endoparasitism, and infectious causes of enteritis were ruled out. The dogs underwent GI biopsy sampling as part of their clinical workup. None of the dogs had received antibiotics in the 5 months prior to fecal collection. Three dogs were on immunosuppressive therapy at the time of sampling. Two dogs were able to be classified as having food-responsive enteropathy, six as steroid-responsive enteropathy, and three were lost to follow-up, and no classification based on response was able to be made. Samples collected in this group were approved by the TAMU Institutional Animal Care and Use Committee (animal use protocol 2012-083 A and 2018-0047). Owners and veterinarians were instructed to freeze feces immediately after collection and ship them on an ice pack overnight to Texas A&M University, where they were frozen at −80 °C upon arrival.
The dry matter percentages of fecal samples were obtained by taking aliquots of 100 to 500 mg of fresh feces and lyophilizing at −80 °C for 16–24 h or overnight.

2.4. Sample Extraction Protocol for Bile Acid Analysis

Aliquots of 100 mg (±10 mg) of fresh feces were placed into 2 mL screw cap polypropylene tubes, and 300 µL of methanol and 40 µL of internal standard mixture were added. Samples were placed on Fisherbrand Bead Mill 24 (speed = 6 m/s, cycle = 1) for 2 min. Then, samples were centrifuged at 16,000× g for 10 min at 4 °C. All supernatants were transferred to a clean 1.5 mL microcentrifuge tube and centrifuged again at 10,000× g for 5 min at 4 °C. All supernatants were transferred to new, clean 1.5 mL microcentrifuge tubes, being careful to avoid disrupting the pellet. Next, 5 µL of supernatant was combined with 295 µL of methanol and vortexed, then 80 µL was transferred to an autosampler vial for the first diluted injection. A second set of autosampler vials was prepared with 80 µL of the undiluted samples for the undiluted injections. Both diluted and undiluted sets were injected at 3 µL.

2.5. LC-MS/MS Analysis

Samples were placed in a thermostatically controlled autosampler at 6 °C (Agilent Infinity II Multisampler, Agilent Technologies, Santa Clara, CA, USA) for injection with multi-wash mode enabled and an inline filter frit (0.2 µm) installed after the injector port. The system was plumbed according to Figure 1. For the first two minutes after injection, analytes were flowing forward onto the SPE column (Agilent InfinityLab Poroshell 120 EC-C18 4.6 × 5 mm, 4 µm) and salts were flowing through to waste. At 2 min, the 2-position 6-port valve within the column compartment switched position, at which point the analytes were pushed in the reverse direction off the SPE column onto the analytical column (Agilent InfinityLab Poroshell 120 EC-C18 2.1 × 100 mm, 2.7 µm) by the 1290 binary pump (Agilent). The valve switched positions again at 8 min to provide a high organic wash and re-equilibrium to the SPE column by the 1260 binary pump. Both columns were housed within the column compartment and maintained at 30 °C and 40 °C for the SPE and analytical column, respectively. For the 1260 pump, mobile phase A consisted of 5% acetonitrile with 0.1% formic acid, and mobile phase B was 1:1 of isopropanol/acetonitrile (v:v). The 1290 pump mobile phase A consisted of 0.1% formic acid water, and mobile phase B was 25% acetonitrile and 75% methanol with 0.1% formic acid. The method gradient timetables with flow rates are provided in Table 1. The total run time from injection to injection was approximately 21 min.
Data were collected on an Agilent 6470B triple quadrupole in dynamic multiple reaction monitoring (dMRM) mode utilizing transitions obtained in Agilent MassHunter Workstation Optimizer software (v.10.1.67) when injecting pure stock solutions (0.8 µg/mL of methanol) for each compound. An electrospray ionization source was installed, and positive and negative mode switching were utilized in the method. Following source optimization, source conditions were set to the following: a gas temperature of 300 °C, a gas flow of 9 L/min, a nebulizer at 25 psi, a sheath gas temperature of 350 °C, a sheath gas flow of 11 L/min, a capillary voltage of 3500 and 4000 V (+ and − mode, respectively), and a nozzle voltage of 300 and 1500 V (+ and − mode, respectively).
The transitions, fragment voltage, collision energy, retention time, and internal standard for each compound are listed in Table S3. Bile acids were quantitated with the use of the internal standards of d4-glycocholic acid and d4-glycolithocholic acid. Four other deuterated BAs were used as retention time calibrators (d4-cholic acid, d4-lithocholic acid, d4-taurocholic acid, and d4-taurolithocholic acid) due to their frequent suppression by large concentrations of their un-deuterated endogenous counterparts.

2.6. Post-Acquisition Data Processing

Any samples in which internal standards fell below two standard deviations of the mean were re-injected. Concentrations calculated in MassHunter Quant v.10.0 were exported to Excel, where results were adjusted for the lower limits of quantitation (LLOQ), the upper limits of quantitation (ULOQ), starting weight, and fecal dry matter. Any resulting concentrations that fell below the LLOQ were adjusted to one-half LLOQ prior to adjusting for fecal weight and dry matter. Any resulting concentrations that fell above the ULOQ were adjusted to the ULOQ plus one prior to adjusting for fecal weight and dry matter. Results for BAs calibrated with the diluted standard curve (standard B) were taken from the diluted injection run unless this value fell below the LLOQ, in which case the concentration from the undiluted extract was utilized.

2.7. Method Optimization and Validation

The method was analytically validated utilizing ICH guideline M10 for bioanalytical method validation [46] and the guidelines described in the white paper by Fernandez-Metzler et al. [47]. The method was evaluated for carryover, selectivity, stability, dilution, spiking, matrix effect, intra- and inter-day precision, biological variability, and long-term continuity.

2.7.1. Carryover and Selectivity

A series of three methanol blanks was injected following the injection of the highest concentration standard to measure carryover. Selectivity and specificity were evaluated by comparing chromatographic peaks in extracted fecal samples, zero blanks (IS only), double blanks (methanol only), and standards. Where two or more analytes coeluted, those analytes were also injected individually as standards at 800 ng/mL.

2.7.2. Stability

The stability of stock solutions stored at −20 °C was indirectly evaluated by comparing the peak areas of analytes and internal standards in standard curves run over 1.5 years. The standard mixes for analytes were evaluated by comparing the peak areas of analytes in standards prepared and kept at 4 °C for 9 months (internal standard prepared and stored separately for the same duration and conditions). The stability of the internal standards was monitored by comparing peak areas in all samples across all batches.
Autosampler stability (6 °C) was tested by the re-injection of 6 samples at 24, 48, and 72 h. The stability of sample extracts was further tested by storage conditions: at 4 °C for 72 h and 1 week; −20 °C for 1, 2, and 4 weeks; −80 °C for 4 weeks.
Biological stability was tested by collecting naturally voided fresh feces from 5 dogs, homogenizing each with a THINKY mixer (model ARM-310, THINKY U.S.A., Inc., Laguna Hills, CA, USA), making several aliquots to undergo different storage conditions, and extracting one on the same day as the collection for a baseline measurement. The storage conditions of 4 °C (24 h and 1 week), −20 °C (24 h and 1 week), and −80 °C (24 h and 1 week), and 3 freeze–thaw cycles were compared to baseline.

2.7.3. Fecal Volume Optimization and Dilution

Well-homogenized leftover fecal samples from 6 dogs (2 resembling healthy BA profiles, 2 in the middle, and 2 resembling disease BA profiles) were aliquoted to test the effect of fecal volume: 3 aliquots of 50 mg, 3 aliquots of 100 mg, and 3 aliquots of 200 mg were prepared for each dog. Subsequently, 50 mg aliquots were extracted with half extraction volumes and the IS as described in the method, 100 mg aliquots were extracted as described in the method, and 200 mg aliquots were extracted with double extraction volumes and the IS as described in the method.
From the same 6 dog samples, one 50 mg and one 100 mg aliquot were made and extracted following the sample extraction protocol in Section 2.4. Observed-to-expected percentages (OE%) were calculated using the concentrations obtained in 100 mg aliquots as expected values.

2.7.4. Spiking

From the same 6 dog samples, three more 100 mg aliquots were made and extracted together with the dilution aliquots. In total, 300 µL of standard A level 11, 7, and 3 was added in place of the 300 µL methanol to set 1, 2, and 3, respectively. The observed-to-expected ratio was calculated for the concentration of each BA in the liquid that was injected with the expected value adjusted based on the starting weight of the feces:
O E % = o b s e r v e d   s p i k e d ÷ ( u n s p i k e × w e i g h t   s p i k e d w e i g h t   u n s p i k e d + s p i k e   a d d e d ) × 100

2.7.5. Intra- and Inter-Day Precision

For intra-assay variability, the extracts from the 6 dogs indicated previously were made and injected 5 times in a row. For inter-assay variability, extracts were held in the autosampler and re-injected after approximately 1 and 4 days. The coefficient of variation (CV%) was calculated for each BA.

2.8. Statistical Analysis

Statistical analysis was performed using GraphPad Prism v.10.3.0. Friedman tests were used to compare repeated measures data for three or more groups, such as stability, with post hoc Dunn’s multiple comparisons to baseline. The Wilcoxon test was used for comparing stability, in which there were two timepoints. Mann–Whitney tests with the Benjamini–Hochberg procedure for multiple comparisons to adjust for the false discovery rate were performed to compare BA concentrations between healthy and chronic enteropathy groups. This non-parametric test utilizes comparing ranks between two independent groups to assess for differences in medians. The statistical significance was set at q = 0.05.

3. Results

3.1. Method Optimization and Validation

The Agilent EC-C18 columns were selected for the best resolution of analytes that shared common transitions. An Agilent SB-C18 analytical column with similar dimensions and pore size did not provide an optimal resolution of the analytes.
Standards were evaluated at 15 concentration levels, and the best fit curves were calculated in Agilent MH Quant software (v.10.0). The curve fits were chosen to optimize the levels falling within the biological range of concentrations. LLOQs were determined based on the lowest level, where the observed concentration was within 20% of what was expected, and the signal-to-noise ratio was ≥10. ULOQs were determined based on the highest level, where the observed concentration was within 20% of the expected concentration. The quantitation range was from 2.7 pg to 176.5 ng on the column.
With the on-line SPE column in use, the analytical column did not lose resolution, and the pressures and retention times remained stable after more than 4500 injections. The use of on-line SPE should reduce the levels of inorganic salts and lipids going into the analytical column and prolong its lifespan. After two years of use of this assay, any pressure increases in the system were remedied by changing the inline filter frit or the SPE column. The rotor seal in the switching valve that rotates twice for each injection may experience higher than average wear, but each is rated for 30,000 switches.

3.1.1. Carryover and Selectivity

Peak areas in the methanol blanks following the injection of the highest concentration standard did not exceed 0.1% of the peak area of that in the standard.
In zero blanks containing only IS, the peak areas for the unlabeled counterparts were less than 20% of the peak areas measured in the LLOQ, with the exception of CA, CDCA, GCA, GLCA, and LCA, which ranged from 75 to 94%. The peak areas for most analytes in double blank were below a 20% LLOQ, with 3oxo-CDCA, 3oxo-DCA, GCDCA, GUDCA, and iso-DCA falling between 20 and 30%; GDCA was 55%, and TLCA was 93%. The IS peak areas in the double blank were less than 0.03% of the IS response in the LLOQ. Individually injected standards (800 ng/mL) did not produce peak areas over a 20% LLOQ for coeluting analytes.
Multiple analytes shared the same transitions. However, these analytes were baseline resolved from each other by the chromatographic method. The addition of methanol to the mobile phase aided in the separation of some isoforms, like allo-LCA and LCA. Fecal samples contained some peaks present near the retention times of the analytes that did not share qualifier ion transitions in the same ratios as the target analyte. These are presumed to be related BA isoforms. In some instances, the isoforms were present in high enough abundance that they would overshadow low-abundance BA target analytes nearby, making them not easily quantifiable. In these cases, the less abundant qualifier transition was switched to the quantifier that was more selective of the target analyte (e.g., iso-CA).
Fecal samples often showed a peak shoulder immediately after TUDCA in the chromatographic results that had similar qualifier peak ratios as TUDCA. However, in the spiking portion of the validation, it became clear that only the earlier peak was representative of TUDCA. Therefore, an effort was made to remove the right shoulder from TUDCA in all results via manual integration.
Iso-CDCA in fecal samples often had low qualifier abundance. Spiking samples with pure iso-CDCA in the spiking study did not change the ratio of the qualifier transition. Therefore, peaks were integrated with or without a qualifier present. By referencing similarities in retention times to other methods, this peak may be coeluting with 3-epideoxycholic acid, which was not obtained as a pure standard for this study [48].

3.1.2. Stability

Standard series prepared from the same stocks (stored at −20 °C) over the course of 1.5 years were analyzed to compare the peak areas of analytes and internal standards. The peak areas did change over time but did not follow the typical patterns of stability, where there is a trend of increasing or decreasing over time. Large changes in peak areas instead coincided with instrument maintenance and cleaning that likely increased the sensitivity of the instrument for a period of time (Figure S2). The results emphasize the importance of running new standard curves any time that significant maintenance is performed. The standard A mix was evaluated after storage at 4 °C for 9 months, and peak areas overall tended to increase (average OE% = 245%). Despite being stored in sealed glass autosampler vials with PTFE-coated lids, this increase may have been due to evaporation. However, it is interesting that two analyte peak areas remained within 20% of their original values (iso-CA and iso-CDCA). The peak areas of the internal standards mixed together and stored for 9 months at 4 °C also increased. When comparing the peak area ratios of analyte to IS, more compounds fell within 20% of their original ratios (Table S4).
The internal standards were stable across all samples in all batches. Peak areas for both did not fall below two standard deviations of the mean for any sample.
Fecal extracts were stable in the glass autosampler vials with punctured caps (6 °C) for up to 72 h. While several BAs showed a statistically significant decrease at the 72 h timepoint (Figure S3), the average coefficient of variation for the six samples remained below 15%, except for allolithocholic acid (Table S5). Fecal extracts stored at 4 °C in 1.5 mL microcentrifuge polypropylene tubes were stable for up to one week. There was a statistically significant decrease for three BAs at the 1-week timepoint; however, the average coefficient of variation for these BAs remained below 15% (Figure S4, Table S6). All BAs had an average coefficient of variation below 15% except for taurolithocholic acid (16.9%) and allolithocholic acid (49.7%). All BAs were stable in fecal extracts when stored at −20 °C for 1 week. Significant decreases in BA concentrations were seen for many species after 2 and 4 weeks under these storage conditions (Figure S5, Table S7). Some BAs remained stable in fecal extracts stored at −80 °C for 4 weeks: 3oxo-CA, 7,12oxo-LCA, 7oxo-DCA, 7oxo-LCA, GCA, GCDCA, HCA, iso-CA, iso-CDCA, UCA, and UDCA. Other BAs showed significant decreases in concentration after 4 weeks of storage at −80 °C (Figure S6, Table S8).
The stability of BAs in fresh feces was tested under different storage conditions and lengths of time typical for clinical samples. Changes were considered significant if the statistical comparison between timepoints was p < 0.05 and if the coefficient of variation between timepoints was greater than 20% (Table S9 and Figure S7). Several BAs increased after one week of storage at 4 °C: 12oxo-LCA, 3oxo-CA, 3oxo-DCA, and 7,12oxo-LCA. The UDCA increased at one week of storage at −80 °C. The LCA increased after one week of storage at −20 °C and −80 °C.

3.1.3. Fecal Volume Optimization and Dilution

The precision of the results at each weight (50, 100, and 200 mg aliquots) was compared. The precision at 100 and 200 mg weights was equivalent. There was only one sample out of six that had a better average precision at 200 mg than 100 mg. The 50 mg aliquots consistently had worse precision but were generally acceptable. Therefore, to keep the sample requirements minimal, 100 mg aliquots were chosen for the study samples.
When comparing concentrations from 50 mg and 100 mg aliquots for the same six dogs, extracted following the normal extraction protocol, the individual OE% for some compounds was poor (Table S10). However, the trends of high or low concentrations relative to the biological range for each compound were consistent. Therefore, using as little as 50 mg (±10 mg) of feces is acceptable if a limited amount of feces is available. However, this is not preferred given the higher biological variability and decreased precision with this aliquot size.

3.1.4. Spiking

The observed-to-expected ratios for spiking are shown in Table S11. 3,7,12oxo-LCA had peak suppression in four out of six samples and enhancement in one out of six samples. Allo-LCA had some peak suppression, especially at lower concentrations. GUDCA, TUDCA, and TDCA may have some peak enhancement in one or more of the samples. All other BAs showed acceptable observed-to-expected values and no clear signs of peak suppression or enhancement across spike levels.

3.1.5. Intra- and Inter-Day Precision

The results are presented in Tables S12 and S13. Precision estimations (CV%) were generally acceptable (<15%) for intra-assay variability with the exception of a few BAs that were present in very low concentrations in dog feces (GLCA, HCA, and TUDCA). The majority of the bile acids also had acceptable precision (<20% CV) for inter-assay variability. However, individual samples fell above 20% CV for some bile acids that were not relatively low in concentration. This may have been due to five and six injections having been performed prior to analysis using autosampler vial caps designed for single use.

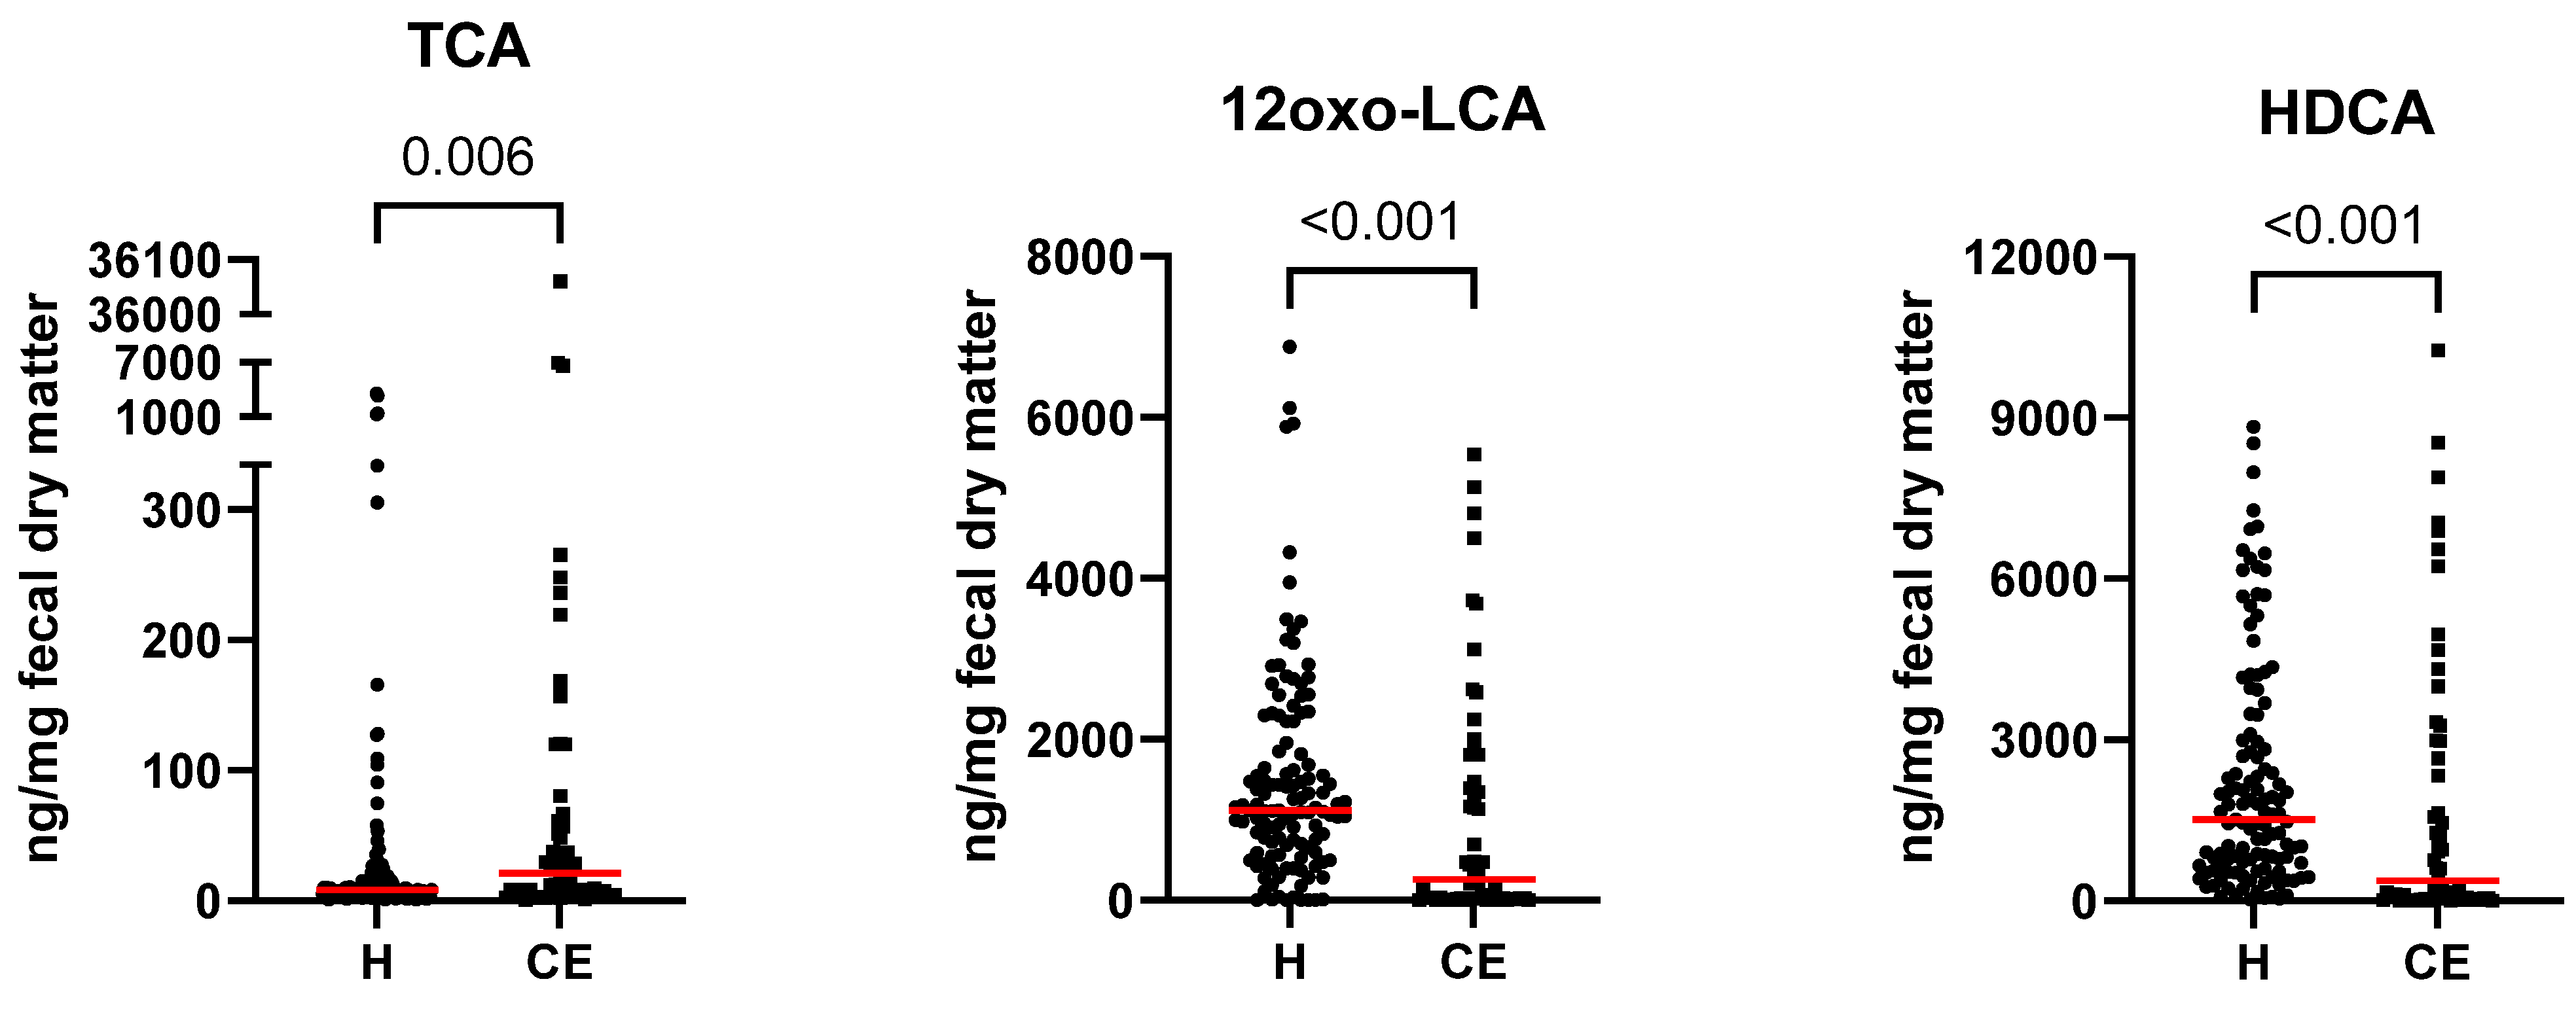
3.2. Fecal Bile Acid Concentrations in Healthy Dogs and Dogs with Chronic Enteropathy

Of the BAs we attempted to quantify in dog feces, only 27 of them were consistently above the quantitation limit. 3,7,12oxo-lithocholic acid, allo-lithocholic acid, and iso-deoxycholic acid were below the LLOQ in over 90% of the canine fecal samples measured with this assay and were therefore not included in the comparisons between healthy dogs and dogs with CE. Fecal BA concentrations are presented in Table 2. Seven BAs were found to have significantly lower concentrations in dogs with CE when compared to healthy dogs (12oxo-LCA, 3oxo-DCA, DCA, GLCA, HCA, HDCA, and iso-CDCA). Ten BAs had significantly higher concentrations in dogs with CE when compared to healthy dogs (3oxo-CA, 7oxo-DCA, 7oxo-LCA, CA, CDCA, GCA, iso-CA, TCA, TUDCA, and UCA).
Across all fecal samples, the products of bacterial hydroxysteroid dehydrogenase reactions (oxo- and iso- BA, ursocholic acid, and ursodeoxycholic acid) made up an average of 30% of the total fecal BA pool. Glycine-conjugated BAs made up an average of 0.1%, taurine-conjugated BAs made up 2.2%, and unconjugated BAs (CA, CDCA, DCA, and LCA) made up 53% of the total bile acid pool.

4. Discussion

In this study, we successfully developed and analytically validated an assay for the measurement of BAs in dog feces. The published guidelines for bioanalytical methods and biomarkers were followed ensuring thoroughness and fit-for-purpose validation [46,47]. The previous studies of BA often use assays that lack partial or complete validation. The matrix effect of feces is not often performed due to a lack of commercially available BA-free canine feces. Charcoal-stripped feces are sometimes used as a surrogate; however, stripping also removes components that could potentially account for a matrix effect and is not recommended. Cai et al. used a standard addition–internal standard method to overcome the matrix effect of feces, but this method involves running each sample with and without standards added to it and uses a point-to-point calibration which assumes that the standard curve is linear throughout its range [13]. Our study found that many BA standard curves behaved in a non-linear fashion. The quantifiable range obtained with dual injections was better than in previous studies and achieved five orders of magnitude for many BAs. On-line SPE has extended the analytical column life to over 4500 injections, which is an improvement over another BA assay that listed the column lifetime as over 1000 injections [38]. Our choice of the mobile phase to include methanol was made for the improved resolution of some BAs. Methanol and formic acid will produce methyl formate over time with storage and will slightly shift the retention times of taurine-conjugated BA. This shift was minimal over 1 week, so this mobile phase was made fresh weekly to reduce the effects on the assay.
The method performed well in carryover and selectivity testing. Injecting sample extracts at two dilutions (one neat and one diluted 1:59 [v:v ratio]) means that the deuterated BA needed to be at high concentrations in the undiluted samples in order to appear in adequate concentrations in the diluted ones. Therefore, there was enough monoisotopic mass of some BAs in the internal standard to appear in the zero blank (CA, GCA, GLCA, and LCA), but all were below the LLOQ. There was also more carryover than is considered ideal (i.e., a less than 20% LLOQ) for seven BAs, but they were all below the LLOQ. The polarity switching capability of the 6470B TQ allowed BAs that ionize better in positive mode (e.g., 12oxo-LCA) to be detected simultaneously with those that ionize better in negative mode (e.g., iso-CDCA). Interestingly, many published methods use only the negative mode, which may limit the sensitivity for those BAs that ionize better in positive mode. We found that some BAs did not fragment well. Lan et al. showed that this is characteristic of unconjugated BAs that lack a 12-hydroxyl group [6]. Fragmentation patterns may help to identify some of the unknown chromatographic peaks that appeared in fecal samples, but pure analyte would be needed to confirm identity. While vendors like Cayman Chemical and ASI Chemicals are expanding their catalog of BAs, some BAs are still not commercially available.
The stability testing of standard stocks revealed that instrument maintenance procedures are more likely to affect response than the long-term storage of the standards at −20 °C. When stored at 4 °C, it is likely that the standards will experience a greater evaporation effect. It is possible that iso-CA and iso-CDCA experienced some degradation when stored in mixtures at 4 °C for 9 months. BAs in fresh feces were most stable if the samples were frozen on the day of collection. When feces were stored at 4 °C for one week, 12oxo-LCA, 3oxo-CA, 3oxo-DCA, and 7,12oxo-LCA increased significantly in concentration, and DCA tended to decrease, though not significantly. This suggests that bacterial enzymes remain active in feces when stored at 4 °C and can affect certain BA concentrations. Human fecal BA testing guidelines suggest freezing fecal samples immediately after collection and measuring them within 30 days [49]. Humbert et al. showed that BAs were stable in human fecal samples stored up to one month at −80 °C but did not test storage at refrigerator or room temperatures due to the high level of bacteria in fecal samples [22]. Further studies should be performed to determine BA stability in feces under typical conditions that are expected for clinical and research collections. Chemical stabilizers like OMNIgene-GUT (DNA Genotek, Inc., Ottawa, ON, Canada) may be a good solution to the stability issue when only relative BA concentrations are needed, but they can cause quantitative differences [50]. BAs in extracted feces were stable for up to one week at 4 °C and −20 °C. Many BAs decreased significantly after 2 or 4 weeks at −20 °C and −80 °C, respectively. Therefore, the long-term storage of fecal extracts using this protocol is not recommended. Although the freeze–thaw cycles of extracts were not tested in this study, a previous study showed that BA recovery decreased with more than one freeze–thaw cycle of extracts [39]. This same study showed that fecal extracts were stable for 24 h at 4 °C but had reduced recoveries after 24 h of storage at room temperature and suggested the use of a chilled autosampler.
The spiking experiments in our study showed that 3,7,12oxo-LCA had peak suppression in four out of six samples and enhancement in one out of six samples, and allo-LCA had some peak suppression. These results may help explain why these two BAs were below the detection limit in most canine fecal samples. 3,7,12oxo-LCA, also known as dehydrocholic acid, is a semisynthetic BA that has been used to treat cholestasis and increase bile output [51]. It is also used as an internal standard in some studies [52,53], but our study provides evidence against doing so for dogs due to a possible endogenous presence and the matrix effect. Allo-lithocholic acid is a hydrophobic “flat” or planar BA that is normally low in concentration or undetectable in healthy adult humans [54], but it has been detected in the feces of humans with colorectal cancer [55] and in the urine from infants with biliary atresia [56]. Centenarians have higher levels of fecal allo-LCA than old and young controls, but there was a less than 5% relative abundance in all study participants [37]. Of the hundreds of dog fecal samples measured with this assay so far, only one has had an allo-LCA concentration significantly above the LLOQ, and it was unclear if the prolonged storage of this sample at 4 °C may have contributed to this finding. More studies are needed to determine the role of planar secondary BAs in health and disease.
Iso-deoxycholic acid (iso-DCA; CAS # 566-17-6) was not detected in any dog fecal samples analyzed with this assay. Iso-DCA, according to the CAS registry and PubChem database, is a C24 BA with α-hydroxy groups at positions C7 and C12. There is an unfortunate naming discrepancy within the literature where many studies have measured what they describe as iso-DCA, but which is more accurately 3-epideoxycholic acid (3-EDCA), with a β-hydroxy group at C3 and an α-hydroxy group at C12 [57,58,59,60,61,62]. 3-EDCA is highly abundant in healthy human cecal contents [63] and is also relatively abundant in human and dog feces [26]. Devlin and Fischbach showed that 3-EDCA has less detergent activity and causes less cell damage than its precursor deoxycholic acid, presenting a detoxification pathway [62]. One previous study showed difficulty in separating iso-CDCA and 3-EDCA on a C18 column in LC analyses [63]. We theorized that 3-EDCA might be coeluting with iso-CDCA but might be differentiated by fragmentation patterns. However, the current precursor and product ions that we use for quantifying iso-CDCA in this method could not have differentiated iso-CDCA and 3-EDCA. Therefore, further experiments should be completed to confirm the selectivity of the method for iso-CDCA in particular.
Our comparison of fecal BA profiles in healthy dogs and dogs with CE had similar results to previous studies in dogs [5]. However, with the inclusion of conjugated BA species as well as iso- and oxo-BA, we can begin to gain a deeper understanding of the various metabolic pathways of BAs in the GI tract.
Similarly to previous studies, we found concentrations of glycine-conjugated BA to be very low in dog feces, averaging 0.1% of the total fecal BA pool and ranging from 0.0 to 0.6% across all dogs [64]. Taurine-conjugated BAs were also generally low in concentration (average = 2.2% BA pool), but some were higher in concentration in dogs with CE, with TCA exceeding 30,000 ng per mg of fecal dry matter in one dog (Figure 2). The absorption of conjugated BA occurs mainly in the ileum via active transport through apical sodium-dependent bile acid transporters (ASBTs). The expression of these transporters is decreased in dogs with CE [65] and therefore may lead to an excess of conjugated BAs available for bacterial transformations within the intestinal lumen.
Dogs with CE had a lower proportion of fecal secondary BAs when compared to healthy dogs (Figure 3), where the proportion of secondary BAs is defined as (DCA + LCA)/(DCA + LCA + CA + CDCA) × 100%. CA and CDCA are converted to DCA and LCA, respectively, via bile acid-inducible (bai) genes encoding enzymes that catalyze 7α-dehydroxylation reactions in intestinal bacteria. Our results align with previous studies in dogs with GI disease that also show a lower abundance of P. hiranonis, the main 7α-dehydroxylating bacteria in dogs [42,65,66,67]. In humans with inflammatory bowel disease, a subset has shown deficiency in fecal secondary BAs, which was largely explained by decreased bai operon abundance [68]. Interestingly, we observed a similar pattern in dogs with CE, where the majority of them have either a high (>80%) or low (<20%) proportion of secondary BAs with very few falling in between. Peterson et al. suggested a threshold effect of the bai genes on secondary BA proportions, which may help explain their bimodal appearance [68].
Interestingly, after evaluating metabolic pathways and noting which BAs along these pathways were increased or decreased in dogs with CE, some pathways clearly stand out (Figure 4). Similarly to what Lin et al. reported in dogs and humans, we observed that CA metabolism pathways were more prevalent in dogs than CDCA metabolism pathways [26]. Cholic acid becomes the second most abundant BA in dogs with CE, and its downstream products of hydroxysteroid dehydrogenase (HSDH) enzymes are also increased. Taurocholic acid and glycocholic acid are also higher in fecal concentrations in dogs with CE. In contrast, DCA, the product of 7α-dehydroxylation of CA, was significantly lower in dogs with CE, and its HSDH downstream products were also lower. This appears to show a bottleneck in the 7α-dehydroxylation process that affects the generally more abundant CA and its metabolites. The enzymes for 7α-dehydroxylation are the least conserved across bacterial species when compared to BSH and HSDH enzymes [1]. Therefore, it is conceivable that this pathway of BA transformation would be most impacted by large changes in the gut microbiota, as is seen in dogs with CE [67,69,70].
BA products of HSDH enzyme activity, including many oxo- and iso-BAs, made up a large portion of the fecal BA pool in dogs, averaging to 30% across all dogs and ranging from 0.2 to 88%. We found 12oxo-LCA to be the most abundant oxo-BA in healthy dogs (Table 2, Figure 2), similar to previous studies that found it to be roughly 4-9% of the total fecal BA pool [15,31]. The transformation of BAs by bacterial HSDH enzymes may be a detoxification pathway since those with β-oriented hydroxyl groups are typically less hydrophobic and therefore less cytotoxic [71,72]. There is some new evidence of oxo- and iso-BAs acting as signaling molecules to various receptors in the GI tract (FXR, VDR, and PXR) as well as in other body systems (RORγt) [73]. More studies are needed to determine if they play an active role in health or disease.
The finding of decreased levels of iso-CDCA in dogs with CE was surprising. Given that the chance of coelution with 3-EDCA and the likelihood that 3-EDCA is decreased in dogs with CE because its precursor DCA is decreased, pure 3-EDCA should be evaluated in the current method to confirm selectivity. No conclusions should be drawn about iso-CDCA levels in dogs until selectivity is confirmed. It is important to show, however, that this type of selectivity error may be common in assays for compounds, such as bile acids, that are nearly identical in chemical structure and mass. It is unlikely that all potential BA isoforms will be purchased or isolated and then purified to pure stock in any single publication, so the chance of perfect selectivity of an assay is low. The methods of deconvoluting peaks typically used in untargeted metabolomics analysis may aid in separating out unidentified peaks if retention times and product ion spectra are different enough to do so.
Additionally, we were surprised to find that HDCA was the second most abundant BA in healthy dogs with a median concentration of 1517 ng/mg of fecal dry matter (Table 2, Figure 2). One study in dogs found HDCA to be approximately 2% of the fecal BA pool in 10 healthy dogs, but no information was provided on the animals’ living conditions or assessment of health [31]. Comito et al. measured a panel of BA in dogs (16 healthy and 16 with CE), and all were below the detection limit for HDCA [15]. Rhimi et al. also measured fecal HDCA in a cohort of 32 semi-stray dogs, and concentrations in all the measured fecal samples were below 100 nmol/g of feces, the equivalent to roughly 50–200 ng/mg of fecal dry matter, depending on the water content of the feces [74]. HDCA is a C3 and C6 α-hydroxylated BA that is formed in rodents from bacterial enzymatic action on muricholic acid (MCA) and hyocholic acid [75,76]. In humans, there is some evidence that HDCA can be synthesized from LCA via CYP3A4-mediated pathways in liver microsomes, but it is also positively associated with some Clostridia species in the gut [77]. MCA is a potential precursor for HDCA in dogs, but there are very few studies quantifying MCA in dog feces. Comito et al. measured α- and β-MCA in healthy dogs, and both had relatively low fecal concentrations (median 0.3 µg/g and 0.01 µg/g of wet feces for α- and β-MCA, respectively). Conversely, looking at the data repository from another study, it appears that some dogs had relatively high concentrations of MCA [42]. In an unpublished pilot study from our lab, various strains of P. hiranonis isolated from dogs were co-cultured with physiological concentrations of bile acids, where many appeared to produce HDCA when cultured with CDCA but not CA. HDCA had anti-inflammatory properties in a mouse model of sepsis via the inhibition of inflammatory signaling from lipopolysaccharide [78]. The pathway of HDCA production in dogs, as well as its physiological importance, deserves more attention due to its potential as a future therapeutic target for disease, as well as its highly abundant nature in the feces of healthy dogs.
There are several important limitations to this study. Some fecal samples collected on site were stored at 4 °C for no longer than 24 h prior to aliquoting. While there were no significant differences in individual BA concentrations in the stability testing of this storage condition, bacterial enzymes that are present in the feces remain active. The proportion of secondary BA and overall BA metabolism pathway information was not affected by short-term storage at 4 °C. However, prolonged storage at 4 °C for one week did affect the concentrations of some individual BAs. Our recommendation moving forward is to freeze fecal samples as soon as possible after collection for BA quantification and to keep samples cool during aliquoting. Another limitation is that not all possible BA species were measured in this assay, with some of the BAs that were measured not being detected in any study samples. α- and β-MCA could not be reliably added to this chromatographic method because they eluted very closely to iso-CA, which has the same precursor ion. α- and β-MCA do not fragment well due to their lack of a hydroxy group at the 12-carbon position [6], and iso-CA contributed to the pseudo-transition of 407→407 during development. α-MCA also coeluted with 7oxo-DCA, an abundant BA in dogs with CE, which may cause ionization issues with the presumably less abundant α-MCA [15].

5. Conclusions

In this study, an assay for the quantitative measurement of BAs in dog feces was analytically validated and utilized in a cohort of 179 dogs. Utilizing on-line SPE extended the analytical column lifetime to over 4500 injections and aided in a minimal sample processing time, amenable to high throughput. Glycine-conjugated internal standards and dual injections were used to successfully quantitate 29 BAs, 16 of which were significantly different between healthy dogs and dogs with chronic enteropathy.

Supplementary Materials

The following supporting information can be downloaded at: https://www.mdpi.com/article/10.3390/pets2020018/s1, Table S1: List of bile acids with their CAS numbers, vendors, and structural information; Figure S1: Structures of bile acids used in the assay; Table S2: Concentrations of each standard level prior to extraction; Table S3: Transitions, fragment voltages, collision energy, retention time, and internal standard for each bile acid; Figure S2: Stability of stock solutions; Table S4: Observed-to-expected ratios of peak areas and peak area/internal standard peak area ratios in standard A mix stored for 9 months at 4 °C; Figure S3: Autosampler stability of fecal extract at 6 °C; Table S5: Autosampler stability of fecal extract at 6 °C; Figure S4: Stability of fecal extract at 4 °C at 72 h and 1 week; Table S6: Stability of fecal extracts at 4 °C; Figure S5: Stability of fecal extracts at −20 °C for 1, 2, and 4 weeks; Table S7: Stability of fecal extracts at −20 °C for 1, 2, and 4 weeks; Figure S6: Stability of fecal extracts at −80 °C for 4 weeks; Table S8: Stability of fecal extracts at −80 °C for 4 weeks; Figure S7: Biological stability of bile acids in fresh feces at baseline and after storage at the following conditions: 24 h and 1-week storage at 4 °C, 24 h and 1-week storage at −20 °C, 24 h and 1-week storage at −80 °C, and after three freeze–thaw cycles; Table S9: Biological stability of bile acids in fresh feces at baseline and after storage at the following conditions: 24 h and 1-week storage at 4 °C, 24 h and 1-week storage at −20 °C, 24 h and 1-week storage at −80 °C, and after three freeze–thaw cycles; Table S10: Fecal dilution results comparing 50 mg aliquots and 100 mg aliquots; Table S11: Spiking results for bile acids in fecal samples from 6 dogs; Table S12: Intra-assay variability on five sequential injections for 6 canine fecal sample extracts; Table S13: Inter-assay variability with 6 canine fecal extracts injected on three different days.

Author Contributions

Conceptualization, A.B.B. and J.S.S.; Data Curation, A.B.B., L.C.T., C.-C.C., P.E.I., R.K.P., P.R.G. and J.P.C.; Formal Analysis, A.B.B.; Funding Acquisition, P.R.G., J.P.C., J.A.L. and J.S.S.; Investigation, A.B.B.; Methodology, A.B.B.; Project Administration, P.R.G., J.A.L. and J.S.S.; Resources, A.B.B., L.C.T., C.-C.C., P.E.I. and R.K.P.; Software, A.B.B.; Supervision, J.S.S.; Validation, A.B.B. and C.-C.C.; Visualization, A.B.B.; Writing—Original Draft, A.B.B.; Writing—Review and Editing, A.B.B., L.C.T., C.-C.C., R.K.P., P.R.G., J.P.C., J.A.L. and J.S.S. All authors have read and agreed to the published version of the manuscript.

Funding

The purchase of Agilent Technologies LC devices was partially funded by Agilent Global Academic Research Support Program, RSP approval ID 2021387. J.S. is the Purina PetCare Endowed Chair for Microbiome Research and received support for microbiome studies through the Purina PetCare Research Excellence Fund.

Institutional Review Board Statement

The animal study protocol was approved by the Institutional Animal Care and Use Committee of Texas A&M University (animal use protocol 2018-0112, 2020-0061, 2023-0187, 2012-083 A, and 2018-0047) and the Uppsala Animal Ethics Committee (approval number 5.8.18-13877/2021) for studies involving animals. Institutional ethical approval was not needed for dogs that had only naturally passed feces collected for the purpose of the study.

Informed Consent Statement

Informed owner consent was obtained for all animals involved in the study.

Data Availability Statement

The original contributions presented in this study are included in the article/Supplementary Material. Further inquiries can be directed to the corresponding author(s).

Acknowledgments

The authors thank the members of Agilent Technologies who gave technical and purchasing support, including but not limited to: Andy Geishen, Sheher Mohsin, Graham Oltjen, and Björn Ogren. The authors also thank members of the Gastrointestinal Laboratory: Rhonda Rosa and Sarah Read, who provided administrative support; and student workers and technicians (Jake Chaconas, Maddie Perez, Madeleine Vega, Gabrielle Sakel, Daniel Lonowski, and Christi Shirley), who provided general support in the Metabolomics laboratory and with inventory and aliquoting.

Conflicts of Interest

Authors are currently employed (or were employed during the sample collection or analysis phases) by the Gastrointestinal Laboratory at Texas A&M University which provides veterinary diagnostic and research assays on a fee-for-service basis.

References

  1. Fiorucci, S.; Carino, A.; Baldoni, M.; Santucci, L.; Costanzi, E.; Graziosi, L.; Distrutti, E.; Biagioli, M. Bile acid signaling in inflammatory bowel diseases. Dig. Dis. Sci. 2021, 66, 674–693. [Google Scholar] [CrossRef] [PubMed]
  2. Heinken, A.; Ravcheev, D.A.; Baldini, F.; Heirendt, L.; Fleming, R.M.T.; Thiele, I. Systematic assessment of secondary bile acid metabolism in gut microbes reveals distinct metabolic capabilities in inflammatory bowel disease. Microbiome 2019, 7, 75. [Google Scholar] [CrossRef] [PubMed]
  3. Ridlon, J.M.; Harris, S.C.; Bhowmik, S.; Kang, D.J.; Hylemon, P.B. Consequences of bile salt biotransformations by intestinal bacteria. Gut Microbes 2016, 7, 22–39. [Google Scholar] [CrossRef]
  4. Batta, A.; Salen, G.; Arora, R.; Shefer, S.; Batta, M.; Person, A. Side chain conjugation prevents bacterial 7-dehydroxylation of bile acids. J. Biol. Chem. 1990, 265, 10925–10928. [Google Scholar] [CrossRef]
  5. Rowe, J.C.; Winston, J.A. Collaborative metabolism: Gut microbes play a key role in canine and feline bile acid metabolism. Vet. Sci. 2024, 11, 94. [Google Scholar] [CrossRef]
  6. Lan, K.; Su, M.; Xie, G.; Ferslew, B.C.; Brouwer, K.L.R.; Rajani, C.; Liu, C.; Jia, W. Key role for the 12-hydroxy group in the negative ion fragmentation of unconjugated c24 bile acids. Anal. Chem. 2016, 88, 7041–7048. [Google Scholar] [CrossRef]
  7. Fleishman, J.S.; Kumar, S. Bile acid metabolism and signaling in health and disease: Molecular mechanisms and therapeutic targets. Signal Transduct. Target. Ther. 2024, 9, 97. [Google Scholar] [CrossRef]
  8. Wang, H.; Chen, J.; Hollister, K.; Sowers, L.C.; Forman, B.M. Endogenous bile acids are ligands for the nuclear receptor fxr/bar. Mol. Cell 1999, 3, 543–553. [Google Scholar] [CrossRef]
  9. Jadhav, K.; Xu, Y.; Xu, Y.; Li, Y.; Xu, J.; Zhu, Y.; Adorini, L.; Lee, Y.K.; Kasumov, T.; Yin, L.; et al. Reversal of metabolic disorders by pharmacological activation of bile acid receptors TGR5 and FXR. Mol. Metab. 2018, 9, 131–140. [Google Scholar] [CrossRef]
  10. Copple, B.L.; Li, T. Pharmacology of bile acid receptors: Evolution of bile acids from simple detergents to complex signaling molecules. Pharmacol. Res. 2016, 104, 9–21. [Google Scholar] [CrossRef]
  11. Jergens, A.E.; Heilmann, R.M. Canine chronic enteropathy-current state-of-the-art and emerging concepts. Front. Vet. Sci. 2022, 9, 923013. [Google Scholar] [CrossRef] [PubMed]
  12. Bromke, M.A.; Krzystek-Korpacka, M. Bile acid signaling in inflammatory bowel disease. Int. J. Mol. Sci. 2021, 22, 9096. [Google Scholar] [CrossRef] [PubMed]
  13. Cai, X.; Liu, Y.; Zhou, X.; Navaneethan, U.; Shen, B.; Guo, B. An lc-esi-ms method for the quantitative analysis of bile acids composition in fecal materials. Biomed. Chromatogr. 2012, 26, 101–108. [Google Scholar] [CrossRef] [PubMed]
  14. Choucair, I.; Nemet, I.; Li, L.; Cole, M.A.; Skye, S.M.; Kirsop, J.D.; Fischbach, M.A.; Gogonea, V.; Brown, J.M.; Tang, W.H.W.; et al. Quantification of bile acids: A mass spectrometry platform for studying gut microbe connection to metabolic diseases. J. Lipid Res. 2020, 61, 159–177. [Google Scholar] [CrossRef]
  15. Comito, R.; Porru, E.; Interino, N.; Conti, M.; Terragni, R.; Gotti, R.; Candela, M.; Simoni, P.; Roda, A.; Fiori, J. Metabolic bile acid profile impairments in dogs affected by chronic inflammatory enteropathy. Metabolites 2023, 13, 980. [Google Scholar] [CrossRef]
  16. Dewaele, D.; Annaert, P.; Hoeben, E. Lc-ms/ms analysis of bile acids in in vitro samples. In Methods in Molecular Biology; Humana Press: New York, NY, USA, 2019; Volume 1981, pp. 15–23. [Google Scholar] [CrossRef]
  17. Farhat, Z.; Sampson, J.N.; Hildesheim, A.; Safaeian, M.; Porras, C.; Cortés, B.; Herrero, R.; Romero, B.; Vogtmann, E.; Sinha, R.; et al. Reproducibility, temporal variability, and concordance of serum and fecal bile acids and short chain fatty acids in a population-based study. Cancer Epidemiol. Biomark. Prev. 2021, 30, 1875–1883. [Google Scholar] [CrossRef]
  18. Franco, P.; Porru, E.; Fiori, J.; Gioiello, A.; Cerra, B.; Roda, G.; Caliceti, C.; Simoni, P.; Roda, A. Identification and quantification of oxo-bile acids in human faeces with liquid chromatography–mass spectrometry: A potent tool for human gut acidic sterolbiome studies. J. Chromatogr. A 2019, 1585, 70–81. [Google Scholar] [CrossRef]
  19. Gómez, C.; Stücheli, S.; Kratschmar, D.V.; Bouitbir, J.; Odermatt, A. Development and validation of a highly sensitive lc-ms/ms method for the analysis of bile acids in serum, plasma, and liver tissue samples. Metabolites 2020, 10, 282. [Google Scholar] [CrossRef]
  20. Hagio, M.; Matsumoto, M.; Fukushima, M.; Hara, H.; Ishizuka, S. Improved analysis of bile acids in tissues and intestinal contents of rats using lc/esi-ms. J. Lipid Res. 2009, 50, 173–180. [Google Scholar] [CrossRef]
  21. Herstad, K.M.V.; Rønning, H.T.; Bakke, A.M.; Moe, L.; Skancke, E. Changes in the faecal bile acid profile in dogs fed dry food vs high content of beef: A pilot study. Acta Vet. Scand. 2018, 60, 29. [Google Scholar] [CrossRef]
  22. Humbert, L.; Maubert, M.A.; Wolf, C.; Duboc, H.; Mahé, M.; Farabos, D.; Seksik, P.; Mallet, J.M.; Trugnan, G.; Masliah, J.; et al. Bile acid profiling in human biological samples: Comparison of extraction procedures and application to normal and cholestatic patients. J. Chromatogr. B Anal. Technol. Biomed. Life Sci. 2012, 899, 135–145. [Google Scholar] [CrossRef] [PubMed]
  23. John, C.; Werner, P.; Worthmann, A.; Wegner, K.; Tödter, K.; Scheja, L.; Rohn, S.; Heeren, J.; Fischer, M. A liquid chromatography-tandem mass spectrometry-based method for the simultaneous determination of hydroxy sterols and bile acids. J. Chromatogr. A 2014, 1371, 184–195. [Google Scholar] [CrossRef] [PubMed]
  24. Krautbauer, S.; Liebisch, G. Lc-ms/ms analysis of bile acids. In Methods in Molecular Biology; Humana Press: New York, NY, USA, 2018; Volume 1730, pp. 103–110. [Google Scholar] [CrossRef]
  25. Lee, J.W.; Cowley, E.S.; Wolf, P.G.; Doden, H.L.; Murai, T.; Caicedo, K.Y.O.; Ly, L.K.; Sun, F.; Takei, H.; Nittono, H.; et al. Formation of secondary allo-bile acids by novel enzymes from gut firmicutes. Gut Microbes 2022, 14, 2132903. [Google Scholar] [CrossRef] [PubMed]
  26. Lin, Q.; Tan, X.; Wang, W.; Zeng, W.; Gui, L.; Su, M.; Liu, C.; Jia, W.; Xu, L.; Lan, K. Species differences of bile acid redox metabolism: Tertiary oxidation of deoxycholate is conserved in preclinical animals. Drug Metab. Dispos. 2020, 48, 499–507. [Google Scholar] [CrossRef]
  27. Liu, Y.; Song, Q.; Zheng, J.; Li, J.; Zhao, Y.; Li, C.; Song, Y.; Tu, P. Sensitive profiling of phenols, bile acids, sterols, and eicosanoids in mammalian urine by large volume direct injection-online solid phase extraction-ultra high performance liquid chromatography-polarity switching tandem mass spectrometry. RSC Adv. 2016, 6, 81826–81837. [Google Scholar] [CrossRef]
  28. Marion, S.; Desharnais, L.; Studer, N.; Dong, Y.; Notter, M.D.; Poudel, S.; Menin, L.; Janowczyk, A.; Hettich, R.L.; Hapfelmeier, S.; et al. Biogeography of microbial bile acid transformations along the murine gut. J. Lipid Res. 2020, 61, 1450–1463. [Google Scholar] [CrossRef]
  29. Muto, A.; Takei, H.; Unno, A.; Murai, T.; Kurosawa, T.; Ogawa, S.; Iida, T.; Ikegawa, S.; Mori, J.; Ohtake, A.; et al. Detection of δ4-3-oxo-steroid 5β-reductase deficiency by lc-esi-ms/ms measurement of urinary bile acids. J. Chromatogr. B Anal. Technol. Biomed. Life Sci. 2012, 900, 24–31. [Google Scholar] [CrossRef]
  30. Odermatt, A.; Da Cunha, T.; Penno, C.A.; Chandsawangbhuwana, C.; Reichert, C.; Wolf, A.; Dong, M.; Baker, M.E. Hepatic reduction of the secondary bile acid 7-oxolithocholic acid is mediated by 11β-hydroxysteroid dehydrogenase 1. Biochem. J. 2011, 436, 621–629. [Google Scholar] [CrossRef]
  31. Porru, E.; Scicchitano, D.; Interino, N.; Tavella, T.; Candela, M.; Roda, A.; Fiori, J. Analysis of fecal bile acids and metabolites by high resolution mass spectrometry in farm animals and correlation with microbiota. Sci. Rep. 2022, 12, 2866. [Google Scholar] [CrossRef]
  32. Prinville, V.; Ohlund, L.; Sleno, L. Targeted analysis of 46 bile acids to study the effect of acetaminophen in rat by lc-ms/ms. Metabolites 2020, 10, 26. [Google Scholar] [CrossRef]
  33. Reiter, S.; Dunkel, A.; Metwaly, A.; Panes, J.; Salas, A.; Haller, D.; Hofmann, T. Development of a highly sensitive ultra-high-performance liquid chromatography coupled to electrospray ionization tandem mass spectrometry quantitation method for fecal bile acids and application on crohn’s disease studies. J. Agric. Food Chem. 2021, 69, 5238–5251. [Google Scholar] [CrossRef] [PubMed]
  34. Riethorst, D.; Mols, R.; Duchateau, G.; Tack, J.; Brouwers, J.; Augustijns, P. Characterization of human duodenal fluids in fasted and fed state conditions. J. Pharm. Sci. 2016, 105, 673–681. [Google Scholar] [CrossRef] [PubMed]
  35. Sangaraju, D.; Shi, Y.; Van Parys, M.; Ray, A.; Walker, A.; Caminiti, R.; Milanowski, D.; Jaochico, A.; Dean, B.; Liang, X. Robust and comprehensive targeted metabolomics method for quantification of 50 different primary, secondary, and sulfated bile acids in multiple biological species (human, monkey, rabbit, dog, and rat) and matrices (plasma and urine) using liquid chromatography high resolution mass spectrometry (lc-hrms) analysis. J. Am. Soc. Mass. Spectrom. 2021, 32, 2033–2049. [Google Scholar] [CrossRef] [PubMed]
  36. Sarafian, M.H.; Lewis, M.R.; Pechlivanis, A.; Ralphs, S.; McPhail, M.J.W.; Patel, V.C.; Dumas, M.-E.; Holmes, E.; Nicholson, J.K. Bile acid profiling and quantification in biofluids using ultra-performance liquid chromatography tandem mass spectrometry. Anal. Chem. 2015, 87, 9662–9670. [Google Scholar] [CrossRef]
  37. Sato, Y.; Atarashi, K.; Plichta, D.R.; Arai, Y.; Sasajima, S.; Kearney, S.M.; Suda, W.; Takeshita, K.; Sasaki, T.; Okamoto, S.; et al. Novel bile acid biosynthetic pathways are enriched in the microbiome of centenarians. Nature 2021, 599, 458–464. [Google Scholar] [CrossRef]
  38. Scherer, M.; Gnewuch, C.; Schmitz, G.; Liebisch, G. Rapid quantification of bile acids and their conjugates in serum by liquid chromatography-tandem mass spectrometry. J. Chromatogr. B Anal. Technol. Biomed. Life Sci. 2009, 877, 3920–3925. [Google Scholar] [CrossRef]
  39. Shafaei, A.; Rees, J.; Christophersen, C.T.; Devine, A.; Broadhurst, D.; Boyce, M.C. Extraction and quantitative determination of bile acids in feces. Anal. Chim. Acta 2021, 1150, 338224. [Google Scholar] [CrossRef]
  40. Suzuki, Y.; Kaneko, R.; Nomura, M.; Naito, H.; Kitamori, K.; Nakajima, T.; Ogawa, T.; Hattori, H.; Seno, H.; Ishii, A. Simple and rapid quantitation of 21 bile acids in rat serum and liver by uplc-ms-ms: Effect of high fat diet on glycine conjugates of rat bile acids. Nagoya J. Med. Sci. 2013, 75, 57–71. [Google Scholar]
  41. Tagliacozzi, D.; Mozzi, A.F.; Casetta, B.; Bertucci, P.; Bernardini, S.; Di Ilio, C.; Urbani, A.; Federici, G. Quantitative analysis of bile acids in human plasma by liquid chromatography-electrospray tandem mass spectrometry: A simple and rapid one-step method. Clin. Chem. Lab. Med. 2003, 41, 1633–1641. [Google Scholar] [CrossRef]
  42. Wang, S.; Martins, R.; Sullivan, M.C.; Friedman, E.S.; Misic, A.M.; El-Fahmawi, A.; De Martinis, E.C.P.; O’Brien, K.; Chen, Y.; Bradley, C.; et al. Diet-induced remission in chronic enteropathy is associated with altered microbial community structure and synthesis of secondary bile acids. Microbiome 2019, 7, 126. [Google Scholar] [CrossRef]
  43. Wang, T.; Lin, S.; Liu, R.; Li, H.; Liu, Z.; Xu, H.; Li, Q.; Bi, K. Acute lung injury therapeutic mechanism exploration for chinese classic prescription qingzao jiufei decoction by uflc-ms/ms quantification of bile acids, fatty acids and eicosanoids in rats. J. Pharm. Biomed. Anal. 2020, 189, 113463. [Google Scholar] [CrossRef] [PubMed]
  44. Zhang, X.; Liu, X.; Yang, J.; Ren, F.; Li, Y. Quantitative profiling of bile acids in feces of humans and rodents by ultra-high-performance liquid chromatography–quadrupole time-of-flight mass spectrometry. Metabolites 2022, 12, 633. [Google Scholar] [CrossRef] [PubMed]
  45. Jergens, A.E.; Schreiner, C.A.; Frank, D.E.; Niyo, Y.; Ahrens, F.E.; Eckersall, P.D.; Benson, T.J.; Evans, R. A scoring index for disease activity in canine inflammatory bowel disease. J. Vet. Intern. Med. 2003, 17, 291–297. [Google Scholar] [CrossRef] [PubMed]
  46. European Medicines Agency. Ich Guideline m10 on Bioanalytical Method Validation and Study Sample Analysis. 2019. Available online: https://www.ema.europa.eu/ (accessed on 7 October 2024).
  47. Fernández-Metzler, C.; Ackermann, B.; Garofolo, F.; Arnold, M.E.; DeSilva, B.; Gu, H.; Laterza, O.; Mao, Y.; Rose, M.; Vazvaei-Smith, F.; et al. Biomarker assay validation by mass spectrometry. Aaps J. 2022, 24, 66. [Google Scholar] [CrossRef]
  48. Morlacchi, P.; Ramos, R.J.F.; Deckers, C.; Zhao, L.; Sartain, M.; Cuthbertson, D.; Cross, J.R. (Eds.) Mp 595 deciphering the microbiome: A targeted lc/ms/ms method for the comprehensive analysis of bile acids in biological samples. In Proceedings of the ASMS, Anaheim, CA, USA, 2–6 June 2024. [Google Scholar]
  49. Bile Acids Malabsorption Panel, Serum and Feces Mayo Foundation for Medical Education and Research2024. Available online: https://www.mayocliniclabs.com/test-catalog/overview/619919#Specimen (accessed on 11 May 2024).
  50. Neuberger-Castillo, L.; Ammerlaan, W.; Betsou, F. Fitness for purpose of stabilized stool samples for bile acid metabolite analyses. Sci. Rep. 2021, 11, 7904. [Google Scholar] [CrossRef]
  51. Strasberg, S.M.; Grossman, J.G.; Sullivan, R.B.; Stoentcheva, T.; Worley, L.A. The hydrocholeretic bile acid dehydrocholic acid is a safe and moderately effective treatment for recurrent acute cholangitis due to biliary stasis. HPB 2019, 21, S176–S177. [Google Scholar] [CrossRef]
  52. Reiter, S.; Dunkel, A.; Dawid, C.; Hofmann, T. Targeted lc-ms/ms profiling of bile acids in various animal tissues. J. Agric. Food Chem. 2021, 69, 10572–10580. [Google Scholar] [CrossRef]
  53. Zheng, J.J.; Shields, E.E.; Snow, K.J.; Nelson, D.M.; Olah, T.V.; Reily, M.D.; Robertson, D.G.; Shipkova, P.A.; Stryker, S.A.; Xin, B.; et al. The utility of stable isotope labeled (SIL) analogues in the bioanalysis of endogenous compounds by lc-ms applied to the study of bile acids in a metabolomics assay. Anal. Biochem. 2016, 503, 71–78. [Google Scholar] [CrossRef]
  54. Shiffka, S.J.; Kane, M.A.; Swaan, P.W. Planar bile acids in health and disease. Biochim. Biophys. Acta Biomembr. 2017, 1859, 2269–2276. [Google Scholar] [CrossRef]
  55. Tadano, T.; Kanoh, M.; Kondoh, H.; Matsumoto, M.; Mimura, K.; Kanoh, Y.; Sakamoto, K.; Kamano, T. Kinetic analysis of bile acids in the feces of colorectal cancer patients by gas chromatography-mass spectrometry (gc-ms). Rinsho byori. Jpn. J. Clin. Pathol. 2007, 55, 417–427. [Google Scholar]
  56. Makino, I.; Sjövall, J.; Norman, A.; Strandvik, B. Excretion of 3beta-hydroxy-5-cholenoic and 3a-hydroxy-5a-cholanoic acids in urine of infants with biliary atresia. FEBS Lett. 1971, 15, 161–164. [Google Scholar] [CrossRef] [PubMed]
  57. Kang, J.D.; Myers, C.J.; Harris, S.C.; Kakiyama, G.; Lee, I.-K.; Yun, B.-S.; Matsuzaki, K.; Furukawa, M.; Min, H.-K.; Bajaj, J.S.; et al. Bile acid 7α-dehydroxylating gut bacteria secrete antibiotics that inhibit clostridium difficile: Role of secondary bile acids. Cell Chem. Biol. 2019, 26, 27–34.e24. [Google Scholar] [CrossRef] [PubMed]
  58. Takei, H.; Narushima, S.; Suzuki, M.; Kakiyama, G.; Sasaki, T.; Murai, T.; Yamashiro, Y.; Nittono, H. Characterization of long-chain fatty acid-linked bile acids: A major conjugation form of 3β-hydroxy bile acids in feces. J. Lipid Res. 2022, 63, 100275. [Google Scholar] [CrossRef] [PubMed]
  59. Jover, A.; Meijide, F.; Rodríguez Núñez, E.; Vázquez Tato, J.; Castiñeiras, A.; Hofmann, A.F.; Ton-nu, H.T. Crystal structure of 3β,12α-dihydroxy-5β-cholan-24-oic acid (iso-deoxycholic acid). J. Mol. Struct. 2000, 523, 299–307. [Google Scholar] [CrossRef]
  60. Thanissery, R.; Winston, J.A.; Theriot, C.M. Inhibition of spore germination, growth, and toxin activity of clinically relevant c. Difficile strains by gut microbiota derived secondary bile acids. Anaerobe 2017, 45, 86–100. [Google Scholar] [CrossRef]
  61. Campbell, C.; McKenney, P.T.; Konstantinovsky, D.; Isaeva, O.I.; Schizas, M.; Verter, J.; Mai, C.; Jin, W.B.; Guo, C.J.; Violante, S.; et al. Bacterial metabolism of bile acids promotes generation of peripheral regulatory t cells. Nature 2020, 581, 475–479. [Google Scholar] [CrossRef]
  62. Devlin, A.S.; Fischbach, M.A. A biosynthetic pathway for a prominent class of microbiota-derived bile acids. Nat. Chem. Biol. 2015, 11, 685–690. [Google Scholar] [CrossRef]
  63. Hamilton, J.P.; Xie, G.; Raufman, J.P.; Hogan, S.; Griffin, T.L.; Packard, C.A.; Chatfield, D.A.; Hagey, L.R.; Steinbach, J.H.; Hofmann, A.F. Human cecal bile acids: Concentration and spectrum. Am. J. Physiol. Gastrointest. Liver Physiol. 2007, 293, G256–G263. [Google Scholar] [CrossRef]
  64. Li, Q.; Larouche-Lebel, É.; Loughran, K.A.; Huh, T.P.; Suchodolski, J.S.; Oyama, M.A. Gut dysbiosis and its associations with gut microbiota-derived metabolites in dogs with myxomatous mitral valve disease. mSystems 2021, 6, 2. [Google Scholar] [CrossRef]
  65. Giaretta, P.R.; Rech, R.R.; Guard, B.C.; Blake, A.B.; Blick, A.K.; Steiner, J.M.; Lidbury, J.A.; Cook, A.K.; Hanifeh, M.; Spillmann, T.; et al. Comparison of intestinal expression of the apical sodium-dependent bile acid transporter between dogs with and without chronic inflammatory enteropathy. J. Vet. Intern. Med. 2018, 32, 1918–1926. [Google Scholar] [CrossRef]
  66. Blake, A.B.; Guard, B.C.; Honneffer, J.B.; Lidbury, J.A.; Steiner, J.M.; Suchodolski, J.S. Altered microbiota, fecal lactate, and fecal bile acids in dogs with gastrointestinal disease. PLoS ONE 2019, 14, 224454. [Google Scholar] [CrossRef] [PubMed]
  67. Guard, B.C.; Honneffer, J.B.; Jergens, A.E.; Jonika, M.M.; Toresson, L.; Lawrence, Y.A.; Webb, C.B.; Hill, S.; Lidbury, J.A.; Steiner, J.M.; et al. Longitudinal assessment of microbial dysbiosis, fecal unconjugated bile acid concentrations, and disease activity in dogs with steroid-responsive chronic inflammatory enteropathy. J. Vet. Intern. Med. 2019, 33, 1295–1305. [Google Scholar] [CrossRef] [PubMed]
  68. Peterson, D.; Weidenmaier, C.; Timberlake, S.; Gura Sadovsky, R. Depletion of key gut bacteria predicts disrupted bile acid metabolism in inflammatory bowel disease. Microbiol. Spectr. 2024, 13, e01999-24. [Google Scholar] [CrossRef] [PubMed]
  69. AlShawaqfeh, M.K.; Wajid, B.; Minamoto, Y.; Markel, M.; Lidbury, J.A.; Steiner, J.M.; Serpedin, E.; Suchodolski, J.S. A dysbiosis index to assess microbial changes in fecal samples of dogs with chronic inflammatory enteropathy. FEMS Microbiol. Ecol. 2017, 93, fix136. [Google Scholar] [CrossRef]
  70. Pilla, R.; Guard, B.C.; Blake, A.B.; Ackermann, M.; Webb, C.; Hill, S.; Lidbury, J.A.; Steiner, J.M.; Jergens, A.E.; Suchodolski, J.S. Long-term recovery of the fecal microbiome and metabolome of dogs with steroid-responsive enteropathy. Animals 2021, 11, 2498. [Google Scholar] [CrossRef]
  71. Guzior, D.V.; Quinn, R.A. Review: Microbial transformations of human bile acids. Microbiome 2021, 9, 140. [Google Scholar] [CrossRef]
  72. Thomas, C.; Pellicciari, R.; Pruzanski, M.; Auwerx, J.; Schoonjans, K. Targeting bile-acid signalling for metabolic diseases. Nat. Rev. Drug Discov. 2008, 7, 678. [Google Scholar] [CrossRef]
  73. Jia, W.; Li, Y.; Cheung, K.C.P.; Zheng, X. Bile acid signaling in the regulation of whole body metabolic and immunological homeostasis. Sci. China Life Sci. 2024, 67, 865–878. [Google Scholar] [CrossRef]
  74. Rhimi, S.; Jablaoui, A.; Hernandez, J.; Mariaule, V.; Akermi, N.; Méric, T.; Mkaouar, H.; Wysocka, M.; Lesner, A.; Borgi, M.A.; et al. Industrial diet intervention modulates the interplay between gut microbiota and host in semi-stray dogs. Anim. Microbiome 2024, 6, 69. [Google Scholar] [CrossRef]
  75. Eyssen, H.J.; De Pauw, G.; Van Eldere, J. Formation of hyodeoxycholic acid from muricholic acid and hyocholic acid by an unidentified gram-positive rod termed HDCA-1 isolated from rat intestinal microflora. Appl. Env. Microbiol. 1999, 65, 3158–3163. [Google Scholar] [CrossRef]
  76. Madsen, D.; Beaver, M.; Chang, L.; Bruckner-Kardoss, E.; Wostmann, B. Analysis of bile acids in conventional and germfree rats. J. Lipid Res. 1976, 17, 107–111. [Google Scholar] [CrossRef] [PubMed]
  77. Petersen, A.Ø.; Julienne, H.; Hyötyläinen, T.; Sen, P.; Fan, Y.; Pedersen, H.K.; Jäntti, S.; Hansen, T.H.; Nielsen, T.; Jørgensen, T.; et al. Conjugated c-6 hydroxylated bile acids in serum relate to human metabolic health and gut clostridia species. Sci. Rep. 2021, 11, 13252. [Google Scholar] [CrossRef] [PubMed]
  78. Li, J.; Chen, Y.; Li, R.; Zhang, X.; Chen, T.; Mei, F.; Liu, R.; Chen, M.; Ge, Y.; Hu, H.; et al. Gut microbial metabolite hyodeoxycholic acid targets the tlr4/md2 complex to attenuate inflammation and protect against sepsis. Mol. Ther. 2023, 31, 1017–1032. [Google Scholar] [CrossRef]
Figure 1. Plumbing diagram for the system using two two-position six-port valves: (a) SPE loading/washing position and (b) analytical column loading position.
Pets 02 00018 g001
Figure 2. Fecal concentrations of taurocholic acid (TCA), 12oxo-lithocholic acid (12oxo-LCA), and hyodeoxycholic acid (HDCA) in healthy dogs (H) and dogs with chronic enteropathy (CE). p-values are presented above the graphs.
Pets 02 00018 g002
Figure 3. Proportion of secondary bile acids (deoxycholic acid and lithocholic acid) to total unconjugated bile acids (deoxycholic acid, lithocholic acid, cholic acid, and chenodeoxycholic acid), representative of bai gene activity in healthy dogs (H) and dogs with chronic enteropathy (CE). p-value is presented above the graph.
Pets 02 00018 g003
Figure 4. Bile acid metabolic pathways. Bile acids in red had significantly higher fecal concentrations in dogs with chronic enteropathy when compared to healthy dogs. Bile acids in blue had significantly lower fecal concentrations in dogs with chronic enteropathy when compared to healthy dogs. Concentrations of bile acids in purple were not significantly different between groups. Secondary bile acids, deoxycholic acid (DCA) and lithocholic acid (LCA), are absorbed into enterohepatic circulation and re-conjugated with taurine and glycine in the liver. Abbreviations: BSH, bile salt hydrolase; HSDH, hydroxysteroid dehydrogenase; bai, (bile acid-inducible) bai genes for 7α-dehydroxylation enzymes.
Pets 02 00018 g004
Table 1. Method gradient timetables for both binary pumps.
Agilent 1260 Binary PumpAgilent 1290 Binary Pump
Time (min)A (%)B (%)Flow (mL/min)Time (min)A (%)B (%)Flow (mL/min)
2.190100.30290100.4
2.590100.052.145550.4
7.890100.051618820.4
7.990100.3016.11990.4
850500.30181990.4
95950.3018.0190100.4
131990.302090100.4
181990.30
18.0190100.30
2090100.30
Table 2. Fecal bile acid concentrations in healthy dogs (H) and dogs with chronic enteropathy (CE). Significant differences between groups are shown in bold.
HCE
Bile AcidMedian [Min–Max]
ng/mg Fecal Dry Matter
Median [Min–Max]
ng/mg Fecal Dry Matter
p-Valueq-Value
12oxo-lithocholic acid (12oxo-LCA)1118.50 [0.14–6879.17]256.77 [0.02–5539.55]0.0000.000
3oxo-cholic acid (3oxo-CA)5.91 [0.05–220.8]18.13 [0.14–217.62]0.0080.014
3oxo-chenodeoxycholic acid (3oxo-CDCA)4.10 [0.28–185.3]3.86 [0.49–78.79]0.3330.409
3oxo-deoxycholic acid (3oxo-DCA)471.14 [0.38–5447.33]74.99 [0.02–5172.46]0.0000.000
7,12oxo-lithocholic acid (7,12oxo-LCA)2.85 [0.15–138.79]5.56 [0.04–174.47]0.1560.211
7oxo-deoxycholic acid (7oxo-DCA)71.56 [3.36–5577.38]676.41 [0.35–9438.78]0.0000.000
7oxo-lithocholic acid (7oxo-LCA)36.97 [2.79–224.32]67.22 [2.63–301.46]0.0020.004
cholic acid (CA)81.70 [2.91–24,299.77]1308.27 [10.44–32,283.47]0.0000.000
chenodeoxycholic acid (CDCA)51.03 [1.86–2130.86]106.03 [2.65–1983.05]0.0180.028
deoxycholic acid (DCA)3134.37 [2.10–8831.39]1798.97 [1.57–5680.31]0.0000.000
glycocholic acid (GCA)0.38 [0.02–45.75]2.98 [0.02–269.05]0.0000.000
glycochenodeoxycholic acid (GCDCA)0.30 [0–28.18]0.29 [0.01–7.30]0.9620.962
glycodeoxycholic acid (GDCA)1.73 [0.01–13.78]1.82 [0.01–51.40]0.7040.761
glycolithocholic acid (GLCA)0.45 [0.01–2.99]0.18 [0–3.62]0.0000.001
glycoursodeoxycholic acid (GUDCA)0.03 [0–0.35]0.02 [0–1.24]0.8020.833
hyocholic acid (HCA)1.31 [0.04–25.57]0.56 [0.04–24.49]0.0000.000
hyodeoxycholic acid (HDCA)1517.30 [25.70–8831.39]373.08 [0.44–10,256.23]0.0000.001
iso-Cholic acid (Iso-CA)8.36 [0.37–354.99]44.41 [0.84–670.61]0.0000.000
iso-Chenodeoxycholic acid (Iso-CDCA)308.21 [2.62–797.28]39.61 [0.03–1025.65]0.0000.000
lithocholic acid (LCA)680.73 [2.85–5409.83]431.18 [0.21–10,256.23]0.0340.051
taurocholic acid (TCA)8.24 [0.96–3564.24]20.91 [0.74–36,059.81]0.0060.011
taurochenodeoxycholic acid (TCDCA)1.98 [0.08–454.54]2.46 [0.09–1900.07]0.1890.243
taurodeoxycholic acid (TDCA)14.10 [0.12–775.86]18.87 [0.03–1032.81]0.5020.589
taurolithocholic acid (TLCA)0.98 [0.02–61.17]0.95 [0.01–77.58]0.7040.761
tauroursodeoxycholic acid (TUDCA)0.13 [0–9.47]0.61 [0.01–156.45]0.0000.000
ursocholic acid (UCA)15.36 [0.70–557.75]65.37 [0.05–1053.34]0.0000.000
ursodeoxycholic acid (UDCA)20.55 [1.39–208.06]27.83 [1.35–451.24]0.1260.179
Disclaimer/Publisher’s Note: The statements, opinions and data contained in all publications are solely those of the individual author(s) and contributor(s) and not of MDPI and/or the editor(s). MDPI and/or the editor(s) disclaim responsibility for any injury to people or property resulting from any ideas, methods, instructions or products referred to in the content.

