Article

Effects of an Animal-Assisted Drop-In Program on First-Year University Students’ Trajectory of Psychological Wellbeing

Department of Human Development, Washington State University, Pullman, WA 99164, USA
*
Author to whom correspondence should be addressed.
Submission received: 4 December 2024 / Revised: 21 January 2025 / Accepted: 22 January 2025 / Published: 11 February 2025

Abstract

:
(1) Each year, thousands of students leave their pets behind to attend university, often causing separation anxiety and losing a vital stress-coping resource. While many universities offer animal visitation programs (AVPs), their effectiveness in supporting student wellbeing during this transition remains unclear. This randomized controlled trial evaluated psychological mood risk and resilience in a randomly selected sample of first-year university students (n = 145) separated from their childhood pets. (2) Participants were randomly assigned to receive access to a seven-session, biweekly 2 h drop-in program (n = 77) featuring unstructured interactions with therapy dogs or a waitlist control group (n = 68). Assessments of wellbeing were conducted at the start, middle, and end of the semester including depression, anxiety, worry, stress, cognitive reappraisal, expressive suppression, and self-compassion. (3) Regression analyses showed that access to the semester-long drop-in program significantly flattened trajectories of depression (B = −3.05, p = 0.01, d = 0.514), worry (B = −3.92, p = 0.04, d = 0.416), and stress (B = −1.94, p = 0.05, d = 0.386) compared to the control group. Students in experimental conditions also showed improvements in self-compassion (B = 4.03, p < 0.001, d = 0.605). (4) These findings suggest regular access to unstructured drop-in programs featuring therapy dogs may provide valuable psychological support for students adjusting to university life.

1. Introduction

Over the past decade, mental health disorders among university students have become increasingly prevalent [1]. The first semester is a particularly high-risk period, often marked by declines in psychological functioning [2] and positive affect [3]. Separation from a childhood pet may further heighten this risk.
Research shows that one in four students leaving a pet behind experience clinically significant separation anxiety during their first week on campus [4]. Anecdotal evidence from animal-assisted interventions (AAIs) suggests students view separation from their pets as the loss of an important coping resource. This loss, combined with other stressors, may increase the risk of mental health issues, poor academic performance, and even discontinuous enrollment during the transition to university life [5].
University administrators are eager to support student wellbeing during the transition to university, yet little is known about the impact of pet separation on students’ coping and adjustment or how to address it. Despite 70% of American families owning a pet and 80% considering pets as family members [6,7], there is a significant gap in understanding how to design programs that mitigate the unique challenges these students face. Moreover, while AVPs have become increasingly common and popular on university campuses, most programs are provided as universal access programs providing short, large group interactions in the context of preparing for final exams. With a few exceptions [8,9], very few universities provide regular access to therapy animals on a drop-in, as-needed basis and none of those are intended and designed for specific populations with risk factors related to pet separation.
Given the lack of knowledge on the efficacy and effectiveness of such programs, the goal of this study was to evaluate whether providing regular, semester-long access to a drop-in program could prevent declines in psychological wellbeing and promote positive adjustment in first-year university students experiencing pet separation. Featuring an experimental design, this study randomly assigned a representative sample of first-year students separated from their family pets to either a biweekly, seven-session drop-in animal visitation program (AVP) featuring unstructured interactions with therapy dogs, or a waitlist control group.

1.1. Rationale for Implementing And Evaluating Campus-Based, Drop-In AVPs

Providing frequent access to an unstructured campus-based drop-in program featuring therapy dogs is informed by the following rationales. First, AVPs are extremely popular with stakeholders including administrators, faculty, staff, parents, and students for various reasons. Research shows that incorporating animal-assisted activities (AAAs) into university programs increases enjoyment, perceived usefulness, and the likelihood of recommendation to such programs compared to programs that do not incorporate exposure or interactions with animals [10]. Given that animal-assisted programs are mostly staffed by volunteers rather than licensed health care professionals, universities that experience demands for counseling services that exceed capacity are eager and able to provide resources to expand access or create targeted programs for at-risk populations.
Second, there is substantial evidence that brief interactions with animals during campus-based AVPs have significant positive effects on student wellbeing in several domains. Randomized controlled trials show that brief sessions (10–45 min) significantly reduce perceived stress [8,11,12], anxiety [13,14], and negative emotions, while improving mood, wellbeing, positive emotions, and social support [15,16]. Additionally, engaging in hands-on interactions for only 10 min has shown to significantly enhance the regulation of physiological stress markers such as cortisol [17] and alpha amylase [18]. Based on these early findings, researchers and university administrators suggested expanding access to AVPs by offering increased frequency and duration of exposure to enhance their impact assuming an additive effect. Studies have indeed shown that four-week academic stress management programs that incorporated interactions with therapy dog programs improved students’ study skills and strategies, reduced perceived stress, and enhanced executive functioning particularly in at-risk students [19,20]. These findings do suggest that regular, unstructured drop-in programs may effectively support students experiencing pet separation anxiety during their transition to university by providing frequent opportunities to engage with animals. This rationale is in line with the field of implementation science which further supports the benefits of sustained, frequent programming. Research shows that regular access to interventions over weeks or months improves program efficacy [21,22].
Third, there is empirical and theoretical evidence to suggest that frequent exposure to AVP sessions may foster resilience. Engaging with therapy dogs, handlers, and fellow students provides opportunities for distraction from negative thoughts, which can prevent mood disorders [23,24]. Positive experiences may accumulate, promoting physical, intellectual, social, and psychological resources critical for wellbeing [25,26]. AVPs may also enhance protective factors like self-compassion and emotion regulation. Higher self-compassion is linked to lower depression, anxiety, and stress [27,28], and AAAs have been associated with improved self-compassion in veterans with PTSD [29]. In sum, expanding AVPs with frequent, sustained sessions may reduce student stress, support students’ resilience, and promote psychological wellbeing during their transition to university life.
Last, in addition to examining the efficacy of a therapy dog drop-in program on student wellbeing, this study addresses several gaps in our knowledge. For example, recent meta-analyses of university stress prevention programs have excluded AVPs, which underscores the need for research into their cumulative effects [22,30]. In addition, little is known about the take-up of a drop-in program featuring therapy dog programs. Monitoring attendance patterns [31] could help identify optimal “dose-effects” of AVPs, an area that remains under-researched [32]. This study builds on a recent study which demonstrated that early attendance to a series of drop-in AVP sessions predicted higher frequency of attendance across the program, particularly among those experiencing anxiety upon arriving on campus [33]. Also, we examine efficacy of exposure and access while considering students’ mood states during program participation, levels of separation anxiety from pets, and attendance. These aspects of functioning have not yet been examined in prior studies as potential confounds.

1.2. Current Study

The current study assesses the causal impact of providing access to a seven-session, two-hour, bi-weekly drop-in AVP offering unstructured interactions with therapy dogs on first-year students’ trajectories of wellbeing throughout the semester as they transition to university following separation from their family pets. Using an independent groups design with random assignment to an experimental or waitlist condition, we model the effect of the experimental condition, program take-up (the actual amount of AVP exposure), students’ level of separation anxiety from their pets, as well as their mood state at the start of sessions on the trajectory of wellbeing spanning three assessment periods throughout students’ first semester at university.

2. Materials and Methods

This study was conducted at a research university in the Pacific Northwest, adhering to the International Association of Human–Animal Interaction Organization [34] guidelines to promote human and animal wellbeing. All procedures were approved by the university’s Institutional Review Board (#17663-001) and Institutional Animal Care and Use Committee (#6513-001).

2.1. Participants and Recruitment

Incoming first-year students were recruited during the summer before their first semester. The university’s Office of Institutional Research and Registrar provided a random sample of 2000 students out of 3,354 incoming first-year students who had completed orientation. Pet-owning students were specifically targeted via email, which included study details, a consent form, and a link to an online survey. Of the 209 consenting pet owners, participants were randomly assigned to either the experimental group (n = 105), with access to the Pet-Assisted Wellbeing for University Students (PAWs4US) program, or the waitlist control group (n = 104).
Students were eligible for this study if they (a) were 18 years or older, (b) had a family pet left at home, (c) had completed the Lexington Attachment to Pets Scale [see 4], and (d) provided data on risk factors (e.g., first-generation status, prior mental health symptoms). Students with prior college credits (except those earned through dual enrollment or advanced placement) were excluded. Participants had to complete the pet-separation anxiety measure after arriving on campus and at least one additional assessment (midterm or end-of-semester) to be included in the analysis. Participants received USD 5 for each of the three study assessments but were not incentivized to attend PAWs4US sessions.

2.2. Procedures

Upon arrival on campus, participants completed Qualtrics surveys assessing mood states (e.g., anxiety, stress) and pet separation anxiety at three time points; first, at baseline one week after the start of the semester, second at midterm, and finally at the end of the semester. Experimental group participants were provided with program details and asked to select preferred session times to ensure adequate availability of Pet Partner dog-handler teams. They received reminder emails 72 h in advance and on the morning of each session, which included consistent location details.
Waitlisted participants were provided access to a single program session at the end of the semester following completion of their end of semester surveys. Waitlisted participants were also scheduled to attend the program during their spring semester; however, the program was suspended after two sessions due to safety protocols established by the federal, state, and university leadership in response to COVID-19.

2.2.1. Program Logistics

On program days, participants checked in with a research assistant outside the program area. During their first session, they were briefed on safety protocols (e.g., zoonotic disease prevention, avoiding overcrowding animals, handler instructions, sanitizer availability). Safety reminders were provided at each session and reinforced as needed, though violations were not noted. Participants could attend for any duration during the two-hour sessions. Early arrivals waited outside the program area until the session began. Upon entering, participants stored their belongings and selected which dog-handler teams to visit.

2.2.2. Session Management

Research assistants monitored the area to prevent overcrowding. During therapy dog-handler team shifts, participants were asked to wait until new teams settled before visiting them. Participants attending in the first hour were informed that teams might change during the session.

2.2.3. PAWs4US Teams

Human–dog teams were sourced from Palouse Paws, a local regional community partner of the national Pet Partners organization [35]. Teams consisted of 14 male dogs (all neutered), 14 female dogs (10 spayed; 4 intact), and one dog of unspecified gender and status (Mage = 4 years, 7 months, AgeMax = 13.5 years, AgeMin = 7 months). Most dogs were Labrador Retrievers (n = 6), mixed breeds (n = 7), and Golden Retrievers (n = 4) (nother = 11). On average, dogs participated in 2.5 h of therapy work per week (range: 1 h–13 h per week). Most handlers were female (N = 22; NMale = 2; Mage = 52.3 years; Min = 22–Max = 73), with 3 years of AAA experience (range: “first time”—8 years). A total of 15 teams were familiar with the program area, having volunteered as a part of a prior study.

2.2.4. Sample Characteristics

Participants (N = 106; Mage = 18.51 (SD = 0.34)) were all first-semester students who identified as owning a family pet left at home to attend university. Dog ownership was reported among 88% of students, with nearly half reporting cat ownership (49%). On average, these pets were 7 ± 3.8 years old and had been a part of their people’s lives for 6.3 ± 3.6 years.
Participants were predominantly women (85%), Caucasian (86%, Hispanic = 12%, Asian = 10%, American Indian/Alaska Native = 2%, Hawaiian/Pacific Islander = 3%, African American = 2%; with 10% of students endorsing more than one race). An amount of 35% of participants indicated they were the first in their family to attend university, 31% indicated they earned some college credits while enrolled in high school and reported an overall average high school grade point average of 3.6 (SD = 0.33) out of 4. Students’ hometown locations ranged from 19.5 to 2112.4 miles away from the university. Overall, 43% of study participants endorsed the presence of one or more preexisting mental health conditions (e.g., depression, anxiety, PTSD, and/or self-harm).

2.3. Measures

2.3.1. Dependent Variables: Slopes of Trajectories of Psychological Risk and Resilience

Depression

Depressive symptomology was measured via Qualtrics using the Beck Depression Inventory (BDI) [36], a 21-item measure (e.g., I feel sad, I cry all the time) rated on a four-point Likert scale. There is strong support for high reliability (α > 0.83) with younger adults [37], which was echoed in our sample (α = 0.92). According to Beck et al. [36], scores were used to categorize participants into one of four levels of depressive symptoms: minimally depressed (0–13), mild depression (14–19), moderate depression (20–28), and severe depression (29–63). Depression was measured at three time points, baseline, M = 12.10 (SD = 9.35), midterm, M = 12.86 (SD = 10.16), and end of semester, M = 14.61 (SD = 12.27). Next, multiple linear regression was used to calculate linear trajectory slopes for each participant by regressing scores over each assessment time. Student’s individual depression trajectory slope, M = 1.07, SD = 4.05, Min = −9.00, Max = 11.00, was the dependent variable in subsequent regression coefficient analysis.

Anxiety

Anxiety was measured via Qualtrics using the Beck Anxiety Inventory (BAI) [38], a 21-item measure on a 4-point Likert scale (0 = not all to 3 = severely) describing participants’ common symptoms of anxiety (e.g., numbness and tingling, sweating not due to heat, and fear of the worst happening). The BAI shows excellent internal consistency with average coefficient α values of 0.88 [39], which was echoed in our sample (α = 0.93). Scores were summed across the 21 items to create a composite anxiety score. According to Beck and Steer [38], composite scores can be used to assess symptom severity of very low anxiety (0–21), moderate anxiety (22–35), and individuals reporting anxiety with potential cause for concern (>36), discussed in the results section. Anxiety was measured at three time points, baseline, M = 17.00 (SD = 11.34), midterm, M = 15.28 (SD = 11.33), and end of semester, M = 15.99 (SD = 13.13). Next, multiple linear regression was used to calculate linear trajectory slopes for each participant by regressing scores over each assessment time. Student’s individual anxiety trajectory slope, M = −0.62, SD = 5.53, Min = −15.50, Max = 23.00, was the dependent variable in subsequent regression coefficient analysis.

Worry

Worry was measured via Qualtrics using the 16-item Penn State Worry Questionnaire (PSWQ) [40]. The PSWQ assesses the frequency and associated ability to control worry, by asking participants to endorse statements (i.e., I worry all the time, my worries overwhelm me) on a 5-point Likert scale (1 = not at all typical to 5 = very typical). Scores were summed to create a composite worry score, with higher scores indicative of greater symptom severity. Among participants with anxiety disorders, university students, and community samples, reliability of the PSWQ (α = 0.83–93) is excellent [41], which was echoed in our sample (α = 0.92). Worry was measured at three time points, baseline, M = 58.83 (SD = 12.82), midterm, M = 56.54 (SD = 13.16), and end of semester, M = 57.19 (SD = 13.28). Next, multiple linear regression was used to calculate linear trajectories (slopes) for each participant by regressing scores over each assessment time. Student’s individual worry trajectory slope, M = −0.429, SD = 6.55, Min = −26.00, Max = 24.00, was the dependent variable in subsequent regression coefficient analysis.

Perceived Stress

Perceived stress (stress) was measured via Qualtrics with the abbreviated Perceived Stress Scale-10 (PSS-10) [42,43], asking participants to endorse 10 statements on a 5-point Likert scale (from 0 = never to 4 = very often) describing the extent to which events during the previous month were appraised as stressful (e.g., how often have you felt nervous and stressed). Positive items were reverse coded before summing across all 10 items to create a composite perceived stress score for analyses. High reliability was observed in our sample, α = 0.87. Cohen et al. [43] provide norm mean levels of perceived stress for 18–29-year-olds in the general population (M = 14.2, SD = 6.2). Stress was measured at three time points, baseline, M = 19.56 (SD = 6.26), midterm, M = 20.16 (SD = 7.53), and end of semester, M = 20.37 (SD = 7.42). Next, multiple linear regression was used to calculate linear trajectories (slopes) for each participant by regressing scores over each assessment time. Student’s individual stress trajectory slope, M = 0.452, SD = 3.34, Min = −8.00, Max = 11.00, was the dependent variable in subsequent regression coefficient analysis.

Emotion Regulation: Cognitive Reappraisal and Expressive Suppression

Emotion regulation was measured via Qualtrics using the Emotion Regulation Questionnaire [44]. This 10-item measure assesses respondents’ cognitive reappraisal (e.g., I control my emotions by changing the way I think about the situation I’m i) and expressive suppression (e.g., I control my emotions by not expressing them). Cognitive reappraisal assesses respondents emotional experience, while expressive suppression assessed individuals’ emotional expression. Each subscale included one item each asking about the regulation/suppression of positive (i.e., joy, amusement) and negative (i.e., anger, sadness) emotions. The measure demonstrates high reliability, α > 0.73. Scores were summed following author guidelines, and no items were reverse coded. Cognitive reappraisal is commonly considered an adaptive emotion regulation strategy, while expressive suppression is viewed as maladaptive [45]. Cognitive reappraisal and expressive suppression were measured at three time points, baseline, Mreappraisal = 33.00 (SD = 7.45), Msuppression = 17.87 (SD = 5.70), midterm, Mreappraisal = 23.96 (SD = 7.41), Msuppression = 17.04 (SD = 5.31), and end of semester, Mreappraisal = 24.66 (SD = 7.60), Msuppression = 16.48 (SD = 4.87). Next, multiple linear regression was used to calculate linear trajectory slopes for each participant by regressing scores over each assessment time. Student’s individual cognitive reappraisal trajectory slope, Mreappraisal = −5.41, SD = 5.31, Min = −29.00, Max = 12.50, and expressive suppression trajectory slope, Msuppression = −1.13, SD = 3.37, Min = −11.00, Max = 10.00, were dependent variables in subsequent regression coefficient analysis.

Self-Compassion

Self-compassion was measured via Qualtrics using the 12-item Self-Compassion Scale—Short Form [46] assessing the degree to which participants are compassionate towards themselves. This scale has demonstrated high reliability α > 0.86. The SCS—short form and the SCS—long form features 6 subscales, half of which demonstrate positive, self-compassionate tendencies, while the remaining 3 demonstrate negative, self-judgmental tendencies. Positive subscales included self-kindness (e.g., I try to be understanding and patient towards those aspects of my personality I don’t like), mindfulness (e.g., When something happens I try to take a balanced view of the situation), and common humanity (e.g., I try to see my failings as part of the human condition), while negative subscales include isolation (e.g., When I fail at something that’s important to me, I tend to feel alone in my failure), self-judgment (e.g., I’m disapproving and judgmental about my own flaws and inadequacies), and over-identification (e.g., “When I fail at something important to me I become consumed by feelings of inadequacy”). Negative subscale items were reverse coded prior to calculation of a composite total score. Total scores at baseline, midterm and end of semester were used for analysis in this study. Self-compassion was measured at three time points, baseline, M = 32.16 (SD = 7.89), midterm, M = 33.00 (SD = 8.00), and end of semester, M = 32.44 (SD = 7.42). Next, multiple linear regression was used to calculate linear trajectory slopes for each participant by regressing scores over each assessment time. Student’s individual self-compassion trajectory slope, M = 0.369, SD = 4.54, Min = −12.00, Max = 14.00, was the dependent variable in subsequent regression coefficient analysis.

2.3.2. Control Variables

Attendance

Participant’s attendance was tracked by researchers for each of the seven PAWs4US program sessions. When students checked in to the program, their attendance was noted and coded 1 (attended) or 0 (did not attend) for each session throughout the semester. These seven indicator variables were summed to create a total attendance composite variable. Possible and observed total attendance scores ranged from 0 to 7 and were normally distributed. Waitlisted participants were assigned an attendance frequency of 0. An indicator variable (0,1) was created indicating whether participants attended 3 or more program sessions during the semester and was created to control for adequate uptake of the program, a known predictor of program efficacy [33].

Pet Separation Anxiety

Pet separation anxiety was measured via Qualtrics using an adapted version of the American Psychiatric Association’s Severity Measure for Separation Anxiety Disorder—Adult (SA). A 10-item measure, the SA assesses the severity of symptoms of separation anxiety disorder in individuals aged 18 and older and has been identified for use in research beyond clinical diagnosis [47]. The language of the measure was adapted to reflect separation from a pet instead of “important individuals” or being at “home”. Each item asks the individual to rate the severity of the “thoughts, feelings and behaviors” they may be experiencing while being separated from their pet over the past 7 days [4]. Total scores can range from 0 to 40, with higher scores indicating greater severity of separation anxiety disorder. Students completed this measure at baseline during the first week of the semester approximately one to two weeks after arriving on campus. Using participants’ average scores, students were assigned symptom severity of no separation anxiety symptoms (25%; “none”; average score < 0.4999), low separation anxiety symptoms (50%; “mild”; average score 0.50 to 1.4999), and high (25%; “moderate-severe”; average score > 1.4999). Cronbach’s alpha was high (α  = 0.86). An indicator (0,1) variable was created indicating whether participants experienced high (moderate or greater) separation anxiety (1) or not and (0) was created to control for students’ experience with separation anxiety from their pet.

2.3.3. Analytical Approach

Analyses were conducted using SPSS v.28. Prior to conducting regression analyses, dependent and independent variables were assessed for normality and missing data. Given complete data on all independent variables, and missing data for dependent variables ranged from 1–3%, listwise deletion was employed [48]. As expected, given the use of random assignment to condition, we examined whether there were any differences by condition at pretest in indices of psychological risk, mood states, etc. using t-test, and report that none of those were found, except for worry which are further explored in the results section. As described (see measures), syntax by Pfister et al. [49] was used to conduct a series of multiple linear regressions to calculate and extract the seven dependent variable slopes representing each participant’s individual linear estimate of the slope of the trajectory of change (hereafter slope) over the semester. Given our interest to examine whether random assignment to the AVP treatment condition affected mental health and wellbeing slopes, a series of regression coefficient analyses were conducted regressing treatment condition (AVP = 1, waitlist = 0), whether high pet separation anxiety (yes = 1, no = 0), and whether three or more sessions of program attendance (yes = 1, no = 0) on each dependent variable. Predicted unstandardized slopes were saved from each final model and descriptively discussed and presented in figures. Model fit statistics were examined for each regression model on each dependent variable. It is important to note that given the nature of this study’s research question, there is an expectation that the R2 will be low as we are only including variables essential to detect experimental causal effects by including the treatment condition, as opposed to predicting all contributions to students’ trajectory slopes.

3. Results

3.1. Descriptive Analyses by Severity of Separation Anxiety Symptoms

Given prior findings suggesting high SA influenced students’ participation in AVP and its relation to psychological mood [33], a one-way Analysis of Variance (ANOVA) with a Bonferroni correction was conducted to examine whether participants demonstrated differences in mean scores by severity of SA symptoms (Table 1). Results showed participants experiencing high SA symptoms reported significantly higher levels of depression (Fstart(2,103) = 14.0, p < 0.001; Fmid(2,98) = 11.1, p < 0.001; Fend(2,87) = 10.2, p < 0.001), anxiety (Fstart(2,103) = 23.2, p < 0.001; Fmid(2,98) = 16.7, p < 0.001; Fend(2,87) = 12.5, p < 0.001), worry (Fstart(2,103) = 7.4, p < 0.001; Fmid(2,98) = 6.7, p = 0.002; Fend(2,87) = 3.6, p = 0.033), and stress (Fstart(2,103) = 17.6, p < 0.001; Fmid(2,98) = 9.52, p < 0.001; Fend(2,87) = 6.4, p = 0.003), across all assessment periods compared with students with low or moderate levels of SA. Self-compassion and emotion regulation scales showed no differences by severity of SA, except for emotional suppression at midterm (Fmid(2,98) = 3.4, p = 0.038). Given these observed differences, we controlled for the presence of high SA in subsequent regression analyses to prevent confounding regression estimates capturing experimental effects.

3.2. Predicting Trajectory Slopes

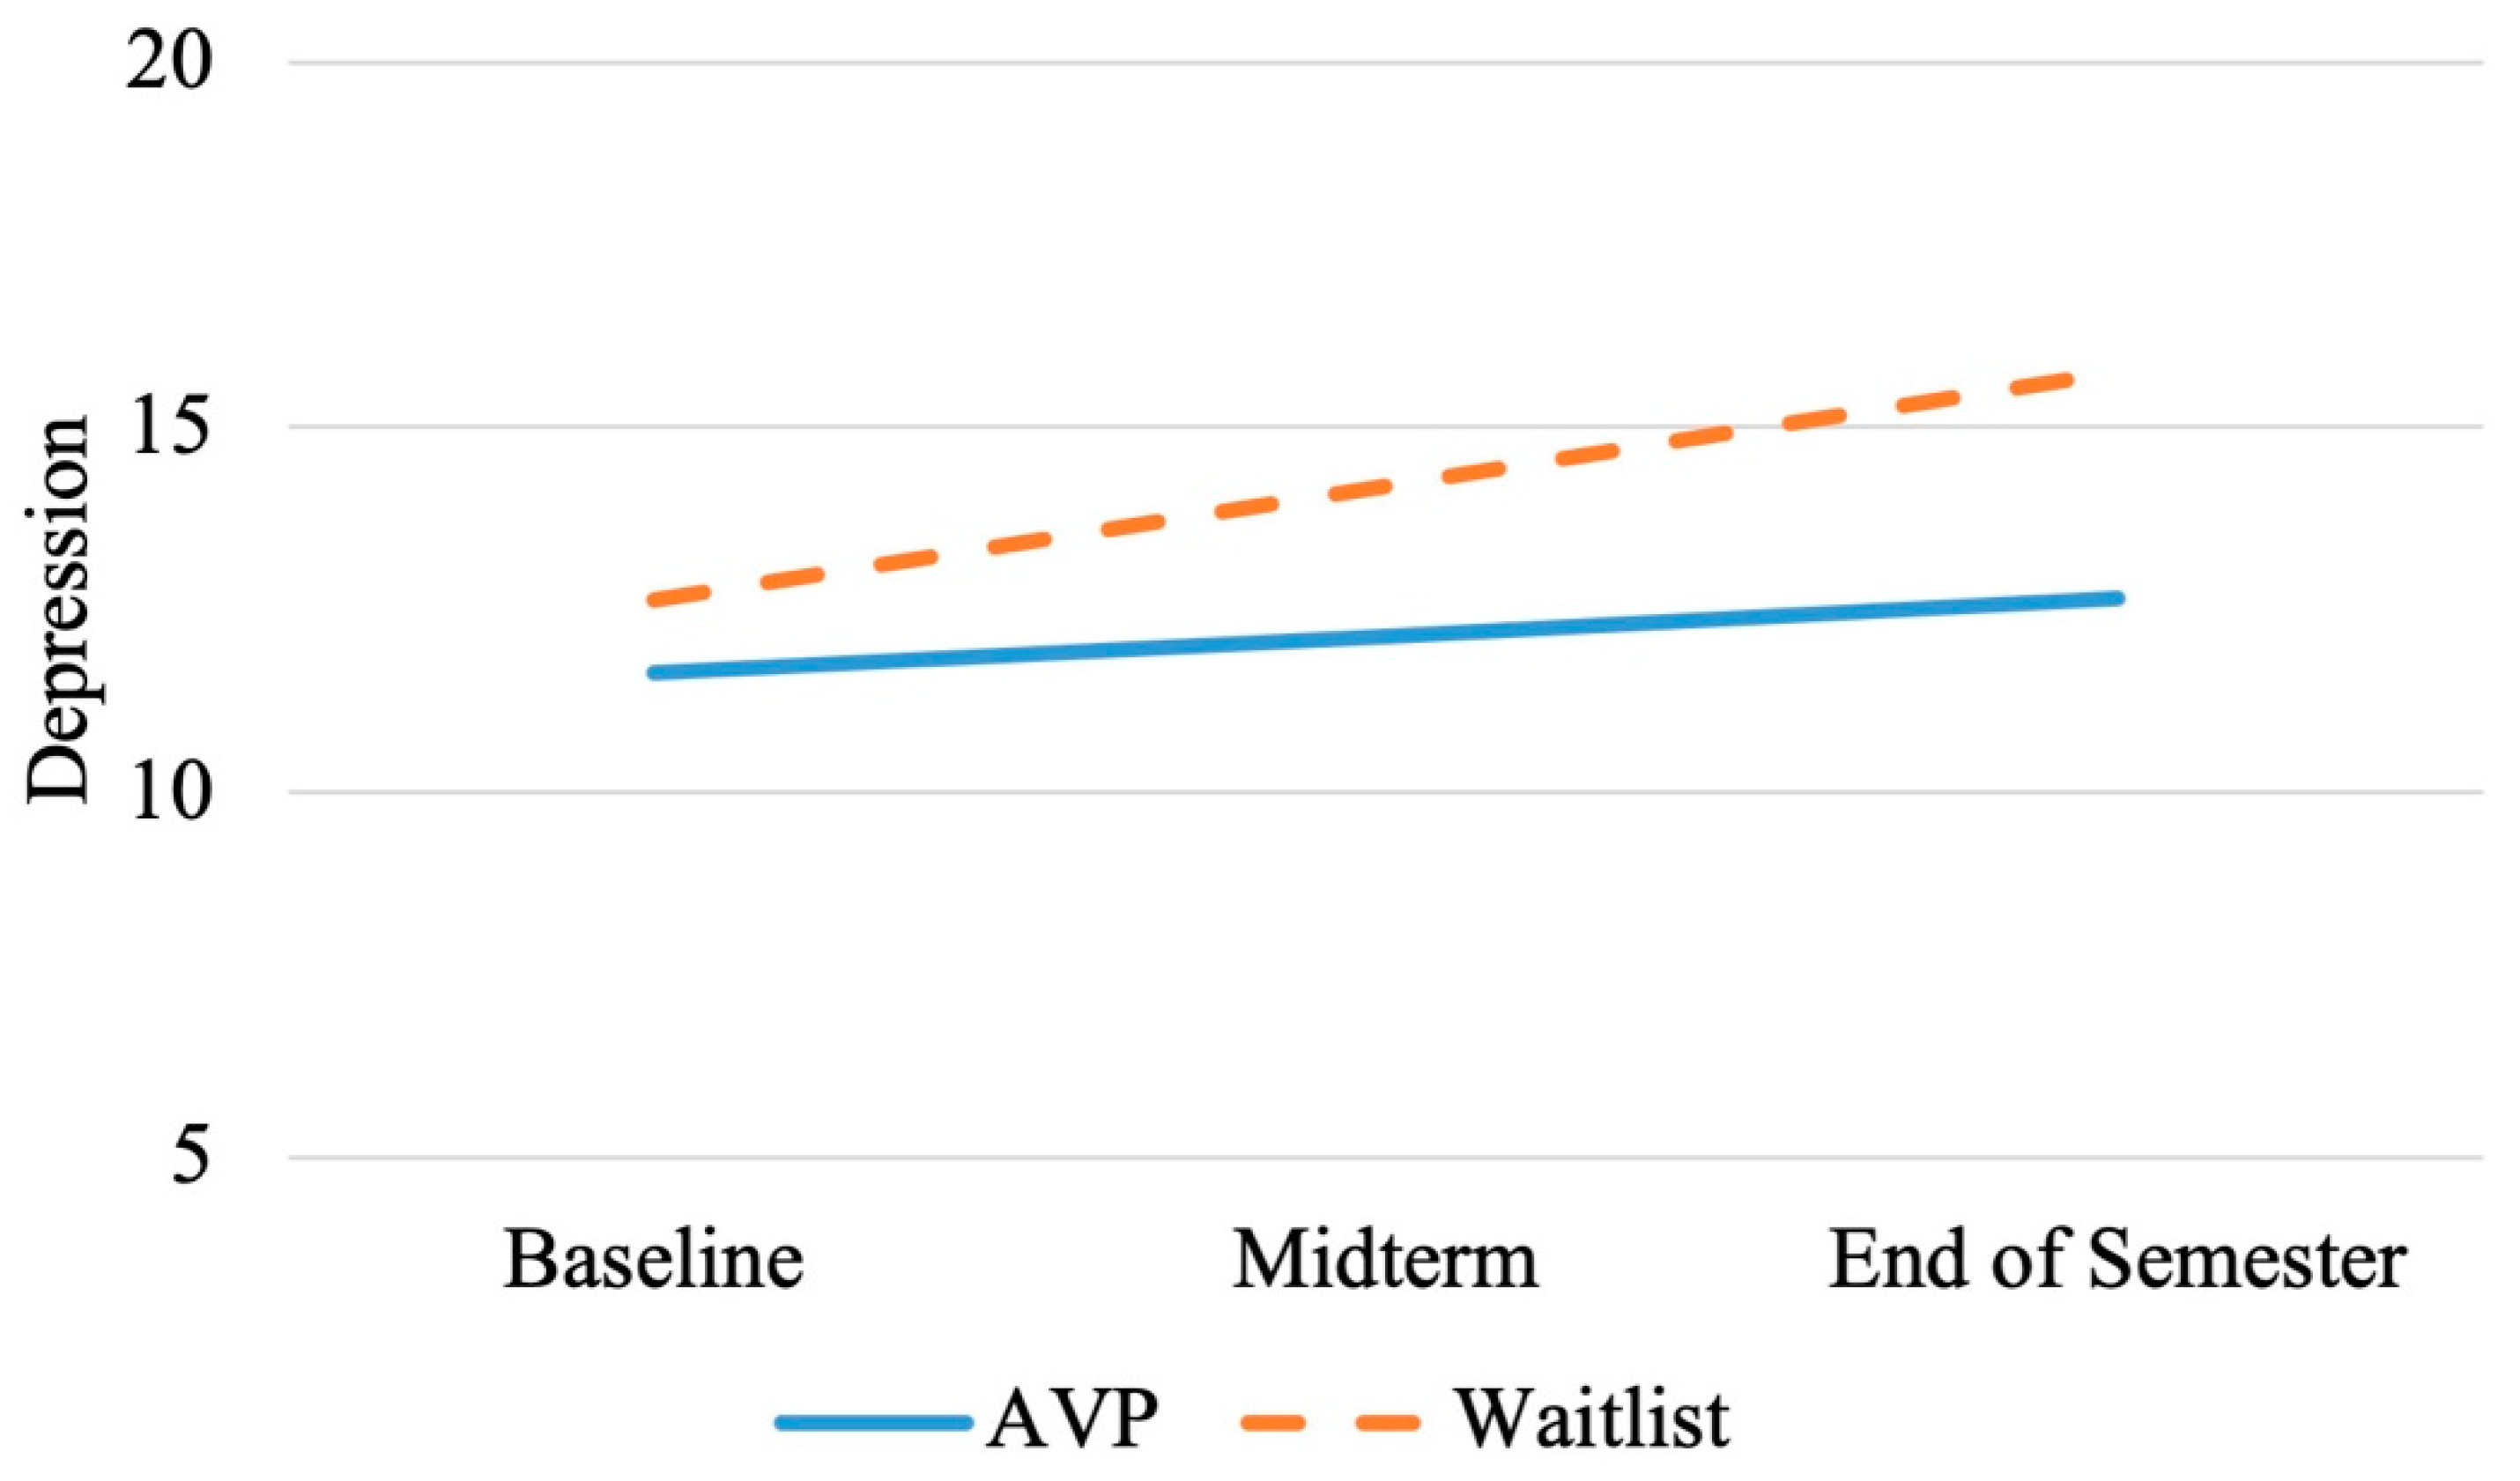
3.2.1. Depression Trajectory Slopes

Model fit statistics of the multiple linear regression analysis (Table 2—part 1), F(3,99) = 3.00, p = 0.03, R2 = 0.08, indicated there was a significant difference in trajectory slopes for levels of depression over the semester by participants’ treatment condition, high SA status, and program attendance. Results show that random assignment to the AVP condition predicted a significantly flatter trajectory slope over time, B = −3.05, p = 0.01, d = 0.51, while controlling for the presence of high SA, B = 1.54, p = 0.11, d = 0.32, and program attendance, B = 3.15, p = 0.01, d = 0.50. Figure 1, displaying predicted slopes, shows a flat (i.e., not characterized by significant increase or decrease) slightly negative trajectory for students randomly assigned to the AVP condition, M = −0.07, SD = 1.53, suggesting they experienced stable levels of depression through the first semester. This contrasts with the waitlist condition who did not have the opportunity to engage in AVP who experienced a steeper positive trajectory of depression M = 1.54, SD = 0.69, indicating they experienced increased rates of depression symptoms as the semester progressed. Note, as expected, that attendance had a significant impact on the slope of the trajectory. This suggests that repeated exposure to AVP during students’ first semester prevented worsening depression levels for students regardless of levels of SA.

3.2.2. Anxiety Trajectory Slopes

Model fit statistics of the multiple linear regression analyses (Table 2—part 2), F(3,100) = 0.24, p = 0.87, R2 = 0.01, indicated there was no significant effect on students’ anxiety slope between participants’ treatment condition, B = 0.15, p = 0.93, d = 0.02, high SA status, B = −1.08, p = 0.42, d = 0.16, and program attendance status, B = −0.06, p = 0.98, d = 0.01. Predicted anxiety slopes showed similar declines over time in both the AVP and waitlist conditions. This suggests that participation in three or more sessions of drop-in AVP was insufficient to influence trajectory slopes for anxiety.

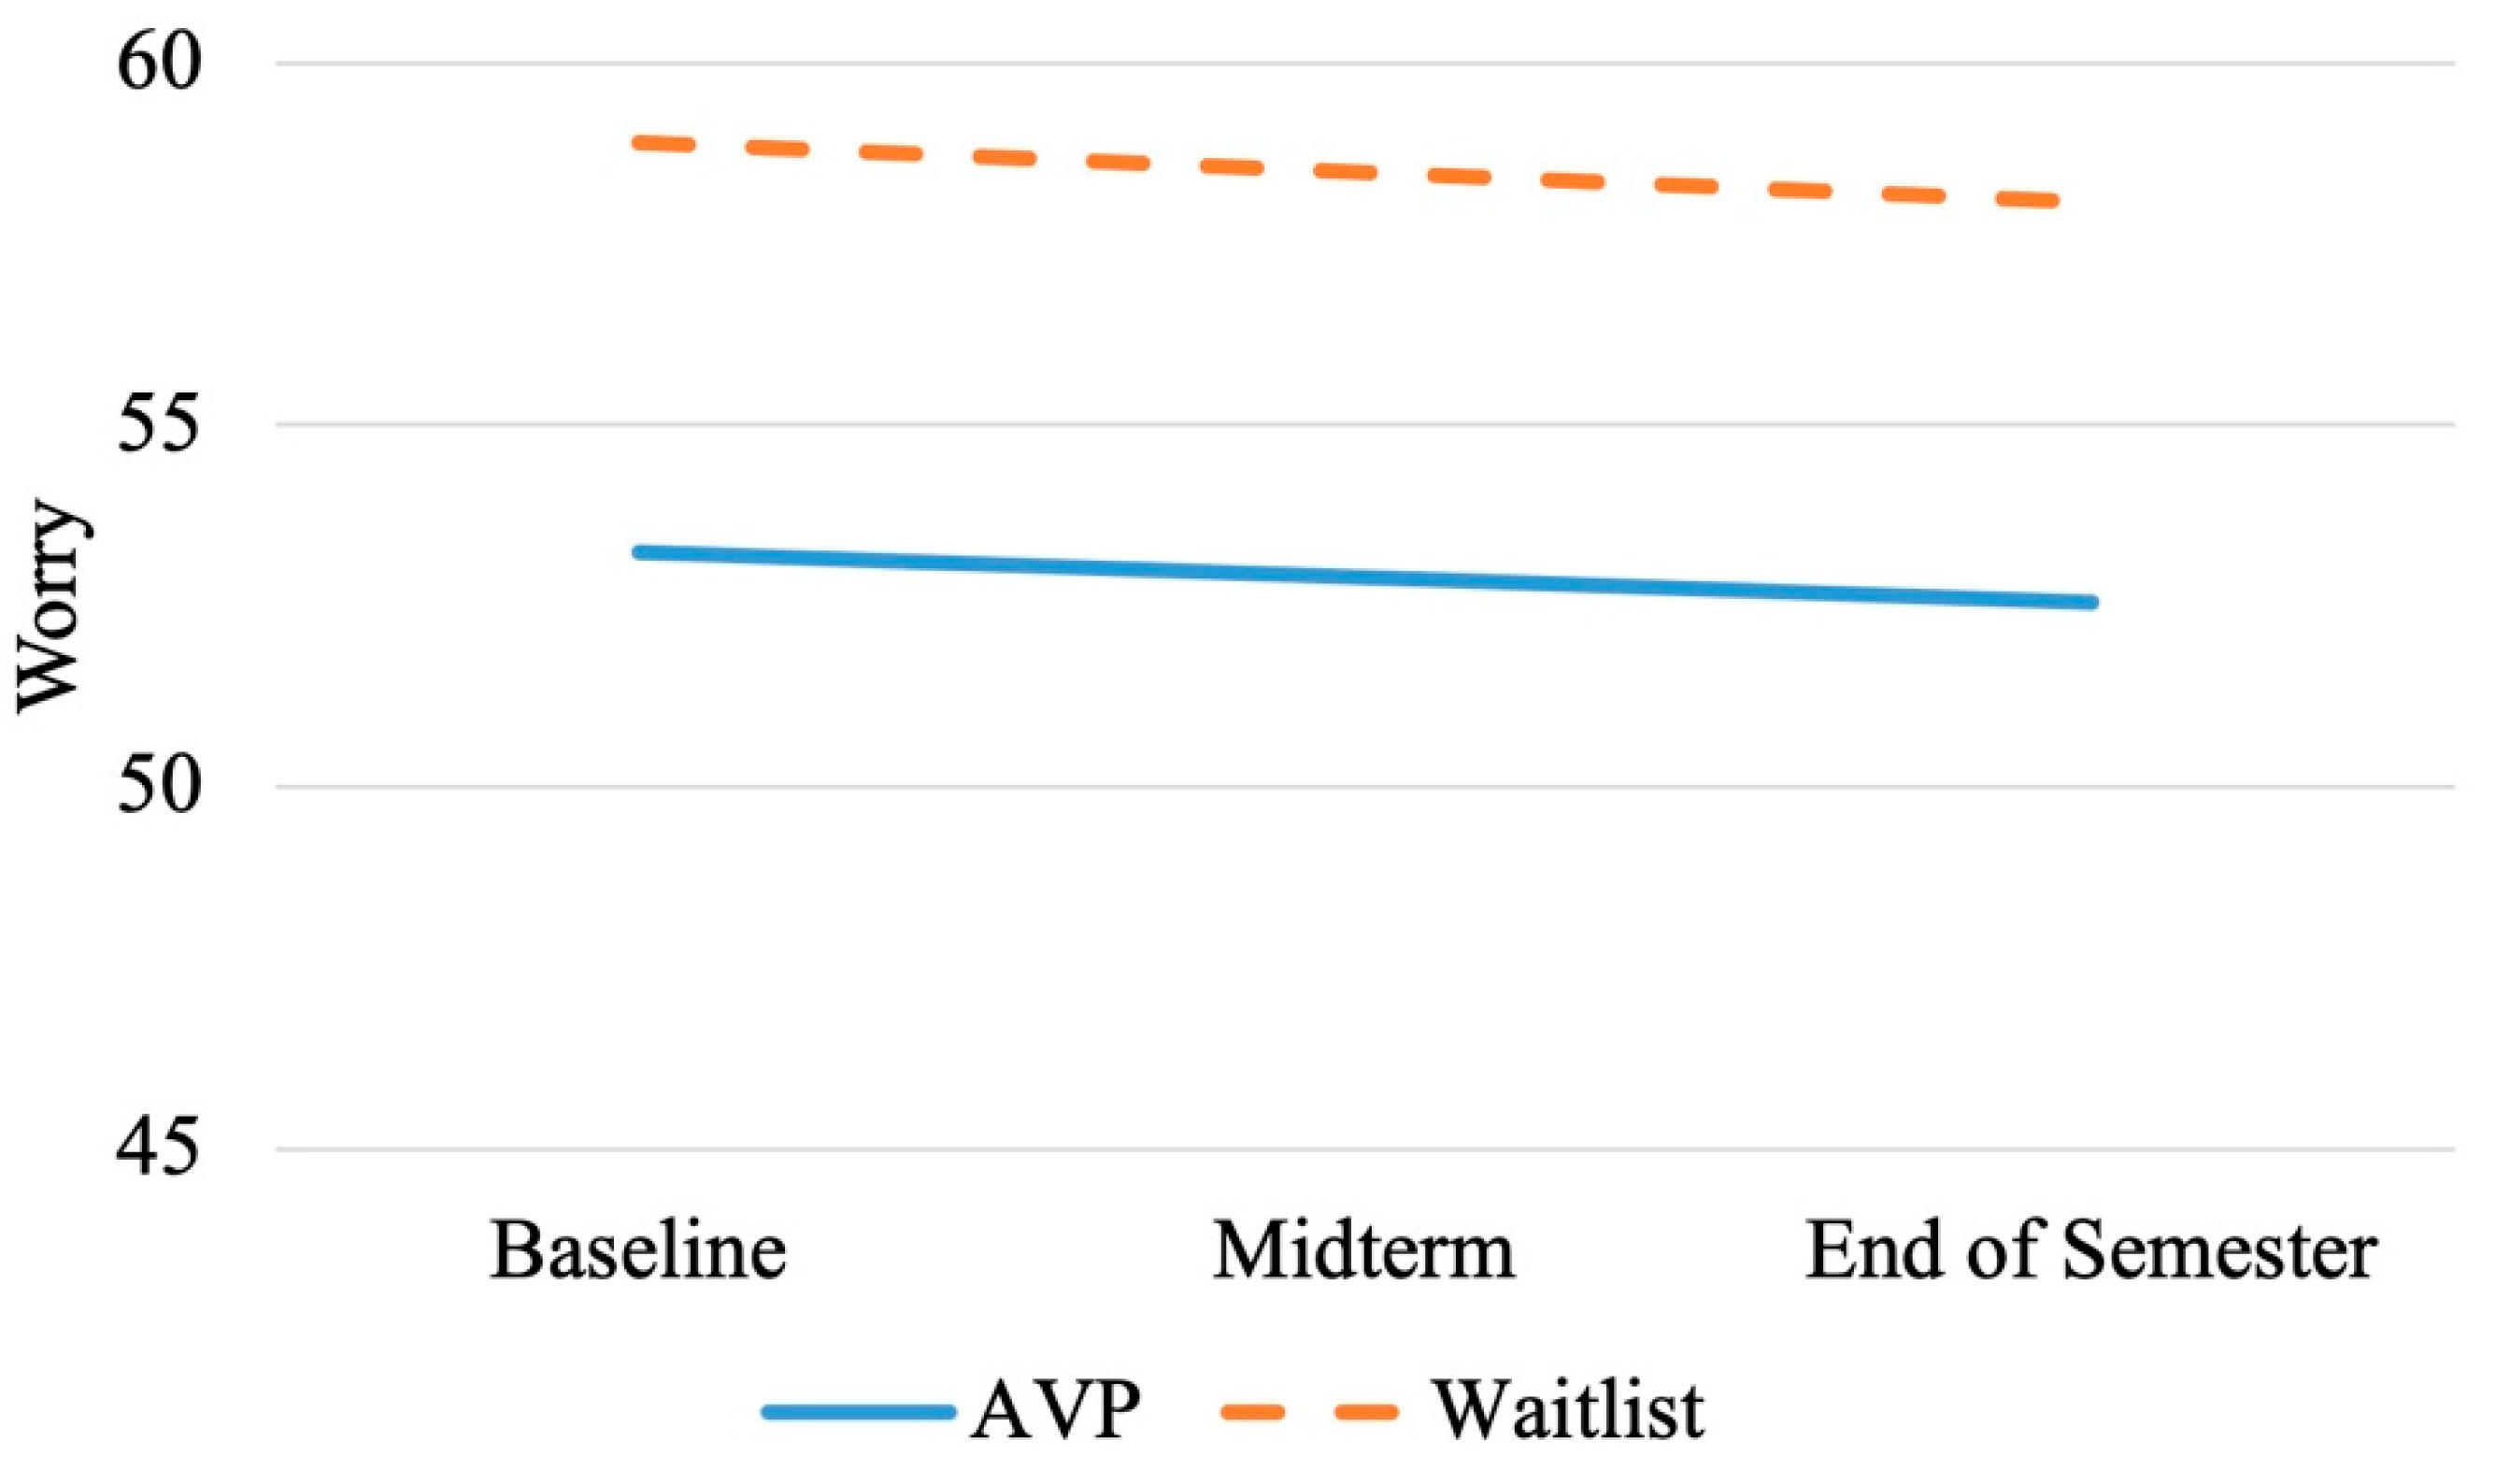
3.2.3. Worry Trajectory Slopes

Model fit statistics (Table 2—part 3), F(3,101) = 3.36, p = 0.022, R2 = 0.09, indicated there was a significant effect on students’ worry slope between participants’ treatment condition, high SA status, and program attendance status. Results show that random assignment to the PAWs4US condition predicted a significantly flatter worry trajectory slope over time, B = −3.92, p = 0.04, d = 0.42, while controlling for presence of high SA, B = 1.33, p = 0.38, d = 0.17, and program attendance, B = 6.22, p < 0.001, d = 0.62. Predicted slopes, displayed in Figure 2, show a negative slope for students randomly assigned to the AVP condition, M = −1.58, SD = 3.01, indicating decreasing levels of worry over time, compared to a slightly flatter negative slope—albeit minimally observed—for the waitlist condition, M = −0.59, SD = 0.60. The graphic representation confirms that there was a significant difference in mean levels of worry at baseline, which were confirmed in a t-test analysis (t = −2.67, p = 0.008). Waitlisted students (M = 58.89, SD = 11.53) reported significantly higher levels of worry at the start of the semester compared to AVP participants (M = 53.25, SD = 13.34). It is important, however, to note that the initial levels of worry by condition are considered in the calculated slope trajectories.

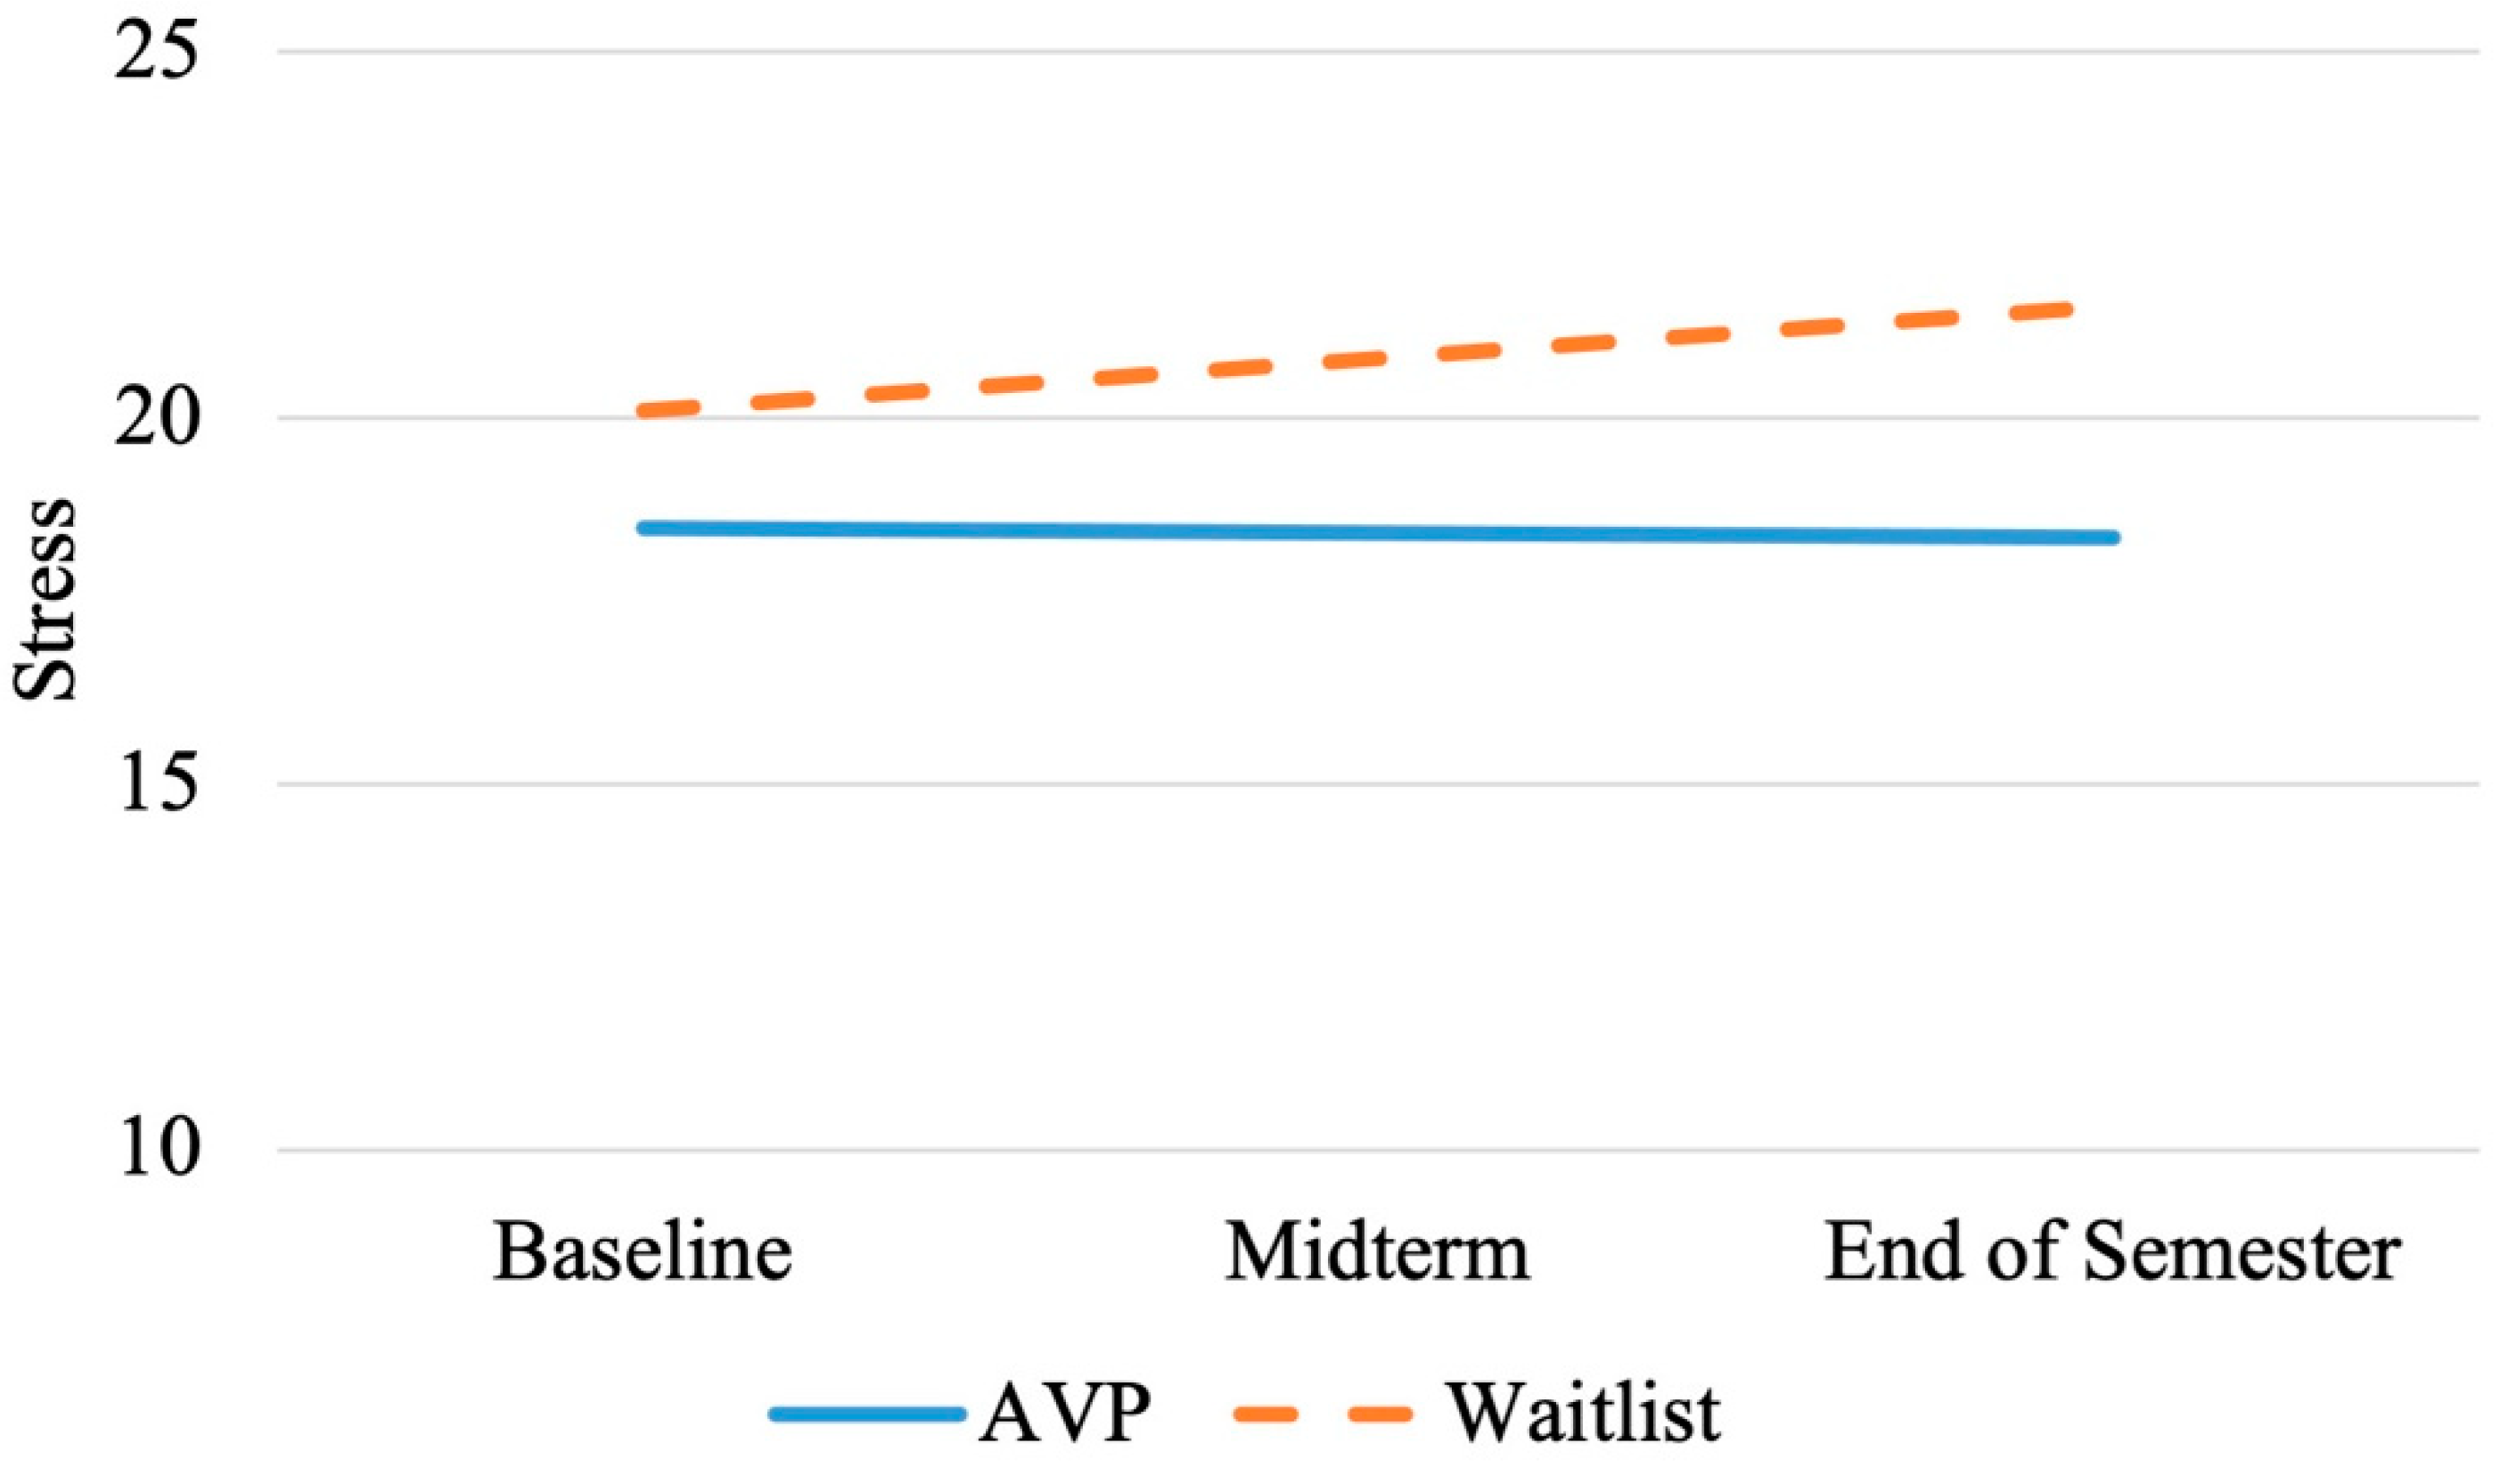
3.2.4. Stress Trajectory Slopes

Despite a lack of significant model fit statistics (F(3,100) = 1.28, p = 0.28, R2 = 0.04), regression results (Table 2—part 4) suggest that AVP exposure predicted marginally flatter trajectory slopes of stress over time, B = −1.94, p = 0.05, d = 0.39, while controlling for presence of high SA, B = 0.10, p = 0.90, d = 0.03, and program attendance, B = 1.40, p = 0.19, d = 0.26. Figure 3, displaying predicted slopes, shows trajectory slopes for the AVP condition as relatively flat with a slight negative slope M = −0.37, SD = 0.69. In contrast, trajectory slopes for waitlisted students suggest that students experience increasing levels of perceived stress over time, M = 0.90, SD = 0.05. This suggests that repeated exposure to drop-in AVP during students’ first semester on campus may gradually reduce students’ perceived stress during the transition to college.

3.2.5. Cognitive Reappraisal Trajectory Slopes

Results (Table 2—part 5) did not show significant model fit statistics (F(3,100) = 1.28, p = 0.062, R2 = 0.04). Regression results did reveal marginal program participation effects suggesting that AVP exposure resulted in marginally different trajectory slopes of cognitive reappraisal throughout the semester (B = −3.11, p = 0.05, d = 0.40) while controlling for presence of high SA, B = −1.69, p = 0.18, d = 0.27, and program attendance, B = 3.42, p = 0.04, d = 0.41. Graphic representation of slopes by condition did not reveal meaningful differences in slope trajectories suggesting that participation in three or more sessions of drop-in AVP was insufficient to significantly influence trajectory slopes of cognitive reappraisal.

3.2.6. Expressive Suppression Trajectory Slopes

Model fit statistics (Table 2—part 6) of the multiple linear regression analyses, F(3,99) = 1.60, p = 0.19, R2 = 0.05, indicated there were no significant differences in trajectories by treatment condition, B = −1.62, p = 0.11, d = 0.32, by high SA status, B = 1.10, p = 0.18, d = 0.27, or high program attendance, B = 2.08, p = 0.06, d = 0.38. Students in both the AVP and waitlist conditions displayed statistically similar negative trajectory slopes suggesting that participation in three or more sessions of drop-in AVP was insufficient to significantly influence trajectory slopes of expressive suppression.

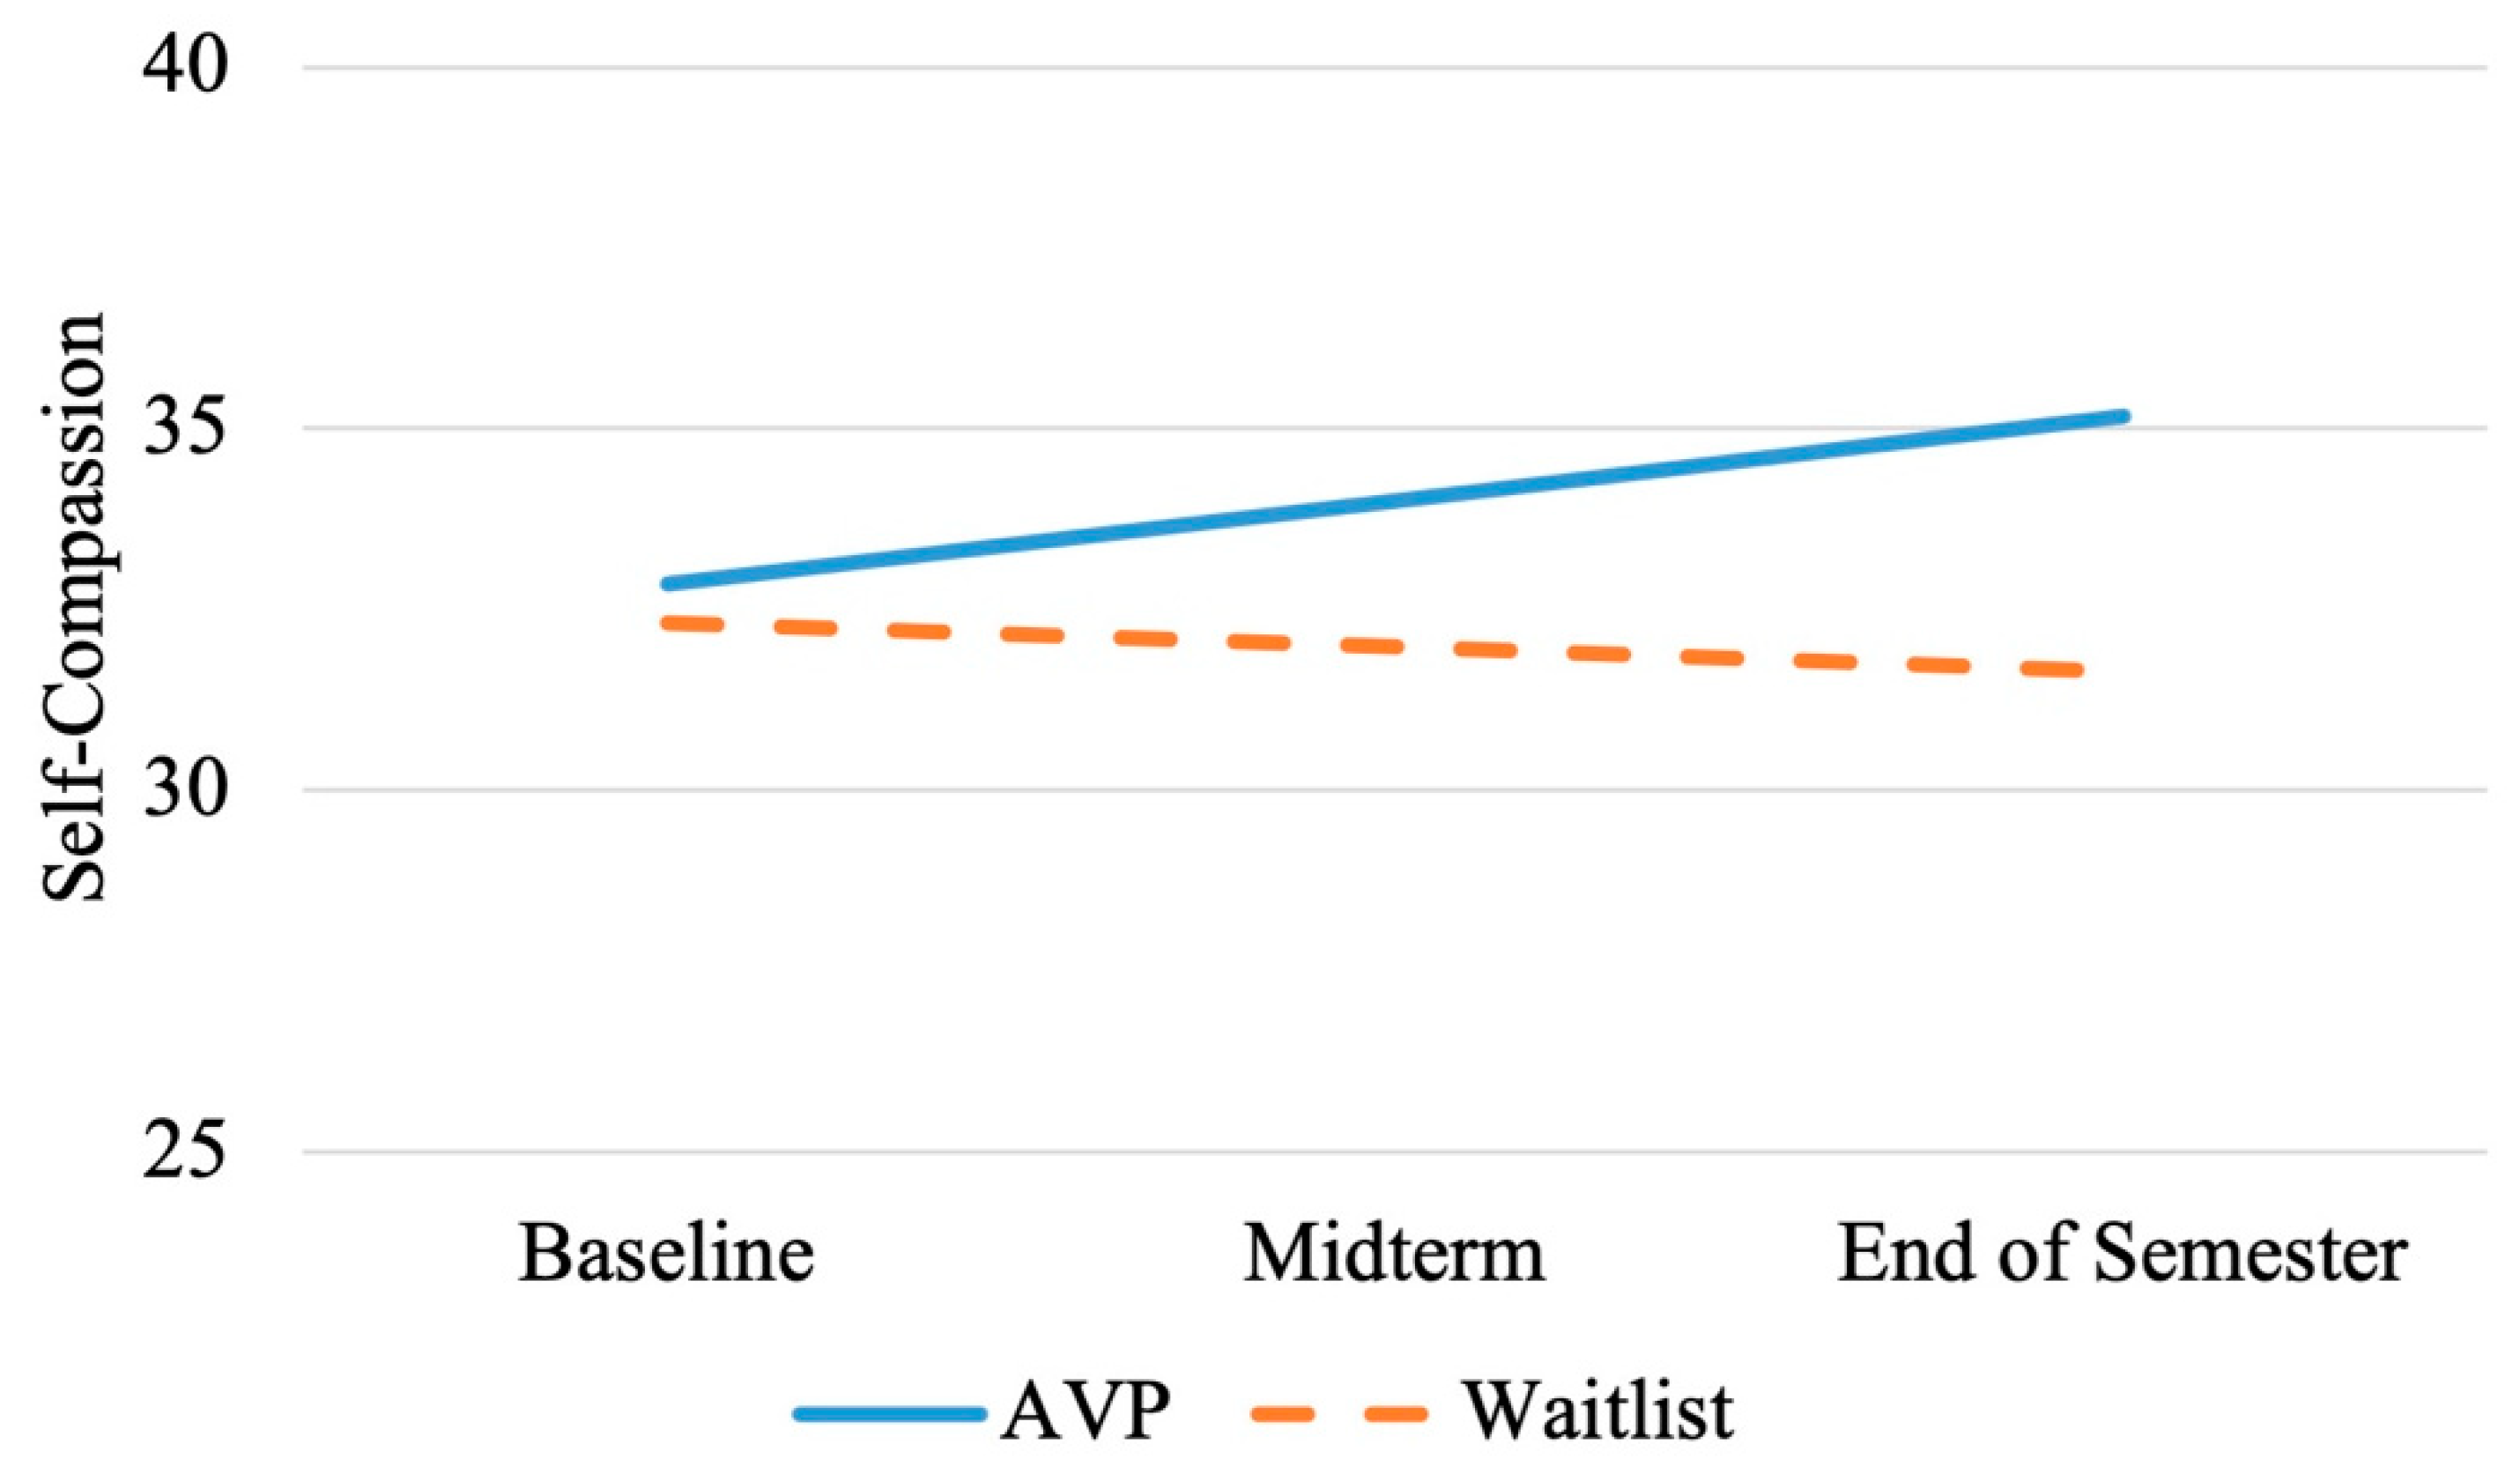
3.2.7. Self-Compassion Trajectory Slopes

Model fit statistics of the multiple linear regression analyses, F(3,99) = 3.21, p = 0.03, R2 = 0.09, indicated there was a significant effect on students’ self-compassion slope between participants’ treatment condition, high SA status, and program attendance status. Results show that random assignment to the AVP condition predicted a significantly steeper trajectory slope for self-compassion over time, B = 4.03, p < 0.001, d = 0.61, while controlling for the presence of high SA, B = −0.81, p = 0.45, d = 0.15, and program attendance, B = −3.63, p = 0.01, d = 0.51. Figure 4, displaying predicted slopes, shows a steeper positive slope trajectory for students assigned to the AVP condition, M = 1.96, SD = 1.76, suggesting that they experienced higher levels of self-compassion as the semester progressed. This is compared to students in the waitlist condition who had a flat slightly negative slope trajectory, M = −0.36, SD = 0.37, suggesting they experienced gradual and slight decreases in self-compassion throughout the semester. Note that the effect of program attendance is significantly important, suggesting that higher levels of attendance contribute to steeper slopes. This shows that participation in drop-in AVP promoted students’ self-compassion, a factor related to resilience, during their first semester on campus.

4. Discussion

This study investigated the impact of a drop-in animal visitation program (AVP) on first-year university students separated from their family pets. Participants were randomly assigned to either a seven-session bi-weekly AVP condition featuring unstructured interactions with therapy dogs or a waitlisted control group to evaluate whether AVPs could mitigate expected declines in psychological mood and functioning during the transition to university. Controlling for separation anxiety (SA) and AVP attendance allowed us to examine experimental effects while also considering effects of SA and participation on outcome trajectories.
The findings indicate that AVP participation promoted significantly better functioning in psychological wellbeing related to depression, worry, stress, and self-compassion. Students in the AVP condition exhibited stable or merely slightly declining trajectories for these measures, in contrast to control group students, who showed worsening symptoms over the semester. Interestingly, while AVP participation did not enhance adaptive emotion regulation strategies, the observed declines in both groups align with prior studies documenting deteriorations in these skills during the first university years [50]. A positive trajectory in self-compassion among AVP participants suggests this factor may support resilience against psychological challenges, although its broader impact requires further exploration. These results underscore AVPs as a viable intervention for fostering resilience during a high-risk period for mental health decline among first-year students [2]. Our results are especially relevant to students who experienced separation anxiety from their childhood pets. Importantly, no adverse effects of AVP participation were observed, aligning with prior research showing that animal-assisted activities effectively reduce stress in young adults [51].
Although the field of anthrozoology and human–animal interaction has few comprehensive definitive theories informing the effectiveness of AVPs, several factors have received increasing attention by researchers as playing a role in their effects: physical touch, social support, and participant expectancy. For example, the Human-Animal-Interaction-Hypothalamic-Pituitary-Adrenal (HAI-HPA) transactional model [52] which is guided by transactional models of stress and coping [53,54], hypothesizes that HAI affects stress and stress-related disorder by (a) affecting one’s appraisal of a situation as stressful, (b) down-regulating the production of cortisol once the event is appraised as stressful, and (c) aiding the appraisal and efficacy of coping resources, all of which promote buffering and further physiological recovery from a stressful event. Also, since stress and coping appraisal processes are informed by moment-to-moment transactions between one’s physiological and emotional states, they may inform each other to promote buffering and recovering effects during and after an acute stressor [52]. This would include positive emotions engendered from perceptions of social support from the animal, as well as other sources, such as fondness for the animal’s characteristics or enjoying their behaviors during the interaction [19]. Furthermore, touching and petting the program animals is believed to promote down-regulation of cortisol in response to oxytocin release in response to petting an animal [52]. In line with the HAI-HPA transactional model, our findings may thus have been accomplished in a variety of ways, including (a) providing a positive emotional valence to the experience of AVP participation, (b) prompting feelings of social support, and/or (c) by directly promoting physiological down-regulation through physical touch.
There are several studies that provide initial support particularly for the role of touch [55,56], and recent causal designs, conducted under naturalistic settings, have demonstrated similar results. Touching dogs has been demonstrated to promote more adaptive physiological stress responses in as little as 10 min [17,18], in addition to promoting students’ psychological and mental wellbeing [57] over and above simple proximity to the animals. That said, studies examining the effects of touch and proximity conducted in laboratory settings have not demonstrated consistent causal effects [58]. While this study did not specifically measure effects of touch over and beyond effects of social support of interacting with other students or handlers, students were always seated with the dogs and were engaged in uninterrupted touching the animals throughout the session without experiencing any interruptions due to survey completion or sharing of stress prevention information. In fact, when asked what they missed most about their pets throughout the semester, the inability to touch or be touched by their pets (e.g., petting, cuddling/snuggling, pet rubbing against me) emerged as a recurring theme. This confirms touch plays an important role in the human–animal bond and may inform the effectiveness of this AVP.
In addition, while this study did not directly measure students’ expectancy, participants were recruited to see whether “participating in [an AVP eased] the transition into [university] for students leaving their pets”. This language may have primed incoming students to expect that their participation in AVP would benefit them. While we cannot say for certain why students did not regularly attend the program, lack of attendance may not only reflect students’ scheduling availability/conflict but also their belief in how important or helpful AAA could be for them. It may also be the case that participants ceased attending the program due to perceptions that the program was not working such as feeling more stressed, missing their pet more than ever, etc. Future research into drop-in AVPs should further examine the relationship between expectancy, attendance, and program effects.
There are several components of this study that could be recognized for their strengths. First, this randomized controlled trial was conducted under naturalistic conditions in collaboration with experienced Pet Partner therapy dog teams. Participants assigned to the drop-in AVP condition were told they could access the program either day it was offered (despite signing up for a regular attendance day) for as long as they cared to attend for, and were not provided with incentives (i.e., compensation) for attending AVP sessions. This allowed a unique evaluation of real-world uptake of the program in relation to possible program effects. Next, this study featured a strong design characterized by a waitlist control condition that did not receive the intervention during the treatment period, and the use of psychometrically sound measures assessed at three time points. Finally, we reported on all outcomes assessed at baseline, midterm, and end of semester regardless of “positive, nonsignificant, or negative” results [59] (p. 16).
This study includes several limitations. To begin, we did not examine the role of total interaction time for each participant at each time point nor did we incorporate the type of interaction behavior that took place. While this does not minimize our internal validity, it does speak to our limited ability to fully understand the causal mechanisms underlying these results. For example, while interactions with animals are assumed to be the focus of the AVP session, in our approach, it was impossible to separate effects of socially supportive interactions with fellow students and animal handlers. That said, our aim was to examine whether offering a drop-in program was effective in promoting mental health and wellbeing rather than identifying contributions of specific program components.
Second, although reported outcomes were assessed at three different time points, the first assessment did not constitute a true baseline of functioning as it was measured immediately after students arrived on campus. Future research into students’ adaptation to university should include assessment of these factors prior to students’ arrival on campus since the first few days on campus are likely to be filled with many exciting yet stressful events and conditions which may have affected students’ baseline rating. On the other hand, students in both conditions were subject to this issue. Third, this study took a targeted approach assessing only first-year students separated from their pets, which suggests that the external validity of this study is limited to this population. Given AVPs’ popularity regardless of pet-ownership status, future research should assess whether non-pet-owning students experience similar effects during their first semester on campus as well. Fourth, while this study controlled the number of sessions attended, we did not control for the timing of when AVP sessions were attended. As such, it is not known if attending three or more sessions during the first several weeks on campus produces the same effects as attending AVP sessions less frequently but more regularly such as once every month, etc. Understanding the timing of when students attended was outside the scope of this paper. Additionally, as this study was embedded in a program uptake and evaluation approach, we did not examine the role of the duration of attendance, which would have been helpful to determine whether the slope of trajectories showing null findings would be affected by considering actual exposure. Finally, we acknowledge that our linear regression models predicting trajectories had small R2 values, suggesting that despite high variability in our data, our predictor variable still informed our outcome trajectories [60]. It is likely that a multitude of factors influence students’ mental health and wellbeing; however, our goal was not to predict maximum variance in our trajectories; it was to establish if there was a reliable relationship between treatment condition and outcome trajectories [61], which we accomplished.

5. Conclusions

Overall, findings presented in this paper represent some of the first to demonstrate that a university drop-in program featuring unstructured interactions with therapy animals constitutes an effective prevention program. Drop-in AVPs can protect students from commonly observed, expected, and potentially disruptive declines in psychological mood functioning during their first semester at university. However, just offering these programs is not sufficient; administrators must actively recruit and encourage students to attend at least three sessions during their first months on campus for students to experience program effects over time. Overall, students who regularly attended the program demonstrated more adaptive trajectories of depression, worry, stress, and self-compassion compared to students who did not. These findings should be interpreted in the context of first-year students separated from their pets. Future research is warranted to see whether participation in drop-in AVPs affects non-pet owning students’ psychological mood and wellbeing trajectory slopes during the first semester, as well as the extent to which specific behaviors during AVP participation inform program effects.

Author Contributions

Conceptualization, A.M.C. and P.P.; Methodology, A.M.C. and P.P.; Software, P.P.; Validation, A.M.C. and P.P.; Formal Analysis, A.M.C. and P.P.; Investigation, A.M.C. and P.P.; Resources, A.M.C. and P.P.; Data Curation, A.M.C. and P.P.; Writing—Original Draft Preparation, A.M.C.; Writing—Review and Editing, A.M.C. and P.P.; Visualization, A.M.C.; Supervision, A.M.C. and P.P.; Project Administration, A.M.C. and P.P.; Funding Acquisition, A.M.C. and P.P. All authors have read and agreed to the published version of the manuscript.

Funding

This research was funded by the Washington State University CAHNRS Edward E. Graff Scholarship awarded to the first author in support of her dissertation work. Funding was matched by the second author using university-provided professional development funds.

Institutional Review Board Statement

This study was conducted in accordance with the Declaration of Helsinki and approved by the Institutional Review Board of Washington State University (#17663-001). The animal study protocol was approved by the Institutional Animal Care and Use Committee (#6513-001) of Washington State University.

Informed Consent Statement

Informed consent was obtained from all subjects involved in this study, including Pet Partner handlers and their pets.

Data Availability Statement

The data supporting the conclusions of this article will be made available by the corresponding author on request.

Acknowledgments

Many thanks and gratitude to the Palouse Paws Pet Partner teams, participants, and the Pendry Lab undergraduate research team members who volunteered to make this study happen.

Conflicts of Interest

The authors declare no conflicts of interest.

References

  1. Auerbach, R.P.; Mortier, P.; Bruffaerts, R.; Alonso, J.; Benjet, C.; Cuijpers, P.; Demyttenaere, K.; Ebert, D.D.; Green, J.G.; Hasking, P.; et al. WHO World Mental Health Surveys International College Student Project: Prevalence and Distribution of Mental Disorders. J. Abnorm. Psychol. 2018, 127, 623–638. [Google Scholar] [CrossRef] [PubMed]
  2. Conley, C.S.; Kirsch, A.C.; Dickson, D.A.; Bryant, F.B. Negotiating the Transition to College: Developmental Trajectories and Gender Differences in Psychological Functioning, Cognitive-Affective Strategies, and Social Well-Being. Emerg. Adulthood 2014, 2, 195–210. [Google Scholar] [CrossRef]
  3. Rogers, A.A.; Updegraff, K.A.; Iida, M.; Dishion, T.J.; Doane, L.D.; Corbin, W.C.; Van Lenten, S.A.; Ha, T. Trajectories of Positive and Negative Affect across the Transition to College: The Role of Daily Interactions with Parents and Friends. Dev. Psychol. 2018, 54, 2181–2192. [Google Scholar] [CrossRef]
  4. Carr, A.M.; Pendry, P. Understanding Links between College Students’ Childhood Pet Ownership, Attachment, and Separation Anxiety during the Transition to College. Anthrozoös 2022, 35, 125–142. [Google Scholar] [CrossRef]
  5. Lipson, S.K.; Lattie, E.G.; Eisenberg, D. Increased Rates of Mental Health Service Utilization by U.S. College Students: 10-Year Population-Level Trends (2007–2017). Psychiatr. Serv. 2019, 70, 60–63. [Google Scholar] [CrossRef]
  6. APPA. Quick View of the 2021–2022 APPA National Pet Ownership Survey; APPA: Alexandria, VA, USA, 2021. [Google Scholar]
  7. HABRI; Zoetis. The Universal Human-Animal Bond; HABRI: Washington, DC, USA, 2022. [Google Scholar]
  8. Binfet, J.-T.; Passmore, H.-A.; Cebry, A.; Struik, K.; McKay, C. Reducing University Students’ Stress through a Drop-in Canine-Therapy Program. J. Ment. Health 2017, 27, 197–204. [Google Scholar] [CrossRef]
  9. Binfet, J.-T.; Passmore, H.-A. Hounds and Homesickness: The Effects of an Animal-Assisted Therapeutic Intervention for First-Year University Students. Anthrozoös 2016, 29, 441–454. [Google Scholar] [CrossRef]
  10. Kuzara, S.; Pendry, P.; Gee, N.R. Exploring the Handler-Dog Connection within a University-Based Animal-Assisted Activity. Animals 2019, 9, 402. [Google Scholar] [CrossRef] [PubMed]
  11. Barker, S.B.; Barker, R.T.; McCain, N.L.; Schubert, C.M. A Randomized Cross-over Exploratory Study of the Effect of Visiting Therapy Dogs on College Student Stress before Final Exams. Anthrozoös 2016, 29, 35–46. [Google Scholar] [CrossRef]
  12. House, L.A.; Neal, C.; Backels, K. A Doggone Way to Reduce Stress: An Animal Assisted Intervention with College Students. Coll. Stud. J. 2018, 52, 199–204. [Google Scholar]
  13. Crossman, M.K.; Kazdin, A.E. Animal Visitation Programs in Colleges and Universities: An Efficient Model for Reducing Student Stress. In Handbook on Animal—Assisted Therapy: Foundations and Guidelines for Animal Interactions; Fine, A.H., Ed.; Academic Press: San Diego, CA, USA, 2015; pp. 333–337. ISBN 978-0-12-801292-5. [Google Scholar]
  14. Grajfoner, D.; Harte, E.; Potter, L.; McGuigan, N. The Effect of Dog-Assisted Intervention on Student Well-Being, Mood, and Anxiety. Int. J. Environ. Res. Public Health 2017, 14, 483. [Google Scholar] [CrossRef]
  15. Pendry, P.; Carr, A.M.; Roeter, S.M.; Vandagriff, J.L. Experimental Trial Demonstrates Effects of Animal-Assisted Stress Prevention Program on College Students’ Positive and Negative Emotion. Hum. Anim. Interact. Bull. 2018, 6, 81–97. [Google Scholar] [CrossRef]
  16. Ward-Griffin, E.; Klaiber, P.; Collins, H.K.; Owens, R.L.; Coren, S.; Chen, F.S. Petting Away Pre-Exam Stress: The Effect of Therapy Dog Sessions on Student Well-Being. Stress Health 2018, 34, 468–473. [Google Scholar] [CrossRef]
  17. Pendry, P.; Vandagriff, J.L. Animal Visitation Program (AVP) Reduces Cortisol Levels of University Students: A Randomized Controlled Trial. AERA Open 2019, 5, 2332858419852592. [Google Scholar] [CrossRef]
  18. Vandagriff, J.L.; Carr, A.M.; Roeter Smith, S.M.; Pendry, P. Effects of Essential Animal Visitation Program (AVP) Components on Students’ Salivary α-Amylase and Amylase-to-Cortisol Ratios. Anthrozoös 2021, 35, 443–461. [Google Scholar] [CrossRef]
  19. Pendry, P.; Carr, A.M.; Gee, N.R.; Vandagriff, J.L. Randomized Trial Examining Effects of Animal Assisted Intervention and Stress Related Symptoms on College Students’ Learning and Study Skills. Int. J. Environ. Res. Public Health 2020, 17, 1909. [Google Scholar] [CrossRef] [PubMed]
  20. Pendry, P.; Carr, A.M.; Vandagriff, J.L.; Gee, N.R. Incorporating Human–Animal Interaction into Academic Stress Management Programs: Effects on Typical and at-Risk College Students’ Executive Function. AERA Open 2021, 7, 23328584211011612. [Google Scholar] [CrossRef]
  21. Bettis, A.H.; Coiro, M.J.; England, J.; Murphy, L.K.; Zelkowitz, R.L.; Dejardins, L.; Eskridge, R.; Adery, L.H.; Yarboi, J.; Pardo, D.; et al. Comparison of Two Approaches to Prevention of Mental Health Problems in College Students: Enhancing Coping and Executive Function Skills. J. Am. Coll. Health 2017, 65, 313–322. [Google Scholar] [CrossRef] [PubMed]
  22. Conley, C.S.; Durlak, J.A.; Kirsch, A.C. A Meta-Analysis of Universal Mental Health Prevention Programs for Higher Education Students. Prev. Sci. 2015, 16, 487–507. [Google Scholar] [CrossRef] [PubMed]
  23. Dunn, B.D. Helping Depressed Clients Reconnect to Positive Emotion Experience: Current Insights and Future Directions: Helping Depressed Clients Reconnect to Positive Emotion Experience. Clin. Psychol. Psychother. 2012, 19, 326–340. [Google Scholar] [CrossRef] [PubMed]
  24. Jau, J.; Hodgson, D. How Interaction with Animals Can Benefit Mental Health: A Phenomenological Study. Soc. Work Ment. Health 2018, 16, 20–33. [Google Scholar] [CrossRef]
  25. Fredrickson, B.L. The Role of Positive Emotions in Positive Psychology: The Broaden-and-Build Theory of Positive Emotions. Am. Psychol. 2001, 56, 218–226. [Google Scholar] [CrossRef]
  26. Fredrickson, B.L. Positive Emotions Broaden and Build. In Advances in Experimental Social Psychology; Elsevier: Amsterdam, The Netherlands, 2013; Volume 47, pp. 1–53. ISBN 978-0-12-407236-7. [Google Scholar]
  27. Gunnell, K.E.; Mosewich, A.D.; McEwen, C.E.; Eklund, R.C.; Crocker, P.R.E. Don’t Be so Hard on Yourself! Changes in Self-Compassion during the First Year of University Are Associated with Changes in Well-Being. Personal. Individ. Differ. 2017, 107, 43–48. [Google Scholar] [CrossRef]
  28. MacBeth, A.; Gumley, A. Exploring Compassion: A Meta-Analysis of the Association between Self-Compassion and Psychopathology. Clin. Psychol. Rev. 2012, 32, 545–552. [Google Scholar] [CrossRef] [PubMed]
  29. Bergen-Cico, D.; Smith, Y.; Wolford, K.; Gooley, C.; Hannon, K.; Woodruff, R.; Spicer, M.; Gump, B. Dog Ownership and Training Reduces Post-Traumatic Stress Symptoms and Increases Self-Compassion among Veterans: Results of a Longitudinal Control Study. J. Altern. Complement. Med. 2018, 24, 1166–1175. [Google Scholar] [CrossRef] [PubMed]
  30. Regehr, C.; Glancy, D.; Pitts, A. Interventions to Reduce Stress in University Students: A Review and Meta-Analysis. J. Affect. Disord. 2013, 148, 1–11. [Google Scholar] [CrossRef] [PubMed]
  31. Berkel, C.; Mauricio, A.M.; Schoenfelder, E.; Sandler, I.N. Putting the Pieces Together: An Integrated Model of Program Implementation. Prev. Sci. Off. J. Soc. Prev. Res. 2011, 12, 23–33. [Google Scholar] [CrossRef]
  32. Fournier, A.K. HAI Dose in Animal-Assisted Intervention. In Animal—Assisted Intervention: Thinking Empirically; Fournier, A.K., Ed.; Springer International Publishing: Cham, Switzerland, 2019; pp. 31–51. ISBN 978-3-030-32972-3. [Google Scholar]
  33. Carr, A.M.; Pendry, P. Assessing Attendance Frequency and Duration at a Drop-In Animal Visitation Program Among First-Semester University Students Separated from Their Pets. Anthrozoös 2024, 37, 55–74. [Google Scholar] [CrossRef]
  34. IAHAIO. The IAHAIO Definitions for Animal Assisted Intervention and Guidelines for Wellness of Animals Involved in AAI. In Handbook on Animal—Assisted Therapy; Fine Aubrey, H., Ed.; Elsevier: Amsterdam, The Netherlands, 2018; pp. 499–504. ISBN 978-0-12-815395-6. [Google Scholar]
  35. Pet Partners Therapy Pets & Animal Assisted Activities. Available online: https://petpartners.org/ (accessed on 18 October 2019).
  36. Beck, A.T.; Steer, R.A.; Brown, G.K. Manual for the Beck Depression Inventory, 2nd ed.; The Psychological Corporation: San Antonio, TX, USA, 1996. [Google Scholar]
  37. Nezu, A.M.; Ronan, G.F.; Meadows, E.A.; McClure, K.S. Practitioner’s Guide to Empirically—Based Measures of Depression; Springer Science & Business Media: Berlin/Heidelberg, Germany, 2000; ISBN 0-306-46246-X. [Google Scholar]
  38. Beck, A.T.; Steer, R.A. Beck Anxiety Inventory: Manual, 2nd ed.; The Psychiatric Association: San Antonio, TX, USA, 1993. [Google Scholar]
  39. de Beurs, E.; Wilson, K.A.; Chambless, D.L.; Goldstein, A.J.; Feske, U. Convergent and Divergent Validity of the Beck Anxiety Inventory for Patients with Panic Disorder and Agoraphobia. Depress. Anxiety 1997, 6, 140–146. [Google Scholar] [CrossRef]
  40. Meyer, T.J.; Miller, M.L.; Metzger, R.L.; Borkovec, T.D. Development and Validation of the Penn State Worry Questionnaire. Behav. Res. Ther. 1990, 28, 487–495. [Google Scholar] [CrossRef]
  41. Brown, T.A.; Antony, M.M.; Barlow, D.H. Psychometric Properties of the Penn State Worry Questionnaire in a Clinical Anxiety Disorders Sample. Behav. Res. Ther. 1992, 30, 33–37. [Google Scholar] [CrossRef] [PubMed]
  42. Cohen, S. Perceived Stress in a Probability Sample of the United States. In The Social Psychology of Health; Spacapan, S., Oskamp, S., Eds.; SAGE Publications: Thousand Oaks, CA, USA, 1988; pp. 31–67. [Google Scholar]
  43. Cohen, S.; Kamarck, T.; Mermelstein, R. A Global Measure of Perceived Stress. J. Health Soc. Behav. 1983, 24, 385–396. [Google Scholar] [CrossRef] [PubMed]
  44. Gross, J.J.; John, O.P. Emotion Regulation Questionnaire. J. Personal. Soc. Psychol. 2013, 85, 348–362. [Google Scholar] [CrossRef]
  45. Schäfer, J.Ö.; Naumann, E.; Holmes, E.A.; Tuschen-Caffier, B.; Samson, A.C. Emotion Regulation Strategies in Depressive and Anxiety Symptoms in Youth: A Meta-Analytic Review. J. Youth Adolesc. 2017, 46, 261–276. [Google Scholar] [CrossRef] [PubMed]
  46. Raes, F.; Pommier, E.; Neff, K.D.; Van Gucht, D. Construction and Factorial Validation of a Short Form of the Self-Compassion Scale. Clin. Psychol. Psychother. 2011, 18, 250–255. [Google Scholar] [CrossRef] [PubMed]
  47. Craske, M.; Wittchen, U.; Bogels, S.; Stein, M.; Andrews, G.; Lebeu, R. DSM-5 Severity Measure for Separation Anxiety Disorder 2013. Available online: https://www.psychiatry.org/File%20Library/Psychiatrists/Practice/DSM/APA_DSM5_Severity-Measure-For-Separation-Anxiety-Disorder-Adult.pdf (accessed on 10 May 2019).
  48. Newman, D.A. Missing Data: Five Practical Guidelines. Organ. Res. Methods 2014, 17, 372–411. [Google Scholar] [CrossRef]
  49. Pfister, R.; Schwarz, K.; Carson, R.; Jancyzk, M. Easy Methods for Extracting Individual Regression Slopes: Comparing SPSS, R, and Excel. Tutor. Quant. Methods Psychol. 2013, 9, 72–78. [Google Scholar] [CrossRef]
  50. Park, C.L.; Williams, M.K.; Hernandez, P.R.; Agocha, V.B.; Lee, S.Y.; Carney, L.M.; Loomis, D. Development of Emotion Regulation across the First Two Years of College. J. Adolesc. 2020, 84, 230–242. [Google Scholar] [CrossRef] [PubMed]
  51. Ein, N.; Li, L.; Vickers, K. The Effect of Pet Therapy on the Physiological and Subjective Stress Response: A Meta-Analysis. Stress Health 2018, 34, 477–489. [Google Scholar] [CrossRef]
  52. Pendry, P.; Vandagriff, J.L. Salivary Studies of the Social Neuroscience of Human-Animal Interaction. In Salivary Bioscience: Foundations of Interdisciplinary Saliva Research and Applications; Granger, D.A., Taylor, M.K., Eds.; Springer International Publishing: Cham, Switzerland, 2020; ISBN 978-3-030-35783-2. [Google Scholar]
  53. Cohen, S.; Wills, T.A. Stress, Social Support, and the Buffering Hypothesis. Psychol. Bull. 1985, 98, 310–357. [Google Scholar] [CrossRef]
  54. Lazarus, R.S.; Folkman, S. Transactional Theory and Research on Emotions and Coping. Eur. J. Personal. 1987, 1, 141–169. [Google Scholar] [CrossRef]
  55. Sokal, L.; Bartel, B.; Martin, T. Effects of Touch on Students’ Stress, Happiness, and Well-Being during Animal-Assisted Activities. J. Educ. Dev. 2021, 5, 111. [Google Scholar] [CrossRef]
  56. Thelwell, E.L.R. Paws for Thought: A Controlled Study Investigating the Benefits of Interacting with a House-Trained Dog on University Students Mood and Anxiety. Animals 2019, 9, 846. [Google Scholar] [CrossRef]
  57. Binfet, J.-T.; Green, F.L.L.; Draper, Z.A. The Importance of Client–Canine Contact in Canine-Assisted Interventions: A Randomized Controlled Trial. Anthrozoös 2022, 35, 1–22. [Google Scholar] [CrossRef]
  58. Mueller, M.K.; Anderson, E.C.; King, E.K.; Urry, H.L. Null Effects of Therapy Dog Interaction on Adolescent Anxiety during a Laboratory-Based Social Evaluative Stressor. Anxiety Stress Coping 2021, 34, 365–380. [Google Scholar] [CrossRef] [PubMed]
  59. Gottfredson, D.C.; Cook, T.D.; Gardner, F.E.M.; Gorman-Smith, D.; Howe, G.W.; Sandler, I.N.; Zafft, K.M. Standards of Evidence for Efficacy, Effectiveness, and Scale-up Research in Prevention Science: Next Generation. Prev. Sci. 2015, 16, 893–926. [Google Scholar] [CrossRef] [PubMed]
  60. Minitab Blog Editor. How to Interpret a Regression Model with Low R-Squared and Low P Values. Available online: https://blog.minitab.com/en/adventures-in-statistics-2/how-to-interpret-a-regression-model-with-low-r-squared-and-low-p-values (accessed on 20 March 2022).
  61. Grace-Martin, K. Can a Regression Model with a Small R-Squared Be Useful? 2012. Available online: https://www.theanalysisfactor.com/small-r-squared/ (accessed on 15 November 2024).
Figure 1. Predicted slopes of depression by treatment condition (n = 103). Predicted slopes control for high separation anxiety status, and high program attendance status.
Pets 02 00008 g001
Figure 2. Predicted slopes of worry by treatment condition (n = 105). Predicted slopes control for high separation anxiety status, and high program attendance status.
Pets 02 00008 g002
Figure 3. Predicted slopes of stress by treatment condition (n = 104). Predicted slopes control for high separation anxiety status, and high program attendance status.
Pets 02 00008 g003
Figure 4. Predicted slopes of self-compassion by treatment condition (n = 103). Predicted slopes control for high separation anxiety status, and high program attendance status.
Pets 02 00008 g004
Table 1. Means and standard deviations of psychological mood factors by severity of separation anxiety symptom.
TotalNo SA Low SAHigh SAs
MSDMSDMSDMSDFpη2Comparison
Baseline (n = 106)
Depression12.109.358.077.0010.676.5719.7512.3713.96<0.0010.215N-H; L-H
Anxiety 17.3911.5210.296.7816.119.1328.3313.0523.16<0.0010.310N-L; N-H; L-H
Worry 55.8312.8249.0612.8556.2411.8861.4611.817.36<0.0010.126N-H; L-H
Stress19.415.9115.675.9119.164.3924.215.8117.64<0.0010.255N-L; N-H; L-H
Emotional Reappraisal33.407.1434.228.3832.507.0532.504.420.3650.4890.007
Emotional Suppression18.205.4416.744.8318.455.5019.255.851.490.2300.028
Self-Compassion32.617.4334.767.0132.537.2830.357.872.220.1140.042
Midterm (n = 101)
Depression12.8610.169.858.8610.857.3020.8313.0511.09<0.0010.185N-H; L-H
Anxiety 15.2811.339.198.2513.988.8025.0913.3416.72<0.0010.254N-H; L-H
Worry 56.5413.1652.5813.7254.9012.9364.749.506.740.0020.121N-H; L-H
Stress20.167.5317.237.9619.316.7125.646.209.52<0.0010.164N-H; L-H
Emotional Reappraisal23.967.4125.126.7624.697.8321.006.602.480.0890.048
Emotional Suppression17.045.3114.885.8317.445.2918.574.043.400.0380.065N-H
Self-Compassion33.008.0033.929.0133.858.1730.045.682.080.1310.041
End of Semester (n = 90)
Depression14.6112.279.1610.2513.589.8824.2114.7010.21<0.0010.192N-H; L-H
Anxiety 15.9913.139.009.5015.2410.7626.4015.6812.45<0.0010.222N-H; L-H
Worry 57.1913.2852.8014.2457.0713.1563.2610.163.550.0330.077N-H
Stress20.377.4216.686.4520.767.1524.107.356.360.0030.128N-H
Emotional Reappraisal24.667.6026.127.6325.008.1921.955.531.740.1810.039
Emotional Suppression16.484.8714.845.1216.864.5217.745.012.250.1120.050
Self-Compassion32.448.3533.929.6032.318.1730.797.010.770.4690.017
Note: N = No SA symptoms. L = Low (Mild) SA symptoms. H = High (Moderate–Severe) SA symptoms. Comparisons assessed with Bonferroni correction.
Table 2. Multiple regression predicting slopes of trajectories of change across students’ first semester.
BSEßtpd
1. Depression (n = 103, R2 = 0.083, p = 0.034)
(Constant)1.110.59 1.890.06
Experimental −3.051.18−0.38−2.580.01 **0.514
High SA1.540.950.161.620.110.322
High Attendance3.151.270.372.490.01 **0.496
2. Anxiety (n = 104, R2 = 0.007, p = 0.870)
(Constant)−0.420.84 −0.510.61
Experimental 0.151.630.010.090.930.018
High SA−1.081.33−0.08−0.820.420.162
High Attendance−0.061.76−0.01−0.030.980.006
3. Worry (n = 105, R2 = 0.09, p = 0.022)
(Constant)−0.960.96 −1.000.32
Experimental −3.921.85−0.30−2.110.04 *0.416
High SA1.331.510.090.880.380.173
High Attendance6.221.980.453.14<0.001 ***0.619
4. Perceived Stress (n = 104, R2 = 0.04, p = 0.283)
(Constant)0.870.50 1.750.08
Experimental −1.941.00−0.29−1.950.05 *0.386
High SA0.100.790.010.130.900.026
High Attendance1.401.070.201.310.190.259
5. Cognitive Reappraisal (n = 104, R2 = 0.07, p = 0.062)
(Constant)−4.710.78 −6.06<0.001 ***
Experimental −3.111.56−0.294−2.000.05 *0.396
High SA−1.691.24−0.135−1.370.180.271
High Attendance3.421.670.3062.050.04 *0.406
6. Expressive Suppression (n = 103, R2 = 0.05, p = 0.194)
(Constant)−1.310.50 −2.600.01
Experimental −1.621.00−0.240−1.610.110.320
High SA1.100.820.1371.350.180.269
High Attendance2.081.090.2911.920.06 0.382
7. Self-Compassion (n = 103, R2 = 0.09, p = 0.026)
(Constant)−0.130.66 −0.200.84
Experimental 4.031.320.453.04<0.001 ***0.605
High SA−0.811.06−0.08−0.760.450.151
High Attendance−3.631.42−0.38−2.570.01 **0.512
Note: * p < 0.05. ** p < 0.01. *** p < 0.001.  p < 0.10. High SA = Presence of moderate–severe symptoms of separation anxiety from pet. High Attendance = Whether attended 3 or more AVP sessions during first semester.
Disclaimer/Publisher’s Note: The statements, opinions and data contained in all publications are solely those of the individual author(s) and contributor(s) and not of MDPI and/or the editor(s). MDPI and/or the editor(s) disclaim responsibility for any injury to people or property resulting from any ideas, methods, instructions or products referred to in the content.

