Abstract
Prehospital care, and especially emergency medical services (EMSs), are facing an increasing demand, while experiencing financial pressure. Strategies aimed at improving prehospital care management emphasize the efficient utilization of resources, but often overlook the long-term implications for the prehospital healthcare system, encompassing emergency medical services, emergency departments, and healthcare authorities. This paper draws on almost ten years of improvement in EMS’ key performance indicators such as response time or overtime in Switzerland, using Discrete Event Simulation. Three representative simulation studies are used to reflect on the optimization potential of alternative bases and rosters, methodological limitations, and the uptake of the derived recommendations. The results demonstrate that EMSs’ efficiency gains in resource utilization increasingly come into conflict with emergency departments’ and healthcare authorities’ policies, indicating a need to enrich Discrete Event Simulation with a systemic perspective. A new methodology that conceptualizes long-term prehospital care planning as an interdisciplinary and iterative process utilizing a novel combination of System Dynamics and Discrete Event Simulation is proposed.
1. Introduction
Emergency medical services (EMSs) primarily provide support when urgent medical help is needed. They play a crucial role in prehospital care to prevent life-threatening delays [1,2] as they take severely injured patients to the closest emergency department for appropriate treatment in urgent rescue service operations. In Switzerland, EMSs also handle patient transportation and, in total, Swiss EMSs respond to around 500,000 incidents per year [3], costing approximately CHF one billion [4]. Total healthcare costs in Switzerland have risen to CHF 86.3 billion in 2021, marking an inflation-adjusted increase of 53.7% since 2000. The latest consistent data, which also break down the data to prehospital care, can be found in [4]. Healthcare costs now account for 11.8% of the gross domestic product (GDP) [5], of which 1.2% are due to EMSs.
In Switzerland, the regulation of EMSs and emergency departments occurs at the cantonal (a canton is a political and administrative subdivision of Switzerland with its own government, laws, and cultural characteristics. Switzerland consists of 26 cantons.) level. This means that there is no centralized prehospital healthcare planning at the federal level, which leads to an isolated perspective of prehospital healthcare planning in Switzerland. The means of regulation in most cantons are performance indicators, with response time (i.e., the duration between emergency dispatch and arrival at the scene [6,7]) being the most relevant. Improvements in response time can be primarily achieved through improved resource allocation mechanisms (vehicles, teams, rosters). While these performance indicators are set at the cantonal level, municipalities finance EMSs, and EMSs self-organize.
In recent years, financial pressure on Swiss EMSs has steadily increased as healthcare authorities have raised response time targets using the 90-15-rule based on recommendations of the Inter-association for Rescue Services (The “Interverband für Rettungswesen”, IVR) directive [6] while funding has been frozen or cut [8]. The 90-15-rule states that 90% of all emergencies (incidents) need to be reached within 15 min for every EMS organization and corresponds to a response time compliance rate of 90% [7]. At the same time, EMSs are responding to more incidents [7], which may be attributed to changes in demography and family support systems. This trend appears in regions such as Germany, Austria, and Switzerland, although the total numbers vary significantly, as shown in Appendix A. The overall situation is further compounded by a shortage of skilled workers in the entire healthcare system, including prehospital care [9].
The challenge of planning and optimizing EMSs (e.g., optimal base locations or deployment schedules, temporary relocation of units) has long attracted the attention of operations researchers, with mathematical optimization playing a prominent role in this domain. Academic research emphasizes computer simulation and optimization methodologies like Integer Linear Programming, while practical applications tend to lean toward Discrete Event Simulation (DES) due to its versatility and adaptability to local nuances [7,10,11,12].
This article reflects on almost 10 years of optimizing EMSs in Switzerland using DES and discusses its systemic limitations (e.g., misguided incentives), using three representative simulation studies. Finally, we propose an extended methodology for systematic prehospital care planning.
2. Materials and Methods
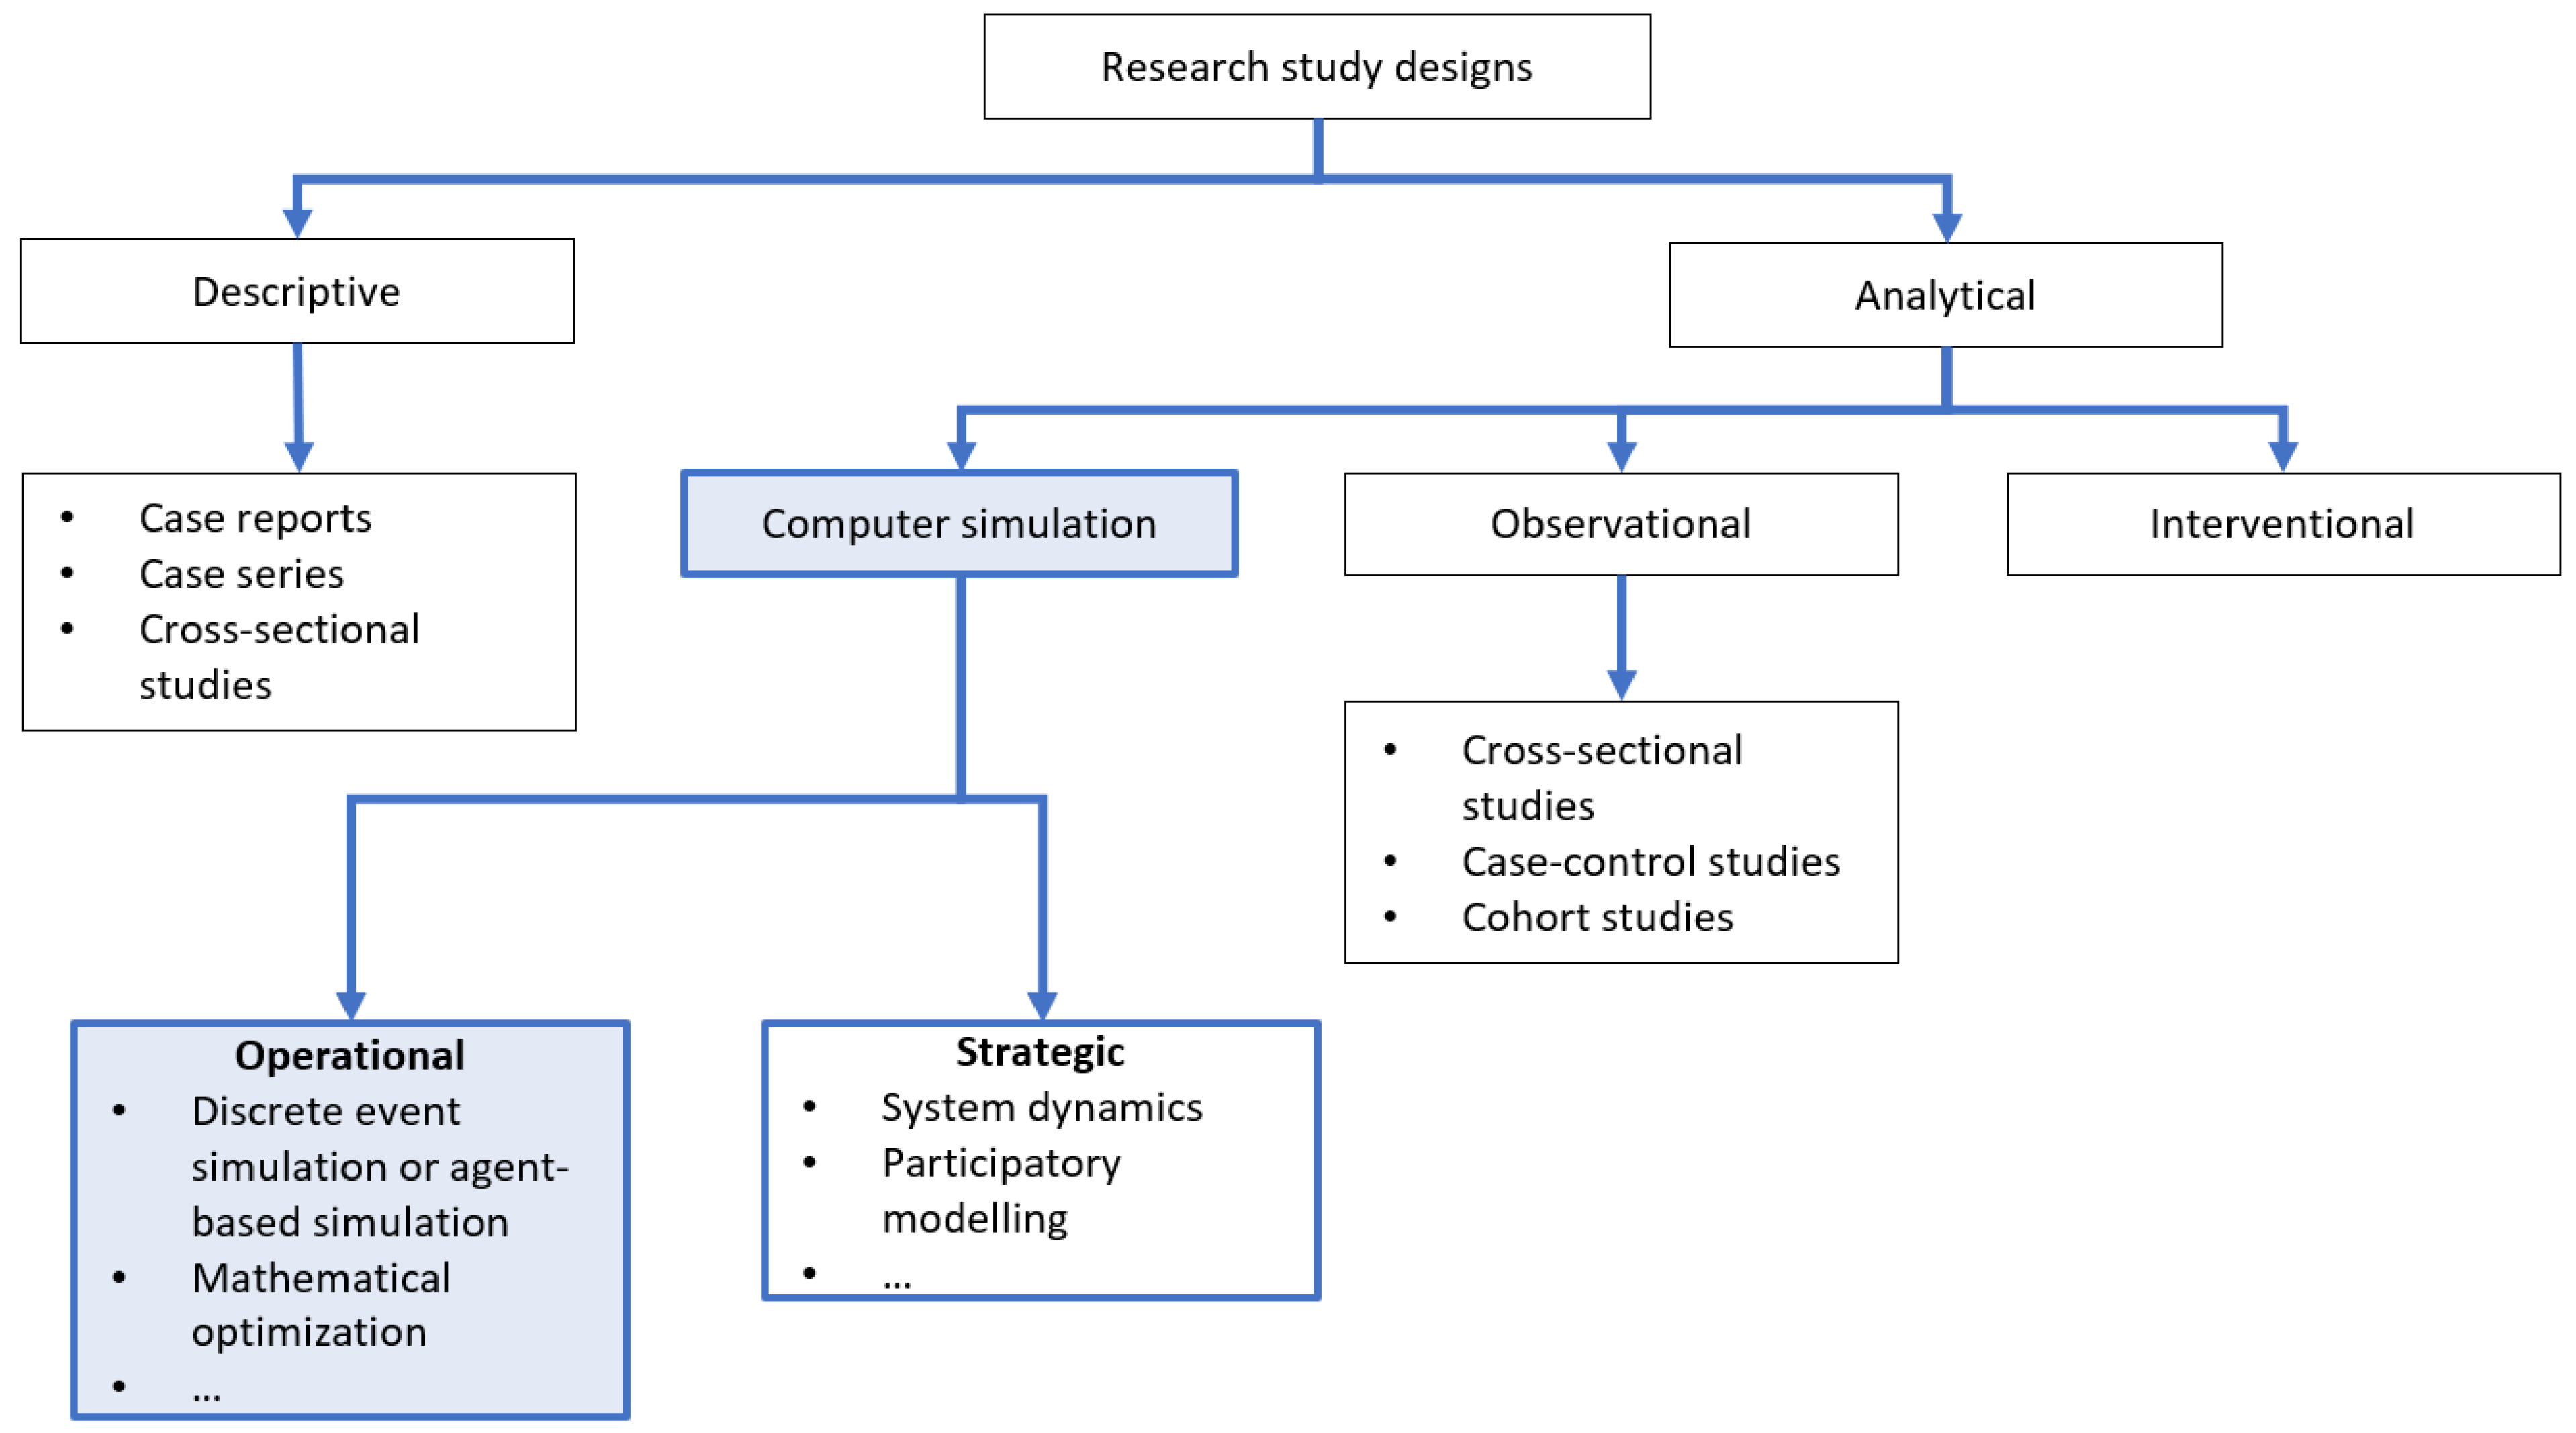
Figure 1 describes common research designs from a medical perspective. Analytical studies differentiate between observational studies and those that introduce changes to the system (interventions). Computer simulation helps to improve prehospital care planning (i.e., EMSs, emergency departments, and healthcare authorities) [10,13,14,15,16,17,18,19,20] and is less commonly used in medical contexts, but is widely used in the analysis of complex processes (this list is not exhaustive, as computer-aided simulation is also utilized in social science contexts, as demonstrated by the works of [21,22] in the field of societal transitions.). Aringhieri et al. [13] provide a comprehensive review of research on optimized EMS planning, covering static and dynamic ambulance location models, relocation strategies, as well as dispatching and routing policies.
Figure 1.
Research methodology based on medical standards summarized by Ranganathan and Aggarwal [23]. Our article is located in the area of operational computer simulations which is highlighted in blue.
This paper describes the use of computer simulation to improve the operational performance of EMSs, with an explicit focus on simulation studies that apply DES.
2.1. Simulation Study Design
In Switzerland, the Institute for Modeling and Simulation has been using DES for 10 years for the analysis and optimization of EMSs [7,12]. This article’s study design is a retrospective analysis of the regional background, optimization potential, and further observations (see Section 3) of three simulation studies. Each of these studies is structured as follows:
- Description of study backgroundRegional context and specific objectives of each simulation study, defining the decision variables, are presented.
- DES processRule-based DES offers maximum flexibility to account for cantonal conditions and contains the following four steps:
- (a)
- Import, validation, and analysis of historical dataHistorical EMS data of incidents (the “where”, “when”, and “what” happened) and the teams’ availability (rosters for paramedics, emergency doctors, …) for the period under consideration are imported. A standardized import routine ensures a consistent technical validation of historical data provided by EMSs across cantons (e.g., non-negative travel times, missing team labels, missing coordinates, completion of incident) and correct calculation of response time in line with IVR regulations [6]. The result of this process is a validated and accepted dataset called historical scenario, which serves as input for simulation and contains all relevant historical incidents and available teams.
- (b)
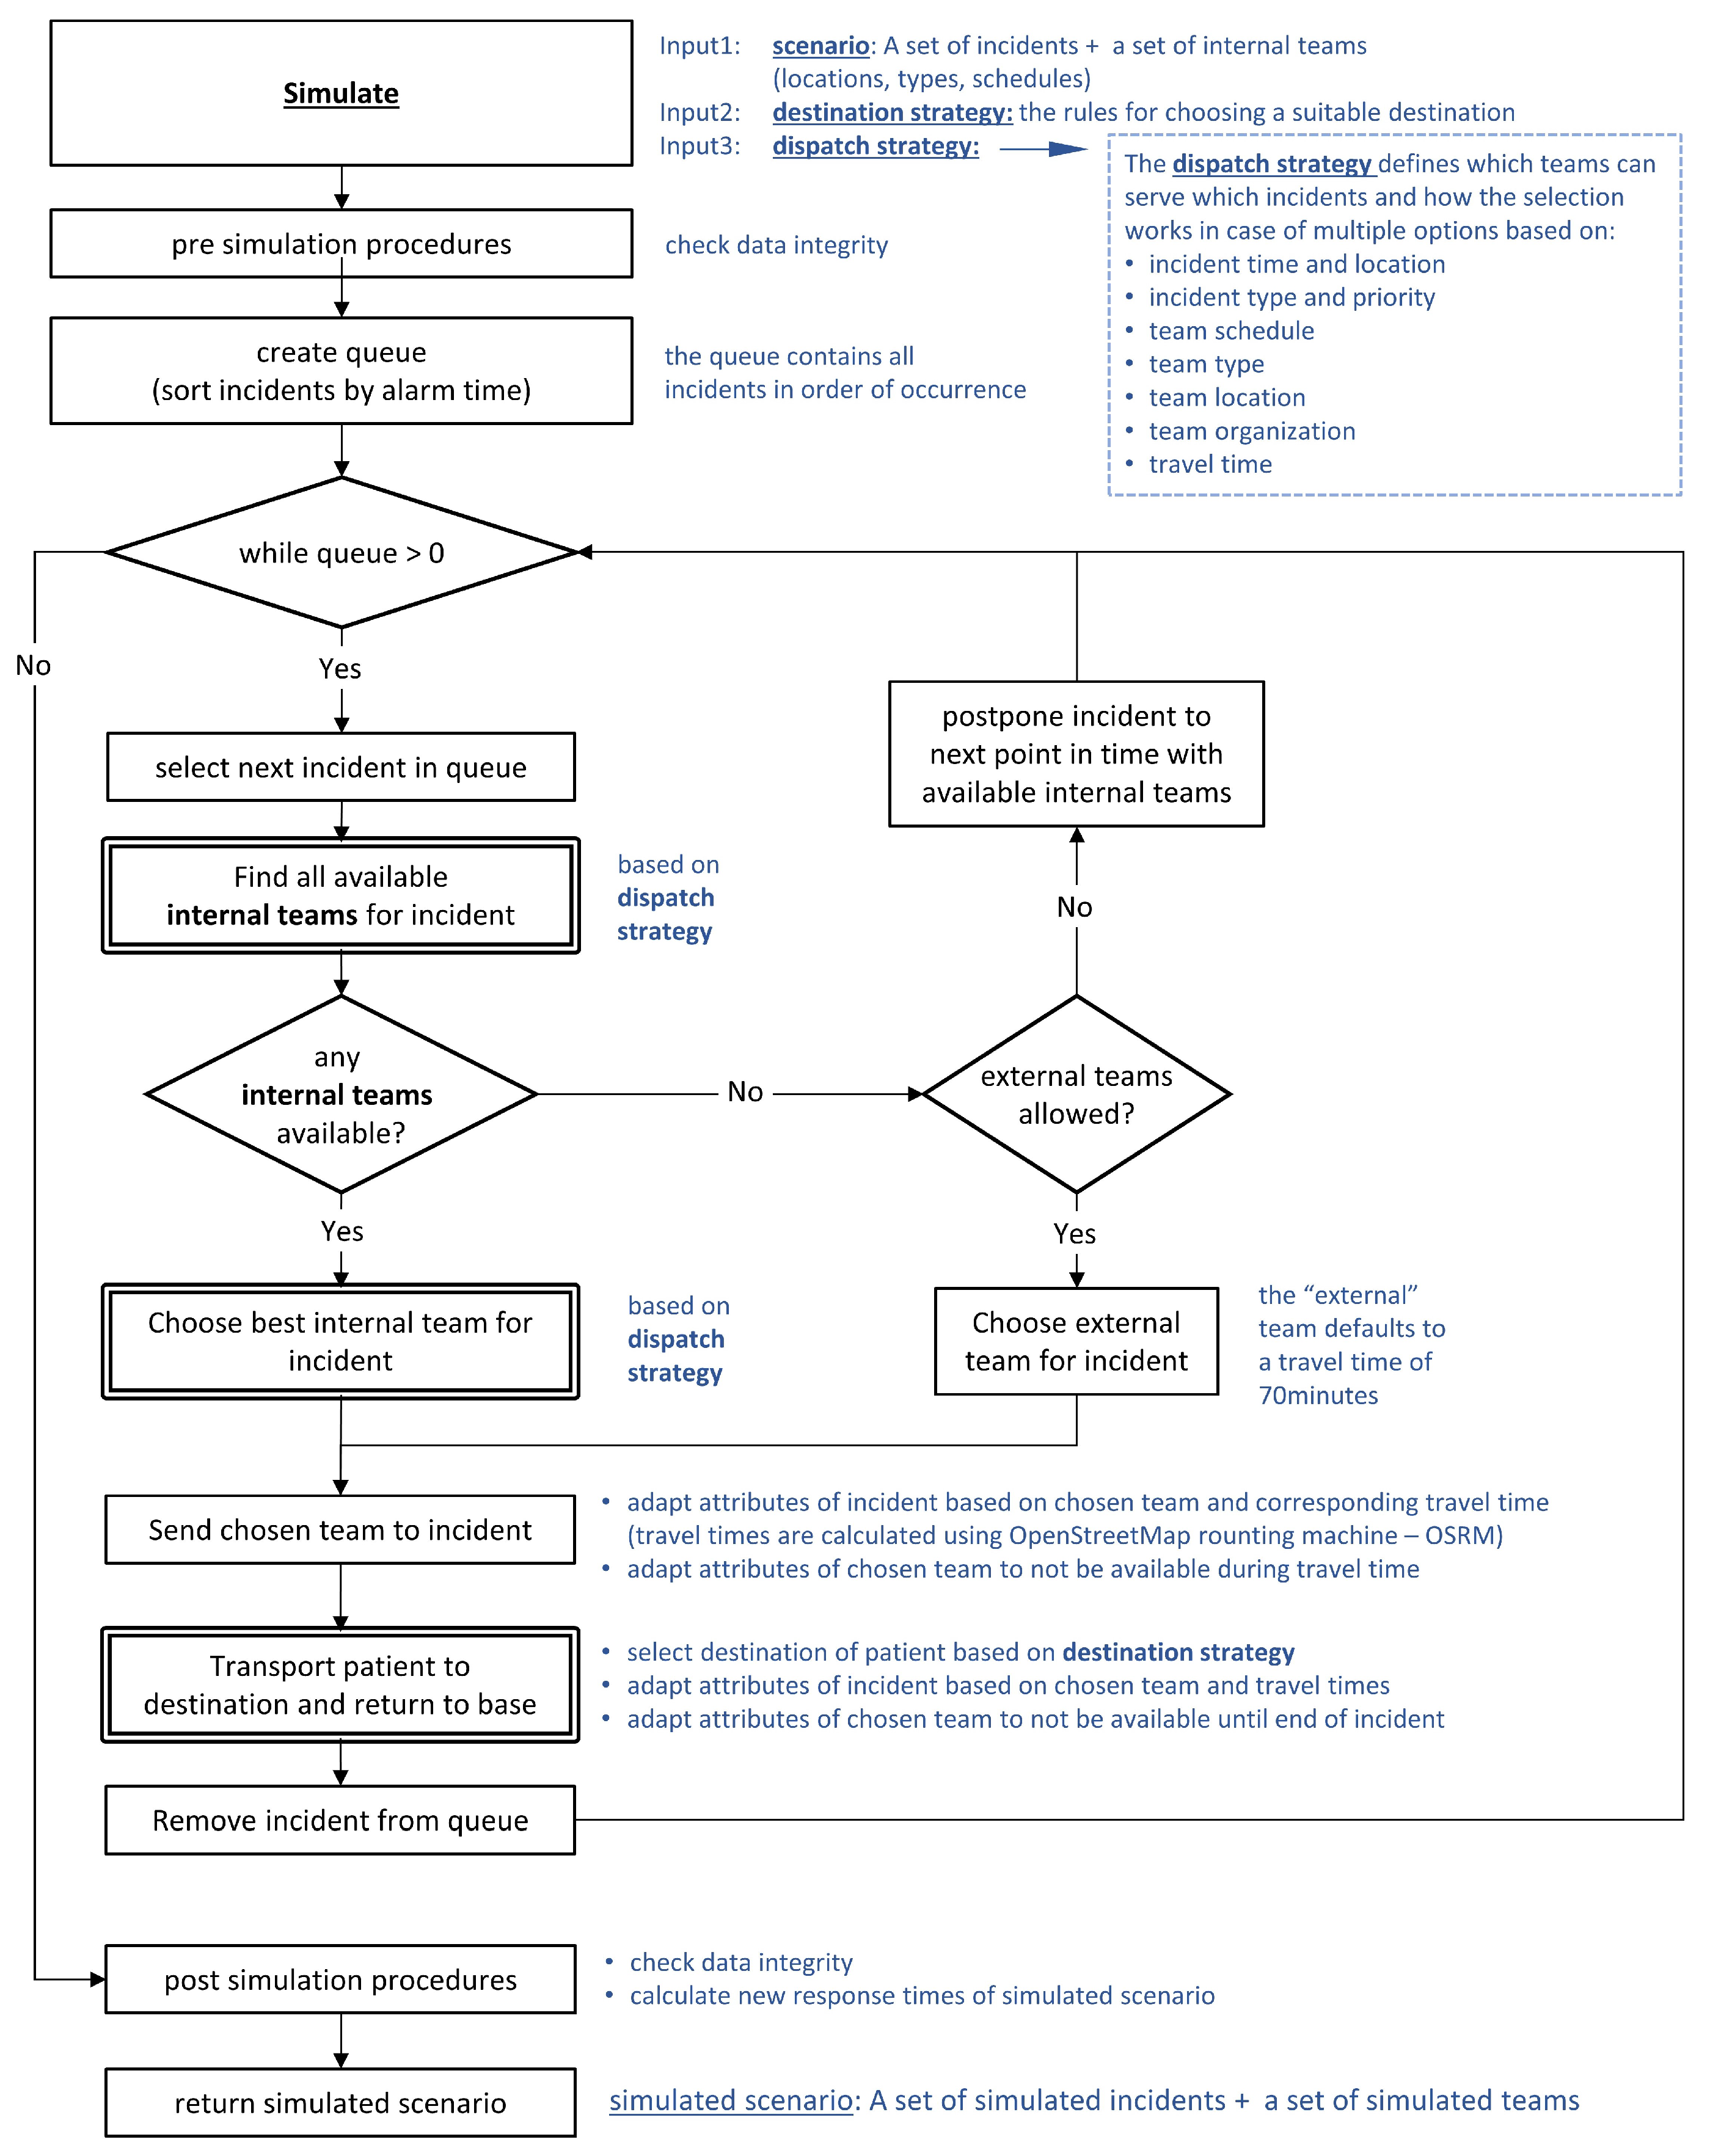
- SimulationA rule-based DES processes the historical scenario to create a simulated historical scenario. Any disparities between the historical scenario and simulated historical scenario generally stem from model simplifications, which are discussed with all involved stakeholders. The initial analysis compares the simulated historical scenario against the historical scenario, and uses predefined key performance indicators such as the response time quantiles, a histogram of response time, and the spatial distribution of response time [7]. This is an iterative process with the respective EMS to ensure the simulation’s validity [7].The validated DES uses individual dispatching strategies that take into account the characteristics of incidents and available teams (in most cases, the closest-idle strategy based on incident priority). Simulations may also test individual destination strategies to influence transportation behavior after the initial treatment has been carried out on site (in most cases, the historical destination). The simulation uses the OpenStreetMap routing machine (OSRM) to calculate driving times. A more detailed description of the simulation workflow can be found in Appendix B.
- (c)
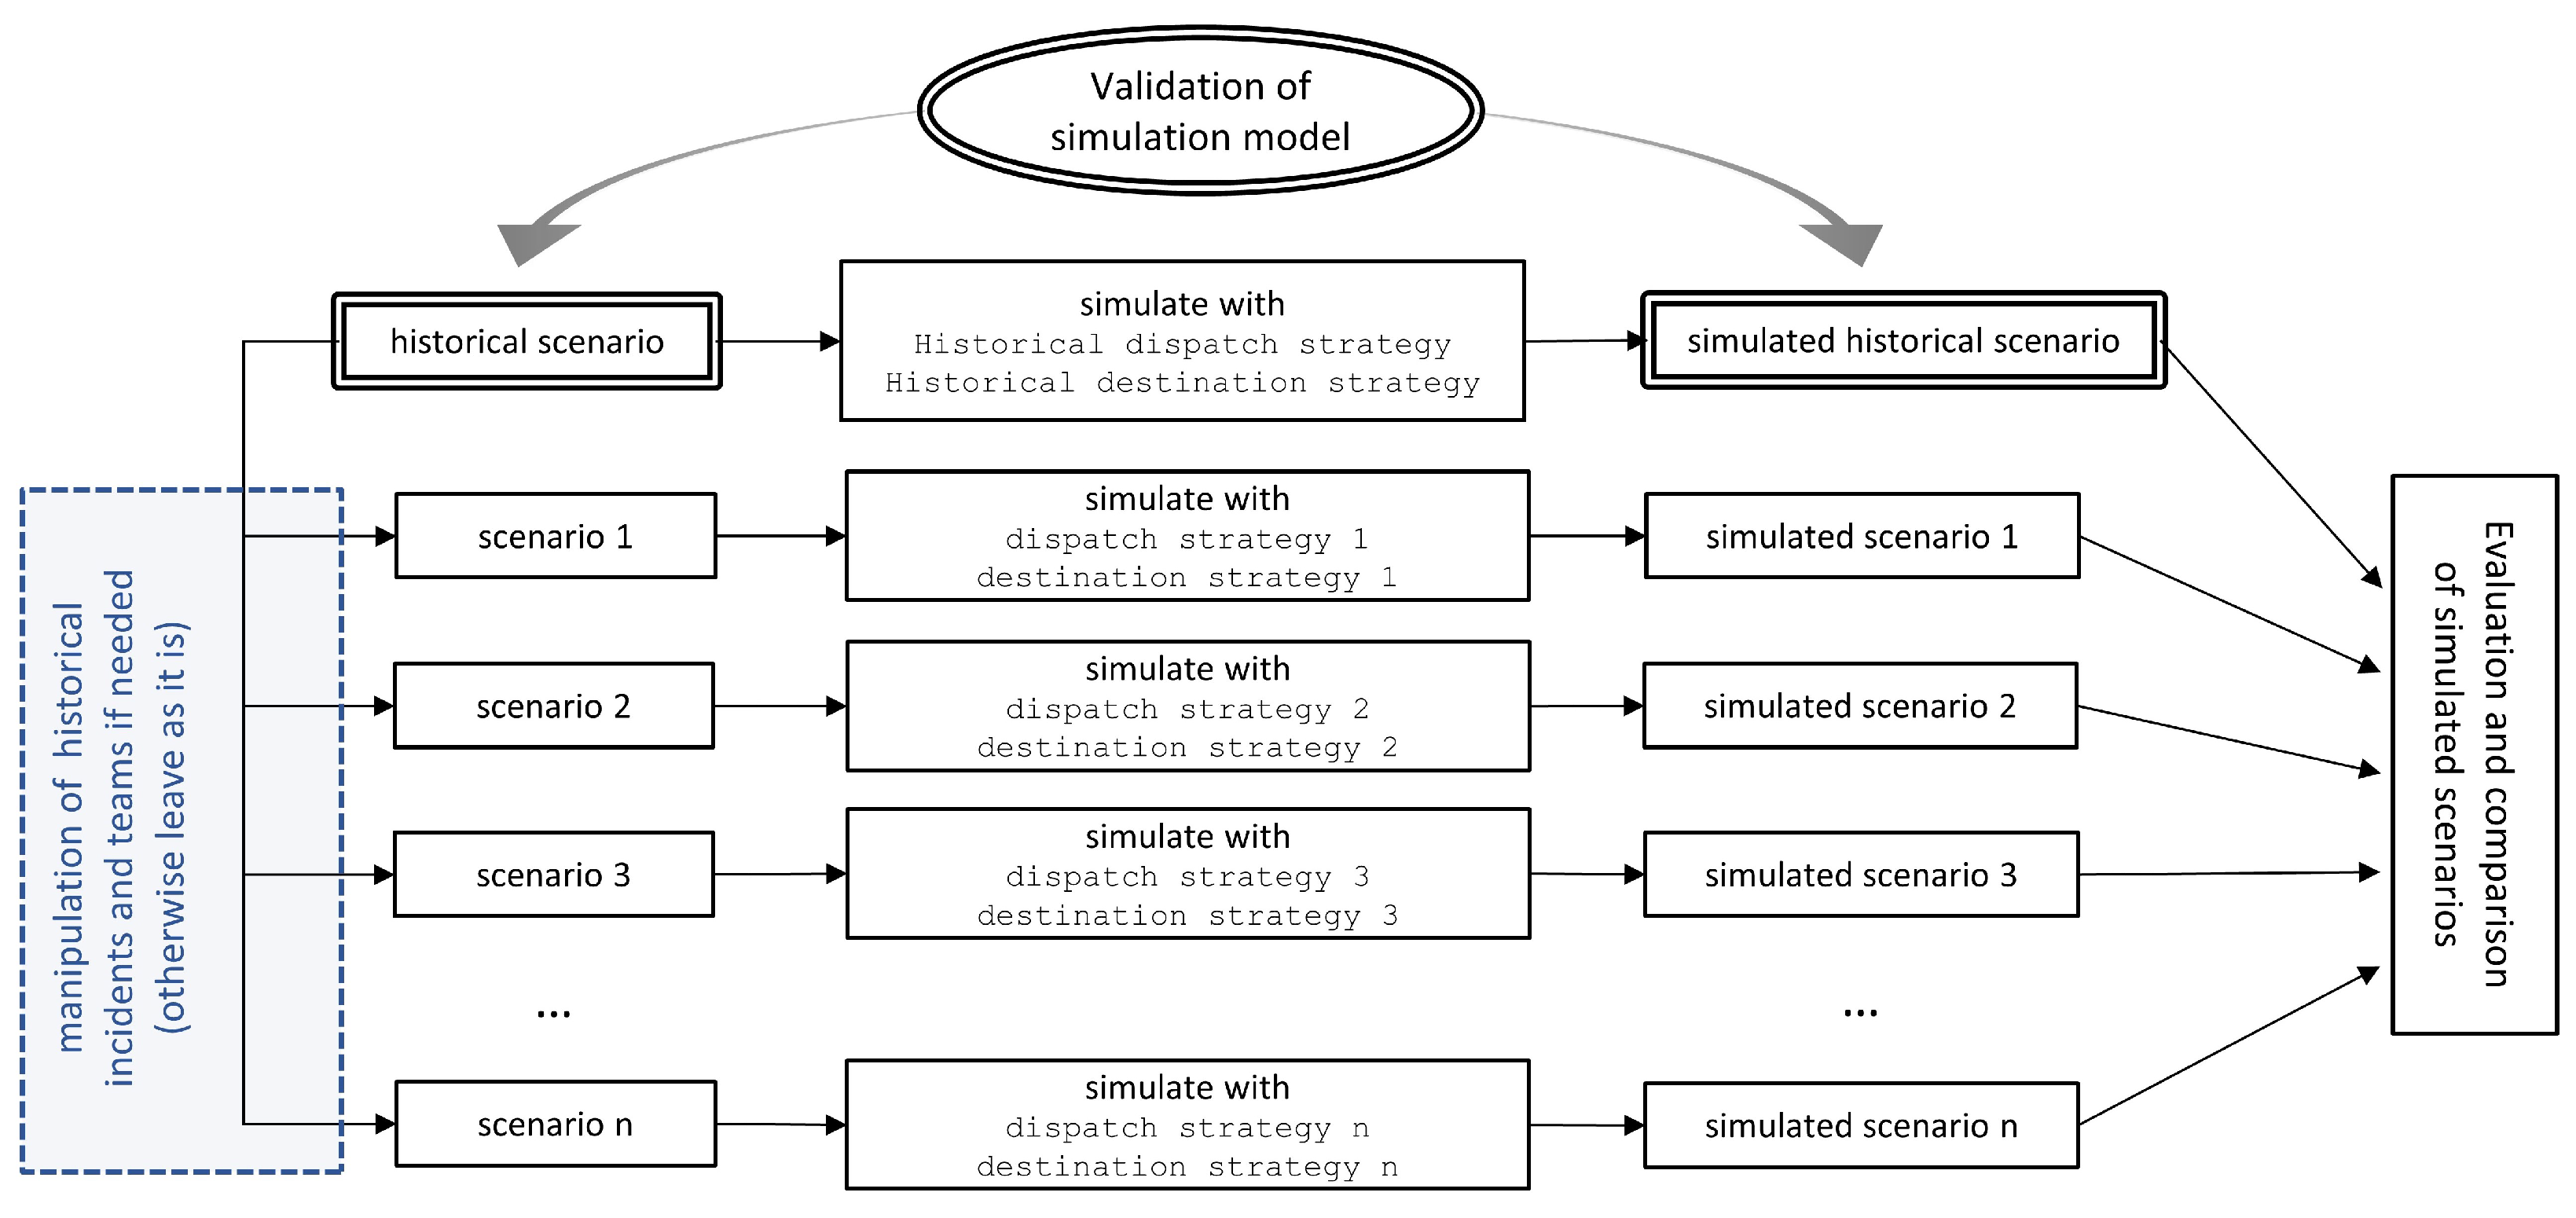
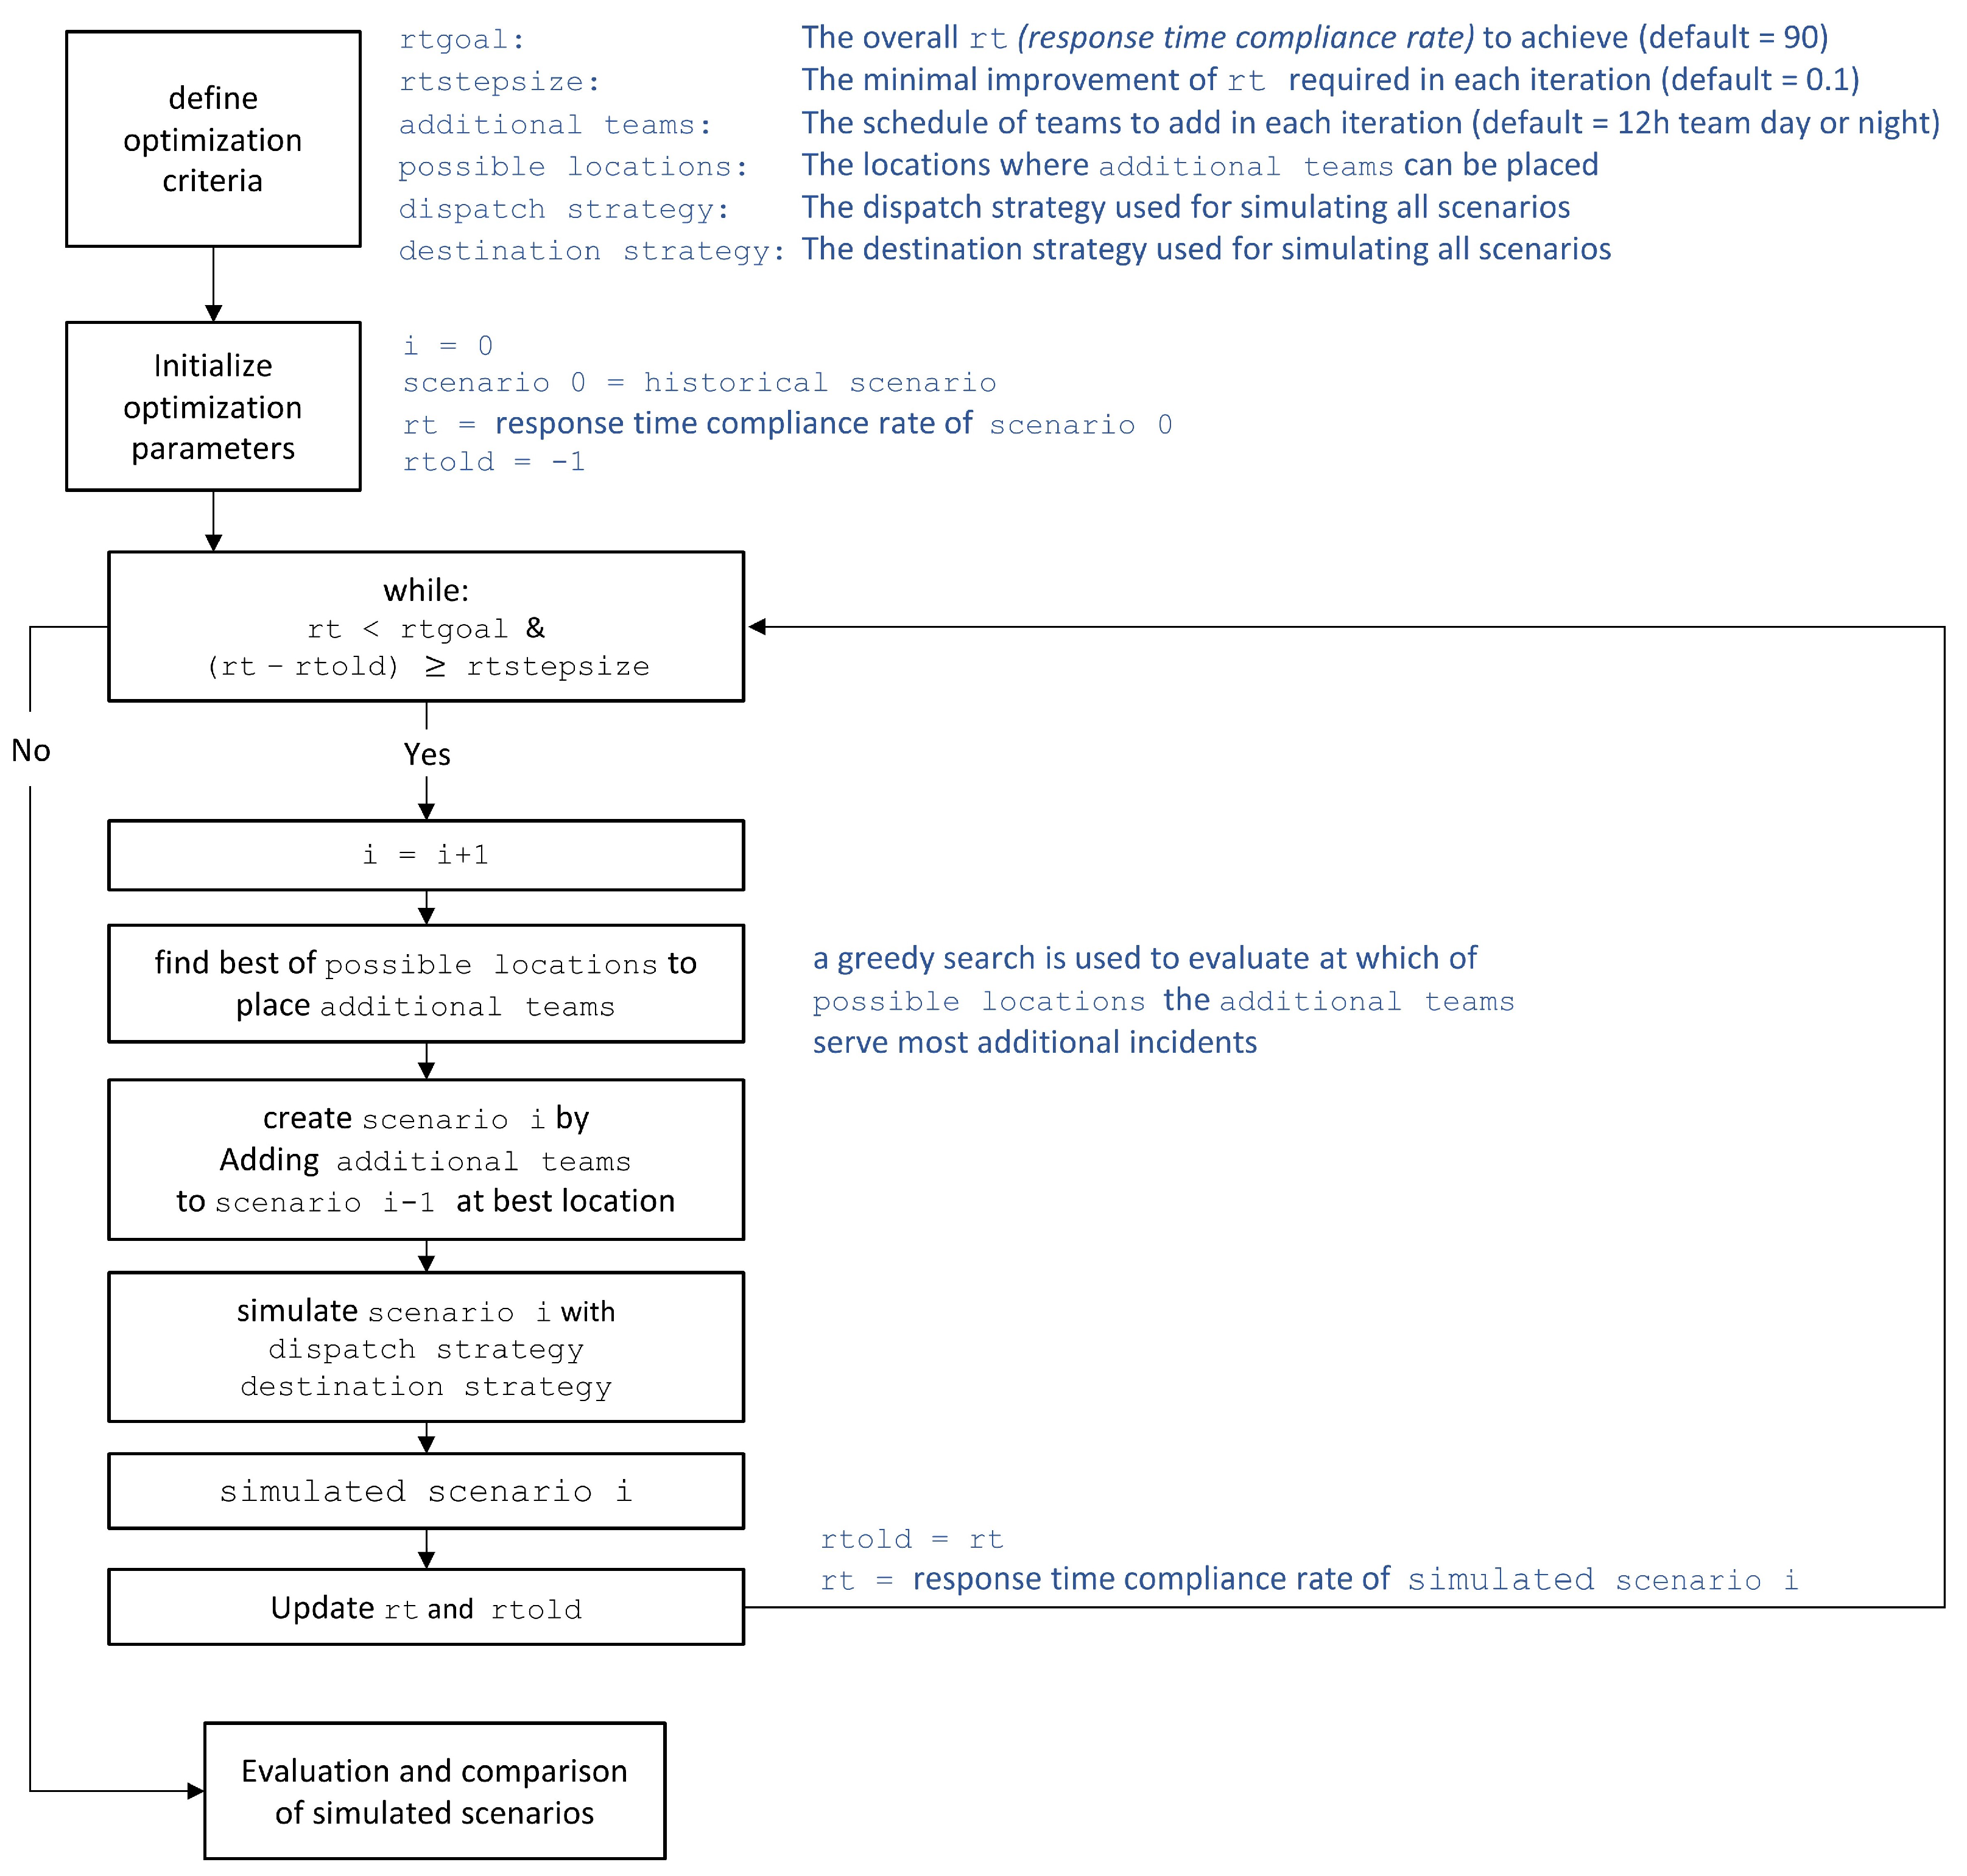
- OptimizationDuring optimization, a set of scenarios is generated from the historical scenario, with the option of manipulating the historical composition of incidents (i.e., increase/reduce the number of incidents by sampling) or teams (i.e., add/remove teams or bases). Each of these scenarios will then be simulated with the option of using different dispatch strategies or different destination strategies. The resulting simulated scenarios are ranked and compared with the simulated historical scenario. A visualization of this optimization process can be found in Appendix C.For questions regarding the reserve capacity of teams, an automated optimization process is used to find a minimum set of teams that meet the response time compliance rate. During this process, additional scenarios are iteratively created as long as less than 90% of incidents have been reached within 15 min. In each iteration, a greedy search [24] is used to find the team that can serve the most incidents in the system, thereby improving the total response time. The process stops when (i) 90% is reached or if (ii) the improvement is below a certain threshold [7]. A visualization of this automated optimization process can be found in Appendix D.
- (d)
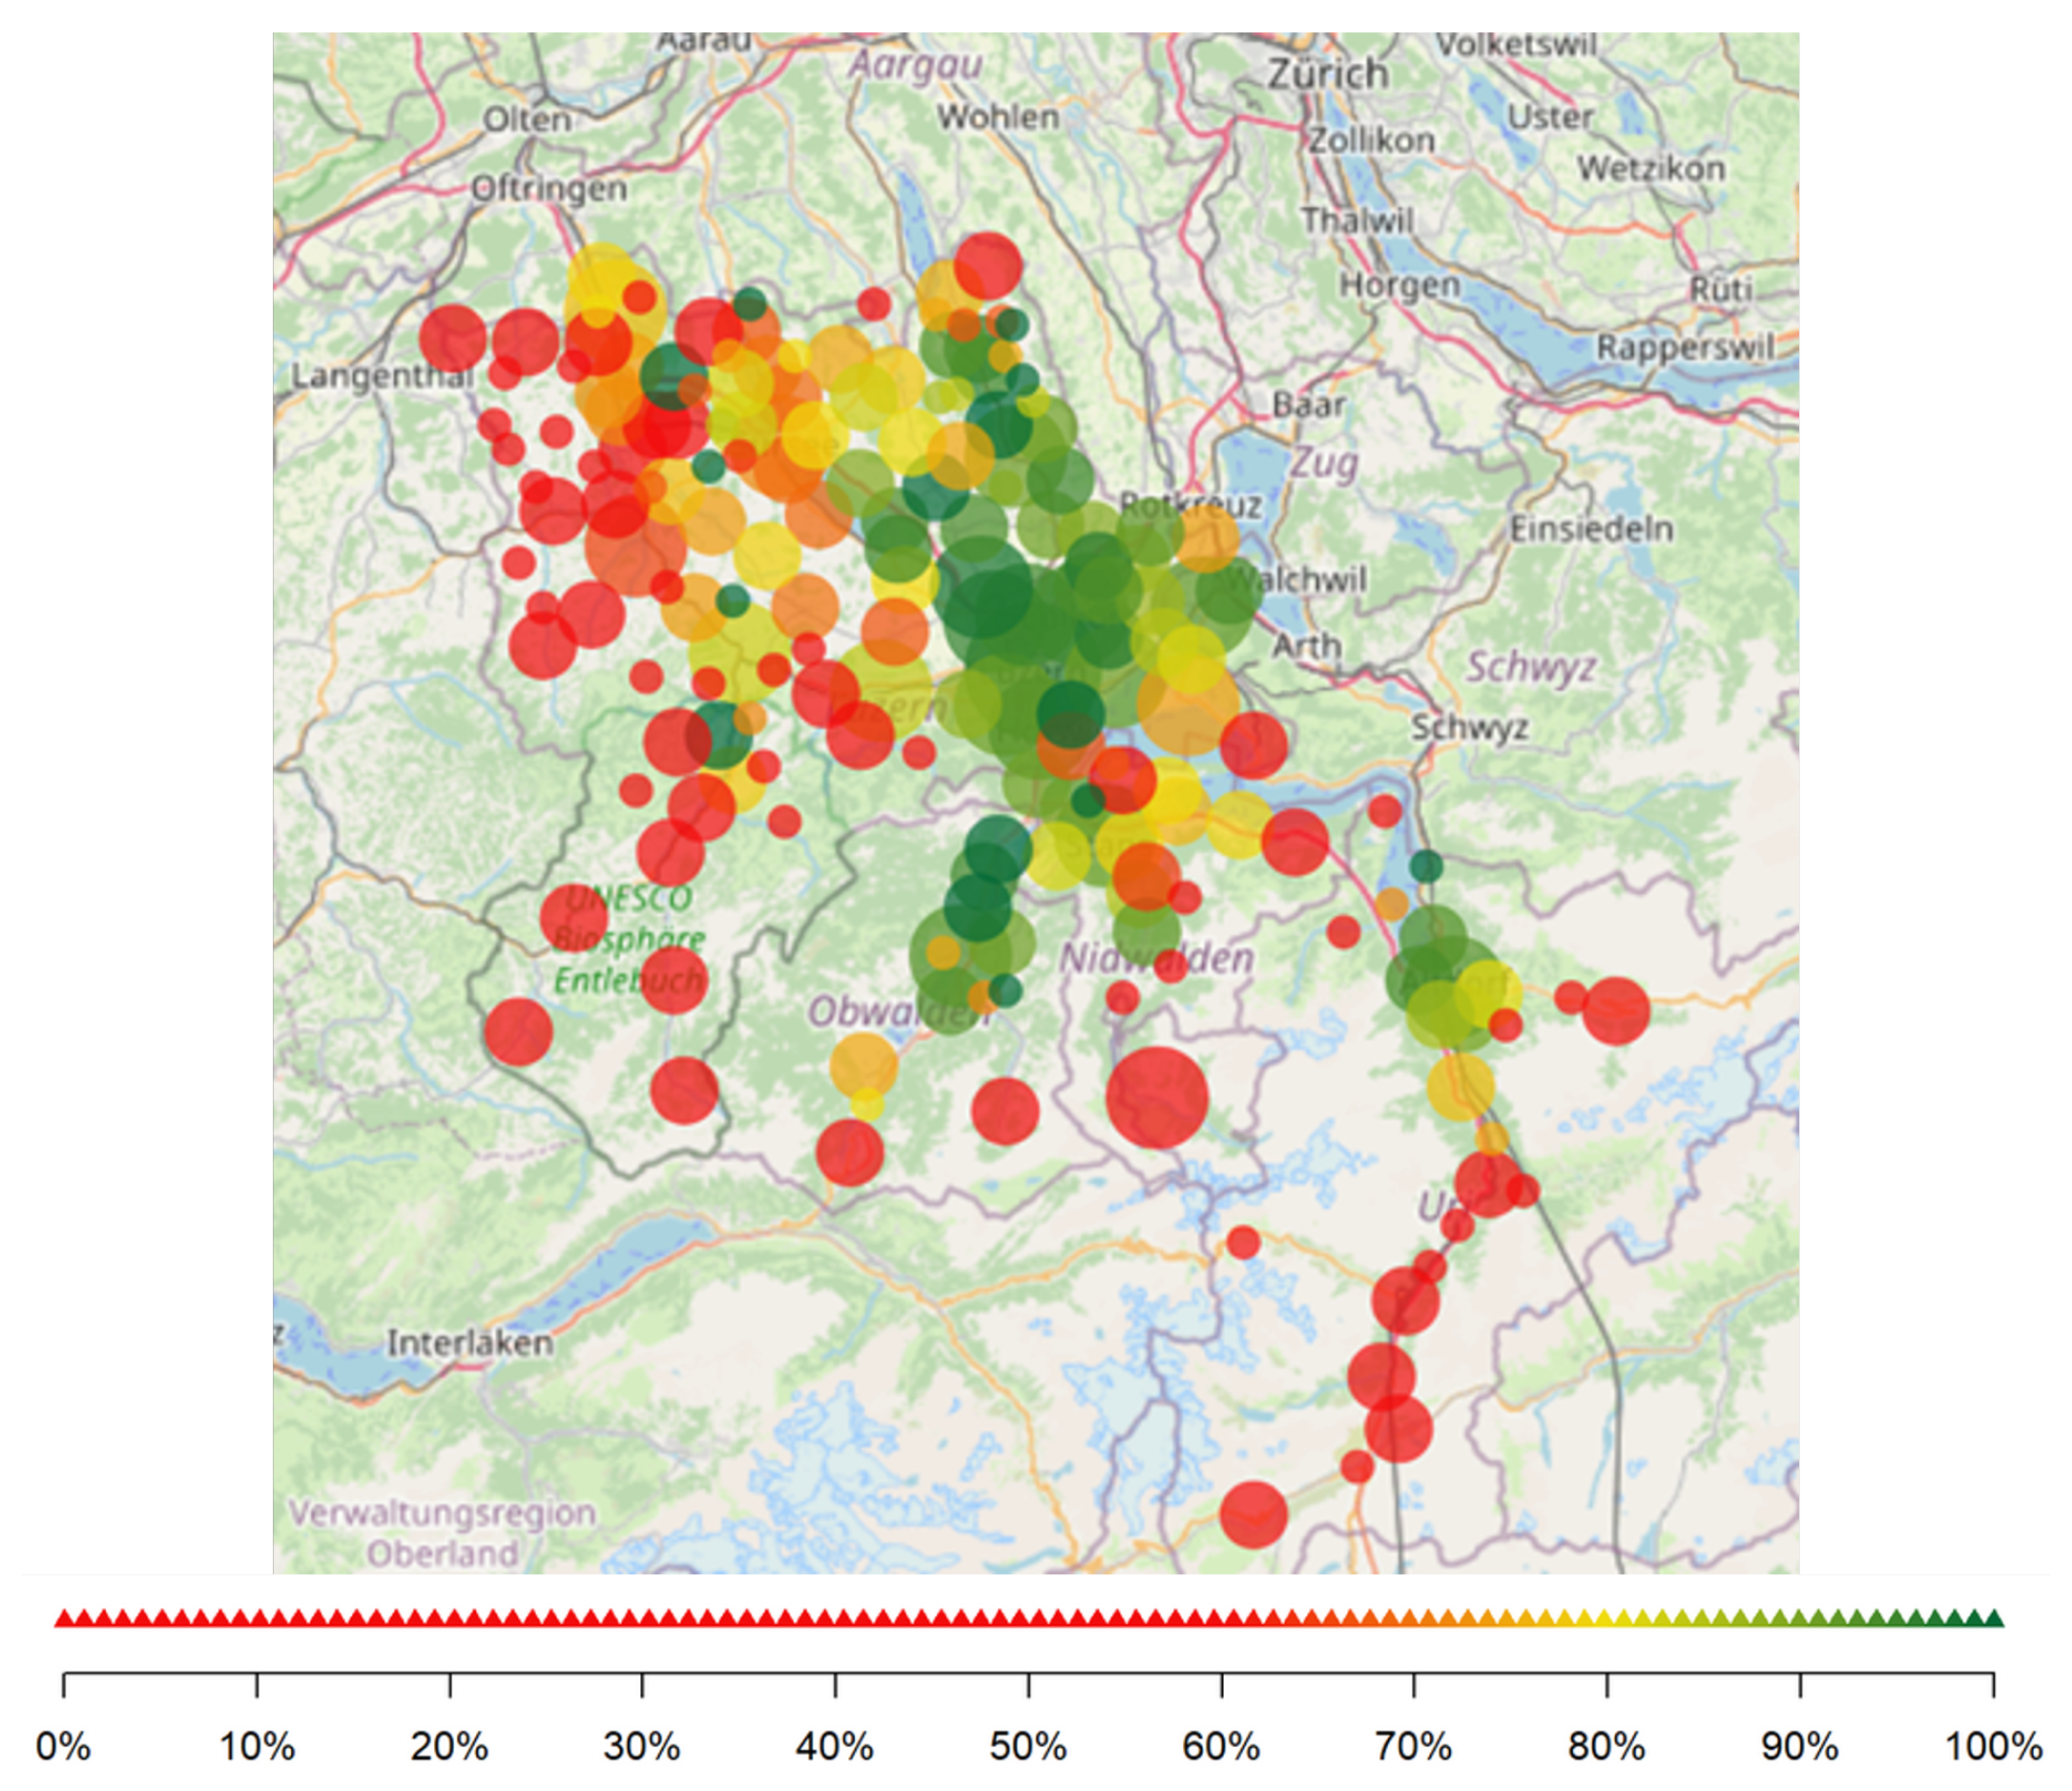
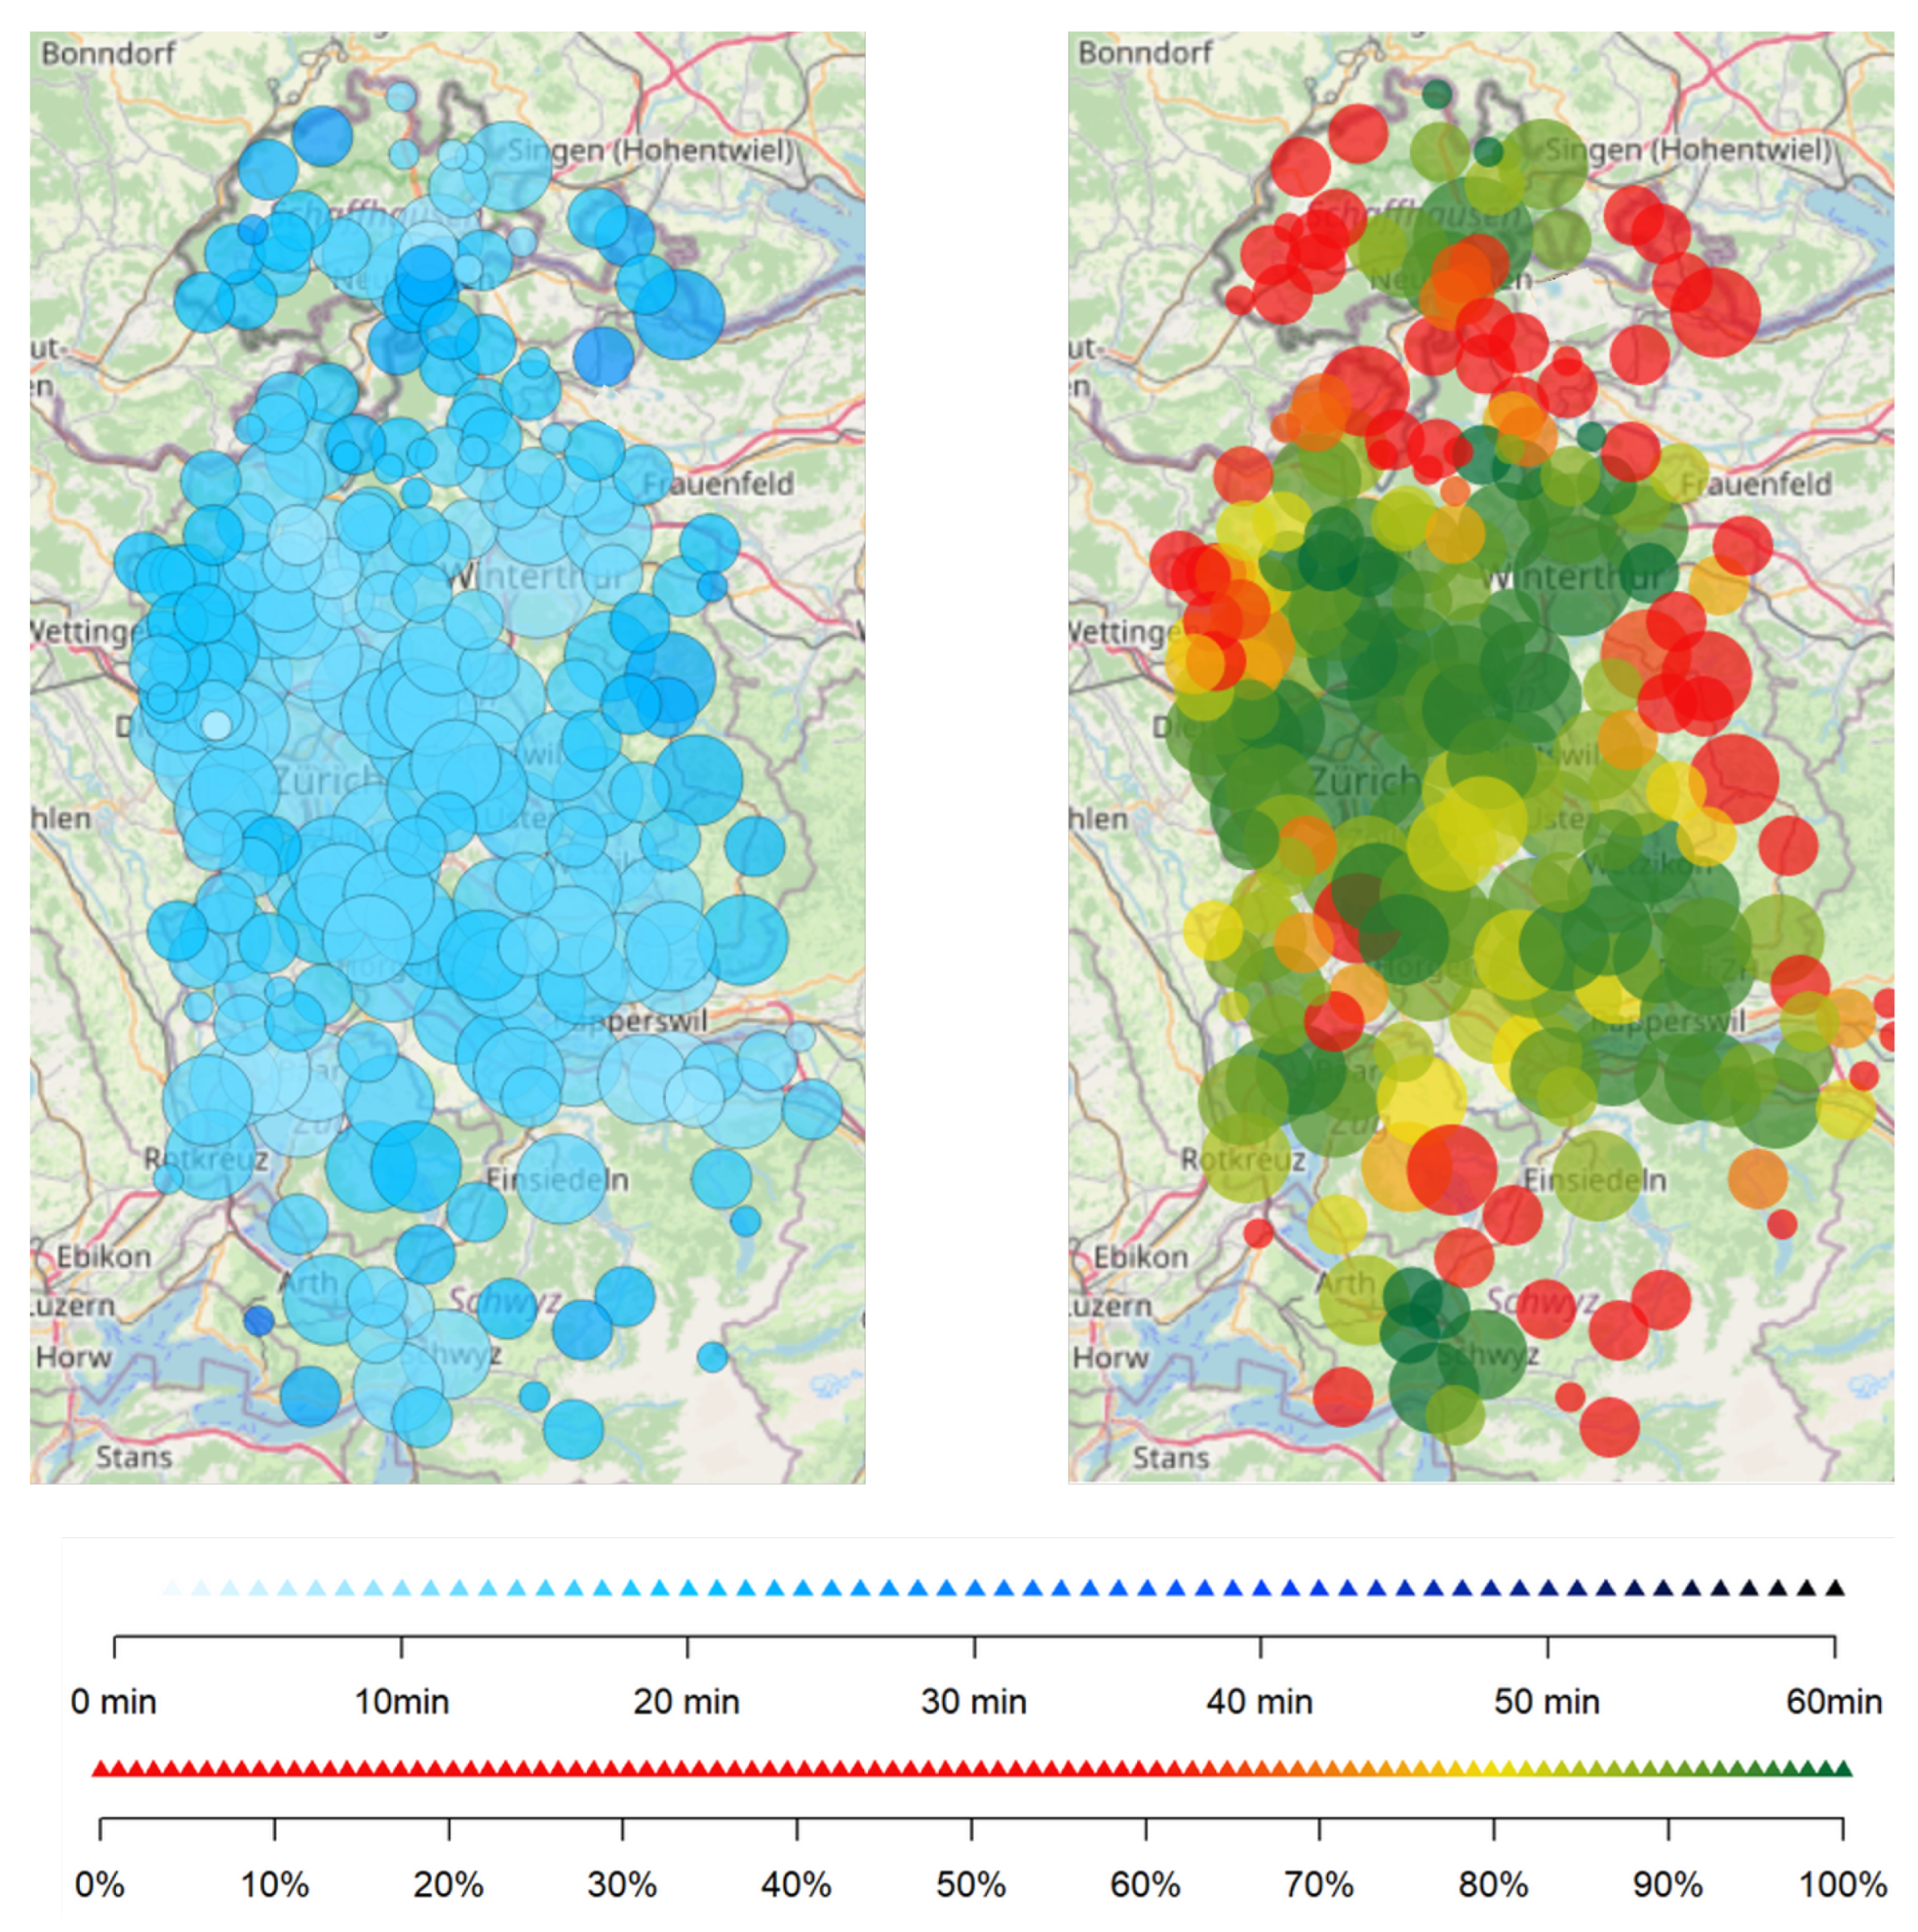
- Communication of resultsIn each of the preceding steps, results are summarized in reports that are iteratively discussed with all stakeholders involved. Most reports use response time and the response time compliance rate as the main key performance indicator of interest (an example for spatial patterns in response time and response time compliance rate is shown in Figure 2 and Figure A1). The iterative procedure aims to assert consistency and correct the integration of respective cantonal contexts. The provided reports then support decision-making processes of EMSs and healthcare authorities (HAs).
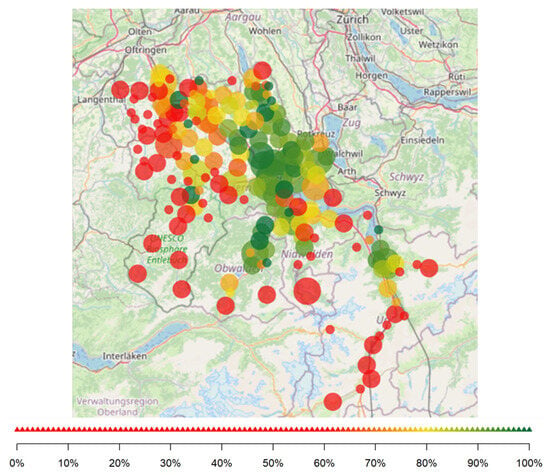 Figure 2. Response time compliance rate. The circles’ size indicates the magnitude of the “number of incidents”. The smallest circles correspond to 1–9; the next size to 10–99; the largest circles to 100–999. The clustering corresponds to communities, i.e., more or less a postal code.
- Further observationsA critical reflection on political constraints and decisions is presented for each simulation study. The role of simulation-based optimization in the respective decision-making processes of prehospital care planning is discussed.
Section 3 is structured according to the study design.
2.2. Ethical Approval
The present study was classified as a quality evaluation study by the local institutional ethical review board (BASEC Nr. Req-2023-001476, EKOS 23/233, approved 21 December 2023), and the need for informed consent was waived.
3. Results
This section describes the process’ outcome for three different regions in Switzerland (region Zurich, Central Switzerland, and canton St. Gallen).
3.1. Simulation Study 1—Region Zurich
3.1.1. Background
The region Zurich covers an area of 3200 km2 and 1.9 million inhabitants (2019) with an annual total of 130,000 incidents. As outlined in the Explication of canton Zurich [25], “(…) the government council has determined to optimize the quality and efficiency of the Zurich rescue system. The Healthcare Department tasked the Institute for Modeling and Simulation with analyzing the rescue system and identifying opportunities for improvement (…)”. The central key performance indicator was response time and reserve capacity, i.e., the number of rescue resources, including emergency doctors, that an EMS organization must deploy to ensure that the area can be covered within the IVR specifications [6]. The dispatch strategy in Zurich before 2018 was mainly area succession, i.e., the rescue vehicle was sent to an incident because it was responsible for the area—in most cases, a well-defined set of communities finance their respective EMSs.
3.1.2. Simulation-Based Findings
The DES was used to estimate the resources needed to comply with the 90-15 rule [7]. One significant finding was that only one out of 14 EMS organizations showed resource-neutral optimization potential when viewed as an isolated system. The identified optimization potential of the response time compliance rate was about one percent. The other 13 EMS organizations’ performance improved only when adding additional resources. Furthermore, the issue of territorial coverage remains unresolved in numerous rural areas. Regions with a low response time compliance rate demonstrate the trade-off between delivering quality care in low-density regions and managing costs. The additional teams required to achieve the response time compliance rate demand disproportionately higher financial resources. Further results can be found in Appendix E.
3.1.3. Further Observations
At first, the results of the simulation were accepted. However, approximately one year after completion of the simulation process, the dispatching strategy was changed by healthcare authorities from area succession to closest-idle. This means that, instead of dispatching teams based on areas of responsibility, the closest available team is dispatched to a call, while the communities continued to finance the EMSs. This means that any team from any EMS can be dispatched to an incident because it can be on site the fastest, rather than dispatching teams based on areas of responsibility. Without the ability to use the closest-idle strategy to decide the routing of their teams, EMSs lost a means to influence the response time compliance rate.
3.2. Simulation Study 2—Central Switzerland
3.2.1. Background
The region Central Switzerland covers an area of 3300 km2 and has 0.5 million inhabitants (2019) with an annual total of 29,000 incidents. The city of Lucerne is urban, whilst most of the area in Central Switzerland is rural and has a low population density. It is therefore difficult for the various EMSs in the four cantons of Lucerne, Uri, Nidwalden, and Obwalden to comply with the 90-15 rule, as can be seen from Figure 2. In order to solve the problems of poor coverage combined with a shortage of skilled workers, a cross-cantonal project was launched. One part of this project focused on using simulation to investigate how area coverage could be improved and to identify measures that may mitigate the shortage of skilled workers.
3.2.2. Simulation-Based Findings
Planning the teams across cantons offered advantages for operational reasons: the DES predicted resource-neutral optimization potential for Central Switzerland of 0.9 percentage points (from 80.4% to 81.3%) with respect to overall response time compliance rate. This improvement was not fully realized in the following year with a real increase of 0.5 percentage points (from 79.6% to 80.1%). In addition, the DES showed a decrease in overtime by 300 h per year by improving dispatching strategies and shift times through, e.g., avoidance of the dispatch of teams close to the end of a shift. This was implemented and improvements were confirmed one year later. The DES revealed further benefits concerning employee satisfaction: joint planning made it possible for employees to choose between different deployment areas (urban–rural). The clustering in Figure 2 corresponds to communities, i.e., more or less a postal code. The area with a high response time compliance rates (green circles) includes the city of Lucerne, whereas the rural area is difficult to cover.
3.2.3. Further Observations
This project also faced an unexpected systemic limitation: although it was very difficult to find improvements in the EMSs’ locations or the rosters, air rescue was not included in the simulation process because smaller hospitals feared that it would drive more patients to the large hospitals, meaning that small hospitals would lose patients and thus revenue. This highlights the interconnection of EMSs, emergency departments, and HAs.
3.3. Simulation Study 3—Canton St. Gallen
3.3.1. Background
The canton St. Gallen covers an area of 2000 km2 and has 0.5 million inhabitants (2019) with an annual total of 31,000 incidents. Over the past 10 years, healthcare authorities have raised response time targets while financial budgets have been frozen [26]. On the other hand, the number of incidents has risen continuously, as Table 1 shows [7,26].

Table 1.
Response time compliance rate for canton St. Gallen versus growth of number of incidents. Apart from 2022, only data for every second year are shown to highlight the overall trend.
The improved performance from to occurred along a simulation supported large-scale change process where several EMS organizations merged. While this did not increase the available resources, it allowed for a central coordination. In addition to the increasing number of incidents, EMSs were concerned about an HA plan regarding the closure of two hospitals. To assess the potential implication on EMSs, a DES was conducted as follows.
3.3.2. Simulation-Based Findings
The simulated scenarios indicated that EMSs are currently operating at their capacity limits, as a perfect implementation of the closest-idle strategy in the simulation did not lead to any further improvement in response time compared to the simulated historical scenario. The closure of two hospitals was simulated by dispatching EMSs to different destination hospitals. The simulation showed that fewer ambulances were available due to prolonged mission duration, resulting in a reduction in response time compliance rate. As these closures “only” affected smaller hospitals, the impact was marginal, i.e., within typical statistical uncertainties of less than percentage points.
3.3.3. Further Observations
Two hospitals were closed in St. Gallen, resulting in changes to the conditions under which EMSs plan and operate. At an early stage in the HAs’ decision-making process, quantitative data from DES could have confirmed the HAs’ assumptions and improved the basis for discussion.
4. Discussion and Future Work
As described in the results, DES is able to replicate historical behavior across different regions of Switzerland and find improved resource allocation strategies. The outcomes of the three simulation studies indicate that alternate strategies can improve response time in terms of response time compliance rate, but also highlight that resource-neutral improvements are marginal in all presented cases. The simulation studies point at the complexity of servicing relatively small, yet geographically challenging regions where governance is shared across federal, cantonal, and municipal instances. By reflecting upon the results, we find that data-driven decision support processes for EMSs in Switzerland face two challenges.
- Resource-neutral performance saturation: Regional gains through optimization of routing, base locations, and scheduling are marginal without increasing resources (e.g., additional teams, bases, or modes of transport). In each case (Zurich, Central Switzerland, and St. Gallen), optimizing the simulated historical scenario indicated that resource neutral strategies only led to improvements of up to 1 percentage point at most. The performance could only be significantly improved through additional resources. This demonstrates how individual resource allocation improvements saturate within planning processes due to the conflict between financial pressure and performance targets. This conflict could be mitigated using mathematical optimization, but requires a fundamental discussion among stakeholders regarding objectives.
- Systemic coordination and collaboration: Besides the conflict between financial and performance perspectives, we identify governance structures as highly relevant. The cases of Zurich, Central Switzerland, and St. Gallen are examples of top–down governance wherein planning processes were adjusted without involving all affected actors (e.g., EMSs).The case of Zurich highlights how a change in dispatch strategy, such as moving from area succession to closest-idle, removed the EMSs’ ability to plan and optimize their own fleet operations. The case of St. Gallen shows how top–down decision processes, such as closing two hospitals, did not consider the trade-off between quality improvements and increasing costs for EMSs. As further hospital closures are possible in the future, this case suggests to systematically involve all stakeholders in prehospital care planning at an early stage. The case of Central Switzerland presents a conflict of interest between capacity utilization of regional hospitals (a political decision) and response time compliance rate (an operational consequence). In all three cases, there are behaviors indicating a lack of awareness of system complexity, resulting in insufficient collaboration.
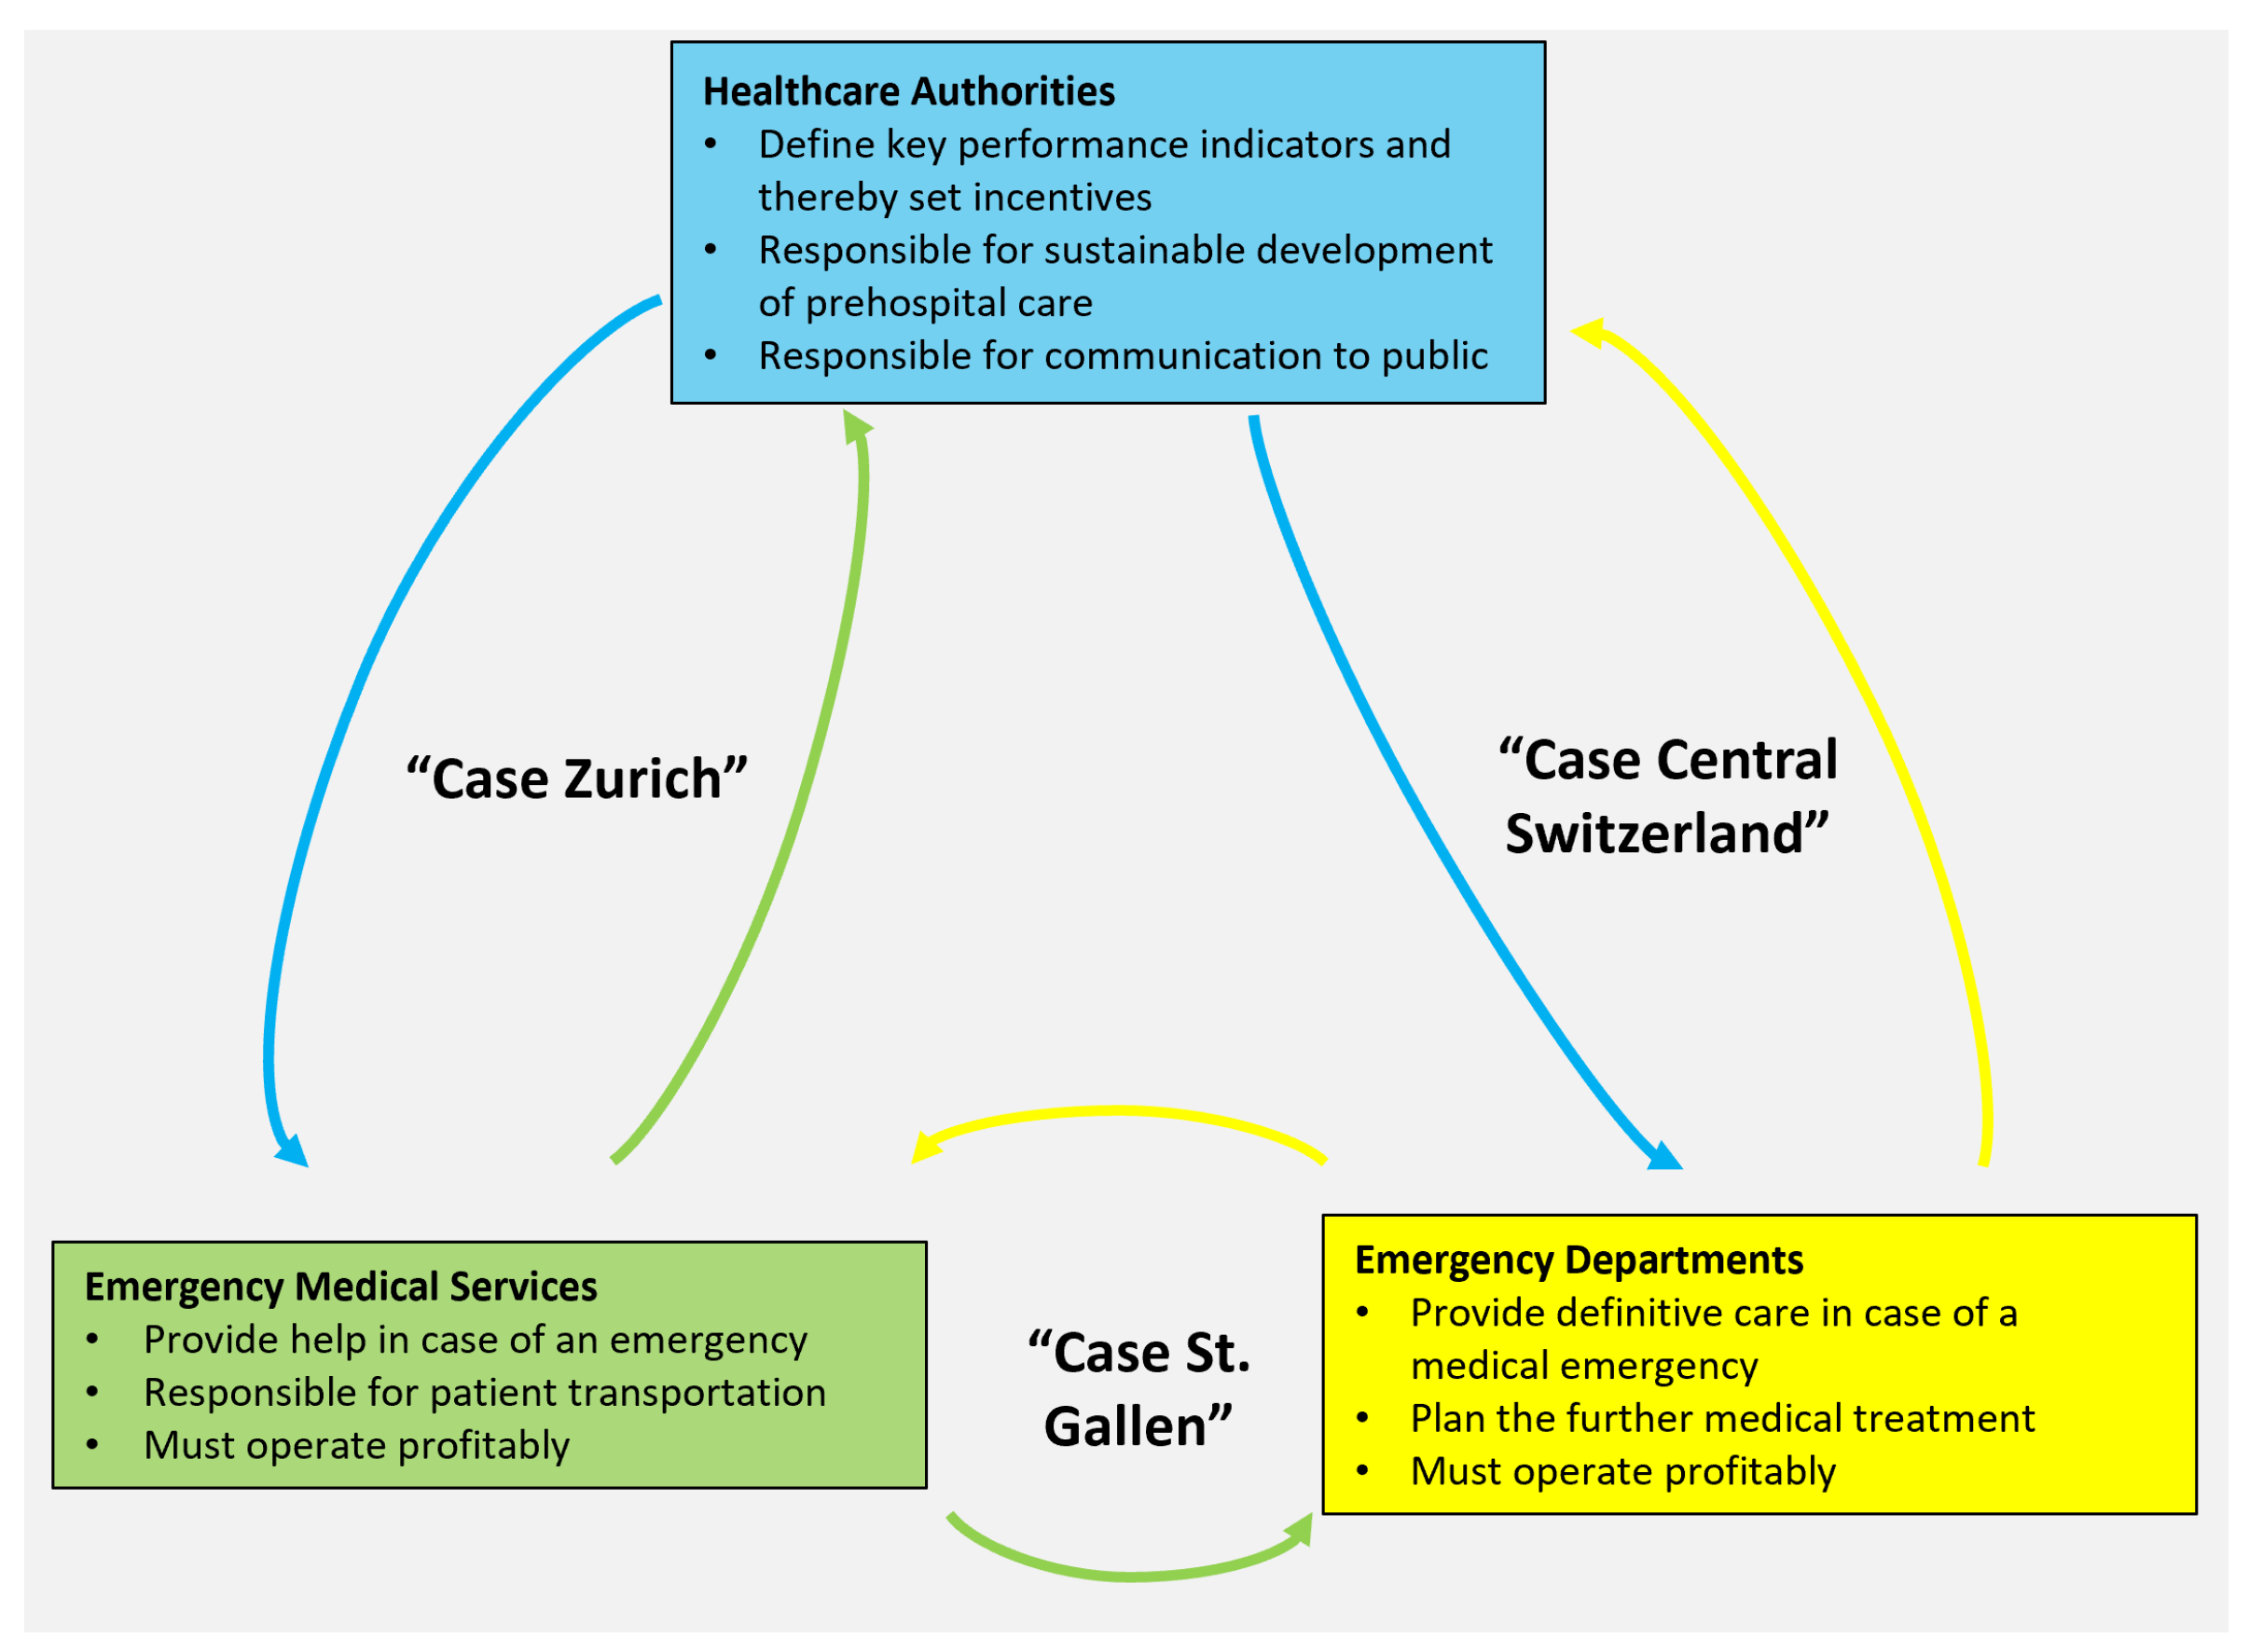
To summarize both challenges, we highlight the complex and dynamic governance of the planning process in prehospital care, which encompasses HAs, emergency departments, and EMSs, as shown in Figure 3.
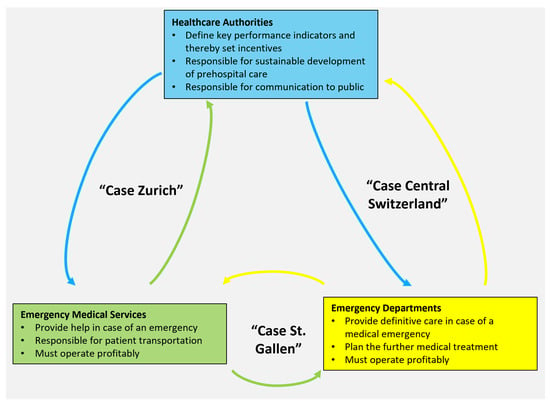
Figure 3.
Stakeholders and their interactions. The three simulation studies are assigned to the respective interaction which, according to the “further observations” of each study, lies at the core of political constraints and decisions.
Our examples indicate that simulation has its limitations and fails to explain or even predict systemic failures when not connected properly to all stakeholders. Such considerations are outside the system boundaries of DES, presenting a methodological limitation. We therefore argue that such a complex system can only be significantly and sustainably improved if computer simulation goes hand in hand with a systemic analysis. Taking a more systemic perspective would go beyond the mere optimization of performance, but requires a more integrated role in the entire planning process of prehospital care. Any methodological advance needs to (i) lead to improved planning processes across multiple political levels, (ii) increase collaboration between diverse actors, and (iii) understand feedback and mitigate unintended consequences.
Our proposition is to complement operational optimization (see branch “Operational” in Figure 1) with a “strategic” approach (see branch Strategic in Figure 1). Thereby, our aim is to develop a standardized prehospital healthcare planning process that utilizes a hybrid simulation model adopting DES and “System Dynamics”. We suggest System Dynamics because it applies to complex and dynamic systems characterized by interdependence, the presence of interactions, information feedback, and circular causality [27]. The use of System Dynamics focuses on strategic management decisions on the systems level, whereas DES focuses on tactical and operational decision-making of isolated subsystems. Typical strategic questions in health systems seek to identify misguided incentives or the appropriate intervention lever in the system causing policy resistance (Rodwin and Couturier showed that conflicts of interest in healthcare are often related to financial disincentives [28,29]).
System Dynamics applications focusing on decisions in healthcare and emergency management have a long tradition [30,31,32,33]. Hybrid modeling approaches of System Dynamics and DES focus on the feedback loops and long-term impacts of decisions within healthcare systems [34], provide a comprehensive framework for healthcare modeling [35], and offer significant benefits for healthcare modeling by balancing long-term strategy insights and result accuracy [36].
The complexity of developing and validating hybrid models necessitates collaboration among stakeholders to fully realize their potential in EMS planning [36,37,38,39]. Our simulation studies highlight the locally diverse challenges in Switzerland and support the argument that further improvement in prehospital healthcare planning requires collaboration among stakeholders. Since no centralized prehospital healthcare planning exists in the federalist setting of Switzerland, we observe fragmented bottom-up research silos which hinder significant systemic improvements. Therefore, we highlight the need for an institutionalized prehospital healthcare planning process using hybrid models from a practical perspective. This process could potentially identify further optimization potential in planning processes, reduce unintended consequences, and increase the acceptability and implementation due to stakeholder involvement. Based on our practical experience, we conclude that, for this process to be successfully adopted in Switzerland or elsewhere, it must be: (i) based on common standards regarding language and data-handling (including rigorous data-validation, see [35]), (ii) adapted to local conditions, and (iii) accepted and implemented by EMSs, emergency departments, and HAs nationwide.
These insights are subject to methodological limitations, as well as limitations that are inherent to the concept of applied research. Our simulation-based findings can be reproduced because the simulation framework does not use any stochasticity. A limitation of this deterministic approach is that, without stochasticity, no sensitivity analysis is conducted to increase the robustness of the simulation results. A limitation of this applied research is that there is no systematic monitoring over time to assess whether any observed improvements can be attributed to simulation-based recommendations or exogenous system changes. The added value of this research, beyond the simulation findings, is conveyed through the further observations in each case study. These simulation studies are representative of the presented applied research process, consistently conducted in 31 simulation studies during 15 years. Yet, through the retrospective research design, the insights may be influenced by the implicit knowledge of the researchers from the 28 additional simulation studies outside of this study. As all simulation studies take a very practical approach, driven by real-world optimization goals, they do not question current definitions of quality of care or engage in relevant academic discourses.
5. Conclusions
Discrete Event Simulation adds value to the quantitative planning of individual EMS organizations by identifying fundamental operational limits. Nevertheless, its application is limited without data, simulation, and evaluation standardization across cantonal and national borders. In case of conflicting interests between stakeholders, an alternative methodological approach is required. Hence, further investigations are necessary to enhance optimization and systematically explore the interactions among EMSs, emergency departments, and healthcare authorities. The discussion indicates that combining DES with System Dynamics in an institutionalized process is a critical step to overcoming limitations of isolated disciplinary, organizational, and regional perspectives in prehospital healthcare planning.
Author Contributions
Conceptualization, C.S., D.K. and M.M.; Data curation, M.S.; Formal analysis, M.S.; Investigation, C.S., M.S., D.K. and M.M.; Methodology, C.S., M.S., D.K. and M.M.; Software, C.S. and M.S.; Validation, C.S. and M.S.; Visualization, M.S.; Writing—original draft, C.S. and D.K.; Writing—review and editing, C.S., M.S., D.K. and M.M. All authors have read and agreed to the published version of the manuscript.
Funding
This research received no external funding.
Institutional Review Board Statement
The study was conducted in accordance with the Declaration of Helsinki, and approved by the local institutional ethical review board (BASEC Nr. Req-2023-001476, EKOS 23/233, approved 21 December 2023).
Informed Consent Statement
Not applicable.
Data Availability Statement
The data provided by EMS and dispatch centers are subjected to ethical, legal, and privacy issues. Concepts to comply with data protection law and regulations including appropriate IT structure and safety precautions are mandatory.
Conflicts of Interest
The authors declare no conflicts of interest.
Abbreviations
The following abbreviations are used in this manuscript:
| EMSs | Emergency medical services |
| HA | healthcare authorities |
| IVR | Inter-association for Rescue Services (“Interverband für Rettungswesen”) |
| RTCR | Response time compliance rate |
| DES | Discrete Event Simulation |
| OSRM | Open Streetmap Routing Machine |
Appendix A. Annual Growth of Incidents in Germany, Austria, and Switzerland

Table A1.
Incidents. The density is given in units of “incidents per 100’000 inhabitant and year”. The meaning of annual growth (Column “Growth”) is as follows. Switzerland: estimate based on data of canton St. Gallen for 2013–2022 [7,26]. Bavaria: Average number of incidents over the period 2012–2021 [40]. Baden-Württemberg: Value for 2021–2022 [41]. Vorarlberg: Value for 2021–2022 [42].
| Country (Region) | Incidents | Inhabitants | Density | Growth |
|---|---|---|---|---|
| Switzerland [3] | 460,000 | 8,000,000 | 5700 | 5% |
| Germany (Bavaria) [40] | 1,900,000 | 13,000,000 | 14,600 | 3.5% |
| Germany (Baden-Württemberg) [41] | 2,200,000 | 11,000,000 | 20,000 | 7.7% |
| Austria (Vorarlberg) [42] | 120,000 | 400,000 | 30,000 | 10.7% |
Appendix B. Simulation Process
Appendix C. Overall Optimization Process
Appendix D. Automated Optimization Process
Appendix E. Further Observations for Simulation Study 1—Zurich
One of the main results from the analysis using simulation are visible in Figure A1 right-hand side, showing the response time compliance rate at the community level. On the one hand, these maps are used to detect under-served areas to further optimize the system for better quality everywhere. On the other hand, the 90-15 rule is a threshold value, and therefore says nothing about absolute numbers: 90% of 1000 incidents corresponds to 100 unattended events within time, whereas rural areas typically show about 50 incidents or less, corresponding to only five unattended incidents when the 90-15 rule is applied.
About 5 years ago, this analysis using response time compliance rate on the community level was adopted by healthcare authorities for the regular monitoring of EMSs. Although useful for analysis of optimization results, this evaluation was no longer in line with the defined standards from the Interverband für Rettungswesen [6]. The only promising measure to increase the coverage of rural areas available to the EMSs was to deploy more teams, which increases costs and is difficult to be implemented due to the current shortage of skilled workers.
Therefore, we switched from evaluating response time compliance rate to the response times’ 90% quantile and changed the color code significantly, as shown in Figure A1, left-hand side: In many cases, a red circle to the right represents only few incidents (about 10) and, in many cases, the 15 min are exceeded only by a few minutes when considering the 90% quantile.
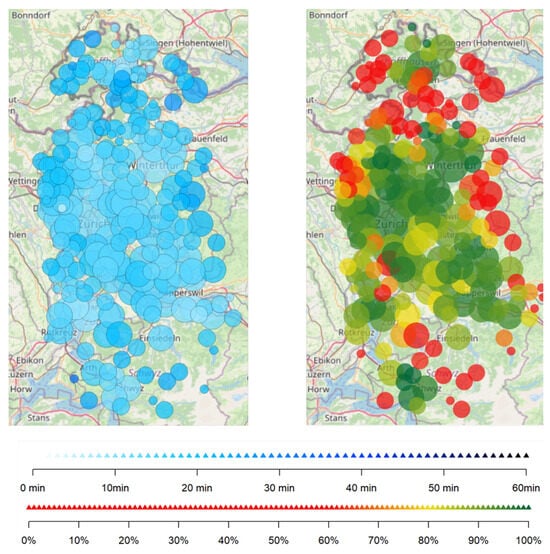
Figure A1.
Map of 90% quantiles and response time.The circles’ size indicates the magnitude of the number of incidents. The smallest circles correspond to 1–9; the next size to 10–99; the largest circles to 100–999. The clustering corresponds to communities, i.e., more or less a postal code. Left: the response time’s 90% quantile (white to blue color bar). Right: the principle of response time compliance rate (red to green color bar).
References
- Bürger, A.; Wnent, J.; Bohn, A.; Jantzen, T.; Brenner, S.; Lefering, R.; Seewald, S.; Gräsner, J.T.; Fischer, M. The Effect of Ambulance Response Time on Survival Following Out-of-Hospital Cardiac Arrest. Dtsch. Arztebl. Int. 2018, 115, 541–548. [Google Scholar] [CrossRef]
- Fischer, M.; Kehrberger, E.; Marung, H.; Moecke, H.; Prückner, S.; Trentzsch, H.; Urban, B. Eckpunktepapier 2016 zur notfallmedizinischen Versorgung der Bevölkerung in der Prähospitalphase und in der Klinik. Notf. Rettungsmedizin 2016, 19, 387–395. [Google Scholar] [CrossRef]
- Frey, M.; Lobsiger, M.; Trede, I. Rettungsdienste in der Schweiz; Schweizerisches Gesundheitsobservatorium (Obsan): Winterthur, Switzerland, 2017. [Google Scholar]
- Lindner, M. Kosten und Finanzierung des Gesundheitswesens—Detaillierte Ergebnisse 2008 und Jüngste Entwicklung. Bundesamt für Statistik BFS; Eidgenössisches Departement des Innern: Bern, Switzerland, 2011. [Google Scholar]
- Schweizerisches Gesundheitsobservatorium (OBSAN), Kosten des Gesundheitswesens. 2023. Available online: https://ind.obsan.admin.ch/indicator/monam/kosten-des-gesundheitswesens (accessed on 20 December 2023).
- Anselmi, L.; Bildstein, G.; Flacher, A.; Hugentobler-Campell, B.; Keller, H.; Ummenhofer, W.; Baartmans, P. Richtlinien zur Anerkennung von Rettungsdiensten in der Schweiz; Interverband für Rettungswesen (IVR): Zurich, Switzerland, 2022. [Google Scholar]
- Strauss, C.; Bildstein, G.; Efe, J.; Flacher, T.; Hofmann, K.; Huggler, M.; Stämpfli, A.; Schmid, M.; Schmid, E.; Gehring, C.; et al. Optimizing Emergency Medical Service Structures Using a Rule-Based Discrete Event Simulation—A Practitioner’s Point of View. Int. J. Environ. Res. Public Health 2021, 18, 2649. [Google Scholar] [CrossRef]
- Kantonale Walliser Rettungsorganisation (KWRO) Tätigkeitsbericht. 2022. Available online: https://www.ocvs.ch/wp-content/uploads/2023/08/Tatigkeitsbericht-2022.pdf (accessed on 18 January 2024).
- Eubanks, J.B. The EMS Deficit: A Study on the Excessive Staffing Shortages of Paramedics and its Impact on EMS Performance in the States of South Carolina and North Carolina and Interventions for Organizational Improvements. Ph.D. Thesis, Liberty University Graduate School of Business, Lynchburg, VA, USA, 2022. [Google Scholar]
- Gay-Cabrera, A.; Gehring, C.; Groß, S.; Burghofer, K.; Lackner, C. SiMoN: Methodische Grundlage eines Simulationsmodells für die Notfallrettung: Neuentwicklung der Generierung des Einsatzaufkommens mittels stochastischer Verfahren. Notf. Rettungsmedizin 2006, 9, 611–618. [Google Scholar] [CrossRef]
- Kergosien, Y.; Bélanger, V.; Soriano, P.; Gendreau, M.; Ruiz, A. A generic and flexible simulation-based analysis tool for EMS management. Int. J. Prod. Res. 2014, 53, 7299–7316. [Google Scholar] [CrossRef]
- Stämpfli, A.; Strauss, C. Sim911—ein Simulationsprogramm optimiert das Rettungswesen. In Zukunftswerkstatt Rettungsdienst; Neumayr, A., Baubin, M., Schinnerl, A., Eds.; Springer: Berlin, Germany, 2018; pp. 135–142. [Google Scholar]
- Aringhieri, R.; Bruni, M.; Khodaparasti, S.; Van Essen, T. Emergency Medical Services and beyond: Addressing new challenges through a wide literature review. Comput. Oper. Res. 2017, 78, 349–368. [Google Scholar] [CrossRef]
- Brailsford, S.C.; Hilton, N.A. A comparison of discrete event simulation and system dynamics for modelling health care systems. In Planning for the Future: Health Service Quality and Emergency Accessibility. Operational Research Applied to Health Services (ORAHS); Riley, J., Ed.; Glasgow Caledonian University: Glasgow, UK, 2001. [Google Scholar]
- Brailsford, S.C.; Harper, P.R.; Patel, B.; Pitt, M. An analysis of the academic literature on simulation and modelling in healthcare. J. Simul. 2009, 3, 130–140. [Google Scholar] [CrossRef]
- Jagtenberg, C.; Bhulai, S.; Mei, R. Dynamic ambulance dispatching: Is the closest-idle policy always optimal? Health Care Manag. Sci. 2016, 20, 517–531. [Google Scholar] [CrossRef]
- Krafft, T.; Kortevoß, A.; Butsch, C.; Tenelsen, T.; Ziemann, A. Nachfrageorientierte Steuerung von Rettungsdienstsystemen. In Angewandte Geoinformatik; Strobl, J., Blaschke, T., Griesebner, G., Eds.; Beiträge zum 19; AGIT-Symposium: Salzburg, Austria, 2007; pp. 409–418. [Google Scholar]
- Multikopter im Rettungsdienst—Machbarkeitsstudie zum Einsatzpotenzial von Multikoptern als Notarztzubringer. ADAC Luftrettung GmbH. 2020. Available online: https://luftrettung.adac.de/app/uploads/2020/10/Multikopter_im_Rettungsdienst_-_Machbarkeitsstudie_-_ADAC_Luftrettung.pdf (accessed on 3 March 2021).
- Pinciroli, A.; Righini, G.; Trubian, M. An interactive simulator of emergency management systems. In Proceedings of the IEEE Workshop on Health Care Management (WHCM), Venice, Italy, 18–20 February 2010; pp. 1–5. [Google Scholar]
- Birk, A.; Gay-Cabrera, A.; Gehring, C.; Groß, S.; Kerth, J.; Kohlmann, T. Schlussbericht Forschungsprojekt PrimAIR: Konzept zur Primären Luftrettung in Strukturschwachen Gebieten; Ludwig-Maximilians-Universität München, Institut für Notfallmedizin und Medizinmanagement: München, Germany, 2015. [Google Scholar]
- Halbe, J.; Holtz, G.; Ruutu, S. Participatory modeling for transition governance: Linking methods to process phases. Environ. Innov. Soc. Transitions 2020, 35, 60–76. [Google Scholar] [CrossRef]
- Köhler, J.; de Haan, F.; Holtz, G.; Kubeczko, K.; Moallemi, E.; Papachristos, G.; Chappin, E. Modelling Sustainability Transitions: An Assessment of Approaches and Challenges. J. Artif. Soc. Soc. Simul. 2018, 21, 8. [Google Scholar] [CrossRef]
- Ranganathan, P.; Aggarwal, R. Study designs Part 1 An overview and classification. Perspect. Clin. Res. 2018, 9, 184–186. [Google Scholar] [CrossRef]
- Winston, W.L.; Goldberg, J.B. Operations Research: Applications and Algorithms; Thomson/Brooks/Cole: Pacific Grove, CA, USA, 2004. [Google Scholar]
- Kanton Zürich, G. Erläuterung: Projekt Optimierung Rettungs-wesen im Kanton Zürich—Anforderungen an die Rettungs- und Verlegungsdienste. Available online: https://www.zh.ch/content/dam/zhweb/bilder-dokumente/themen/gesundheit/gesundheitsversorgung/notfall_rettung/projekt_optimierung_rettungswesen_anforderungen_erlaeuterungen.pdf (accessed on 14 July 2023).
- Bildstein, G.; Stämpfli, A.; Strauss, C. Verbesserung von Hilfsfristen im Schweizer Rettungswesen mittels Simulationsmodell sim911. In Deutscher Interdisziplinärer Notfallmedizin Kongress; Springer: Berlin/Heidelberg, Germany, 2018. [Google Scholar]
- Sterman, J.D. Business Dynamics: Systems Thinking and Modeling for a Complex World; Irwin/McGraw-Hill: New York, NY, USA, 2000; Volume 19. [Google Scholar]
- Chaix-Couturier, C.; Durand-Zaleski, I.; Jolly, D.; Durieux, P. Effects of financial incentives on medical practice: Results from a systematic review of the literature and methodological issues. Int. J. Qual. Health Care 2000, 12, 133–142. [Google Scholar] [CrossRef]
- Rodwin, M.A. Medicine, Money, and Morals: Physicians’ Conflicts of Interest; Oxford University Press: Oxford, UK, 1993. [Google Scholar]
- Davahli, M.R.; Karwowski, W.; Taiar, R. A System Dynamics Simulation Applied to Healthcare: A Systematic Review. Int. J. Environ. Res. Public Health 2020, 17, 5741. [Google Scholar] [CrossRef]
- Lan, C.-H.; Chuang, L.-L.; Chen, Y.-F. A system dynamics model of the fire department EMS in Taiwan. Int. J. Emerg. Manag. 2010, 7, 323–343. [Google Scholar] [CrossRef]
- Lane, D.C.; Monefeldt, C.; Rosenhead, J.V. Looking in the wrong place for healthcare improvements: A system dynamics study of an accident and emergency department. J. Oper. Res. Soc. 2000, 51, 518–531. [Google Scholar] [CrossRef]
- Martin, R.J.; Bacaksizlar, N.G. Modeling the Dynamics of an Urban Emergency Medical Services System. In Proceedings of the 35th International Conference of the System Dynamics Society, Cambridge, MA, USA, 16–20 July 2017. [Google Scholar]
- Brailsford, S.C. System dynamics: What’s in it for healthcare simulation modelers. In Proceedings of the Winter Simulation Conference, Miami, FL, USA, 7–10 December 2008; pp. 1478–1483. [Google Scholar]
- Brailsford, S.C.; Desai, S.M.; Viana, J. Towards the holy grail: Combining system dynamics and discrete-event simulation in healthcare. In Proceedings of the 2010 Winter Simulation Conference, Baltimore, MD, USA, 5–8 December 2010; pp. 2293–2303. [Google Scholar]
- Nguyen, L.K.N.; Megiddo, I.; Howick, S. Hybrid Simulation for Modeling Healthcare-associated Infections: Promising but Challenging. Clin. Infect. Dis. 2021, 72, 1475–1480. [Google Scholar] [CrossRef]
- Carlile, P.R. Transferring Translating and Transforming An Integrative Framework for Managing Knowledge Across Boundaries. Organ. Sci. 2004, 15, 555–568. [Google Scholar] [CrossRef]
- Richardson, G.P.; Andersen, D.F. Systems Thinking, Mapping, and Modeling in Group Decision and Negotiation. In Handbook of Group Decision and Negotiation. Advances in Group Decision and Negotiation; Kilgour, D., Eden, C., Eds.; Springer: Dordrecht, The Netherlands, 2010; pp. 313–324. [Google Scholar]
- Rouwette, E.A.J.A. The impact of group model building on behavior. In Behavioral Operational Research: Theory, Methodology and Practice; Kunc, M., Malpass, J., White, L., Eds.; Palgrave MacMillan: London, UK, 2016; pp. 213–241. [Google Scholar]
- Rettungsdienstbericht Bayern 2022—Berichtszeitraum 2012 bis 2021, Institut für Notfallmedizin und Medizinmanagement (INM). Available online: https://www.inr.de/images/stories/pdf/RD_BERICHT_2022.pdf (accessed on 14 July 2023).
- Qualitätsbericht Berichtsjahr 2021—Rettungsdienst Baden-Württemberg, Stelle zur trägerübergreifenden Qualitätssicherung im Rettungsdienst Baden-Württemberg (SQR-BW). Available online: https://www.sqrbw.de/fileadmin/SQRBW/Downloads/Qualitaetsberichte/SQRBW_Qualitaetsbericht_2021_web.pdf (accessed on 14 July 2023).
- Rotes Kreuz Vorarlberg. Private communication, January 2023.
Disclaimer/Publisher’s Note: The statements, opinions and data contained in all publications are solely those of the individual author(s) and contributor(s) and not of MDPI and/or the editor(s). MDPI and/or the editor(s) disclaim responsibility for any injury to people or property resulting from any ideas, methods, instructions or products referred to in the content. |
© 2024 by the authors. Licensee MDPI, Basel, Switzerland. This article is an open access article distributed under the terms and conditions of the Creative Commons Attribution (CC BY) license (https://creativecommons.org/licenses/by/4.0/).

