
Identification of Lipid Droplet-Associated Genes in Breast Cancer Patients

 , ,
, ,  and
and
Abstract
:1. Background
2. Methods
2.1. Supervised Research: Selecting Procedure for Lipid Droplet-Associated Genes
2.2. Bioinformatics Design
2.3. Unsupervised Research: Statistical Analysis
2.4. Cell Culture Experiments
2.5. Lipid Extraction from Cell Lines
2.6. High-Performance Thin-Layer Chromatography (HPTLC)
2.7. Electrospray Mass Spectrometry (ESI MS)
2.8. Co-Culture Experiments of Cell Lines and Adipose Tissue
2.9. Microscopy of the Lipid Droplets in the Co-Cultured Cell Lines
3. Results and Discussion
3.1. Selection of Lipid Metabolism and Lipid Droplet-Associated Genes for the Bioinformatics and Cell Culture Analysis
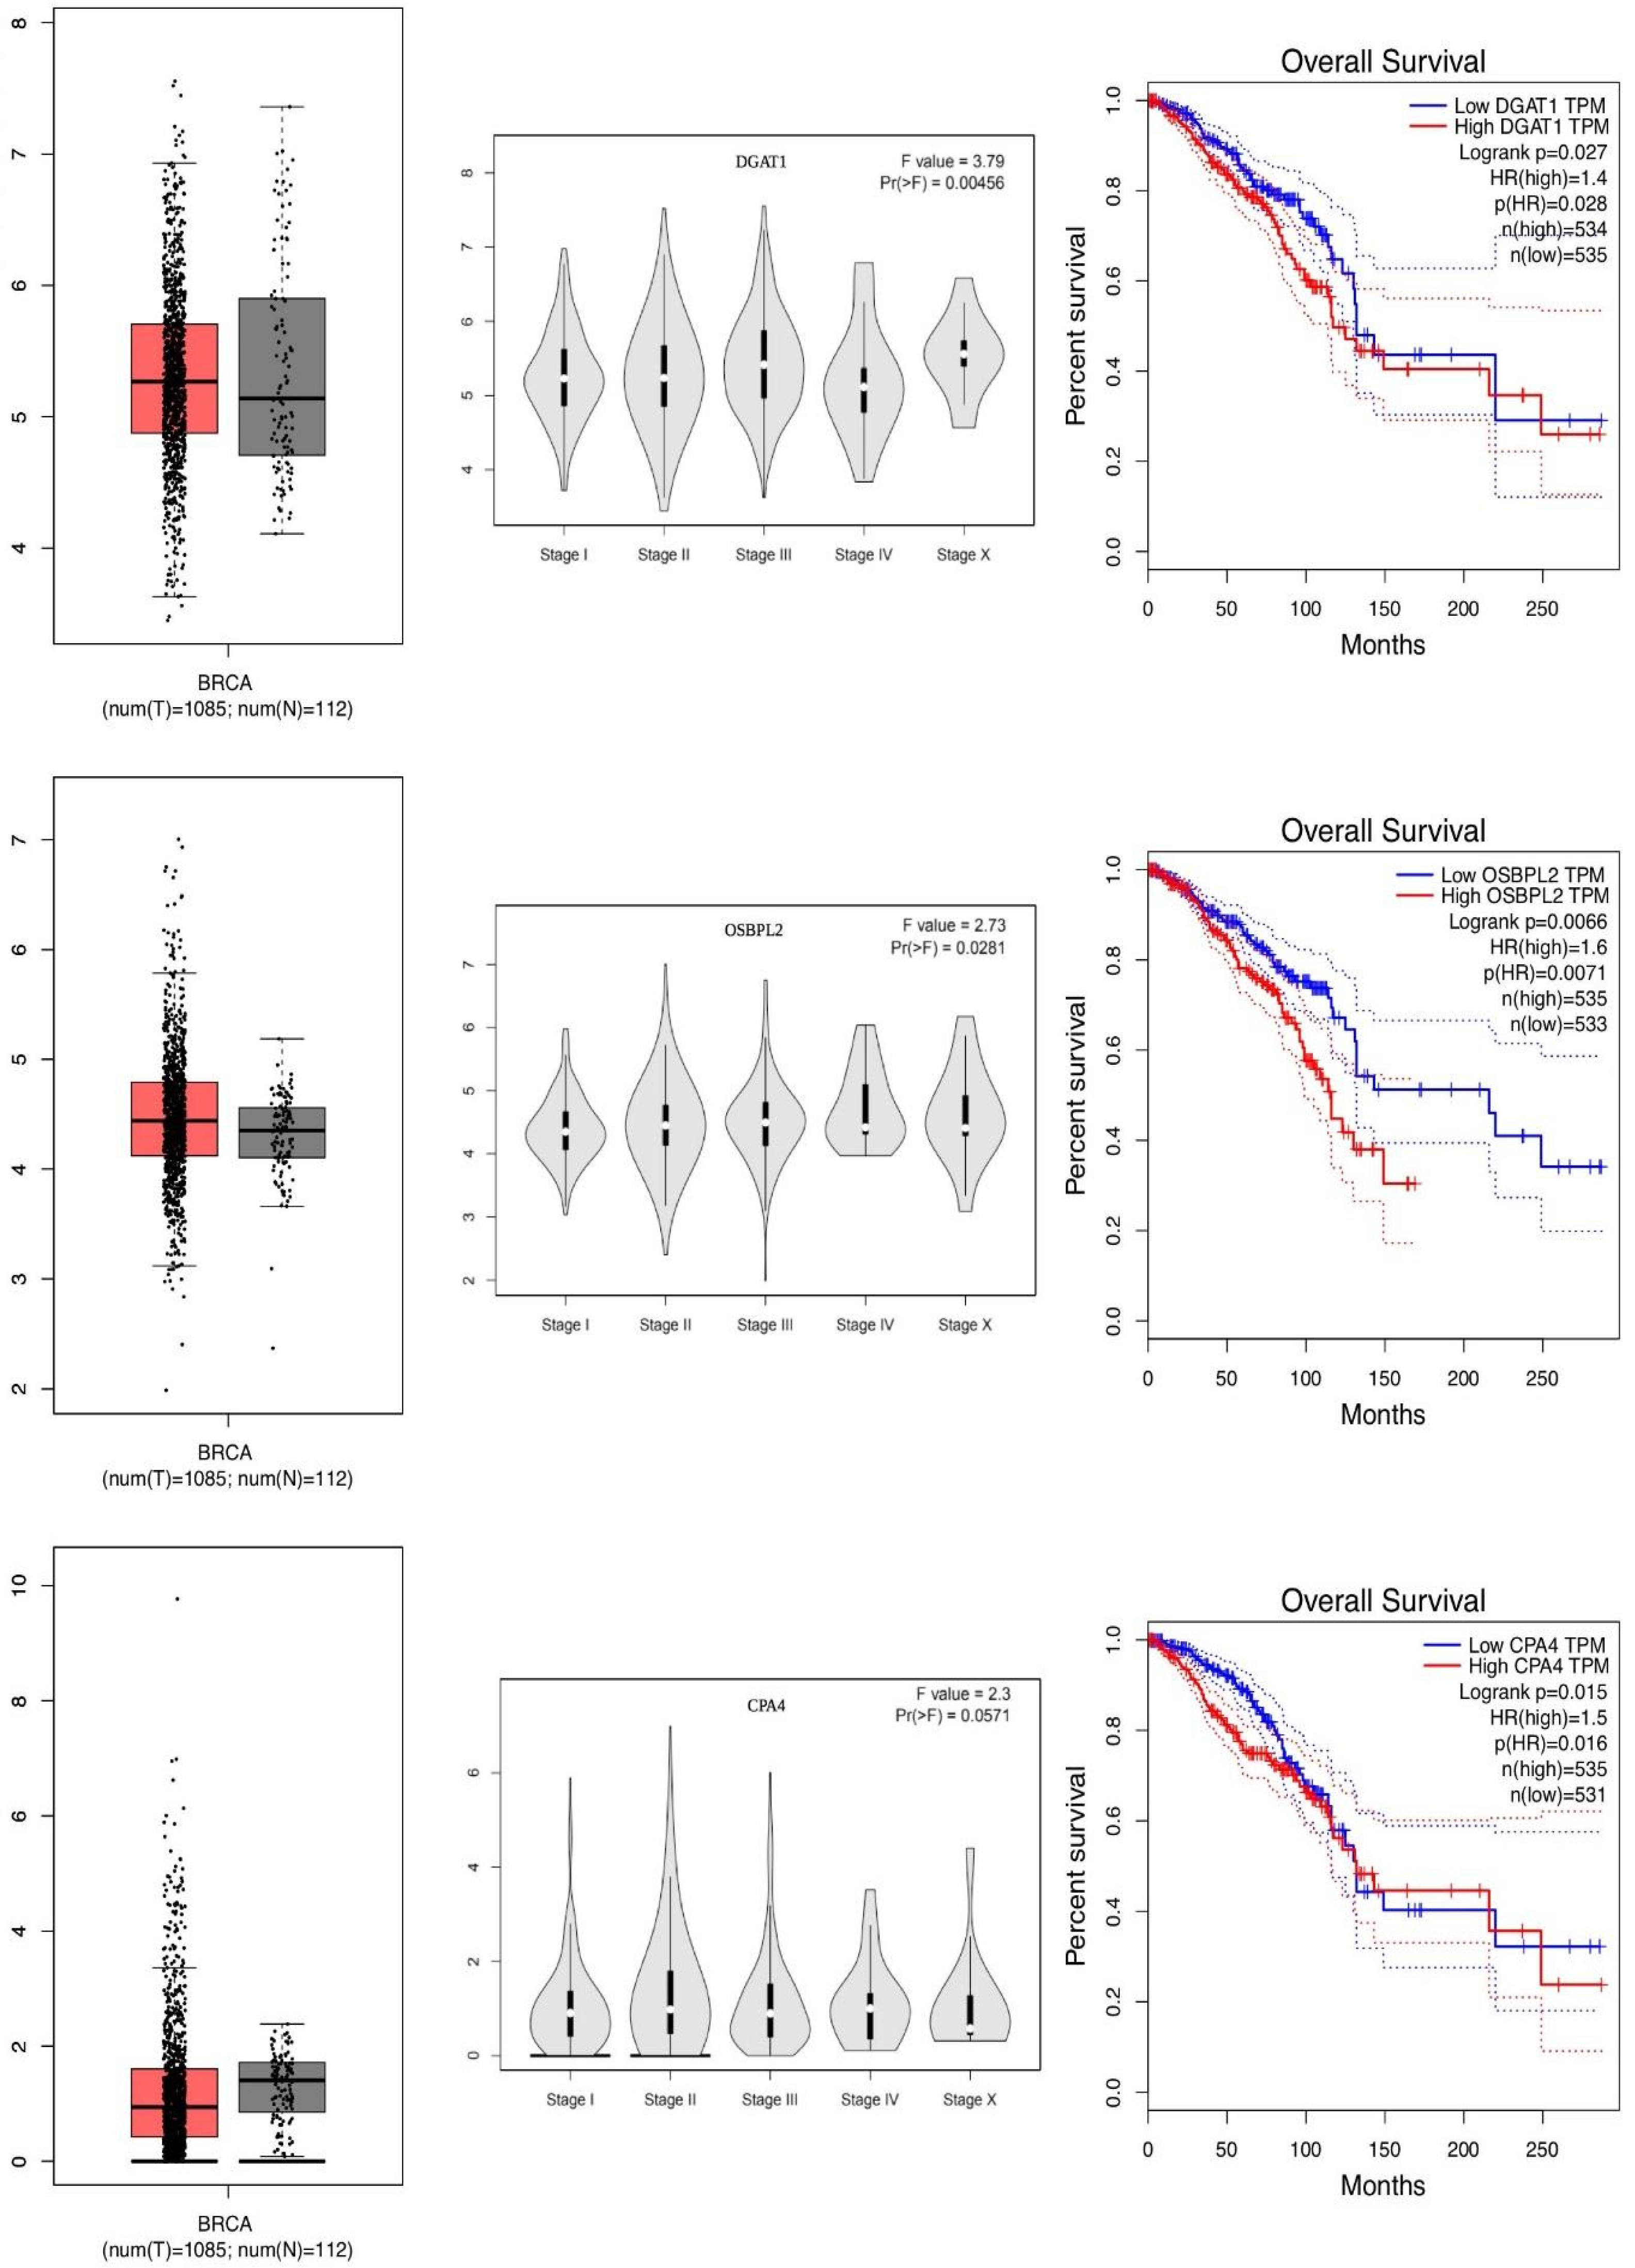
3.2. Significantly Altered Lipid Droplet-Associated Genes in Breast Cancer Patients
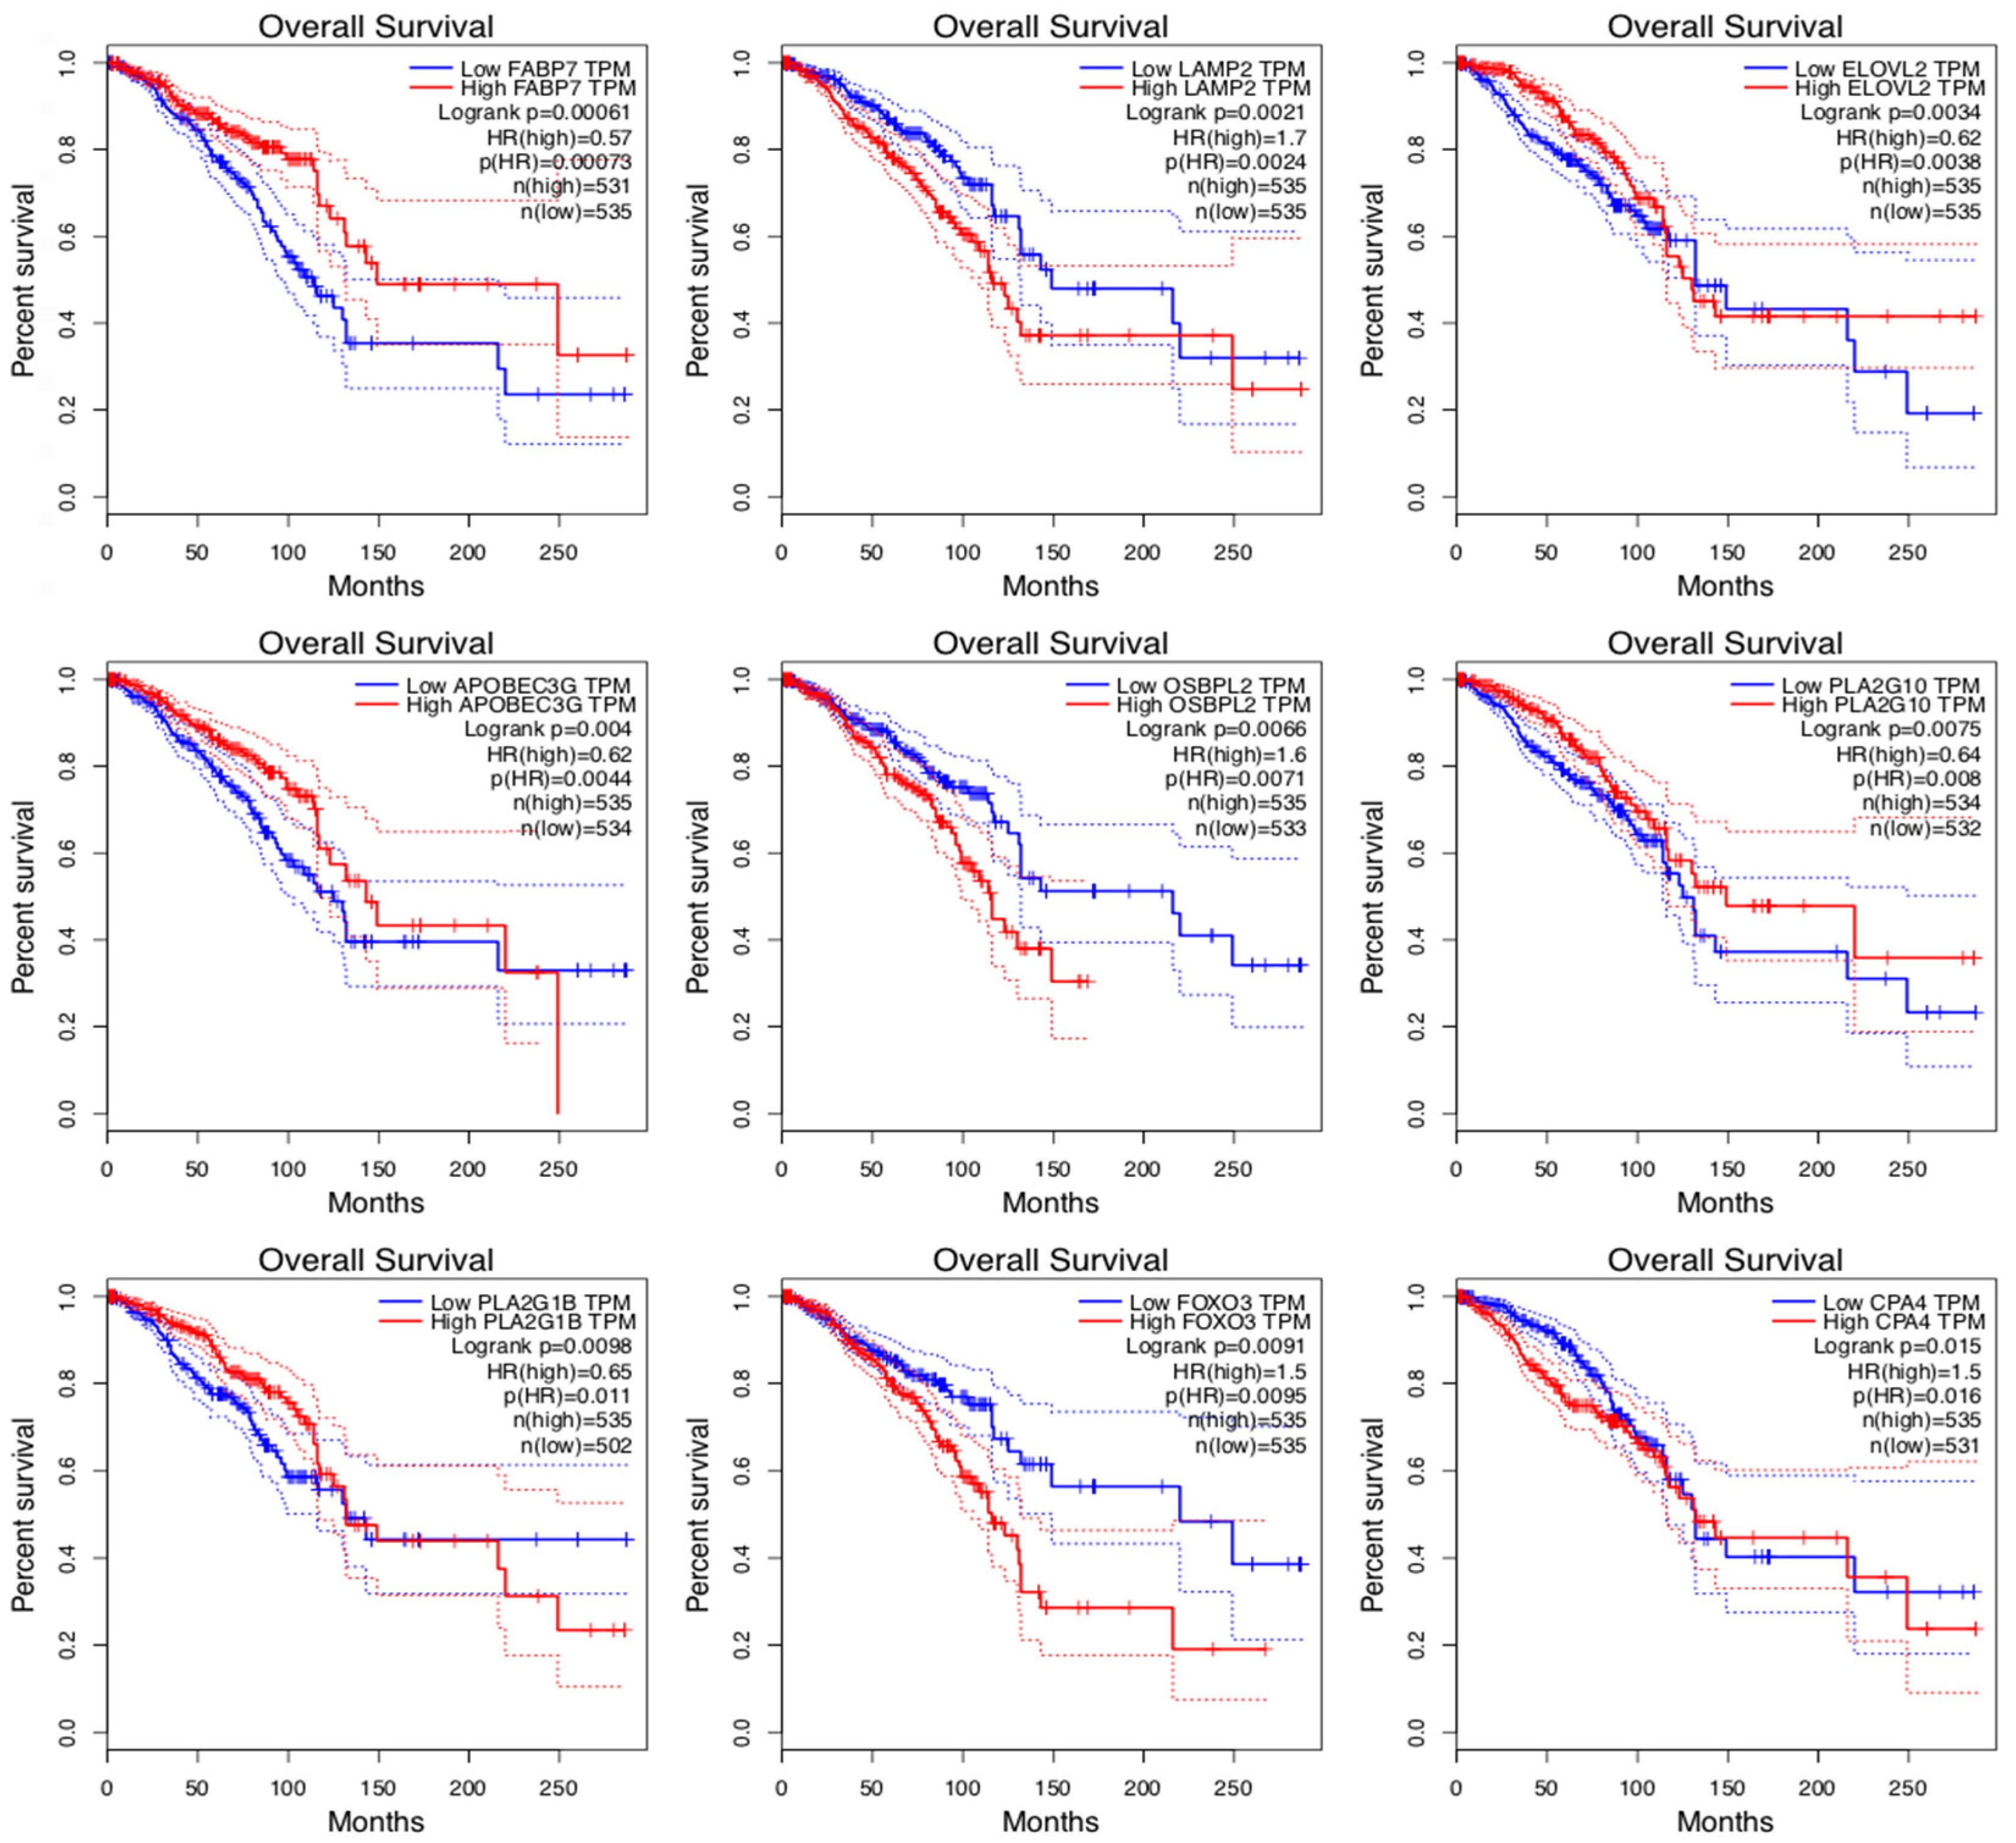
3.3. The Relation between Overall Survival Analysis of Lipid-Associated Genes and Their Expression in Breast Cancer Patients
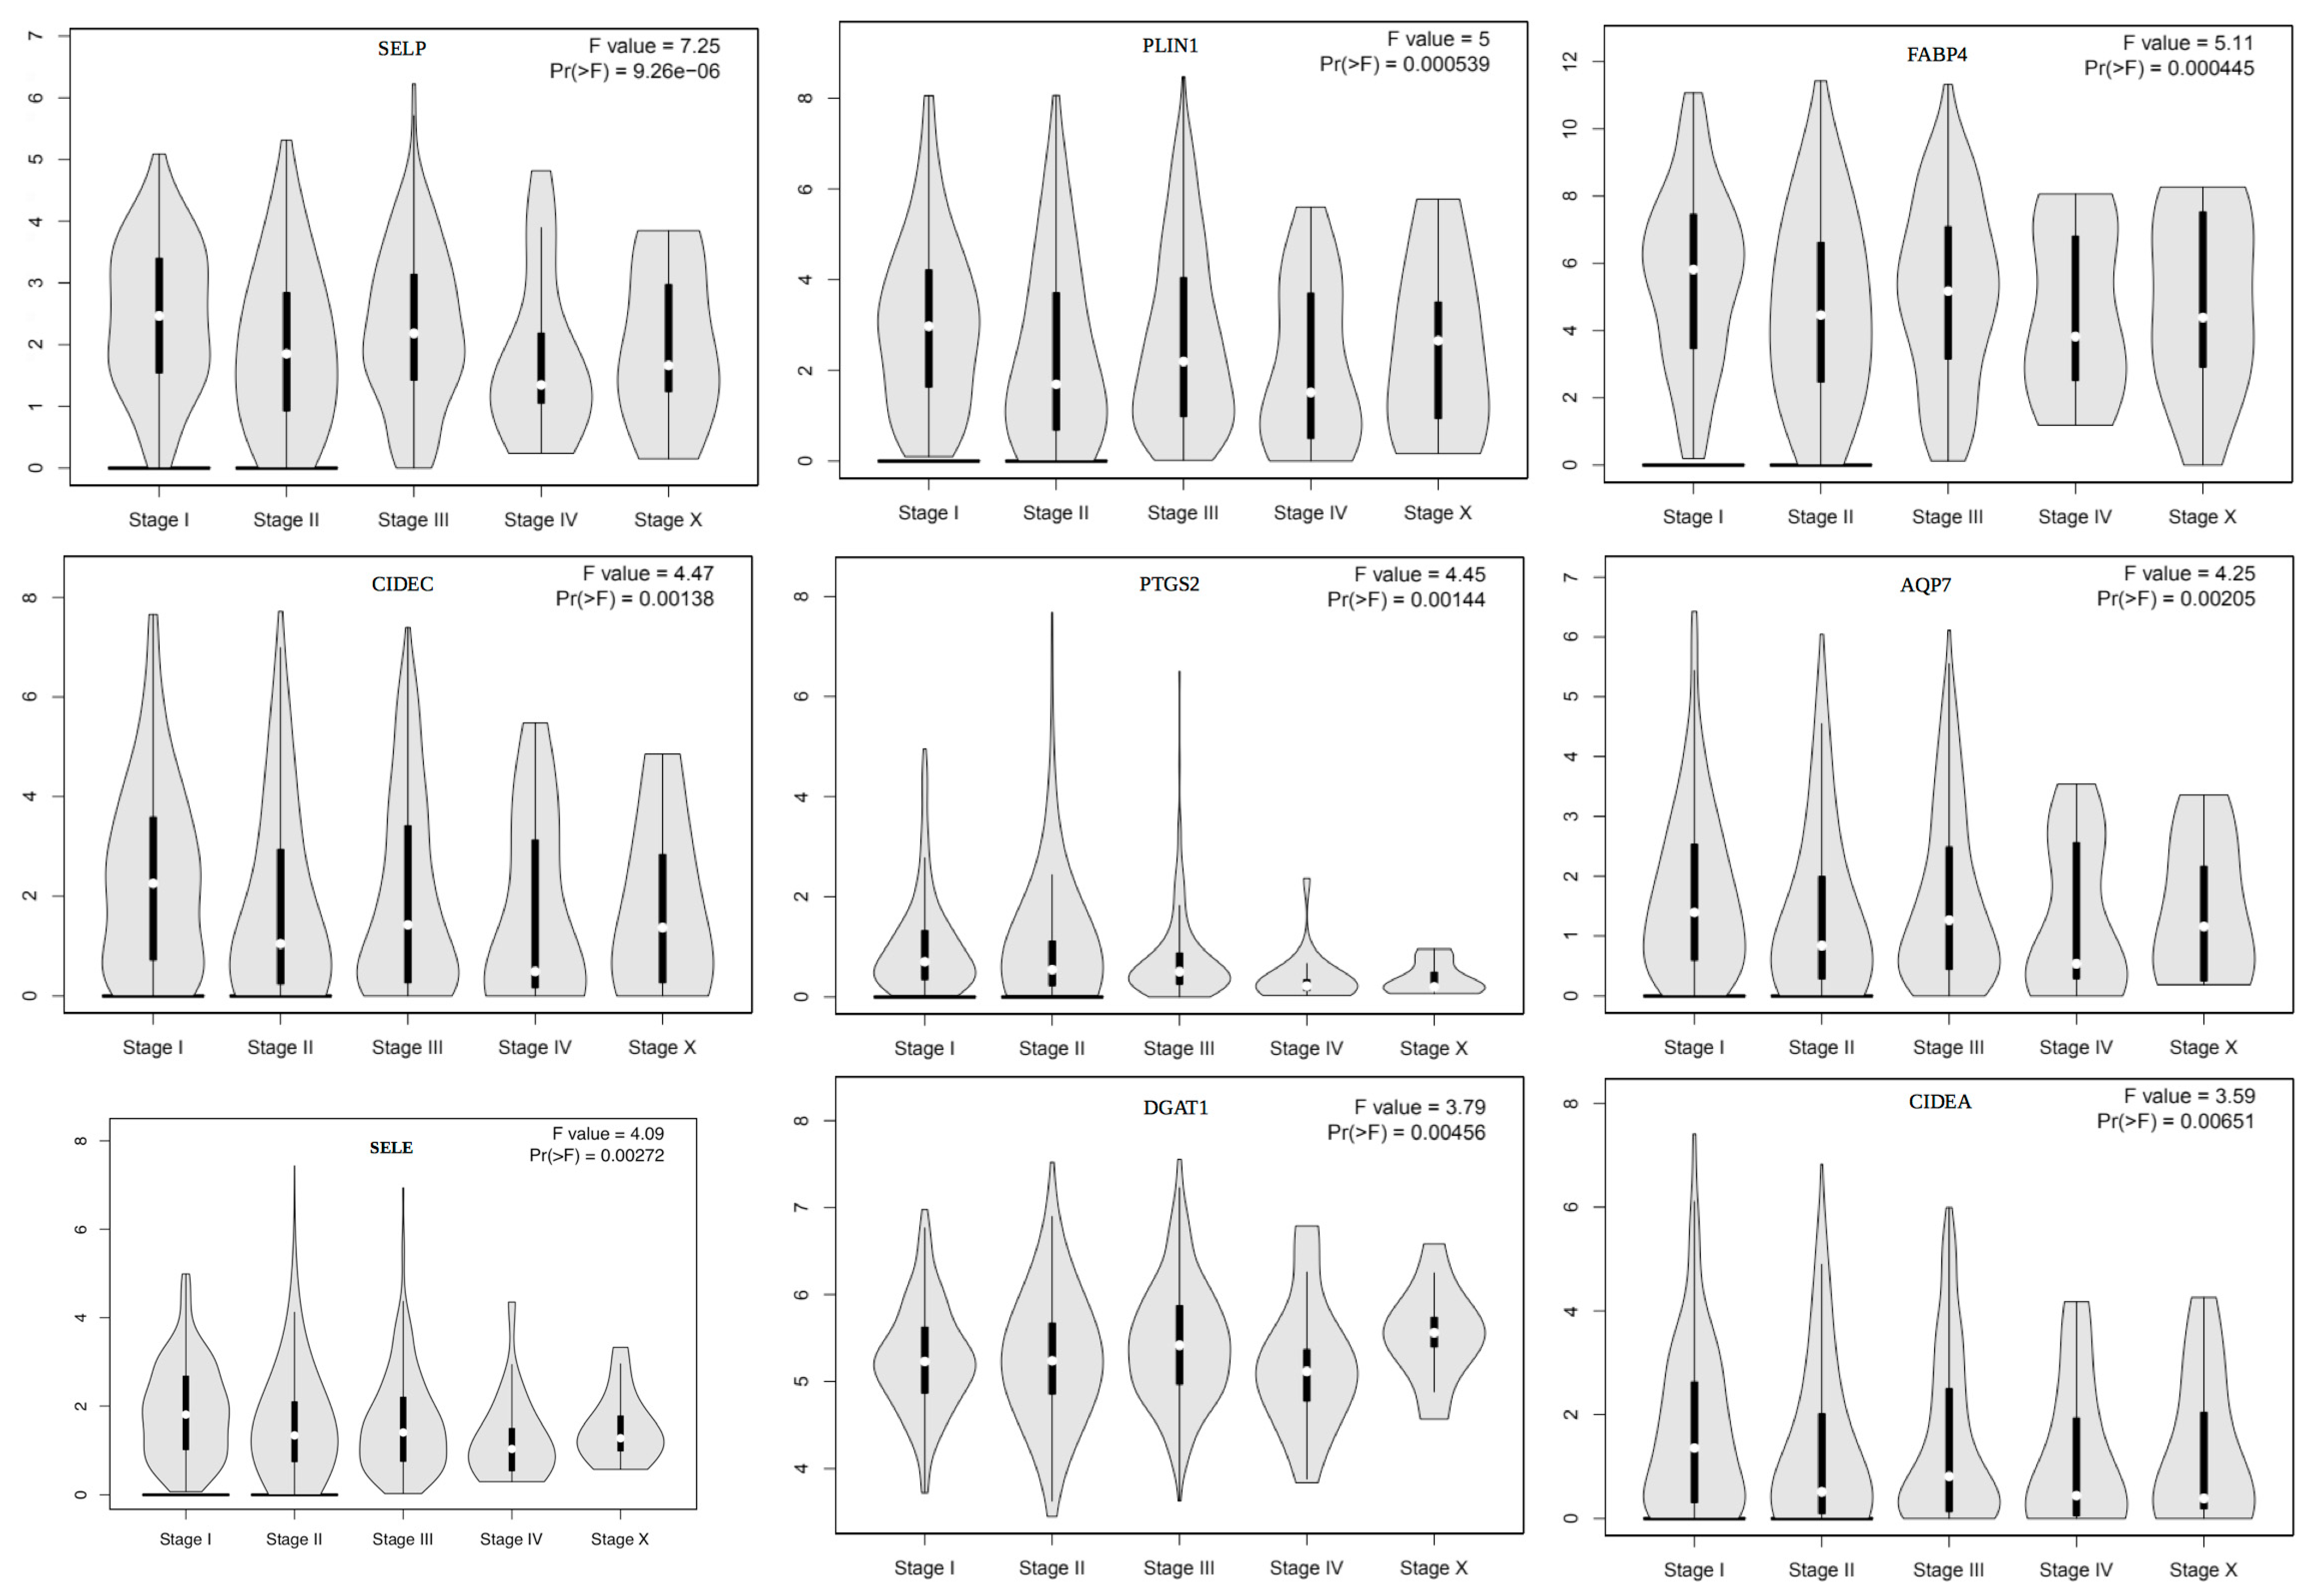
3.4. Significantly Changed Genes between Metastatic Transitions
3.5. An Outstanding Gene: FABP7
3.6. Both Overall Survival and Metastatic Transition Significant Genes
3.7. Overall Survival Analysis
3.8. Metastatic Stage Analysis of All the Genes
3.9. Unsupervised DEGs in Breast Cancer Tissue
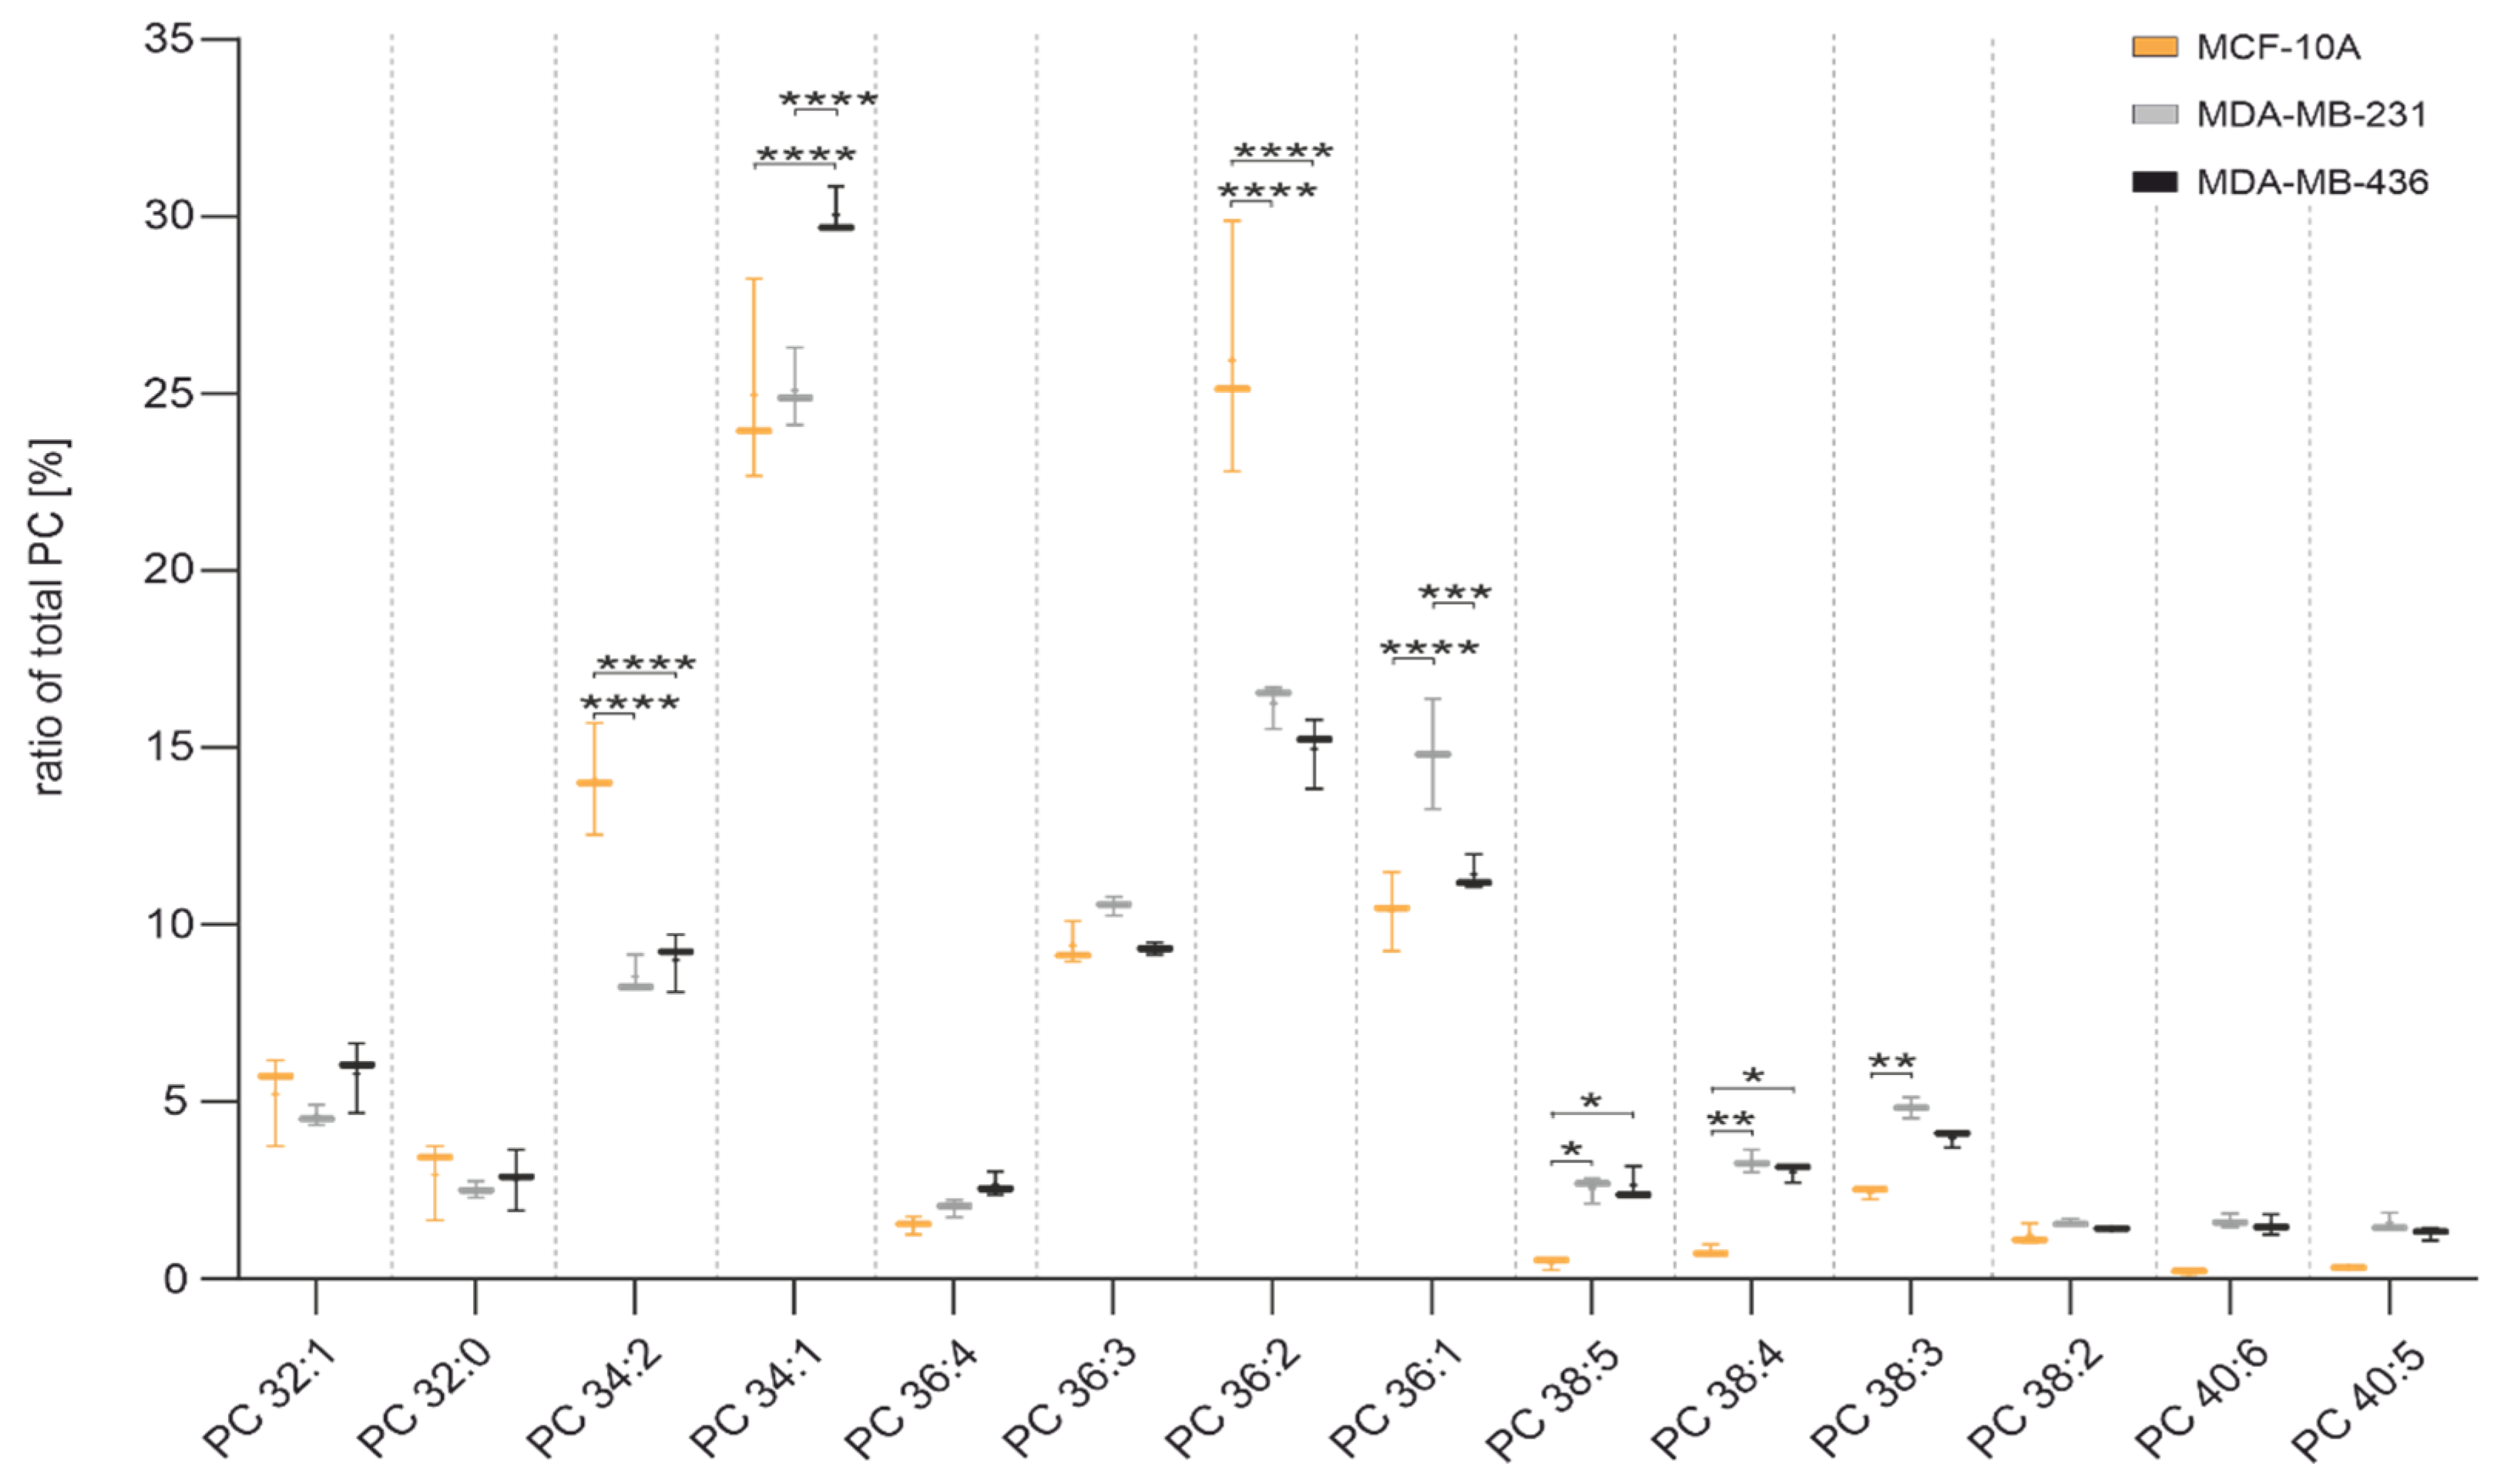
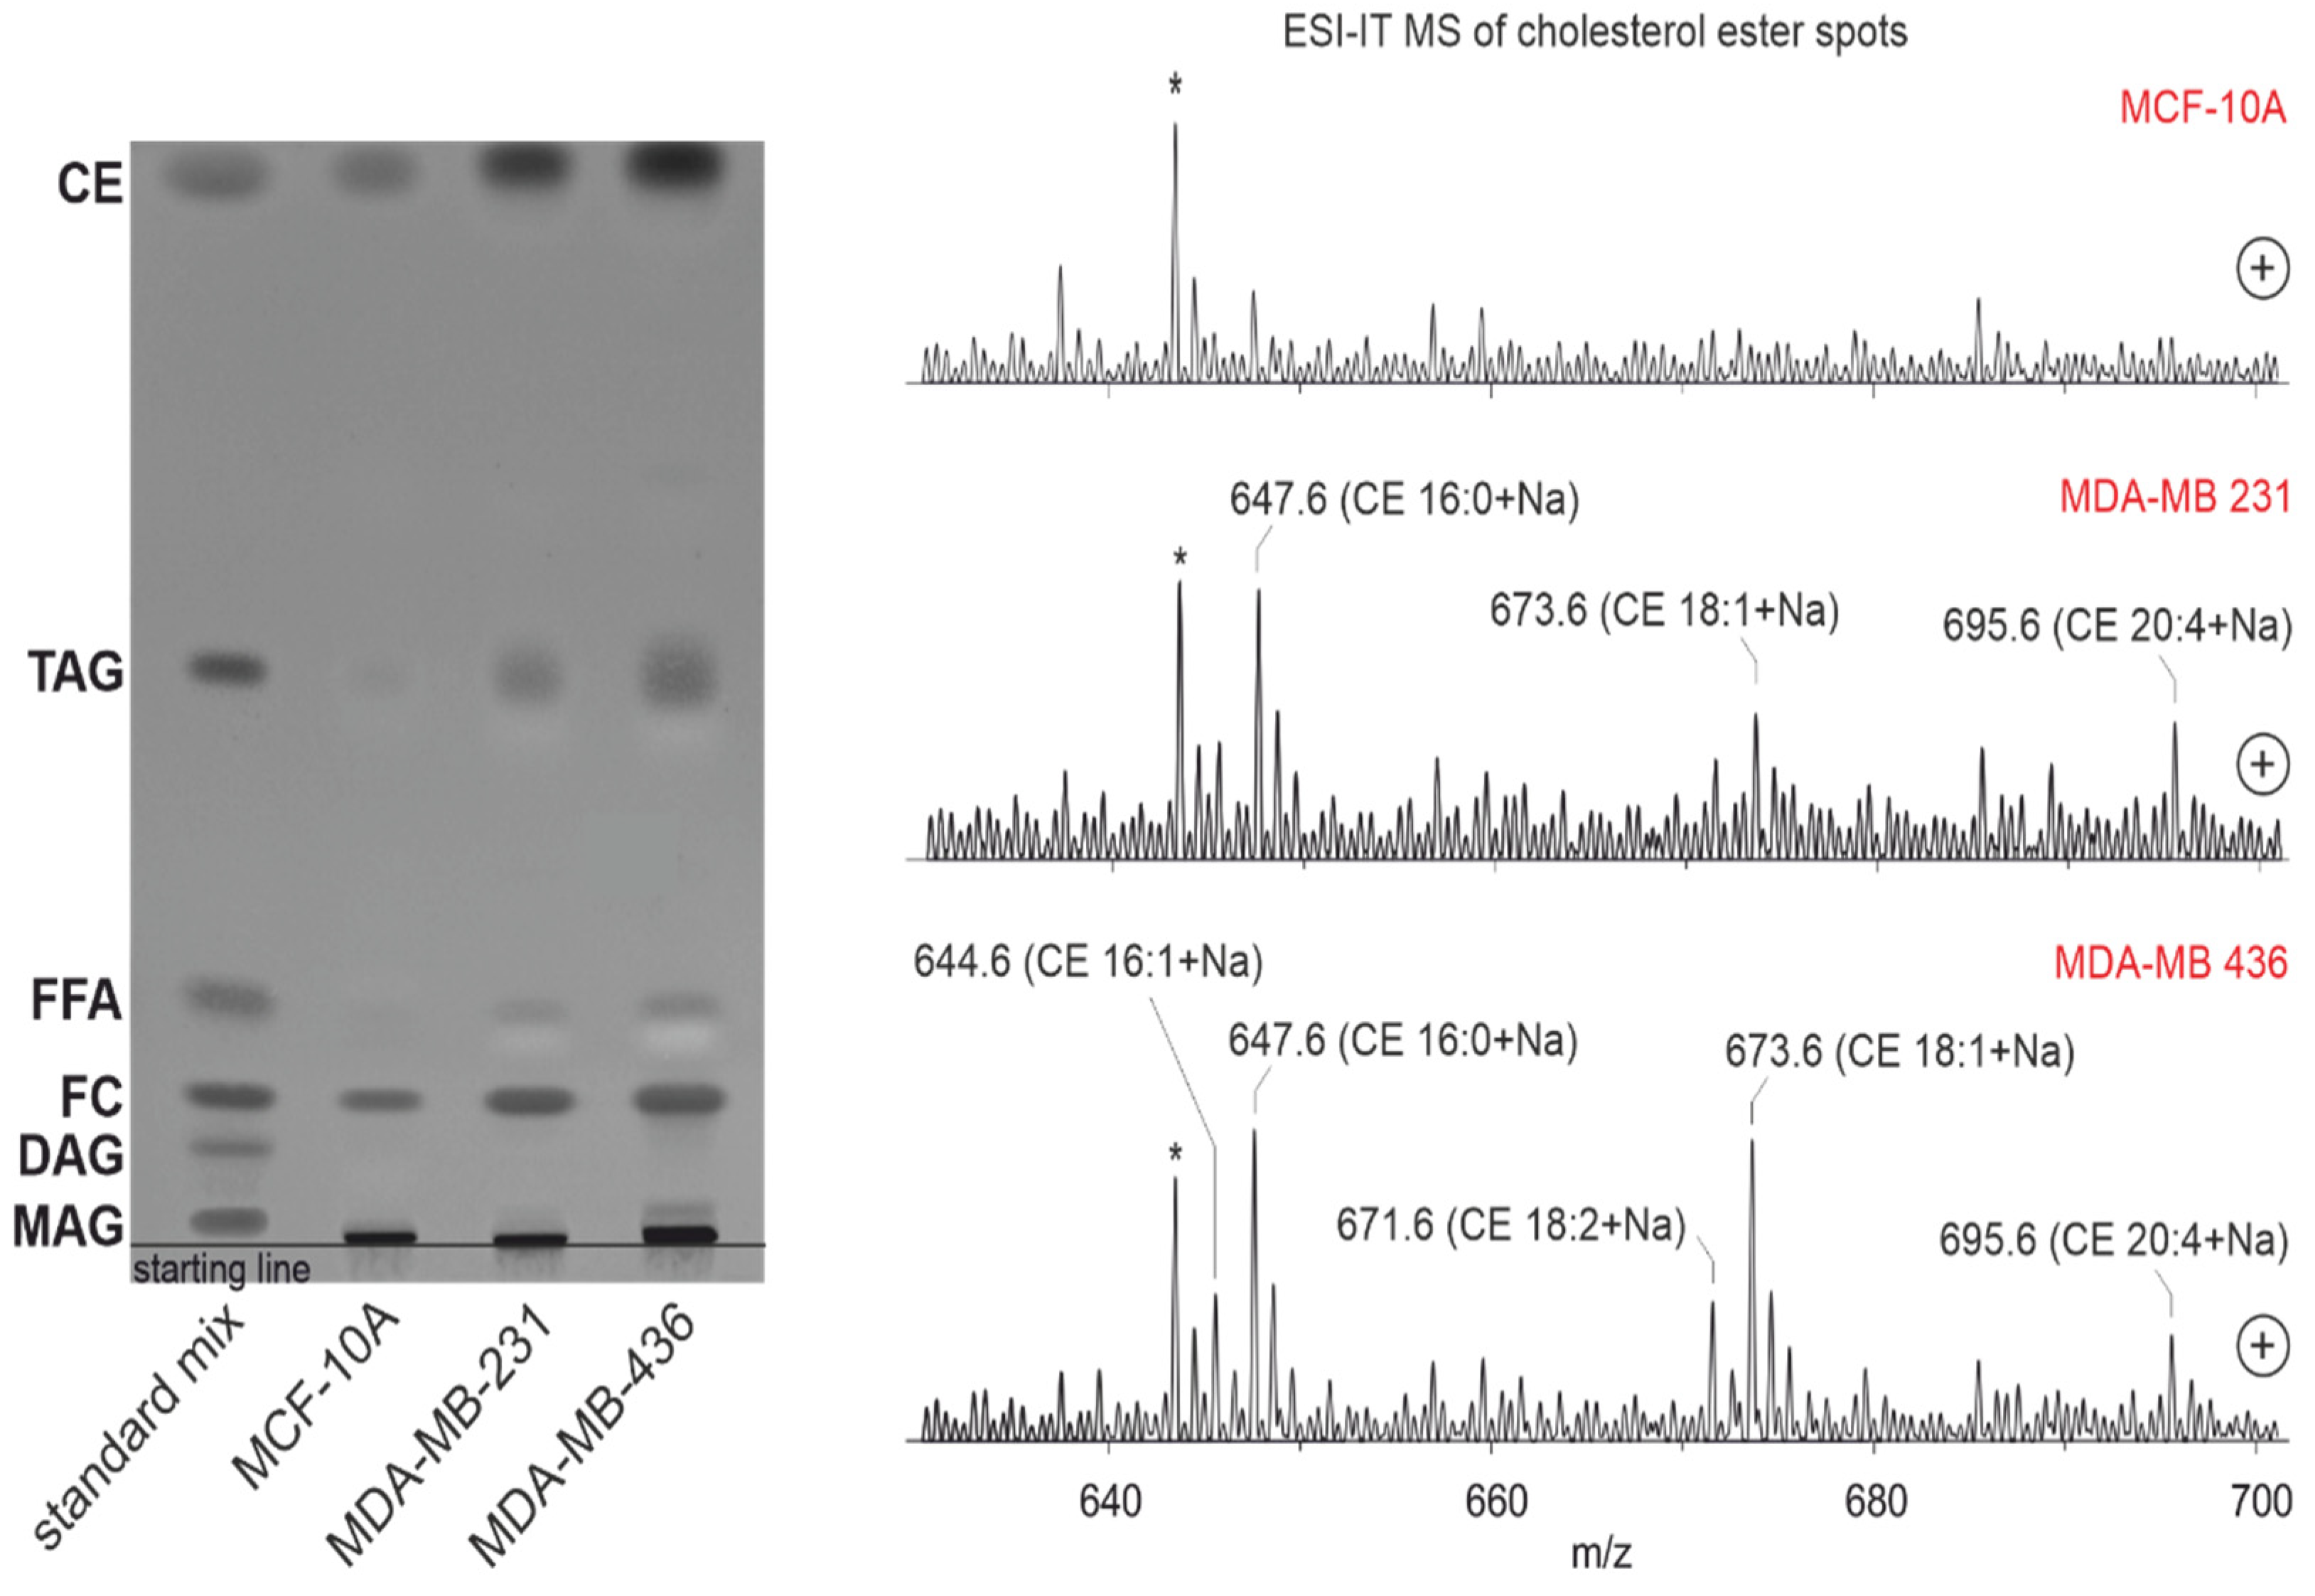
3.10. Lipid Profile by Thin-Layer Chromatography Coupled with Mass Spectrometry
3.11. Lipid Droplet Accumulation in Cell Lines
4. Conclusions
Supplementary Materials
Author Contributions
Funding
Institutional Review Board Statement
Informed Consent Statement
Data Availability Statement
Acknowledgments
Conflicts of Interest
Abbreviations
- Summary of background knowledge
- Cell Lines: MCF 10A is an epithelial cell line that was isolated in 1984 from the mammary gland of a white, 36-year-old female with fibrocystic breasts. This cell line was deposited by the Michigan Cancer Foundation. The MDA-MB-231 cell line is an epithelial, human breast cancer cell line, which was established from a pleural effusion of a 51-year Caucasian female with a metastatic mammary adenocarcinoma, and is one of the most commonly used breast cancer cell lines in medical research laboratories. MDA-MB-436 is a triple-negative breast cancer cell line, which are epithelial in nature.
- Statistics: Overall Survival: Survival analysis is a collection of statistical procedures relating to the length of time from either the date of diagnosis or the start of treatment for a disease such as cancer, which patients are diagnosed with, up to death. It is used to estimate the lifespan of a particular population under study. In the beginning, the survival probability is 1.0 (or, 100% of the participants are alive). After that, it gives the probability that a patient, device, or other objects of interest will survive past a certain time [43]. Cox regression: This is a method for investigating the effects of a few variables upon the time a specified event takes to happen. It is known as Cox regression for survival analysis if the context outcome is death. The probabilities lower than 0.05 are considered significant and researchers conventionally provide a 95% confidence interval for the hazard ratio [44]. Hazard Ratio: This is the hazard rate corresponding to the conditions described by two levels of an explanatory variable. The measures of association tell us that a hazard ratio of 1 means a lack of association, a hazard ratio greater than 1 suggests an increased risk, and a hazard ratio below 1 suggests a smaller risk [45]. F-Statistics: this is a statistical test that shows the equality of the variances of the two normal populations and is used to determine whether the variances of two populations are equal or not, by using a one-tailed or two-tailed hypothesis test [46]. Disease-Free Survival: This is a number that shows the chances of staying free of a disease or cancer after a particular treatment. It also refers to the time from treatment until the recurrence of disease (or death) after undergoing curative-intent treatment [47]. Prognostic Factor: this is a characteristic of a patient that can be used to estimate the chance of recovery from a disease or the chance of the disease recurring (coming back) [48].
- Metastatic Stages in Breast Cancer, According to [32]: Stage IA: in this stage, the tumor is characterized by its small size, invasiveness, and absence of spread to the lymph nodes (T1, N0, and M0). Stage IB: Cancer has extended to the lymph nodes, with the size of the cancerous lymph node falling between 0.2 mm and less than 2 mm. There is either no presence of a tumor in the breast, or, if there is, it measures 20 mm or smaller (T0 or T1, N1mi, and M0).Stage IIA: This stage includes various conditions, such as the absence of a tumor in the breast but the presence of cancer in one-to-three axillary lymph nodes, with no distant spread (T0, N1, and M0). Additionally, a tumor measuring 20 mm or smaller that has spread to one-to-three axillary lymph nodes (T1, N1, and M0), or a tumor larger than 20 mm but not exceeding 50 mm without spread to axillary lymph nodes (T2, N0, and M0). Stage IIB: This stage encompasses scenarios where the tumor is larger than 20 mm but not exceeding 50 mm, with spread to one-to-three axillary lymph nodes (T2, N1, and M0). Alternatively, the tumor is larger than 50 mm without spreading to axillary lymph nodes (T3, N0, M0). Stage IIIA: Tumors of any size in this stage have spread to four-to-nine axillary lymph nodes or internal mammary lymph nodes, but not to other parts of the body (T0, T1, T2, or T3; N2; and M0). Stage IIIA may also involve a tumor larger than 50 mm that has spread to one-to-three axillary lymph nodes (T3, N1, and M0). Stage IIIB: The tumor has spread to the chest wall, caused swelling or ulceration of the breast, or has been diagnosed as inflammatory breast cancer. It may or may not have spread to up to nine axillary or internal mammary lymph nodes, but has not extended to other body parts (T4; N0, N1, or N2; and M0). Stage IIIC: In this stage, tumors of any size have spread to 10 or more axillary lymph nodes, internal mammary lymph nodes, and/or lymph nodes under the collarbone. Importantly, there is no spread to other parts of the body (any T, N3, and M0). Stage IV (metastatic): The tumor, regardless of size, has metastasized to organs like the bones, lungs, brain, liver, distant lymph nodes, or chest wall (any T, any N, and M1). De novo metastatic breast cancer, discovered at the initial diagnosis, accounts for approximately 6% of cases, while metastatic breast cancer is more commonly identified after prior diagnosis and treatment of early-stage breast cancer.
References
- Bray, F.; Ferlay, J.; Soerjomataram, I.; Siegel, R.L.; Torre, L.A.; Jemal, A. Global cancer statistics 2018: GLOBOCAN estimates of incidence and mortality worldwide for 36 cancers in 185 countries. CA Cancer J. Clin. 2018, 68, 394–424. [Google Scholar] [CrossRef]
- World Health Organization: Breast Cancer. 2021. Available online: www.who.int/news-room/fact-sheets/detail/breast-cancer (accessed on 21 April 2023).
- Rositch, A.F.; Unger-Saldaña, K.; DeBoer, R.J.; Ng’ang’a, A.; Weiner, B.J. The role of dissemination and implementation science in global breast cancer control programs: Frameworks, methods, and examples. Cancer 2020, 126 (Suppl. S10), 2394–2404. [Google Scholar] [CrossRef]
- Ginsburg, O.; Yip, C.-H.; Brooks, A.; Cabanes, A.; Caleffi, M.; Dunstan Yataco, J.A.; Gyawali, B.; McCormack, V.; de Anderson, M.M.; Mehrotra, R.; et al. Breast cancer early detection: A phased approach to implementation. Cancer 2020, 126 (Suppl. S10), 2379–2393. [Google Scholar] [CrossRef]
- Provenzano, E.; Ulaner, G.A.; Chin, S.-F. Molecular Classification of Breast Cancer. PET Clin. 2018, 13, 325–338. [Google Scholar] [CrossRef]
- Cavallaro, S.; Paratore, S.; de Snoo, F.; Salomone, E.; Villari, L.; Buscarino, C.; Ferraù, F.; Banna, G.; Furci, M.; Strazzanti, A.; et al. Genomic analysis: Toward a new approach in breast cancer management. Crit. Rev. Oncol. Hematol. 2012, 81, 207–223. [Google Scholar] [CrossRef]
- Kim, M.; Park, J.; Bouhaddou, M.; Kim, K.; Rojc, A.; Modak, M.; Soucheray, M.; McGregor, M.J.; O’leary, P.; Wolf, D.; et al. A protein interaction landscape of breast cancer. Science 2021, 374, eabf3066. [Google Scholar] [CrossRef]
- Núñez, C. Blood-based protein biomarkers in breast cancer. Clin. Chim. Acta. 2019, 490, 113–127. [Google Scholar] [CrossRef]
- Callesen, A.K.; Madsen, J.S.; Vach, W.; Kruse, T.A.; Mogensen, O.; Jensen, O.N. Serum protein profiling by solid phase extraction and mass spectrometry: A future diagnostics tool? Proteomics 2009, 9, 1428–1441. [Google Scholar] [CrossRef]
- Veyssière, H.; Bidet, Y.; Penault-Llorca, F.; Radosevic-Robin, N.; Durando, X. Circulating proteins as predictive and prognostic biomarkers in breast cancer. Clin. Proteom. 2022, 19, 25. [Google Scholar] [CrossRef] [PubMed]
- Rajkumar, T.; Amritha, S.; Sridevi, V.; Gopal, G.; Sabitha, K.; Shirley, S.; Swaminathan, R. Identification and validation of plasma biomarkers for diagnosis of breast cancer in South Asian women. Sci. Rep. 2022, 12, 100. [Google Scholar] [CrossRef] [PubMed]
- Uehiro, N.; Sato, F.; Pu, F.; Tanaka, S.; Kawashima, M.; Kawaguchi, K.; Sugimoto, M.; Saji, S.; Toi, M. Circulating cell-free DNA-based epigenetic assay can detect early breast cancer. Breast Cancer Res. 2016, 18, 129. [Google Scholar] [CrossRef] [PubMed]
- Han, X.; Gross, R.W. Global analyses of cellular lipidomes directly from crude extracts of biological samples by ESI mass spectrometry: A bridge to lipidomics. J. Lipid Res. 2003, 44, 1071–1079. [Google Scholar] [CrossRef] [PubMed]
- Schröter, J.; Popkova, Y.; Süß, R.; Schiller, J. Combined use of MALDI-TOF mass spectrometry and 31P NMR spectroscopy for analysis of phospholipids. Methods Mol. Biol. 2017, 1609, 107–122. [Google Scholar] [CrossRef] [PubMed]
- Guo, R.; Chen, Y.; Borgard, H.; Jijiwa, M.; Nasu, M.; He, M.; Deng, Y. The function and mechanism of lipid molecules and their roles in the diagnosis and prognosis of breast cancer. Molecules 2020, 25, 4864. [Google Scholar] [CrossRef]
- Silva, C.L.; Perestrelo, R.; Sousa-Ferreira, I.; Capelinha, F.; Câmara, J.S.; Petković, M. Lipid biosignature of breast cancer tissues by matrix-assisted laser desorption/ionization time-of-flight mass spectrometry. Breast Cancer Res. Treat. 2020, 182, 9–19. [Google Scholar] [CrossRef] [PubMed]
- Lee, Y.J.; Shin, K.J.; Jang, H.-J.; Noh, D.-Y.; Ryu, S.H.; Suh, P.-G. Phospholipase signaling in breast cancer. Adv. Exp. Med. Biol. 2021, 1187, 23–52. [Google Scholar] [CrossRef] [PubMed]
- Tőkés, A.M.; Vári-Kakas, S.; Kulka, J.; Törőcsik, B. Tumor glucose and fatty acid metabolism in the context of anthracycline and taxane-based (neo)adjuvant chemotherapy in breast carcinomas. Front. Oncol. 2022, 12, 850401. [Google Scholar] [CrossRef] [PubMed]
- Menendez, J.A.; Lupu, R. Fatty acid synthase: A druggable driver of breast cancer brain metastasis. Expert. Opin. Ther. Targets. 2022, 26, 427–444. [Google Scholar] [CrossRef] [PubMed]
- Li, Y.-L.; Tian, H.; Jiang, J.; Zhang, Y.; Qi, X.-W. Multifaceted regulation and functions of fatty acid desaturase 2 in human cancers. Am. J. Cancer Res. 2020, 10, 4098–4111. [Google Scholar]
- Cruz, A.L.S.; Barreto, E.d.A.; Fazolini, N.P.B.; Viola, J.P.B.; Bozza, P.T. Lipid droplets: Platforms with multiple functions in cancer hallmarks. Cell Death Dis. 2020, 11, 105. [Google Scholar] [CrossRef]
- Liu, X.; Zhang, P.; Xu, J.; Lv, G.; Li, Y. Lipid metabolism in tumor microenvironment: Novel therapeutic targets. Cancer Cell Int. 2022, 22, 224. [Google Scholar] [CrossRef] [PubMed]
- Rustan, A.C.; Drevon, C.A. Fatty Acids: Structures and Properties. In Encyclopedia of Life Sciences; Wiley: Weinheim, Germany, 2005. [Google Scholar] [CrossRef]
- Folch, J.; Lees, M.; Sloane Stanley, G.H. A simple method for the isolation and purification of total lipides from animal tissues. J. Biol. Chem. 1957, 226, 497–509. [Google Scholar] [CrossRef]
- Tang, Z.; Li, C.; Kang, B.; Gao, G.; Li, C.; Zhang, Z. GEPIA: A web server for cancer and normal gene expression profiling and interactive analyses. Nucleic Acids Res. 2017, 45, W98–W102. [Google Scholar] [CrossRef] [PubMed]
- Shen, Y.; Schmidt, B.U.S.; Kubitschke, H.; Morawetz, E.W.; Wolf, B.; Käs, J.A.; Losert, W. Detecting heterogeneity in and between breast cancer cell lines. Cancer Converg. 2020, 4, 1. [Google Scholar] [CrossRef] [PubMed]
- Fuchs, B.; Schiller, J.; Süss, R.; Schürenberg, M.; Suckau, D. A direct and simple method of coupling matrix-assisted laser desorption and ionization time-of-flight mass spectrometry (MALDI-TOF MS) to thin-layer chromatography (TLC) for the analysis of phospholipids from egg yolk. Anal. Bioanal. Chem. 2007, 389, 827–834. [Google Scholar] [CrossRef] [PubMed]
- Bui, Q.; Sherma, J.; Hines, J.K. Using high performance thin layer chromatography-densitometry to study the influence of the prion RNQ+ and its determinant prion protein Rnq1 on yeast lipid profiles. Separations 2018, 5, 6. [Google Scholar] [CrossRef] [PubMed]
- Klöting, N.; Fasshauer, M.; Dietrich, A.; Kovacs, P.; Schön, M.R.; Kern, M.; Stumvoll, M.; Blüher, M. Insulin-sensitive obesity. Am. J. Physiol. Endocrinol. Metab. 2010, 299, E506-15. [Google Scholar] [CrossRef]
- Schmitz, J.; Evers, N.; Awazawa, M.; Nicholls, H.T.; Brönneke, H.S.; Dietrich, A.; Mauer, J.; Blüher, M.; Brüning, J. Obesogenic memory can confer long-term increases in adipose tissue but not liver inflammation and insulin resistance after weight loss. Mol. Metab. 2016, 5, 328–339. [Google Scholar] [CrossRef] [PubMed]
- Eggert, D.; Rösch, K.; Reimer, R.; Herker, E. Visualization and analysis of hepatitis C virus structural proteins at lipid droplets by super-resolution microscopy. PLoS ONE 2014, 9, e102511. [Google Scholar] [CrossRef]
- Available online: https://www.cancercenter.com/cancer-types/breast-cancer/stage (accessed on 15 January 2024).
- Amin, M.B.; Greene, F.L.; Edge, S.B. (Eds.) AJCC Cancer Staging Manual; AJCC American Joint Committee on Cancer: Chicago, IL, USA; Springer: Berlin/Heidelberg, Germany, 2017. [Google Scholar]
- Chang, X.; Xing, P. Identification of a novel lipid metabolism-related gene signature within the tumour immune microenvironment for breast cancer. Lipids Health Dis. 2022, 21, 43. [Google Scholar] [CrossRef]
- White, T.; Bursten, S.; Federighi, D.; Lewis, R.A.; Nudelman, E. High-resolution separation and quantification of neutral lipid and phospholipid species in mammalian cells and sera by multi-one-dimensional thin-layer chromatography. Anal. Biochem. 1998, 258, 109–117. [Google Scholar] [CrossRef] [PubMed]
- Wang, H.-Y.J.; Huang, C.-Y.; Wei, K.-C.; Hung, K.-C. A mass spectrometry imaging and lipidomic investigation reveals aberrant lipid metabolism in the orthotopic mouse glioma. J. Lipid Res. 2022, 63, 100304. [Google Scholar] [CrossRef] [PubMed]
- Giudetti, A.M.; De Domenico, S.; Ragusa, A.; Lunetti, P.; Gaballo, A.; Franck, J.; Simeone, P.; Nicolardi, G.; De Nuccio, F.; Santino, A.; et al. A specific lipid metabolic profile is associated with the epithelial mesenchymal transition program. Biochim. Biophys. Acta Mol. Cell Biol. Lipids. 2019, 1864, 344–357. [Google Scholar] [CrossRef] [PubMed]
- Ohno, Y.; Suto, S.; Yamanaka, M.; Mizutani, Y.; Mitsutake, S.; Igarashi, Y.; Sassa, T.; Kihara, A. ELOVL1 production of C24 acyl-CoAs is linked to C24 sphingolipid synthesis. Proc. Natl. Acad. Sci. USA 2010, 107, 18439–18444. [Google Scholar] [CrossRef]
- Adler, D.H.; Cogan, J.D.; Phillips, J.A.; Schnetz-Boutaud, N.; Milne, G.L.; Iverson, T.; Stein, J.A.; Brenner, D.A.; Morrow, J.D.; Boutaud, O.; et al. Inherited human cPLA(2alpha) deficiency is associated with impaired eicosanoid biosynthesis, small intestinal ulceration, and platelet dysfunction. J. Clin. Investig. 2008, 118, 2121–2131. [Google Scholar] [CrossRef]
- Balendiran, G.K.; Schnutgen, F.; Scapin, G.; Borchers, T.; Xhong, N.; Lim, K.; Godbout, R.; Spener, F.; Sacchettini, J.C. Crystal structure and thermodynamic analysis of human brain fatty acid-binding protein. J. Biol. Chem. 2000, 275, 27045–27054. [Google Scholar] [CrossRef]
- Tschodu, D.; Ulm, B.; Bendrat, K.; Lippoldt, J.; Gottheil, P.; Käs, J.A.; Niendorf, A. Comparative analysis of molecular signatures reveals a hybrid approach in breast cancer: Combining the nottingham prognostic index with gene expressions into a hybrid signature. PLoS ONE 2022, 17, e0261035. [Google Scholar] [CrossRef]
- Vidavsky, N.; Kunitake, J.A.M.R.; Diaz-Rubio, M.E.; Chiou, A.E.; Loh, H.-C.; Zhang, S.; Masic, A.; Fischbach, C.; Estroff, L.A. Mapping and profiling lipid distribution in a 3D model of breast cancer progression. ACS Cent. Sci. 2019, 5, 768–780. [Google Scholar] [CrossRef]
- Hajihosseini, M.; Faradmal, J.; Sadighi-Pashaki, A. Survival analysis of breast cancer patients after surgery with an intermediate event: Application of illness-death model. Iran. J. Public Health 2015, 44, 1677–1684. [Google Scholar]
- Abadi, A.; Yavari, P.; Dehghani-Arani, M.; Alavi-Majd, H.; Ghasemi, E.; Amanpour, F.; Bajdik, C. Cox models survival analysis based on breast cancer treatments. Iran. J. Cancer Prev. 2014, 7, 124–129. [Google Scholar]
- Hilsenbeck, S.G.; Ravdin, P.M.; Moor CA de Chamness, G.C.; Osborne, C.K.; Clark, G.M. Time-dependence of hazard ratios for prognostic factors in primary breast cancer. Breast Cancer Res. Treat. 1998, 52, 227–237. [Google Scholar] [CrossRef] [PubMed]
- Markowski, C.A.; Markowski, E.P. Conditions for the effectiveness of a preliminary test of variance. Am. Statistician. 1990, 44, 322. [Google Scholar] [CrossRef]
- Paik, H.-J.; Lee, S.K.; Ryu, J.M.; Park, S.; Kim, I.; Bae, S.Y.; Yu, J.; Lee, J.E.; Kim, S.W.; Nam, S.J. Conditional disease-free survival among patients with breast cancer. Medicine 2017, 96, e5746. [Google Scholar] [CrossRef] [PubMed]
- Phung, M.T.; Tin Tin, S.; Elwood, J.M. Prognostic models for breast cancer: A systematic review. BMC Cancer 2019, 19, 230. [Google Scholar] [CrossRef] [PubMed]


| Gene Name | Description | OS p-Value | OS HR | Expression | F-Value | Metastatic p-Value |
|---|---|---|---|---|---|---|
| FABP7 | Fatty Acid Binding Protein 7 | 0.0006 | 0.57 | UE/S | 3.310 | 0.0100 |
| LAMP2 | Lysosomal-Associated Protein | 0.0020 | 1.70 | Same | 0.513 | 0.7200 |
| ELOVL2 | Fatty Acid Elongase 2 | 0.0030 | 0.62 | OE | 0.660 | 0.6100 |
| APOBEC3G | Apolipoprotein mRNA editing enzyme | 0.0040 | 0.62 | UE | 2.000 | 0.0920 |
| OSBPL2 | Oxysterol-Binding Protein | 0.0070 | 1.60 | OS | 2.730 | 0.0200 |
| PLA2G10 | Phospholipase A2 Group X | 0.0070 | 0.64 | OS | 0.600 | 0.6600 |
| PLA2G1B | Phospholipase A2 Group IB | 0.0090 | 0.65 | Same | 1.590 | 0.1700 |
| FOXO3 | Forkhead Box O3 | 0.0090 | 1.50 | UE | 0.669 | 0.6140 |
| CPA4 | Carboxypeptidase A4 | 0.0100 | 1.50 | UE | 2.300 | 0.0500 |
| ELOVL1 | Fatty Acid Elongase 1 | 0.0100 | 1.50 | OE | 0.811 | 0.5100 |
| FKBP5 | FKBP Prolyl Isomerase 5 | 0.0100 | 0.68 | UE | 0.300 | 0.8700 |
| PLIN5 | Perilipin 5 | 0.0100 | 0.65 | UE | 0.811 | 0.5100 |
| SAA4 | Serum Amyloid A4 | 0.0100 | 0.68 | UE/S | 1.270 | 0.2000 |
| TMEM229B | Transmembrane Protein 229B | 0.0100 | 0.66 | OE | 1.500 | 0.2000 |
| SELL | Selectin L | 0.0160 | 0.67 | Same | 1.300 | 0.2000 |
| LSS | Lanosterol Synthase | 0.0170 | 1.50 | UE | 0.660 | 0.6100 |
| CHKB | Choline Kinase Beta | 0.0200 | 0.68 | UE/S | 1.040 | 0.3800 |
| CXCR6 | C-X-C Motif Chemokine Receptor 6 | 0.0200 | 0.68 | Same | 1.050 | 0.3800 |
| LPCAT1 | Lysophosphatidylcholine Acyltransferase | 0.0200 | 1.50 | OE | 0.300 | 0.8200 |
| PLA2G15 | Phospholipase A2 Group XV | 0.0200 | 1.40 | OE | 2.030 | 0.0800 |
| RBP4 | Retinol Binding Protein 4 | 0.0200 | 0.70 | UE/S | 3.790 | 0.0045 |
| DGAT1 | Diacylglycerol O-Acyltransferase 1 | 0.0280 | 1.40 | Same | 2.800 | 0.0200 |
| CHKA | Choline Kinase Alfa | 0.0400 | 1.40 | UE | 0.770 | 0.5400 |
| FADS6 | Fatty Acid Desaturase 6 | 0.0400 | 0.71 | Same | 2.800 | 0.0200 |
| LRGUK | Leucine-Rich Repeats and Guanylate Kinase | 0.0400 | 0.71 | OE | 1.260 | 0.2800 |
| SQLE | Squalene Epoxidase | 0.0410 | 1.40 | OE/S | 2.160 | 0.0700 |
| PIM2 | Pim-2 Proto-Oncogene | 0.0500 | 0.73 | OE | 1.840 | 0.1100 |
| PLA2G4A | Phospholipase A2 Group IVA | 0.0500 | 0.73 | UE/S | 2.160 | 0.0700 |
| Gene Name | Description | OS p-Value | Express. | F-Value | Metastatic p-Value |
|---|---|---|---|---|---|
| SELP | Selectin P | 0.5500 | UE | 7.25 | 0.0100 |
| PLIN1 | Perilipin1 | 0.3700 | UE/S | 5.00 | 0.0005 |
| FABP4 | Fatty-Acid-Binding Protein | 0.2400 | UE/S | 5.11 | 0.0004 |
| CIDEC | Cell Death-Inducing DFFA-Like Effector C | 0.4900 | UE/S | 4.47 | 0.0010 |
| PTGS2 | Prostaglandin-Endoperoxide Synthase 2 | 0.3900 | UE/S | 4.45 | 0.0010 |
| AQP7 | Aquaporin 7 | 0.2900 | UE/S | 4.25 | 0.0020 |
| SELE | Selectin E | 0.5100 | UE | 4.09 | 0.0020 |
| DGAT1 | Diacylglycerol O-Acyltransferase 1 | 0.0270 | Same | 3.79 | 0.0040 |
| CIDEA | Cell Death-Inducing DFFA-Like Effector A | 0.1100 | UE/S | 3.59 | 0.0060 |
| FITM1 | Fat Storage-Inducing Transmembrane Protein 1 | 0.0710 | UE | 3.44 | 0.0080 |
| LIPE | Lipase E, Hormone-Sensitive Type | 0.7200 | UE/S | 3.44 | 0.0080 |
| FABP7 | Fatty-Acid-Binding Protein | 0.0006 | UE/S | 3.31 | 0.0100 |
| FITM2 | Fat Storage-Inducing Transmembrane Protein 2 | 0.1100 | UE | 3.28 | 0.0100 |
| PLIN4 | Perilipin4 | 0.4200 | UE/S | 3.21 | 0.0100 |
| CAV1 | Caveolin 1 | 0.3400 | UE/S | 3.20 | 0.0100 |
| ELOVL5 | ELOVL Fatty Acid Elongase 5 | 0.3900 | UE | 3.01 | 0.0100 |
| FADS6 | Fatty Acid Desaturase 6 | 0.0400 | Same | 2.80 | 0.0200 |
| ACADS | Acyl-CoA Dehydrogenase Short Chain | 0.8900 | UE/S | 2.79 | 0.0200 |
| OSBPL2 | Oxysterol-Binding Protein-Like 2 | 0.0066 | OE | 2.73 | 0.0200 |
| HSD17B11 | Hydroxysteroid 17-Beta Dehydrogenase 11 | 0.2800 | UE/S | 2.70 | 0.0200 |
| FABP6 | Fatty-Acid-Binding Protein 6 | 0.3200 | Same | 2.58 | 0.0300 |
| MTTP | Microsomal Triglyceride Transfer Protein | 1.000 | UE | 2.56 | 0.0300 |
| PLA2G4D | Phospholipase A2 Group IVD | 0.4600 | OE | 2.54 | 0.0300 |
| PLA2G3 | Phospholipase A2 Group III | 0.8800 | UE | 2.45 | 0.0400 |
| CPA4 | Carboxypeptidase A4 | 0.0150 | UE | 2.30 | 0.0500 |
| PNPLA2 | Patatin-Like Phospholipase Domain-Containing 2 | 0.100 | UE/S | 2.28 | 0.0500 |
| Gene Name | Description | Tumor | Normal | Fold | F Statistics F-Value | Metastatic Stages p-Value | OS p-Value |
|---|---|---|---|---|---|---|---|
| ADH1B | Alcohol Dehydrogenase | 4.62 | 570.70 | −6.67 | 5.72 | 0.0001 | 0.82 |
| FABP4 | Fatty Acid binding | 30.29 | 3082.96 | −6.62 | 5.11 | 0.0004 | 0.82 |
| CIDEC | Lipid Droplet Formation | 1.35 | 204.92 | −6.45 | 4.47 | 0.0010 | 0.89 |
| PLIN1 | Lipid Droplet | 3.23 | 274.45 | −6.03 | 5.00 | 0.0005 | 0.86 |
| GPD1 | Catalyzing lipid | 1.94 | 150.75 | −5.69 | 3.50 | 0.0030 | 0.79 |
| ADIPOQ | Adiponectin | 1.78 | 135.23 | −5.62 | 4.09 | 0.0020 | 0.81 |
| RBP4 | Lipocalin | 3.47 | 203.23 | −5.51 | 1.89 | 0.1100 | 0.70 |
| PLIN4 | Lipid Droplet | 2.82 | 167.73 | −5.47 | 3.21 | 0.0100 | 0.88 |
| CD300LG | Nepmucin | 0.36 | 55.48 | −5.38 | 3.71 | 0.0050 | 0.98 |
| AQP7 | Aquaporin adipose | 0.98 | 80.56 | −5.36 | 4.25 | 0.0020 | 0.84 |
| HSPB6 | Heat Shock Protein | 6.52 | 298.27 | −5.32 | 5.83 | 0.0001 | 0.92 |
| BTNL9 | Exter.Pla.Memb | 1.60 | 95.04 | −5.21 | 3.68 | 0.0050 | 1.10 |
| CFD | Peptidase | 14.95 | 571.22 | −5.17 | 2.71 | 0.0200 | 0.91 |
| LEP | Leptin | 0.18 | 39.49 | −5.10 | 1.88 | 0.1100 | 0.80 |
| GPX3 | Gluthatione Perox. | 32.81 | 1132.11 | −5.07 | 1.98 | 0.0900 | 0.99 |
| CIDEA | Lipid Droplet Formation | 0.62 | 52.74 | −5.05 | 3.59 | 0.0060 | 0.77 |
| CA4 | Anchored membrane isozyme | 0.11 | 35.12 | −5.02 | 2.93 | 0.0200 | 0.94 |
| TUSC5 | Plasma membrane protein | 0.43 | 41.68 | −4.9 | 2.85 | 0.0200 | 0.78 |
| TIMP4 | Peptidase | 1.08 | 58.56 | −4.84 | 2.68 | 0.0300 | 0.87 |
| CLDN5 | Tight junction | 5.64 | 172.78 | −4.71 | 5.91 | 0.0001 | 0.91 |
Disclaimer/Publisher’s Note: The statements, opinions and data contained in all publications are solely those of the individual author(s) and contributor(s) and not of MDPI and/or the editor(s). MDPI and/or the editor(s) disclaim responsibility for any injury to people or property resulting from any ideas, methods, instructions or products referred to in the content. |
© 2024 by the authors. Licensee MDPI, Basel, Switzerland. This article is an open access article distributed under the terms and conditions of the Creative Commons Attribution (CC BY) license (https://creativecommons.org/licenses/by/4.0/).
Share and Cite
Dogan, S.; Leopold, J.; Hoffmann, D.T.; Kubitschke, H.; Blauth, E.; Ficorella, C.; Zschau, A.; Schiller, J.; Käs, J.A. Identification of Lipid Droplet-Associated Genes in Breast Cancer Patients. Lipidology 2024, 1, 52-74. https://doi.org/10.3390/lipidology1010005
Dogan S, Leopold J, Hoffmann DT, Kubitschke H, Blauth E, Ficorella C, Zschau A, Schiller J, Käs JA. Identification of Lipid Droplet-Associated Genes in Breast Cancer Patients. Lipidology. 2024; 1(1):52-74. https://doi.org/10.3390/lipidology1010005
Chicago/Turabian StyleDogan, Senol, Jenny Leopold, Daniel T. Hoffmann, Hans Kubitschke, Eliane Blauth, Carlotta Ficorella, Amelie Zschau, Jürgen Schiller, and Josef A. Käs. 2024. "Identification of Lipid Droplet-Associated Genes in Breast Cancer Patients" Lipidology 1, no. 1: 52-74. https://doi.org/10.3390/lipidology1010005
APA StyleDogan, S., Leopold, J., Hoffmann, D. T., Kubitschke, H., Blauth, E., Ficorella, C., Zschau, A., Schiller, J., & Käs, J. A. (2024). Identification of Lipid Droplet-Associated Genes in Breast Cancer Patients. Lipidology, 1(1), 52-74. https://doi.org/10.3390/lipidology1010005