Article

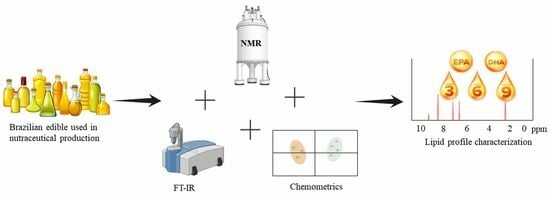
1H Nuclear Magnetic Resonance, Infrared, and Chemometrics in Lipid Analysis of Brazilian Edible-Oil-Based Nutraceuticals

by
Igor S. Flores
1,
Daniel L. R. Annunciação
2,
Vinícius S. Pinto
3,4,* and
Luciano M. Lião
4,*
1
Instituto Federal de Goiás, Inhumas 75400-000, GO, Brazil
2
Instituto Federal de Goiás, Luziânia 72811-580, GO, Brazil
3
Instituto Federal de Goiás, Formosa 73813-816, GO, Brazil
4
LabRMN, Instituto de Química, Universidade Federal de Goiás, Goiânia 74690-900, GO, Brazil
*
Authors to whom correspondence should be addressed.
Lipidology 2024, 1(1), 18-29; https://doi.org/10.3390/lipidology1010003
Submission received: 9 February 2024 / Revised: 24 March 2024 / Accepted: 25 March 2024 / Published: 2 April 2024
(This article belongs to the Special Issue Technologies and Quality Control of Lipid-Based Foods)

Abstract

:
Edible oils have commercial and nutritional value due to the presence of essential fatty acids. They can be consumed fresh in the form of capsules known as nutraceuticals. The quality of such products is of interest to the consumer. In this context, this study describes a method based on high-resolution nuclear magnetic resonance (NMR) and Fourier-transform mid-infrared spectroscopic analysis (FTIR), combined with statistical analyses, to differentiate different edible oils used as nutraceuticals in Brazil by fatty acid content. Through the analysis of 1H NMR spectra, the levels of saturated and unsaturated fatty acids in edible oils were characterized and quantified. Statistical analysis of the data confirmed the real distinctions between nutraceutical raw materials, with emphasis on ω-9, ω-6, and ω-3 fatty acids. The analytical approach presented also demonstrates the potential to identify the origin (animal or vegetable) of edible oils used as nutraceuticals.

Graphical Abstract

1. Introduction

The idea of consuming “healthy fats” is increasingly widespread in today’s society. This terminology refers to food matrices rich in unsaturated fatty acids, which are essential nutrients as they are not synthesized in the human body. The ingestion of these substances is necessary so that vital biological activities, such as cell signaling processes, membrane structuring, and substance transport, can be carried out properly. Edible oils occupy a central place in the context presented [1].
Vegetable and animal oils are widely used directly or indirectly in the human diet, whether in the preparation of homemade food (e.g., fried and roasted foods) and/or as raw materials in the processing industry [2,3]. Another way of consuming edible oils is in their encapsulated form, which is commonly sold in pharmacies and is labeled nutraceutical [4]. This term introduces the idea of foods with concomitant therapeutic and nutritional activities [5].
The high commercial and nutritional value of nutraceuticals based on edible vegetable and animal oils is closely related to their lipid composition, marked by the presence of triacylglycerides (TAG), which contain saturated (SFA), monounsaturated (MUFA), and polyunsaturated (PUFAs) fatty acids in their structures [6]. Because they are of natural origin, nutraceuticals are considered safe for human consumption, but as their acquisition sometimes does not require medical approval, it is necessary to evaluate the compositional quality of this type of product.
A wide variety of nutraceuticals based on edible oils can be found in Brazil. The most common oils are soybean (Glycine max), sunflower (Helianthus annuus), garlic (Allium sativum), corn (Zea mays), almond (Prunus dulcis), andiroba (Carapa guianensis), safflower (Carthamus tinctorius), Brazil nut (Bertholletia excelsa), coconut (Cocos nucifera), linseed (Linum usitatissimum), evening primrose (Oenothera biennis), borage (Borago officinalis), chia (Salvia hispanica), and palm oil (Elaeis guineensis) [6]. Nutraceuticals formulated from fish oils, known to be rich in PUFAs, are also common [6,7,8].
The number of nutraceuticals available has grown steadily, reflecting market developments, research, and consumer interest. However, they are often met with skepticism due to efficacy and safety concerns, in part due to the well-documented lack of regulation and oversight in the sector [5]. In this context, studies regarding the composition of the different raw materials used in the production of nutraceuticals converge to determine the quality of the product in question.
Classically, the quality of edible oils used in nutraceutical manufacturing is evaluated by moisture, refraction index, viscosity, acidity, peroxide, iodine index, and saponification [3,9,10]. Although they are analytically robust and easy to perform, these conventional methods are time-consuming and only allow for the simultaneous analysis of a few classes of compounds. On the other hand, modern analytical instrumentation, especially chromatographic and spectroscopic techniques, is more accurate and informative in evaluating the complex chemical profiles of these oils [2,11,12,13]. Among the spectroscopic techniques, nuclear magnetic resonance (NMR) and medium infrared with Fourier-transform (FTIR) stand out in this analytical context. These methods allow for the simultaneous collection of qualitative and quantitative chemical information without quantification standards, common in chromatographic analysis routines [14,15,16].
The non-selective and highly reproductive nature of the NMR allows for the collection of molecular fingerprints without the need for elaborate separation methods. The NMR, as a result of the direct relationship between the signal area and the number of nuclei responsible for that signal, allows for the quantification of many compounds in complex matrices concomitant with qualitative analysis, which leads to a reduction in sample handling and exposure time [14,16,17,18,19]. Consequently, NMR can be applied in assessing the quality of edible oils, since such investigations are based on the lipid composition and its relationship with the physicochemical and organoleptic characteristics of the matrix.
A suitable quantitative approach using NMR allows for the simultaneous collection of information about the chemical profile of the edible oil and about the contents of such components. This fact, for an analytical context of edible oils, represents a significant advantage, since the time of exposure and manipulation of the sample can determine the onset of unwanted reactions such as lipid oxidation [16]. Quantification by NMR (qNMR) is possible due to the direct proportion between the intensity of a signal and the number of nuclei responsible for that signal. This information is translated by integrating the analyte NMR signal. Thus, the higher the concentration of a given substance, the greater the number of nuclei responsible for that signal and, therefore, the greater the area of the signal [19,20]. Commonly, quantification via NMR requires the use of internal standards that are inserted directly into the solution containing the analyte [19]. However, the choice of a quantification standard must meet requirements such as purity; chemical inertness towards the sample components; low volatility; solubility similar to the analyte; and, in the particular case of NMR, suitable relaxation times (which must be adequate to the time available for analyses) and chemical structures, to avoid overlapping of standard x analyte signals [17,19]. Alternatively, Akoka et al. developed a computational protocol called Electronic Reference to access In-Vivo Concentration (ERETIC), which consists of electronically synthesized reference signals from calibration experiments with known concentration solutions [20]. Such “synthetic” signals can be inserted into any region of the sample spectrum, thus eliminating the possible effects of analyte versus internal standard interaction and signal overlap [19,20,21,22].
The use of NMR in studies of complex matrices (e.g., edible oils) generates a range of information that may not be readily interpretable. The simple comparative method may not recognize the grouping or separation tendencies between samples caused by possible processing errors or tampering [14,15,23]. In this context, chemometric treatment of the NMR and FTIR data can help to identify and quantify potential authenticity biomarkers. The main chemometric protocols used in the aforementioned analytical approaches refer to exploratory analysis via Principal Component Analysis (PCA) and Hierarchical Class Analysis (HCA) [24]. In PCA, the multivariate dataset is projected into a new space with a reduced statistical dimension, with minimal damage to sample relationships. The new dimension, expressed by new variables called principal components (PCs), aims to highlight clustering or separation trends not previously identified in the spectra [18,25]. HCA, on the other hand, is a hierarchical process in which the reduction of the data matrix results in a two-dimensional dendrogram that emphasizes the clusters of samples by similarity. Thus, it is understood that neighboring samples are statistically and chemically similar. In contrast, distant samples, even from the same matrix, may indicate possible tampering processes, since they were classified as statistically and chemically distinct [19,26,27,28].
In the context presented, our study describes an analytical protocol based on the synergy between 1H NMR and FTIR applied in the analysis of Brazilian edible-oil-based nutraceuticals. The data, derived from the investigation of different matrices of edible oils, were submitted to unsupervised chemometric analyses that allowed for the distinction between the types of oils. The discrimination between them indicated the existence of different contents of saturated and unsaturated fatty acids, and this observation motivated the relative quantification of the cited fatty acids.

2. Materials and Methods

2.1. Sample Collection

The sampling consisted of pure edible oils used as raw materials for the manufacture of nutraceuticals supplied by Brazilian industries located in the cities of Goiânia and Anápolis, state of Goiás. Triplicates of oils from garlic (Allium sativum), almonds (Prunus dulcis), andiroba (Carapa guianensis), sunflower (Helianthus annuus), safflower (Carthamus tinctorius), Brazil nut (Bertholletia excelsa), palm (Elaeis guineensis), coconut (Cocos nucifera), linseed (Linum usitatissimum), evening primrose (Oenothera biennis), chia (Salvia hispanica), soybean (Glycine max), and fish oils were obtained, both pure and in mixtures. The samples were transported in small opaque and sealed bottles provided by the companies. The entire sample was stored in the NMR laboratory of the Chemistry Institute of the Federal University of Goiás under low light conditions and at room temperature until the moment of analysis.

2.2. 1H NMR Experiments

For each 1H NMR analysis, 100 μL of the oil sample was solubilized in 400 μL of deuterated chloroform (CDCl3). The NMR spectra were acquired on a Bruker Avance III 500 spectrometer (Bruker, Ettlingen, Germany) operating at 11.75 Tesla, fitted with a three-channel broadband inverse (TBI) probe. The 1H NMR experiments were performed in triplicates, with an accumulation of 256 spectra, 65,536 scanning points during acquisition and processing, a total acquisition time of 7.1 s, a spectral width of 16 ppm, receiver gain fixed at 11.3, and a constant temperature of 25 °C during acquisition. A zg30 pulse sequence (Bruker) was used, with automatic pulse calibration and magnetic field homogeneity (shimming). An exponential correction factor was applied in processing to broaden the spectral line of 0.3 Hz. Baselines and phases were automatically corrected in the TopSpin working software (v 3.5, Bruker, Germany). All NMR spectra were given in ppm related to the TMS signal used as an internal reference at δ 0.00.

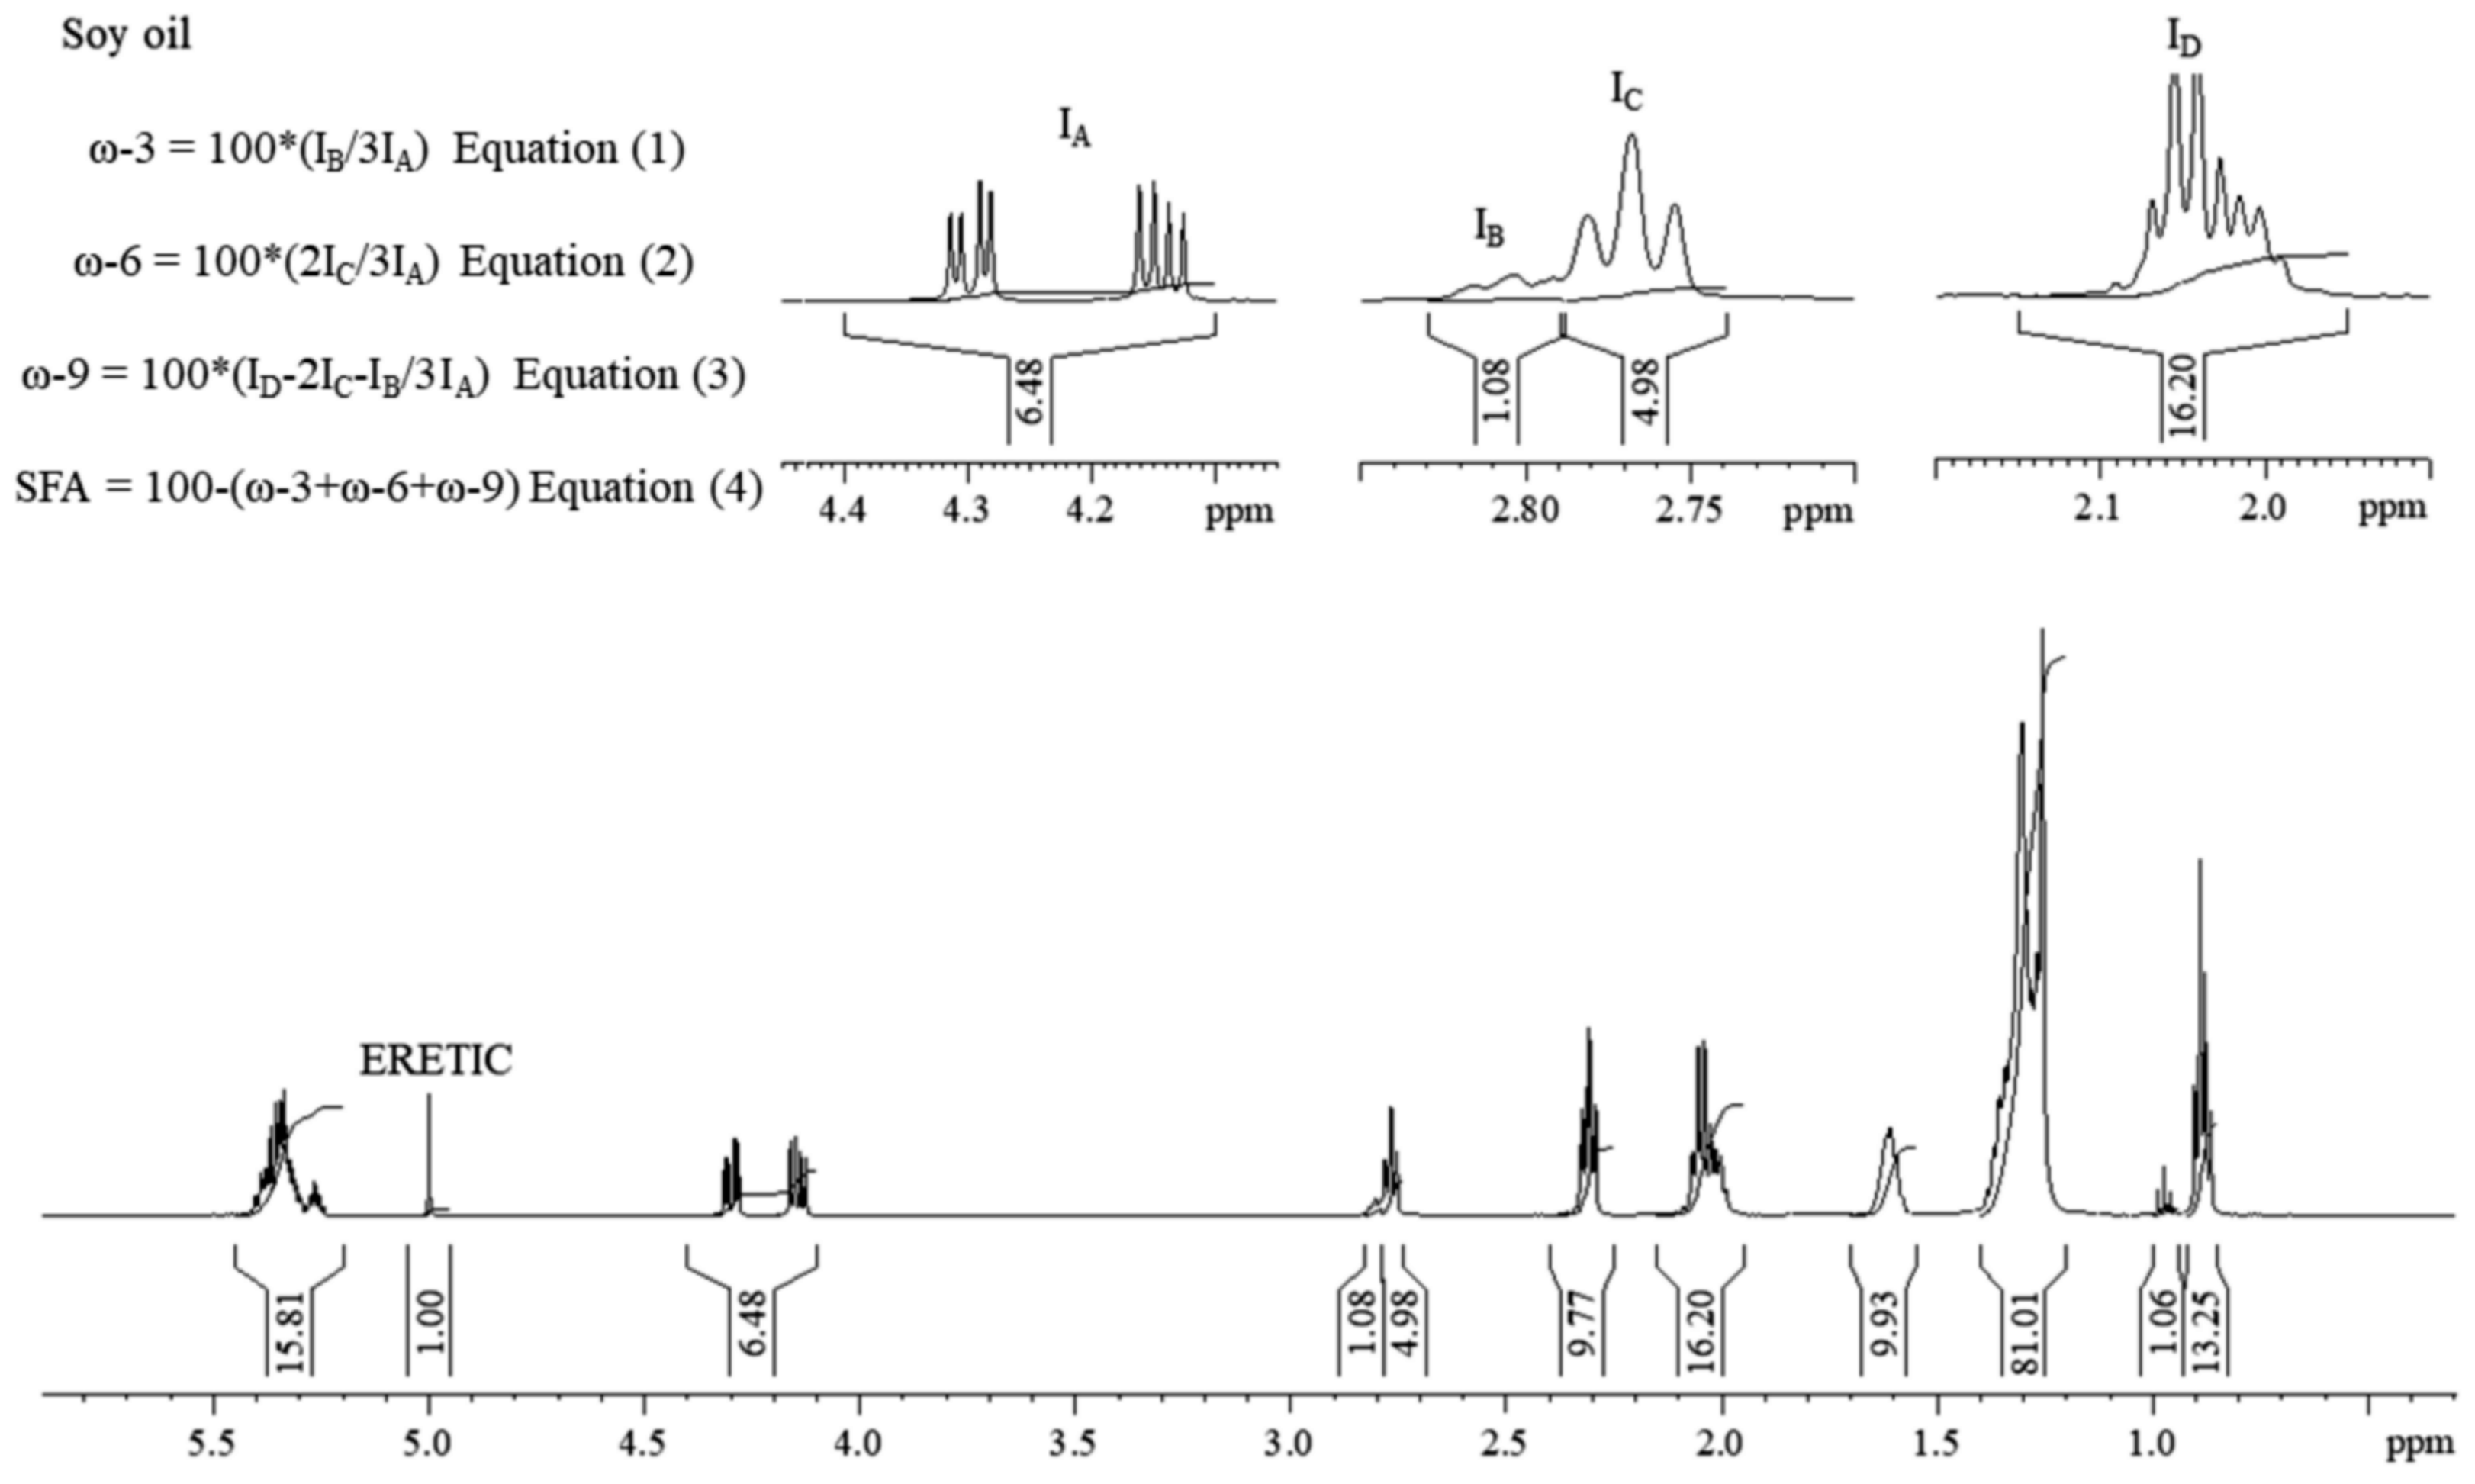
2.3. ERETIC Signal Calibration

The lipid composition of the oils was determined by relativizing the analyte signals versus the ERETIC signal. Therefore, it was necessary to calibrate the ERETIC signal by acquiring a 1H NMR spectrum under quantitative conditions using a standard solution of known concentration. A 2.0 mmol·L−1 caffeine solution in CDCl3 was used as a calibration standard. The spectral acquisition and processing parameters strictly followed the experimental protocol of the 1H NMR experiments.

2.4. Fourier-Transform Infrared Spectroscopy (FTIR)

A Fourier-transform infrared spectrometer (PerkinElmer, Waltham, MA, USA) was used to measure the FTIR spectrum of all of the edible oils. Each spectrum was collected in the wavelength range between 4000 and 400 cm−1, with 12 interferograms each with a resolution of 2 cm−1. Each measurement was initiated by scanning an air background (blank) and then placing KBr pellets containing 10 μL of oil sample on its surface. All analyses were carried out at 25 °C. All samples were analyzed in triplicate and measured at room temperature (25 °C) under identical conditions.

2.5. Exploratory Analysis by PCA and HCA

Data analysis by PCA was performed using AMIX 3.9.15 software (Bruker BioSpin, Ettlingen, Germany). The data matrix was obtained by the spectral bucketing procedure of the 1H NMR data, using the rectangular shape and optimized width of 0.05 ppm. The spectral regions referring to the residual signals of the non-deuterated solvent at δ 7.0–7.5 (CHCl3) and the TMS at δ −0.3–0.3 were excluded from the data matrix. The PCA was performed with a mean-centered data matrix and a 95.0% confidence interval and validated with the full-cross validation method. PCA was applied for exploratory data analysis purposes. Seven principal components (PCs) were used, explaining an accumulated variance of 98.2%. PC1 and PC2 were used to construct the score and loadings graphs. The method helped to recognize trends in the separation of edible oils and the main chemical groups related to their lipid composition.
The HCA was performed from the data matrix constructed with each oil sample’s average FTIR spectral data. The nearest neighbor method that was used to create the clusters and their correlations as the type of distance was also used to construct the dendrogram. HCA was applied for exploratory data analysis purposes and to verify the possibility of the FTIR technique, widely used in the industry, providing data similar to data from PCA.

3. Results and Discussion

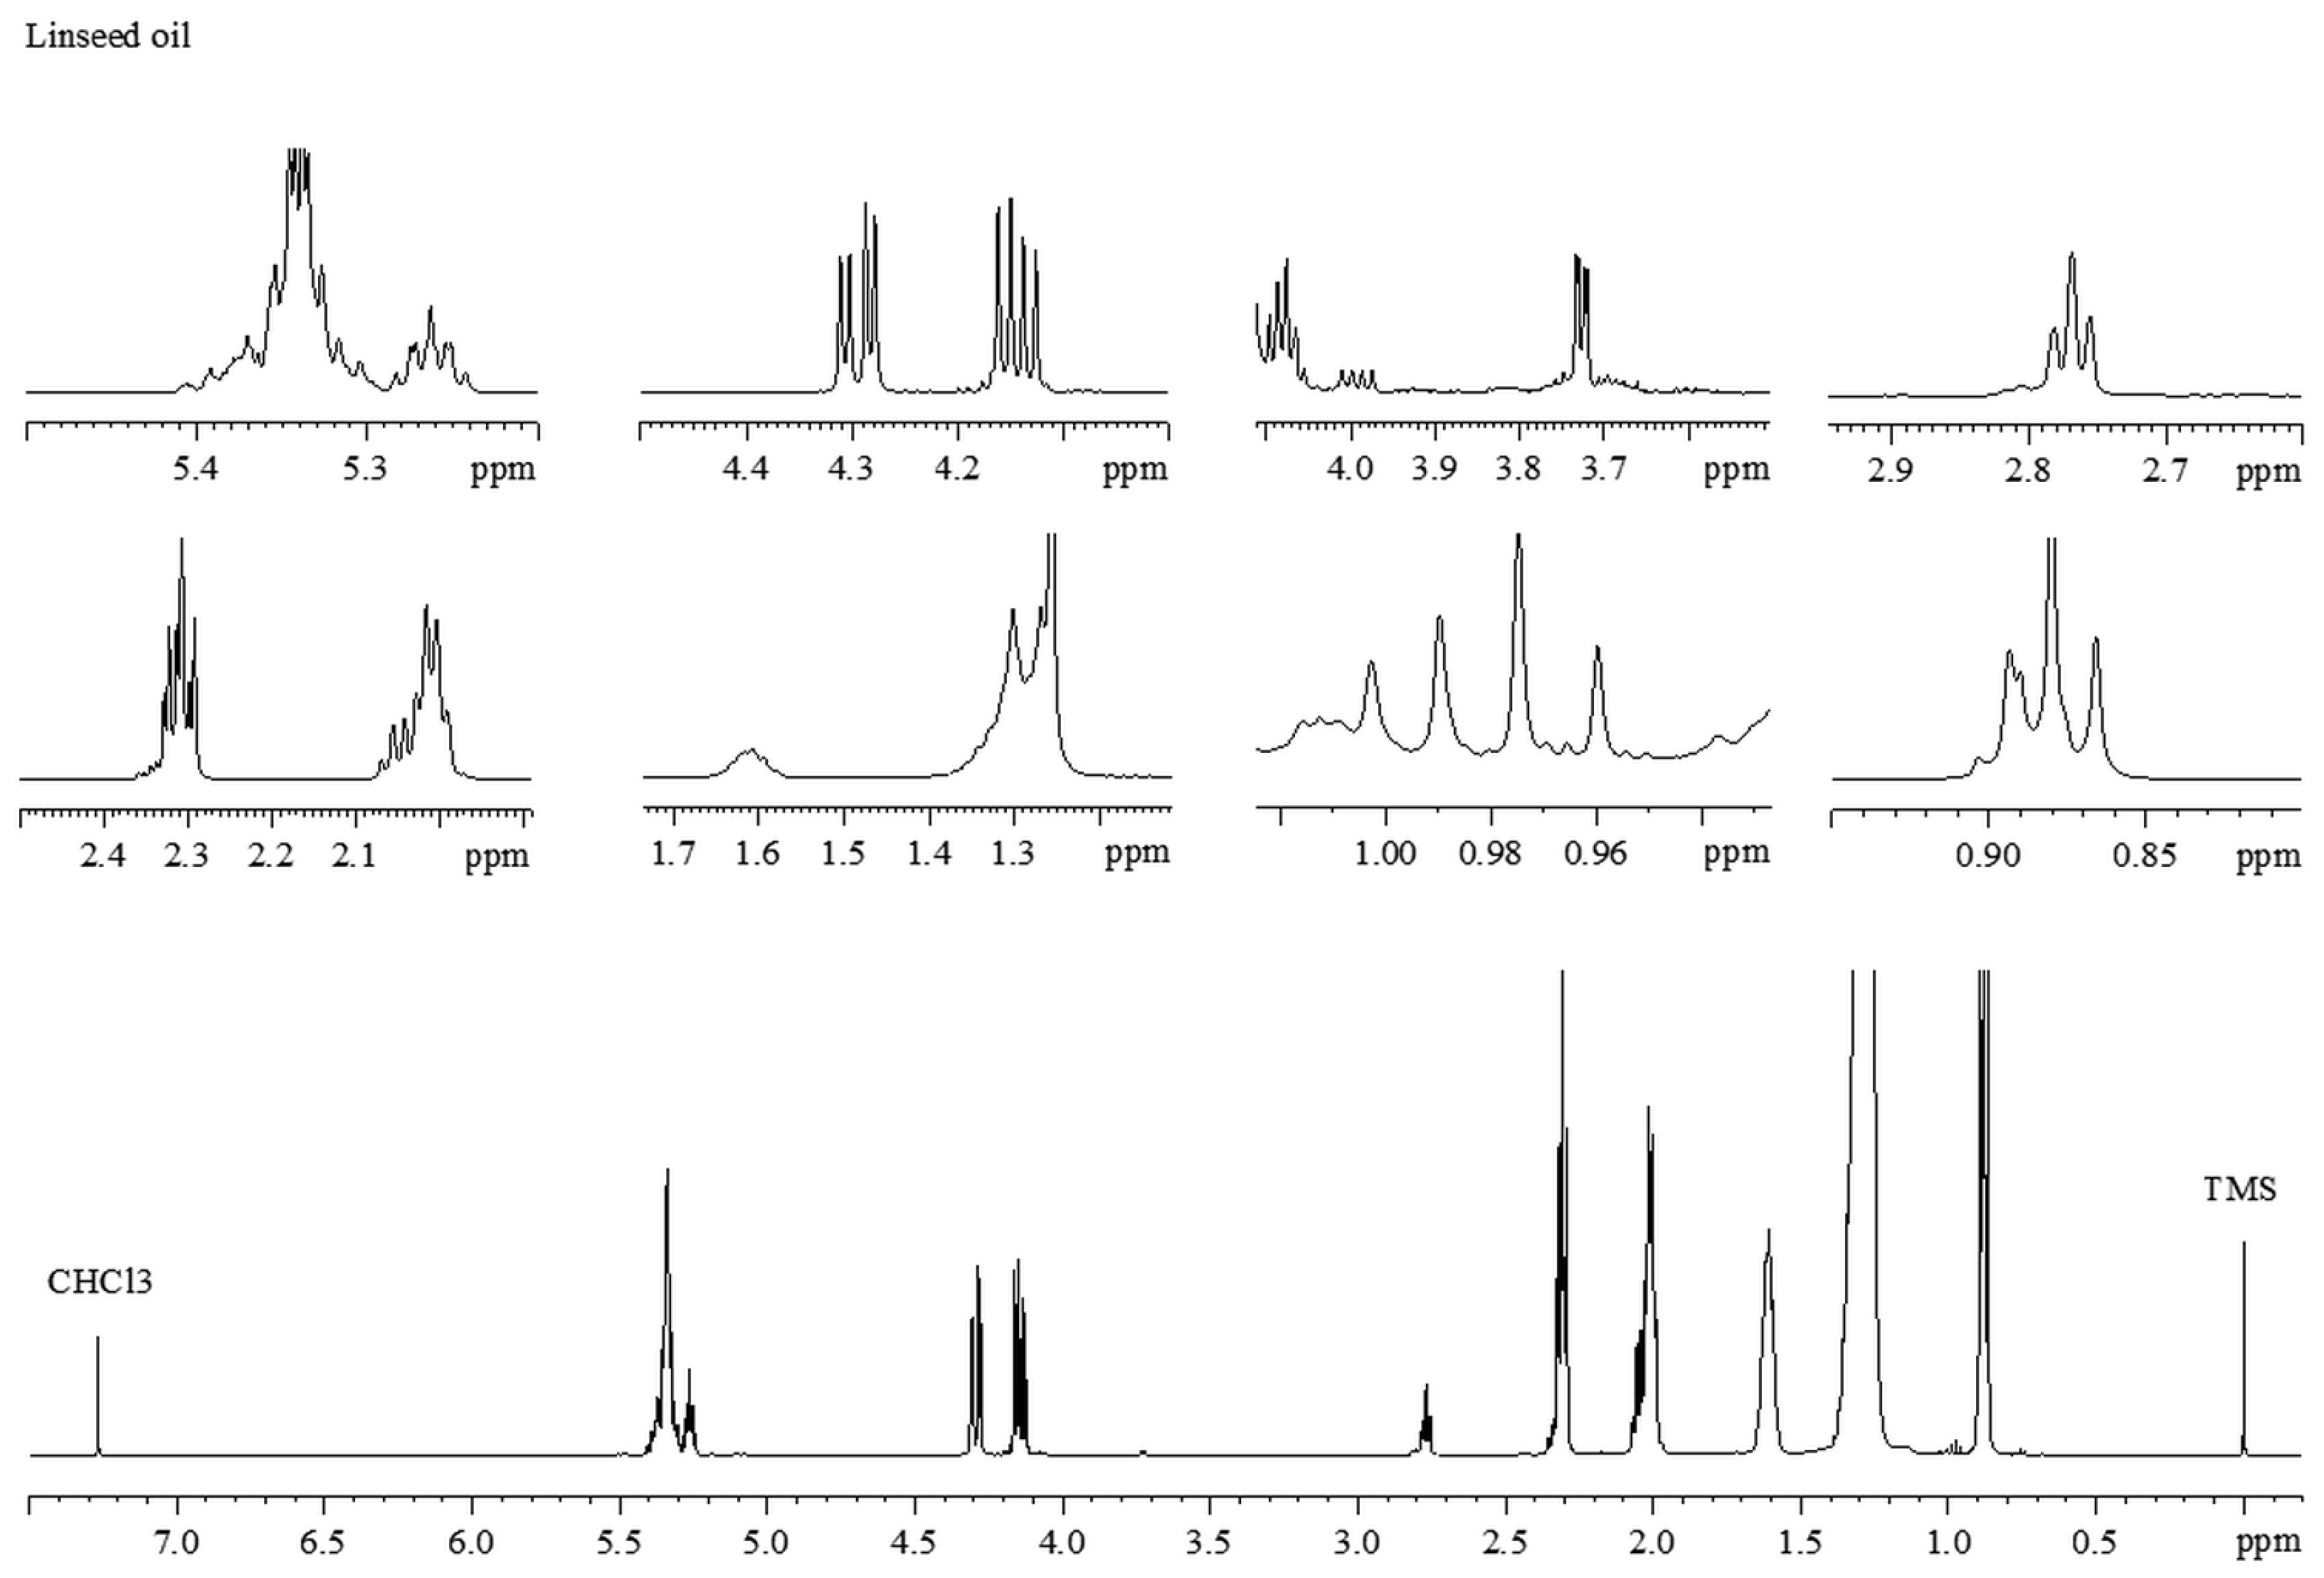
3.1. Characterization of Lipid Profile by 1H NMR

Figure 1 shows the 1H NMR spectrum of a flaxseed oil sample. The spectrum showed regions with broad signals, reflecting the cause-and-effect relationship between the low mobility of lipids in solution and the consequent short spin–spin relaxation times [29]. This peculiarity of lipid analysis by NMR was described in detail by Salinero et al., who compared the resolution of signals similar to those described in the present manuscript in spectrometers operating at 300 and 750 MHz for the 1H nucleus [30]. Due to the greater intensity of the applied field (750 MHz), the authors obtained signals with higher resolutions than the spectra obtained at 300 MHz and, consequently, the results presented in the present manuscript. The spectral characterization was carried out based on the literature [6,14,15,16,28,29,30,31,32].
In the regions of δ 0.87 and 0.89, two triplets of medium intensity were observed, which were attributed to the set of terminal methyl hydrogens of SFA, oleic acid (MUFA ω-9), and linoleic acid (PUFA ω-6). Due to the similarity among the chemical environments of the hydrogens of the terminal methyl groups, the very short spin–spin relaxation times characteristic of hydrogens of lipid molecules, and, possibly, the high concentration used in preparing the solutions, partial overlap of the triplets was observed [29]. The α-linolenic fatty acid, an essential PUFA for humans that is commonly associated with the benefits of nutraceutical intake, was characterized by a triplet with good resolution at δ 0.97. This fatty acid is important because it is a precursor to long-chain polyunsaturated fatty acids that are used in structuring cells, for example [1]. At δ 1.20–1.40, an intense signal was observed, which was attributed to the set of methylene hydrogens present in SFA, MUFAs, and PUFAs. The methylene hydrogens of –CH2–CH2–OCOH-type acyl fragments present in PUFAs, except for docosahexaenoic acid (DHA), eicosapentaenoic acid (EPA), and arachidonic acid (ARA) molecules, were characterized by a low-resolution signal in the range of δ 1.55–1.65. The β-carbonyl allylic hydrogens of PUFAs, except DHA, were characterized by a broad, low-resolution signal at δ 1.95–2.10. At δ 2.25 and 2.33, two triplets were identified as referring to the methylene hydrogens present in the –CH2–OCO-type acyl fragments. At δ 2.43, a double doublet was observed, which was associated with the methylene hydrogens of acyl fragments of the –CH2–OCO type of DHA, another ω-3 PUFA that confers quality to the nutraceutical, as this fatty acid has a vasodilatory action with a consequent reduction in the risk of coronary artery diseases [2]. In the range of δ 2.70–2.84, two triplets were identified that were attributed to the bis-allylic methylene hydrogens (–CH=CH–CH2–CH=CH–) of PUFAs ω-3 and 6. Again, as a result and due to the factors mentioned above, the signals in question overlapped. The hydrogens of the –CH2–OH– and –CH–OH-type fragments of diglycerides (DAG) were characterized by the presence of a doublet of doublets at δ 3.73 and a multiplet at δ 4.07, respectively. The tri-esterified form of glycerol, called triacylglycerol, was characterized by signals at δ 4.14 and 4.30, referring to the methylene hydrogens of the –CH2–OCOR– fragments and by a signal at δ 5.25, attributed to the hydrogens of the group –CH–OCOR–. In the spectral region of δ 5.30–5.40, a high-intensity signal was identified, which was attributed to the vinyl hydrogens of the –CH=CH– fragments, present in the PUFAs esterified to TAG. A summary of all of the information described is organized in Table 1.
Pinto et al., when studying the oxidative thermostability of palm oils via high-resolution NMR, described chemical profiles highly similar to those described in the present manuscript. Furthermore, the authors also characterized signs associated with the formation of oxidation products (e.g., unsaturated aldehydes and alkadienes) that can occur in improperly stored nutraceutical capsules and which pose risks to the health of the consumer [16]. The applicability of NMR in the study of edible oils goes beyond compound identification and compositional description. Armed with such information, Pospecu et al. used 1H and 13C NMR to determine the botanical and geographic origin of several oils and oil mixtures. The results, when brought into the context of the present manuscript, may indicate the usefulness of the NMR technique in verifying the authenticity of nutraceuticals based on oils declared to be Brazilian [33].

3.2. Statistical Analysis

Due to the extreme visual similarity between the 1H NMR spectra, previous exploratory analysis by PCA was performed to verify if the samples of edible-oil-based nutraceuticals could be statistically differentiated. The PC1 × PC2 score chart indicated clear discrimination tendencies between the samples (Figure 2A) with the positive sense of PC1, the statistical region responsible for discriminating among the most significant number of samples. In contrast, the negative PC1 discriminated against the soy, linseed, and chia samples. The accumulated variance explained by the first two components used in the construction of the graph was 86.9%.
Analyzing the PCA loadings (Figure 2B), the principal chemical descriptors responsible for discriminating among the samples presented in the score plot were identified. The positive scores of PC1, the statistical region wherein most of the sampling was discriminated, were strongly influenced by the signals of hydrogens with chemical shifts at δ 0.88, assigned to the hydrogens of terminal methyl groups of oleic (ω-9) and SFAs. On the other hand, the trend observed, along with the negative PC1 scores which showed the statistical region populated by soybean, linseed, and chia samples, was strongly influenced by the signals at δ 5.38, 2.83, 2.08, and 0.98, assigned to vinylic, allylic, bis-allylic, and terminal methyl hydrogens of α-linolenic acid (ω-3), respectively.
Extrapolating the results from PCA, we can infer that the distinction between the oil-based nutraceutical samples was strongly influenced by the different contents of MUFAs (ω-9) and PUFAs (ω-6 and ω-3), in addition to signals attributed to SFAs. Therefore, an adaptation between the equations described by Miyake et al. (1998) and the ERETIC method to calculate the relative percentages of lipid descriptors (SFA, ω-9, ω-6, and ω-3) indicated PCA discriminators for each nutraceutical sample evaluated in the present study [34]. It is worth noting that the application of NMR in the quantification of fatty acids relies on other protocols, such as those described by Martinez-Yusta et al. (2014) and Santos et al. (2018) [5,35]. The equations used in the aforementioned calculations, as well as the integrations of the signal areas, are shown in Figure 3.
Table 2 presents the results of the quantifications for each type of sample. Analyzing the percentages of ω-9 fatty acids and SFAs of the different matrices, it was found that nutraceuticals based on coconut, palm, andiroba, Brazil nut, and safflower oils, previously divided into positive PC1 scores (Figure 2A), had low percentages of ω-3 fatty acids. On the other hand, these samples showed the highest levels of SFAs and ω-9 fatty acids. This information is consistent with the analysis of PCA loadings (Figure 2B), which indicated the signal in δ 0.88 as the main descriptor for the region, previously assigned to terminal methyl groups of SFAs and ω-9 fatty acids.
The matrices with the highest percentages of ω-3 acids were the samples of chia and linseed. These samples were broken down into negative PC1 scores, as shown in Figure 2A. Again, the descriptors (δ 5.38, 2.83, 2.08, and 0.98) indicated in the loading plot (Figure 2B), previously assigned to hydrogens of the α-linolenic acid (ω-3) and other unsaturated chemical groups, support the observation. The large group in the center of the graph in Figure 2A, composed of nutraceuticals based on sunflower, fish, soy, primrose, garlic, copaiba, and almond oil samples, showed intermediary levels of saturated and unsaturated fatty acids when compared with the other samples. No apparent correlation between the percentages of saturated and unsaturated fatty acids and the descriptors indicated in the loading graph was observed for the large group of samples centered on the PCA score graph (Figure 2A). The present results converge with what was exposed by Siudem et al., who described in their review several quantitative applications of NMR for the detailed determination of the lipid compositions of vegetable oils. The authors, in addition to a detailed characterization of the main chemical groups present in lipids of plant origin, described equations similar to those applied in the present work which are easily extrapolated to the study of nutraceuticals based on edible oils, whether of plant or animal origin or mixtures. Such applications can also be used to evaluate the real quality of a nutraceutical in terms of amounts of PUFAs (ω-3, 6, and 9) as well as their adequate proportions [36]. For comparative analytical purposes in relation to the results from the NMR–PCA model presented, the profiles of oil-based nutraceuticals were also evaluated via the FTIR technique, which is recognized as more accessible for the industry. Figure 4 shows the score plot for PC1 × PC2, with accumulated variance explained by the first two components equal to 72.5%.
The data dispersion was similar to that obtained by the ¹H NMR data. Along the positive PC1 scores, safflower, palm, garlic, andiroba, and copaiba samples were discriminated, and the statistical region was strongly influenced by signals with wave numbers equal to 1417 cm−1 (C=CH), 1654 cm−1 (C=C), and 967 cm−1 (HC=CH). These signals are characteristic of absorptions (folding and stretching) of PUFAs. The coconut samples were discriminated in the negative scores of PC1, influenced mainly by signals referring to the stretching of C-O and C=O bonds, typical of ω-6 and ω-9 fatty acids, highlighting again the contents of these acids that were previously determined by 1H NMR. As in the NMR analyses, chia and linseed samples were discriminated similarly. However, now they were among the negative PC2 scores, with the C=C link (ν 722 cm−1) as the main descriptor.
Regarding the similarity between the edible oils, the multivariate analysis of the FTIR data via HCA highlighted the remarkable similarity between the chia and linseed samples (Figure 5), previously identified in the PCA treatment of the NMR data. The resulting dendrogram also indicated the existence of a significant similarity between the samples of soybean, sunflower, and fish (pure and declared mixture). This similarity between the samples is the principal basis of the adulteration of fish oils, commonly practiced with these vegetable oils (soybean and sunflower) of lower market value. However, despite HCA presenting data in agreement with the PCA–NMR and PCA–FTIR models, the resulting dendrogram indicated a more remarkable similarity between copaiba and coconut oils, information not evidenced in the exploratory analyses by PCA of NMR and FTIR data.
Although NMR allows for the simultaneous obtaining of a qualitative (determination of constituents) and quantitative (relative lipid percentages) lipid screening, the FTIR technique showed concordant and rapid results, confirming analytical complementarity since similarities were observed in the discrimination of nutraceuticals by composition. Interpretation of the results can still be extrapolated in terms of clear distinctions between nutraceuticals regarding the origin of the oilseed matrices used, as well as peculiar results from the FTIR–HCA model that indicated the possibility of verifying the authenticity of the edible oils used as raw materials.

4. Conclusions

This study demonstrated that the 1H NMR data allowed for the qualitative (via signal assignment) and quantitative (via relative signal integration) determination of the lipid profiles of different Brazilian edible oils commonly used to manufacture nutraceuticals. Additionally, the chemometric treatment (PCA) of the NMR data allowed for the identification of discriminatory statistical trends between the analyzed lipid profiles. Such information was corroborated in the treatment of the data obtained by analyzing the oils using FTIR. The evaluation of PCA loadings indicated that the signals of SFAs, MUFAs (ω-9), and PUFAs (ω-6 and ω-3) showed great relevance for data dispersion. As the signal areas influence the intensities of the 1H NMR signals, the descriptors identified in the loadings were quantified, making it possible to build a database that can be used for future studies to authenticate the edible oils studied. The HCA–FTIR model evaluated the oil similarities, and it allowed for the confirmation of the significant nearness of the principal adulterants (soybean and sunflower oils) of fish oils. Notably, the analytical protocol presented here can be a promising analytical alternative for regulatory and certifying bodies, since the quality authentication of edible oils used as raw materials in the industry is a relevant issue for the economy and health of the final customer.

Author Contributions

Conceptualization, I.S.F., V.S.P. and L.M.L.; methodology, I.S.F., V.S.P. and L.M.L.; formal analysis, I.S.F., D.L.R.A. and V.S.P.; investigation, I.S.F. and V.S.P.; data curation, I.S.F., D.L.R.A. and V.S.P.; writing—I.S.F. and V.S.P.; writing—review and editing, I.S.F., V.S.P. and L.M.L.; visualization, L.M.L.; supervision, I.S.F. and L.M.L.; project administration, L.M.L.; funding acquisition, L.M.L. All authors have read and agreed to the published version of the manuscript.

Funding

No specific funding for the development of this project was approved.

Institutional Review Board Statement

Not applicable.

Informed Consent Statement

Not applicable.

Data Availability Statement

The original contributions presented in the study are included in the article, further inquiries can be directed to the corresponding authors.

Acknowledgments

This research did not receive any specific grant from funding agencies in the public, commercial, or not-for-profit sectors. However, the authors would like to thank Financiadora de Estudos e Projetos—FINEP for the acquisition and constant contributions to the maintenance of the NMR instrument. The authors also thank Fundação de Amparo à Pesquisa do Estado de Goiás—FAPEG and Conselho Nacional de Desenvolvimento Científico e Tecnológico—CNPq for the resources approved for developing other projects, which indirectly supported this work.

Conflicts of Interest

The authors declare no conflicts of interest.

References

  1. Checa, B.C.; Bedia, C.; Jaumot, J. Lipidomic data analysis: Tutorial, pratical guidelines and applications. Anal. Chim. Acta. 2015, 885, 1–6. [Google Scholar] [CrossRef]
  2. Yadav, G.G.; Manasa, V.; Murthy, H.N.; Tumaney, A.W. Chemical composition and nutraceutical characterization of Balanites roxburghii seed oil. J. Food Compos. Anal. 2023, 115, 104952. [Google Scholar] [CrossRef]
  3. Santos, M.O.; Camilo, C.J.; Macedo, J.G.F.; de Lacerda, M.N.S.; Lopes, C.M.U.; Rodrigues, A.Y.F.; da Costa, J.G.M.; Souza, M.M.A. Copaifera langsdorffii Desf.: A chemical and pharmacological review. Biocatal. Agric. Biotechnol. 2022, 39, 102262. [Google Scholar] [CrossRef]
  4. Nagy, M.M.; Wang, S.; Farag, M. Quality analysis and authentication of nutraceuticals using near IR (NIR) spectroscopy: A comprehensive review of novel trends and applications. Trends Food Sci. Technol. 2022, 123, 290–309. [Google Scholar] [CrossRef]
  5. Pandey, S.N.; Singh, G.; Semwal, B.C.; Gupta, G.; Alharbi, K.S.; Almalki, W.H.; Albratty, M.; Najmi, A.; Meraya, A.M. Therapeutic approaches of nutraceuticals in the prevention of Alzheimer’s disease. J. Food Biochem. 2022, 46, e14426. [Google Scholar] [CrossRef] [PubMed]
  6. Santos, J.S.; Escher, G.B.; Pereira, J.M.S.; Marinho, M.T.; Prado-Silva, L.; Sant’Ana, A.S.; Dutra, L.M.; Barison, A.; Granato, D. 1H NMR combined with chemometrics tools for rapid characterization of edible oils and their biological properties. Ind. Crops Prod. 2018, 116, 191–200. [Google Scholar] [CrossRef]
  7. Kozub, A.; Nicolaichuk, H.; Przykaza, K.; Tomaszewska-Gras, J.; Fornal, E. Lipidomic characteristics of three edible cold-pressed oils by LC/Q-TOF for simple quality and authenticity assurance. Food Chem. 2023, 415, 135761. [Google Scholar] [CrossRef] [PubMed]
  8. Do Nascimento, T.A.; Lopes, T.I.B.; Nazario, C.E.D.; Oliveira, S.L.; Braz, G.A. Vegetable oils: Are they true? A point of view from ATR-FTIR, 1H NMR, and regiospecific analysis by 13C NMR. Food Res. Int. 2021, 144, 110362. [Google Scholar] [CrossRef] [PubMed]
  9. Mitrea, L.; Teleky, B.-E.; Leopold, L.-F.; Nemes, S.-A.; Plamada, D.; Dulf, F.V.; Pop, I.-D.; Vodnar, D.C. The physicochemical properties of five vegetable oils exposed at high temperature for a short-time-interval. J. Food Compos. Anal. 2022, 106, 104305. [Google Scholar] [CrossRef]
  10. Jamwal, R.; Kumari, S.; Sharma, S.; Kelly, S.; Cannavan, A.; Kumar, D. Vibrational Spectroscopy Recent trends in the use of FTIR spectroscopy integrated with chemometrics for the detection of edible oil adulteration. Vib. Spectrosc. 2021, 113, 103222. [Google Scholar] [CrossRef]
  11. Galvan, D.; Tanamati, A.A.C.; Casanova, F.; Danieli, E.; Bona, E.; Killner, M.H.M. Compact low-field NMR spectroscopy and chemometrics applied to the analysis of edible oils. Food Chem. 2021, 365, 130476. [Google Scholar] [CrossRef] [PubMed]
  12. Jia, Z.; Liang, C. Molecular Dynamics and Chain Length of Edible Oil Using Low-Field Nuclear Magnetic Resonance. Molecules. 2023, 28, 197. [Google Scholar] [CrossRef] [PubMed]
  13. Mota, M.F.S.; Waktola, H.D.; Nolvachai, Y.; Marriott, P.J. Gas chromatography—Mass spectrometry for characterization, assessment of quality and authentication of seed and vegetable oils. Trends Anal. Chem. 2021, 138, 116238. [Google Scholar] [CrossRef]
  14. Gibson, M.; Percival, B.C.; Edgar, M.; Grootveld, M. Low-Field Benchtop NMR Spectroscopy for Quantification of Aldehydic Lipid Oxidation Products in Culinary Oils during Shallow Frying Episodes. Foods 2023, 12, 1254. [Google Scholar] [CrossRef] [PubMed]
  15. Cai, S.; Zhang, Y.; Xia, F.; Shen, G.; Feng, J. An expert system based on 1H NMR spectroscopy for quality evaluation and adulteration identification of edible oils. J. Food Compos. Anal. 2019, 84, 103316. [Google Scholar] [CrossRef]
  16. Pinto, V.S.; dos Anjos, M.M.; Pinto, N.S.; Liao, L.L. Analysis of thermal degradation of Brazilian palm oil by quantitative 1H NMR and chemometrics. Food Control. 2021, 130, 108406. [Google Scholar] [CrossRef]
  17. Huang, Z.-M.; Xin, J.-X.; Sun, S.-S.; Li, Y.; Wei, D.-X.; Zhu, J.; Wang, X.-L.; Wang, J.; Yao, Y.-F. Rapid Identification of Adulteration in Edible Vegetable Oils Based on Low-Field Nuclear Magnetic Resonance Relaxation Fingerprints. Foods 2021, 10, 3068. [Google Scholar] [CrossRef] [PubMed]
  18. Cui, C.; Xia, M.; Chen, J.; Shi, B.; Peng, C.; Cai, H.; Jin, L.; Hou, R. 1H NMR-based metabolomics combined with chemometrics to detect edible oil adulteration in huajiao (Zanthoxylum bungeanum Maxim.). Food Chem. 2023, 43, 136305. [Google Scholar] [CrossRef] [PubMed]
  19. Giraudeau, P. Quantitative NMR spectroscopy of complex mixture. Chem. Commun. 2023, 59, 6627–6642. [Google Scholar] [CrossRef]
  20. Akoka, S.; Barantin, L.; Trierweiler, M. Concentration measurement by proton NMR using the ERETIC method. Anal. Chem. 1999, 71, 2554–2557. [Google Scholar] [CrossRef]
  21. Saglam, M.; Paasch, N.; Horns, A.L.; Weidner, M.; Bachmann, R. 1H NMR metabolic profiling for the differentiation of fish species. Food Chem. 2023, 4, 100602. [Google Scholar] [CrossRef]
  22. Pinto, V.S.; Flores, I.S.; Ferri, P.H.; Lião, L.M. NMR Approach for Monitoring Caranha Fish Meat Alterations due to the Freezing-Thawing Cycles. Food Anal. Methods 2020, 13, 2330–2340. [Google Scholar] [CrossRef]
  23. Jin, H.; Wang, Y.; Lv, B.; Zhang, K.; Zhu, Z.; Zhao, D.; Li, C. Rapid Detection of Avocado Oil Adulteration Using Low-Field Nuclear Magnetic Resonance. Foods 2022, 11, 1134. [Google Scholar] [CrossRef] [PubMed]
  24. Kalogiouri, N.P.; Aalizadeh, R.; Dasenaki, M.E.; Thomaidis, N.S. Application of High Resolution Mass Spectrometric methods coupled with chemometric techniques in olive oil authenticity studies—A review. Anal. Chim. Acta 2020, 1134, 150–173. [Google Scholar] [CrossRef]
  25. Gunning, Y.; Taous, F.; Ghali, T.E.; Gibbon, J.D.; Wilson, E.; Brignall, R.M.; Kemsley, E.K. Mitigating instrument effects in 60 MHz 1H NMR spectroscopy for authenticity screening of edible oils. Food Chem. 2022, 370, 131333. [Google Scholar] [CrossRef] [PubMed]
  26. Dhaulaniya, A.S.; Balan, B.; Yadav, A.; Jamwal, R.; Kelly, S.; Cannavan, A.; Singh, D.K. Development of an FTIR based chemometric model for the qualitative and quantitative evaluation of cane sugar as an added sugar adulterant in apple fruit juices. Food Addit. Contam. Part A 2020, 37, 539–551. [Google Scholar] [CrossRef] [PubMed]
  27. Vieira, F.L.M.; Benedito, L.E.C.; Moreira, A.C.O.; Braga, J.W.B.; de Oliveira, A.L. Applicability of NMR in combination with chemometrics for the characterization and differentiation of oil-resin extracted from Copaifera langsdorffii and Copaifera spp. Microchem. J. 2024, 197, 109850. [Google Scholar] [CrossRef]
  28. Choze, R.; Alcantara, G.B.; Filho, E.G.A.; Silva, L.M.; Faria, J.C.; Lião, L.M. Distinction between a transgenic and a conventional common bean genotype by 1H HR-MAS NMR. Food Chem. 2013, 141, 2841–2847. [Google Scholar] [CrossRef] [PubMed]
  29. Claridge, T.D.W. High-Resolution NMR Techniques in Organic Chemistry, 3rd ed.; Elsevier: Amsterdam, The Netherlands, 2016; pp. 11–59. [Google Scholar]
  30. Salinero, C.; Feás, X.; Mansilla, J.P.; Seijas, J.A.; Vázquez-Tato, M.P.; Vela, P.; Sainz, M.J. 1H-Nuclear Magnetic Resonance Analysis of the Triacylglyceride Composition of Cold-Pressed Oil from Camellia japonica. Molecules 2012, 17, 6716–6727. [Google Scholar] [CrossRef]
  31. Kupriyanova, G.; Smirnov, M.; Mershiev, I.; Maraşli, A.; Okay, C.; Mozzhukhin, G.; Rameev, B. Comparative analysis of vegetable oils by 1H NMR in low and high magnetic fields. J. Food Compos. Anal. 2024, 126, 105877. [Google Scholar] [CrossRef]
  32. Hasanpour, M.; Rezaie, A.; Iranshahy, M.; Yousefi, M.; Saberi, S.; Iranshahi, M. 1H NMR-based metabolomics study of the lipid profile of omega-3 fatty acid supplements and some vegetable oils. J. Pharm. Biomed. Anal. 2024, 238, 115848. [Google Scholar] [CrossRef] [PubMed]
  33. Pospescu, R.; Costinel, D.; Dinca, O.R.; Marinescu, A.; Stefanescu, I.; Ionete, R.E. Discrimination of vegetable oils using NMR spectroscopy and chemometrics. Food Control. 2015, 48, 84–90. [Google Scholar] [CrossRef]
  34. Martínez-Yusta, A.; Goicoechea, E.; Guillén, M.D. Food Lipids Studied by 1H NMR Spectroscopy: Influence of Degradative Conditions and Food Lipid Nature. Compr. Rev. Food Sci. Food Saf. 2014, 13, 839–885. [Google Scholar] [CrossRef]
  35. Miyake, Y.; Yokomizo, K.; Matsuzaki, N. Determination of unsaturated fatty acid composition by high-resolution nuclear magnetic resonance spectroscopy. J. Am. Oil Chem. Soc. 1998, 75, 1091–1094. [Google Scholar] [CrossRef]
  36. Siudem, P.; Zielińska, A.; Paradowska, K. Application of 1H NMR in the study of fatty acids composition of vegetable oils. J. Pharm. Biomed. Anal. 2022, 212, 114658. [Google Scholar] [CrossRef]
Figure 1. 1H NMR spectrum of a linseed oil sample (CDCl3, 500 MHz). Highlighted expansions of spectral regions useful in the characterization of lipid profiles are presented.
Lipidology 01 00003 g001
Figure 2. Score plot (A) and loadings (B) of PC1 versus PC2 obtained from the 1H NMR data of Brazilian edible-oil-based nutraceuticals.
Lipidology 01 00003 g002
Figure 3. 1H NMR spectrum of soy-oil-based nutraceutical. The integrations of the signals of the chemical groups are presented concerning the ERETIC signal, positioned at δ 5.00 ± 0.15 of precision related to the signal’s center. Also highlighted are the expansions of the regions of interest for calculating the percentages of SFA, ω-9, ω-6, and ω-3, calculated from Equations (1)–(4), positioned in the upper left portion.
Lipidology 01 00003 g003
Figure 4. Score plot of PC1 versus PC2 obtained from the FTIR data of Brazilian edible-oil-based nutraceuticals. The main numbers of waves and chemical groups responsible for the observed discrimination are highlighted.
Lipidology 01 00003 g004
Figure 5. Resulting dendrogram from the hierarchical classes analysis of FTIR analysis of oil-based nutraceuticals.
Lipidology 01 00003 g005
Table 1. 1H NMR spectral data assignment for the relevant signals observed in the edible oil samples analyzed (CDCl3, 500 MHz).
δ 1H (ppm)Multiplicities (J Hz)GroupAssignment
0.87t (6.7)–CH3SFAs and MUFA (omega-9) acyl groups
0.89t (6.7)–CH3Linoleic acid (omega-6) acyl groups
0.97t (7.5)–CH3Omega-3 acyl groups
1.20–1.40m–(CH2)nAcyl groups of all fatty acids
1.55–1.65m–CH2–CH2–COO–PUFAs, except DHA
1.95–2.10m–CH2–CH=CH–PUFAs, except DHA
2.30t (7.5)–CH2–COO–Acyl group, except DHA
2.33t (7.5)–CH2–COO–Free fatty acids
2.43dt–CH2–COO–DHA acyl group
2.77t (6.5)=HC–CH2–CH=Bis-allylic hydrogen of omega-6 PUFAs
2.80t (6.3)=HC–CH2-CH=Bis-allylic hydrogen of omega-3 PUFAs
3.73dd (1.4, 4.9)–CH2–OH1,2-diglycerides
4.07m–CH–OH1,3-diglycerides
4.14dd (6.0, 11.8)–CH2–OCOR–Glyceryl group of TG
4.30dd (4.4,11.8)–CH2–OCOR–Glyceryl group of TG
5.26m–CHOCORGlyceryl group of TG
5.34m–CH=CH–PUFA acyl groups
Multiplicities: d—doublet, dd—doublet of doublet, m—multiplet, t—triplet, dt—doublet of triplet.
Table 2. Percentages of saturated, ω-3, ω-6, and ω-9 fatty acids by 1H NMR data of edible-oil-based nutraceutical samples used as nutraceuticals in Brazil.
Vegetable Source
SampleSFAPUFA (ω-3, %)PUFA (ω-6, %)MUFA (ω-9, %)
Almond45.3 ± 1.04.8 ± 1.510.7 ± 0.739.1 ± 0.9
Andiroba57.5 ± 0.63.4 ± 0.312.3 ± 1.126.8 ± 0.7
Brazil Nut56.0 ± 0.96.5 ± 0.312.9 ± 1.224.6 ± 1.4
Chia21.4 ± 1.148.5 ± 1.119.0 ± 0.911.1 ± 1.2
Coconut68.8 ± 0.43.7 ± 0.52.0 ± 0.230.5 ± 0.5
Copaiba39.8 ± 0.86.4 ± 0.529.6 ± 1.024.2 ± 1.1
Garlic35.4 ± 1.15.5 ± 1.015.9 ± 0.843.2 ± 1.5
Linseed19.1 ± 1.046.3 ± 1.117.9 ± 0.816.7 ± 1.3
Palm63.9 ± 1.35.1 ± 0.85.8 ± 0.625.2 ± 0.7
Primrose21.6 ± 0.550.9 ± 0.54.2 ± 0.412.8 ± 0.8
Safflower55.0 ± 0.64.2 ± 0.47.2 ± 0.933.6 ± 0.7
Soy16.9 ± 1.19.6 ± 0.341.0 ± 1.332.5 ± 1.8
Sunflower28.9 ± 0.614.3 ± 0.314.4 ± 0.742.4 ± 0.8
Animal Source
Fish (Blends)43.7 ± 0.410.1 ± 0.614.9 ± 0.731.3 ± 0.5
Fish51.4 ± 0.522.0 ± 0.513.8 ± 0.812.8 ± 0.3
Disclaimer/Publisher’s Note: The statements, opinions and data contained in all publications are solely those of the individual author(s) and contributor(s) and not of MDPI and/or the editor(s). MDPI and/or the editor(s) disclaim responsibility for any injury to people or property resulting from any ideas, methods, instructions or products referred to in the content.

