Article

Axonal Projections of Neurons in the Brainstem Mesopontine Tegmental Anesthesia Area (MPTA) That Effect Anesthesia, Enabling Pain-Free Surgery

1
Department of Cell and Developmental Biology, Silberman Institute of Life Sciences, The Hebrew University of Jerusalem, Safra Givat Ram Campus, Jerusalem 9190401, Israel
2
Center for Research on Pain, The Hebrew University of Jerusalem, Jerusalem 9190401, Israel
*
Author to whom correspondence should be addressed.
These authors contributed equally to this work.
Current address: Department of Brain Science, Weizmann Institute of Science, Rehovot 7610001, Israel.
§
Current address: Department of Molecular Cell Biology & Department of Molecular Neuroscience, Weizmann Institute of Science, Rehovot 7610001, Israel.
Current address: Department of Neurology, Beth Israel Deaconess Medical Center and Harvard Medical School, Boston, MA 02215, USA.
Anesth. Res. 2025, 2(4), 26; https://doi.org/10.3390/anesthres2040026
Submission received: 3 September 2025 / Revised: 22 October 2025 / Accepted: 5 November 2025 / Published: 24 November 2025

Abstract

Background/Objectives: Chemogenetic excitation of a distinct subset of “effector-neurons” in the brainstem mesopontine tegmental anesthesia area (MPTA) is pro-anesthetic. GABAergic general anesthetics are believed to engage these neurons by disinhibition, thereby inducing loss-of-consciousness (LOC) and enabling pain-free surgery. The transition from wakefulness to LOC, however, does not occur intrinsically within the MPTA. Rather, evidence indicates that LOC is brought about (effected) by ascending and descending axonal projections of MPTA effector-neurons that terminate in a variety of downstream brain targets which, together, generate the various components of anesthesia. Previously we used anterograde and retrograde tracing to delineate the overall axonal trajectories of MPTA projection-neurons, to which targets they project. Effector-neurons, however, represent only a fraction of this neuronal pool. Which of these targets are also innervated by MPTA projecting effector-neurons? Methods: Here we marked MPTA effector-neurons with the adeno-associated virus (AAV) used in the discovery of this neuronal type, with retrograde labelling from the previously identified MPTA target structures, to establish which downstream brain structures receive direct input from effector-neurons. Results: Effector-neurons proved to contribute to all six of the major MPTA projection-targets: the prefrontal cortex, basal forebrain, intralaminar thalamus, zona incerta, rostro-ventromedial medulla and spinal cord. Conclusions: We conclude that a discrete population of projecting effector-neurons, probably representing only about 6% of all MPTA neurons, drive the multiple functional endpoints of surgical anesthesia: analgesia, atonia, amnesia and LOC. Further, we propose that these same neurons, via their associated axonal pathways, may also contribute to endogenous instances of LOC such as natural sleep, fainting, concussion, coma and hibernation.

Graphical Abstract

1. Introduction

General anesthetic agents are small molecules that, when administered systemically, induce a reversible coma-like state. Their discovery was among the greatest of medical breakthroughs as they permit pain-free surgery. Anesthesia includes analgesia, loss-of- muscle-tone (atonia) and amnesia, coupled with loss-of-consciousness (LOC) and associated electroencephalographic (EEG) correlates. These elements normally occur together as a syndrome. The canonical explanation of anesthetic action is widespread distribution of anesthetic agents to far-flung brain regions, from the cerebral cortex to the spinal cord (SC), where they bind to transmembrane receptors, inducing broad functional suppression [1,2,3,4,5]. We refer to this as the “wet-blanket hypothesis”. An alternative model, increasingly endorsed in the research community, is that while anesthetic molecules indeed distribute globally, anesthetic action occurs by a focal action at a node(s) in neural circuitry dedicated to enabling brain-state switching. According to this model, the observed widespread functional inhibition is not due to distributed action of the agent molecules themselves, but rather to ascending and descending axonal pathways activated by these molecules [6,7,8,9]. Anesthetics co-opt circuit function by substituting for an endogenous neurotransmitter(s) [10]. A key virtue of this “dedicated pathways hypothesis” over global suppression is that it explains more parsimoniously the persistence during anesthesia of life-sustaining, housekeeping functions such as cardiovascular circulation and the regulation of blood gases. Our aim in the present study is to better define the axonal pathways that drive brain-state transitioning and LOC based on newly obtained information concerning the neurons that give rise to these pathways.
Many brain regions have been implicated in anesthetic action, among them the claustrum and parts of the cerebral cortex, a number of forebrain nuclei (the iTh, central amygdala, preoptic area, lateral habenula, supraoptic nucleus and the tuberomammilary nucleus among others) and the “reticular activating system” (RAS) in the dorsal pons [11,12,13,14,15,16,17,18,19,20]. We contributed to this issue with a systematic brain survey involving numerous tiny microinjections of pentobarbital in a 3D grid in the rat brain. This led to the discovery of a singular locus at which microinjection rapidly and reliably induces LOC together with its associated behavioural and electroencephalographic endpoints [video link at https://www.frontiersin.org/journals/molecular-neuroscience/articles/10.3389/fnmol.2023.1197304/full#supplementary-material (accessed on 3 September 2025)]. We refer to this locus as the mesopontine tegmental anesthesia area (MPTA [21]). Follow-up studies replicated this main result and in addition showed that lesions of the MPTA render rats relatively insensitive to GABAergic anesthetics delivered systemically. Interestingly, such lesions do not induce coma. This suggests that the neural computations that underlie conscious awareness itself do not play out in the MPTA, but rather in regions under its control [22,23,24,25,26,27].
The GABAA-receptor (GABAA-R) agonists GABA, muscimol and THIP, at nanomolar (nM) concentrations, a number of neurosteroids, and the clinically used GABAergic anesthetics pentobarbital and propofol, at concentrations actually present in the brain after systemic administration at anesthetic doses, are all pro-anesthetic when microinjected into the MPTA in nanoliter (nL) volumes. Such microinjections lose their anesthetic effect if delivered as little as 0.5 mm off-target [21,28,29,30]. These observations are clearly inconsistent with the global wet blanket hypothesis, which requires the anesthetic molecules themselves to reach the various functional targets at adequate concentrations. Anesthetic onset times following MPTA microinjection, seconds, are far too short for diffusion as far as the cortex and SC, and doses effective when delivered directly to the MPTA are far too small to survive dilution after entry into the bloodstream. These kinetics are consistent with the dedicated pathways hypothesis, however, as signals initiated in the MPTA can reach the cortex and SC by axonal conduction in milliseconds. As noted, drug and other manipulations at many other brain locations may influence anesthesia, but we are unaware of any other locus at which agent microinjection induces surgical anesthesia per se.
Using anterograde and retrograde tract tracing we identified the mono- and bi-synaptic pathways that ascend from the MPTA towards the cortex and those that descend towards the medulla and SC. These are the candidate pathways that effect brain-state transitioning during anesthesia. Remarkably, individual MPTA projection-neurons appear to send an axon to only one of these target nuclei, either ipsilaterally or contralaterally [31,32,33,34,35]. A next step was to identify which of the MPTA projection-neurons are responsible for effecting (bringing about) general anesthesia. This problem was solved using chemogenetics. Briefly, a specific serotype 8 adeno-associated virus (AAV8-mCherry) was microinjected into the MPTA in either excitatory or inhibitory forms. Under the human synapsin promoter (hSyn), these AAVs cause a DREADD (designer receptor exclusively activated by a designer drug [36]) to be expressed in the subpopulation of MPTA neurons that become infected by the virus. Co-expression of mCherry, a red fluorescent reporter protein, makes these neurons readily visible in follow-up histology. In the DREADD study, we reported that in vivo exposure of infected neurons to normally inert CNO (Clozapine N-Oxide) is strongly pro-anesthetic in those animals that received the excitatory (hM3D) DREADD, including both behavioural and EEG endpoints. Animals that received the inhibitory DREADD, in contrast, or no DREADD at all, were unaffected by CNO [37]. This indicates that exciting a subset of MPTA neurons that are infected by this particular AAV induces anesthesia. We refer to these neurons as MPTA “effector-neurons” as their activity brings about, effects, LOC.
Selective activation of MPTA effector-neurons radically alters the cortical EEG fingerprint, implying the presence of pathways from this neuronal population to the cerebral cortex. Likewise, MPTA effector-neurons induce analgesia and atonia, indicating functional pathways descending from the MPTA to the medulla and SC [37,38,39,40,41]. But do effector-neurons in fact send axonal projections outside of the MPTA, and if so, to which of the previously identified forebrain (ascending) or hindbrain-SC (descending) target regions? The aim of the present study was to answer these questions. The approach was to first use our AAV8-mCherry to mark MPTA effector-neurons among the overall population of projection-neurons in the MPTA, and then to use retrograde tracing from the already known targets of MPTA projection-neurons to identify double-labelled neurons (see the graphic abstract). Such neurons, mCherry-expressing effector-neurons with axonal projections to one or another of the target nuclei associated with LOC, are likely key elements of the dedicated-pathway’s circuitry that underlies anesthesia-induced LOC. In addition, they may be involved in more natural forms of LOC such as natural sleep, syncope (fainting), concussion, coma and hibernation [13,25,42,43,44].

2. Materials and Methods

2.1. Animals and Surgery

Primary data about effector-neurons were obtained from 16 adult rats, 9 of the Wistar-derived Sabra strain and 7 of the Sprague Dawley strain, of both sexes. A supplemental overview of all neuronal populations in the MPTA was obtained from 7 additional rats, all of the Sabra strain. In total, there were 9 males and 14 females. The animals were kept in a specific pathogen-free facility (SPF) with food and water available ad libidum. Lights were on from 7:00 to 19:00 (12 h:12 h light–dark cycle). The research protocol was approved by the Institutional Animal Care and Use Committee of the Life Sciences Institute, the Hebrew University of Jerusalem, and followed the guidelines of the United States Public Health Service’s Policy on Humane Care and Use of Laboratory Animals (protocol NS-21-16560, ratified 7 July 2021).
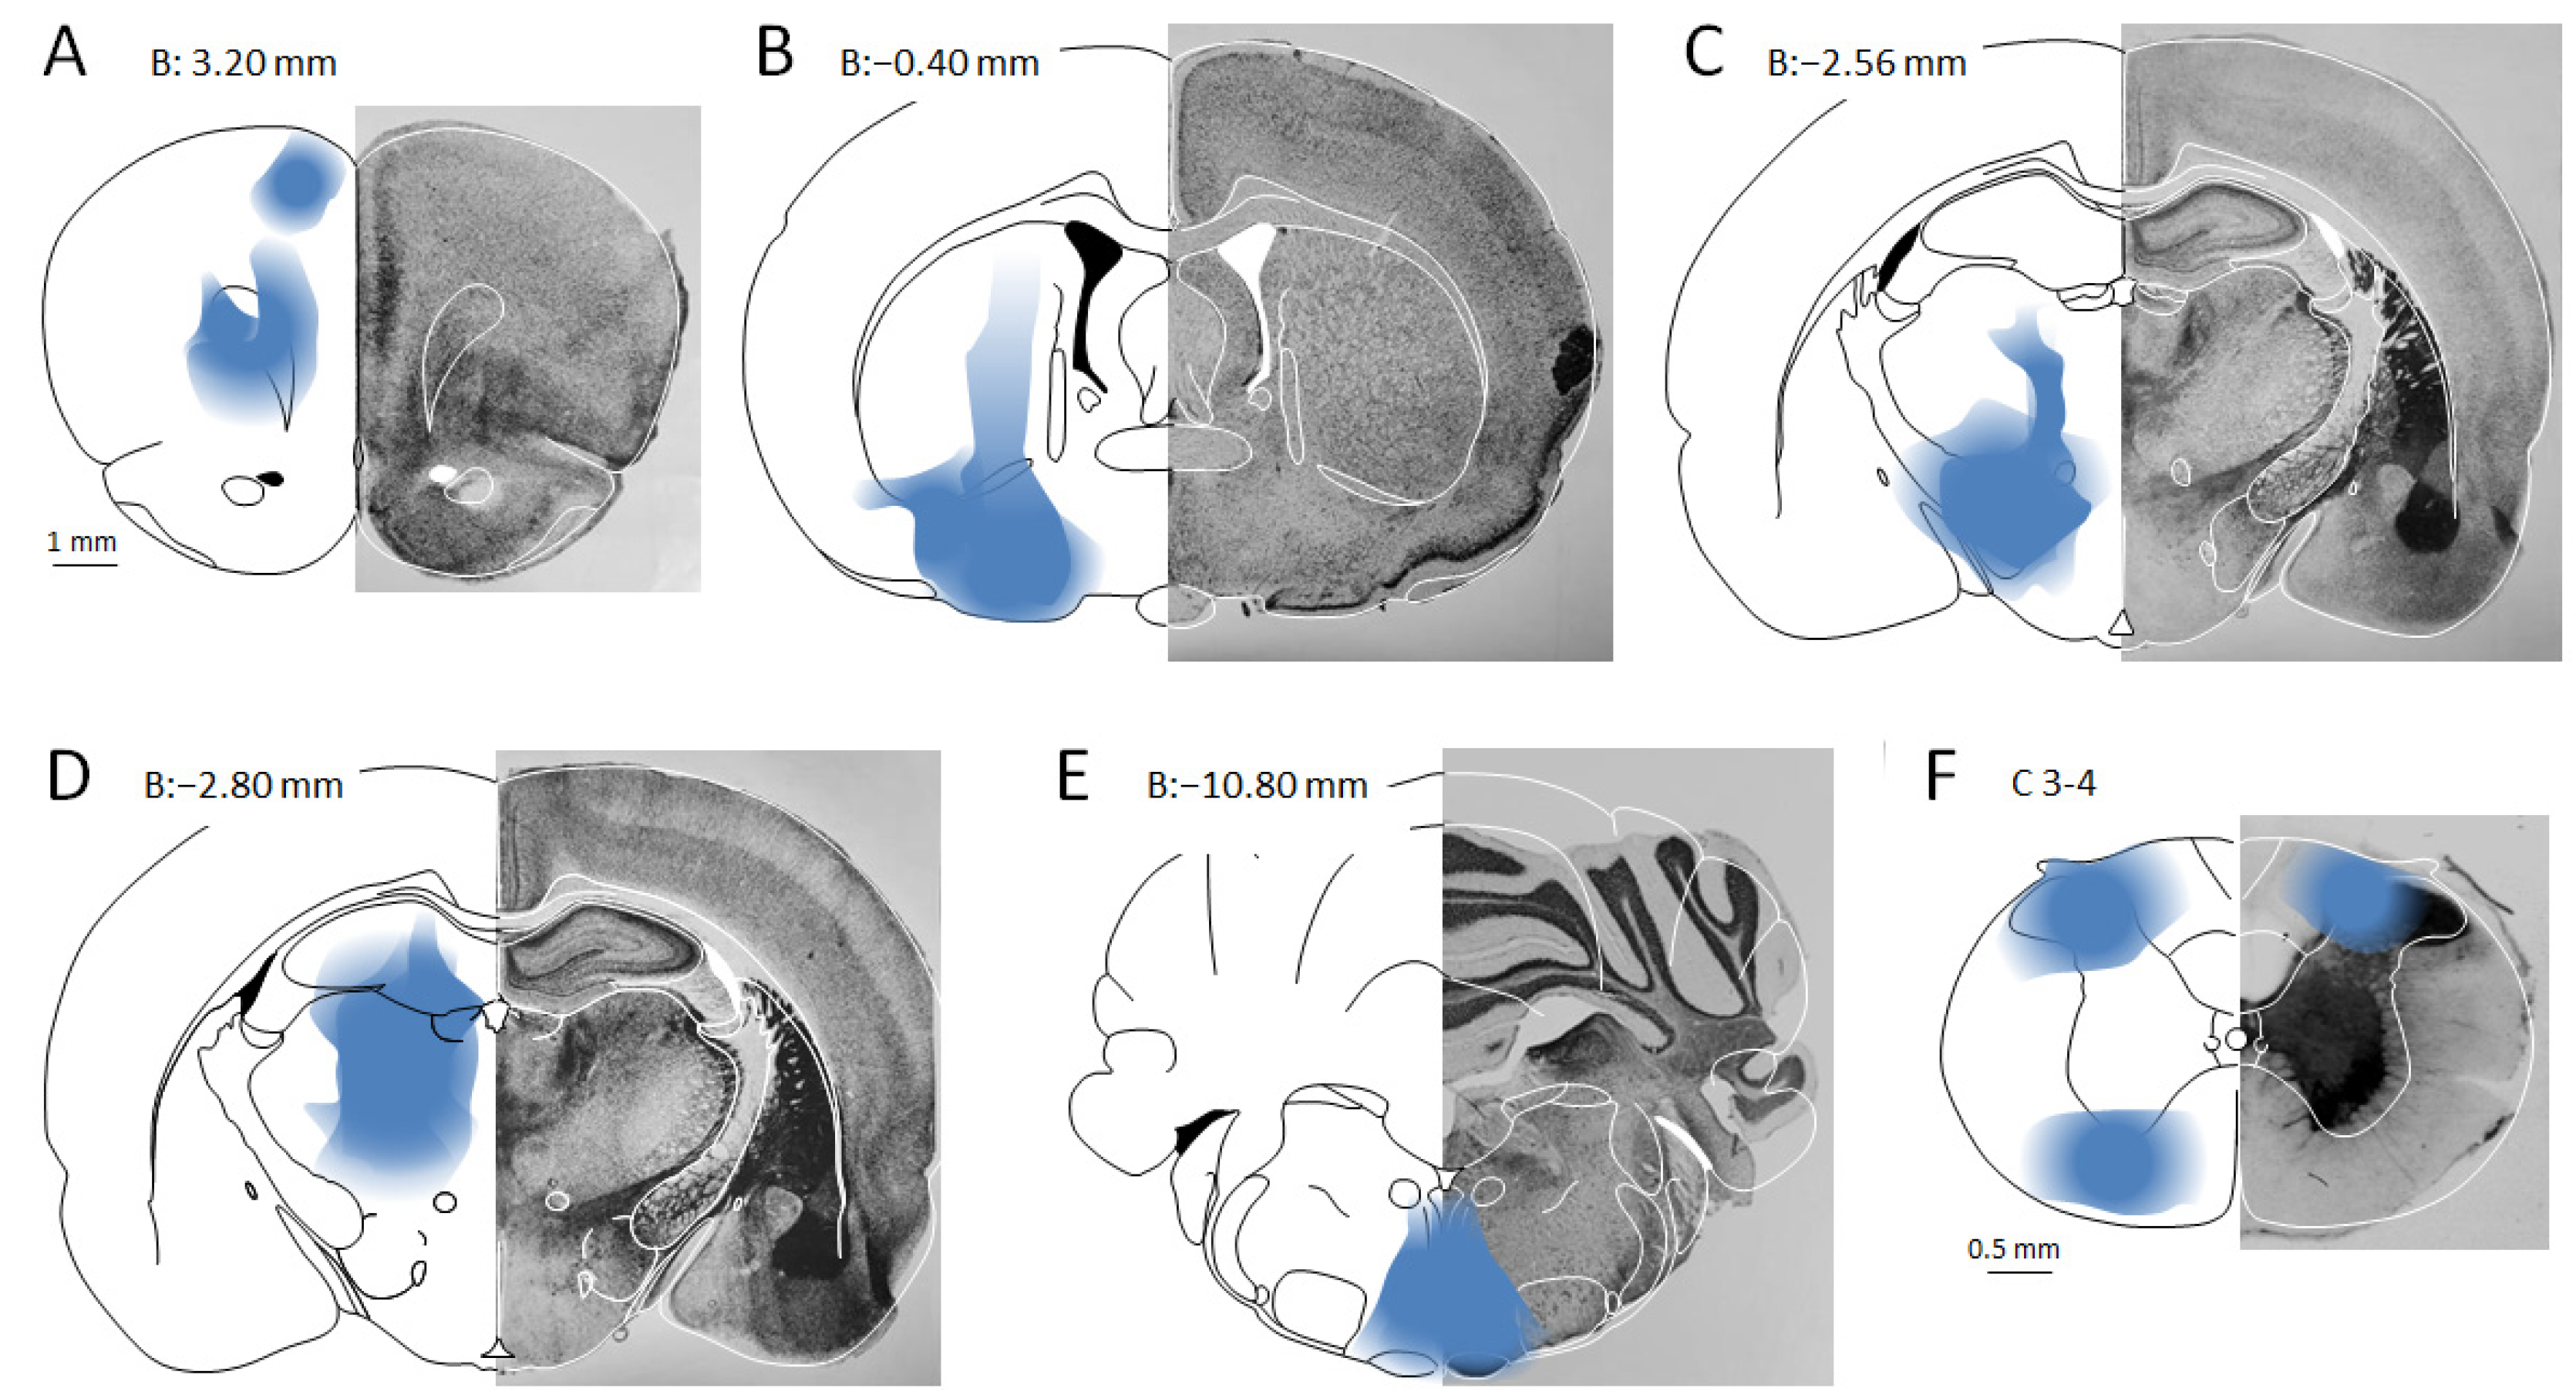
The primary rats underwent two surgical procedures in which reagents were microinjected into the brain. In the first, freshly thawed pAAV8-hSyn-hM3D-mCherry (Gq) (Addgene, Watertown, MA, USA; viral preps. RRID: Addgene_50474, ≥2 × 10¹² vg/mL), hereinafter abbreviated as AAV8-mCherry, was microinjected bilaterally into the MPTA in volumes of 50–250 nL (Figure 1). This is the AAV that we previously showed to infect and mark MPTA effector-neurons [37]. A second surgery was carried out 3–12 weeks later, after mCherry expression was well established. Here, two different retrograde tracers were microinjected, each unilaterally, into one of the six target regions of MPTA projection-neurons identified in our prior studies. In each rat, fluorogold (FG, 5% in 0.9% NaCl (saline), Fluorochrome, Denver, CO, USA, 100–200 nL) was microinjected unilaterally into one of the six target regions, and cholera toxin B subunit (CTB, 1% in saline, Sigma-Aldrich, Rehovot, Israel, product #C9903, 100–200 nL) was microinjected on the contralateral side into a different one of the six targets. The aim was to have a variety of pairwise combinations where overall, each of the MPTA targets would be assayed with both retrograde tracer types in about equal numbers across rats (Table 1). Two tracer types were used, to assess the laterality of projections and with the thought that one tracer might be superior overall, or favour a particular neuronal subpopulation. The six target regions were as follows: the prefrontal cortex (PFC, medial division), basal forebrain (BF), zona incerta (ZI), intralaminar thalamic nucleus (iTh), rostroventromedial medulla (RVM) and cervical spinal cord (SC, dorsal and ventral horn, Figure 2). Microinjection coordinates for the MPTA and for each of the six projection-targets are given in Table 1 along with the tracers delivered to each. MPTA effector-neurons were marked with the red fluorophore mCherry. Retrogradely labelled MPTA projection-neurons were marked using a green fluorophore, Alexa488 or Cy2, as noted below.
Under general anesthesia (chloral hydrate 4%, 400 mg/kg ip, Sigma-Aldrich, Rehovot, Israel), animals were mounted in a stereotaxic instrument (Benchmark Scientific, Sayreville, NJ, USA) on a warming plate. The skull was exposed, levelled between bregma and lambda, and burr holes were made bilaterally using a dental drill exposing the dura overlying the structures targeted. For delivery of AAV8-mCherry and the retrograde tracers FG or CTB, micropipettes were pulled from fine borosilicate glass tubing (inner diameter 0.5 mm, cat.# B100-50-7; Sutter Instruments; Novato, CA, USA) and tips were then broken to ~20–30 µm. Micropipettes were then filled by suctioning from the tip with the required marker or tracer, to well above the taper. Then a length of p.e.20 tubing was connected to the butt of the micropipette with the other end connected to a solenoid-driven air pressure device. AAV8-mCherry was always microinjected bilaterally. The micropipette tip was positioned above the target coordinates and then lowered to the desired depth coordinate in the MPTA. Solution was then extruded with positive pressure pulses, and the volume extruded monitored microscopically by movement of the fluid meniscus within the micropipette (200 nL/mm). After 5 min the micropipette was withdrawn and then re-inserted contralaterally to make the second MPTA microinjection. Microinjection of the retrograde tracers was carried out 3–12 weeks later following the same plan, but using two separate micropipettes, one for FG and the other for CTB.
After each surgery, the scalp incision was sutured, a topical antiseptic powder was applied (Dermatol, bismuth subgallate; Floris, Tradyon, Israel) and a prophylactic antibiotic (ampicillin 0.2 mL of 0.3 g/mL i.m.; Penibrin, Sandoz GmbH, Kundl, Austria) and a pain reliever (Tramal, 20 mg/kg i.p.; 50 ng/mL; Grunenthal, Aachen, Germany) were given. Postoperatively, animals were placed in individual heated cages. After awakening they were returned to the SPF facility and 2–3 days later they were returned to group cages.

2.2. Histology

2.2.1. Immunolabelling

A few (3–5) days after tracer microinjections had been given rats were overdosed with anesthetic and perfused transcardially with saline followed by 10% neutral 0.1 M PO4-buffered formalin (Sigma-Aldrich; St. Louis, MO, USA; cat.# HT501320; pH 7.3, both 37 °C). Heads were kept in the same formalin solution overnight (4 °C) and the next day brains were dissected out and cryoprotected in pH 7.4 0.1 M PO4-buffered saline (PBS) containing 30% sucrose until they sank (24–72 h). They were then cut on a freezing microtome in serial 50 µm frontal sections (10 bins, 500 µm separation) in a plane aligned with that used in the rat brain atlas of Paxinos and Watson [44], and stored in PBS containing 0.02% azide (PBS-azide, 4 °C). For immunolabelling, sections that included the MPTA were washed while free-floating in PBS (4 × 4 min) and treated for antigen retrieval by warming to 85 °C for 8 min, then returning to room temperature (RT). They were then permeabilized and blocked in PBS containing 0.25 triton X-100 (TBS; BDH Laboratory Suppliers; Nottingham, UK) and 3% fish gelatine (Sigma; Darmstadt, Germany; G-7765; Lot# 37H1205) for 1 h and transferred to a solution of TBS containing 3% bovine serum albumin (BSA, MP Biomedicals, Solon, OH, USA, lot.S6866) and primary antibodies, with continuous rotary agitation.
For half of the sections, the primary antibody used was rabbit anti-FG (Merck, Darmstadt, Germany, AB153-1, lot: 3729385, 1:1000) and for the other half it was goat anti-CTB (List Biological Laboratories, Campbell, CA, USA, cat#104, lot: #7032A9, 1:1000). Sections were incubated either overnight at RT, or for 3 days at 4 °C, rinsed (PBS, 4 × 4 min) and then transferred to a secondary antibody solution. For FG, the secondary antibody was donkey anti-rabbit Alexa Fluor488 (green, Jackson Immuno Research Labs, Cambridge, UK, cat.# 711-545-152, lot.146871, 1:1000). For CTB, it was biotinylated donkey anti-goat IgG (Abcam cat.#7124, lot.GRR218022-17, 1:500) followed by Cy2-labelled streptavidin (green, Jackson Immuno Research Labs, cat.#706-065-148, 1:1000). Sections were incubated at RT with rotary agitation for 1.0 and 1.5 h, respectively. Finally, they were rinsed (PBS, 4 × 4 min), mounted on glass slides, air dry and cover-slipped using immu-mount (Thermo Fisher Scientific, Waltham, MA, USA).
Sections through the MPTA of an additional 7 naive rats, perfused and sectioned as described above, were immunolabelled for NeuN, a selective nuclear marker expressed by most neurons. These sections were incubated overnight in polyclonal mouse anti-NeuN antibody (MilliporeSigma, Burlington, MA, USA, catalog #MAB377, 1:20,000, RT) followed by 1.5 h in biotinylated horse anti-mouse IgG (Vector Laboratories, Burlingame, CA, USA, cat. BA-2001, 1:1000; 37 °C). Neurons were then visualized using the ABC reaction (avidin-biotin conjugate) and diaminobenzidine (DAB) (Vectastain Elite ABC kit; Vector Laboratories). Throughout, sections in well-plates, or mounted on slides, were wrapped in foil to minimize photo-bleaching and were stored at 4 °C.

2.2.2. Imaging and Neuron Counting

Regions of interest (ROIs) were imaged on an Olympus IX81 inverted fluorescence microscope using Cell-Sens Dimension software (v.4.4, Olympus, Tokyo, Japan). Resulting files (TIF 13,104 × 11,262; 143 megapixel, 16 bit depth) were processed using Fiji (Image J 1.54p) [44]. Images of whole histological sections were stitched from 40× TIFF files with multi-colour separation. In addition, images at 100× magnification were made of each MPTA, including its AAV8-mCherry microinjection site. We evaluated an optimal MPTA section that passed through the centre of the AAV8-mCherry microinjection site in the MPTA, matching it to a standard plane from the Paxinos and Watson [44] rat brain atlas. If two optimal sections were available, both were counted and the average was used for statistical analysis. All sections that included the MPTA lay between B-8.0 and B-9.16 mm caudal to bregma. Of the 20 rats entered into the study, 4 were excluded because the AAV8-mCherry microinjections were off-target. In another 2, the microinjection was usable on one side only. Counts of effector-neurons (red) were therefore available from 30 MPTA microinjections in 16 rats, 15 right-sided, 15 left-sided. Among these 30, however, the quality of retrograde labelling (green) in 7 cases was deemed sub-optimal, two using FG (targets PFC, BF) and five using CTB (targets 2 × PFC, 2 × ZI and 1 × iTh). That left 23 MPTAs in which the identification of double-labelling was considered unequivocal. Both types of exclusion were adjudicated by observers blinded to the experimental results.
For the purposes of quantification we began by superimposing on the stitched images of the sections under analysis the standard boundaries of the MPTA. This is a bilaterally symmetrical area 1.0 × 1.5 mm (1.5 mm2) anchored to anatomical markers as shown in Figure 1. Note that these boundaries are not defined by cellular clustering, but functionally. That is, they form a rectangle bounding the region that, when exposed to small volume microinjections of the GABAergic agonist muscimol (10 or 20 nL), proved to be pro-anesthetic [28]. The spread of the mCherry marker (red) was then manually traced on the section image by an observer blinded to the experimental results. The area of injectate that fell within the borders of the MPTA, measured with a digital planimeter, was combined with cell counts in this area to establish nominal neuronal density (neurons/mm2). On average, individual microinjection sites filled somewhat over 60% of the 1.5 mm2 area of the MPTA (range 32–100%). The entire area was covered in aggregate, with no difference between the left and the right side (p > 0.5; Figure 1 left). An example of an individual microinjection site is shown in Figure 1 (right). For some purposes a smaller ROI, centrally located within the MPTA, was used for comparisons. This is the mMPTA (0.5 mm × 0.75 mm, Figure 1).
The objects counted were single and double-labelled neurons. For counting, an optimal 100× image of the MPTA was loaded in Fiji and the part of the circular AAV8-mCherry microinjection site that fell within the MPTA counting frame was systematically scanned in its entirety. Specifically, this region was viewed separately with the red channel (mCherry) to detect effector-neurons and the green channel (Alexa 488 or Cy2) to detect retrogradely labelled neurons. Fiji’s cell-counter add-in was used to mark each neuron counted as red and/or green by switching back and forth between the two colour channels, searching for the presence of both markers in a congruent neuronal profile. Labelled neurons, for which >50% of the cell area fell outside of the MPTA rectangle, were not counted. No systematic factor was applied to correct for neurons split in the Z-axis as we were interested in ratios, less so absolute counts. However, profiles needed to be recognized as neuronal somata in the TIFF image, usually including a nucleus. If only red fluorescence was present, cells were registered as effector-neurons (single-labelled); if green alone, they were registered as non-effector MPTA projection-neurons (single-labelled). Individual neurons labelled with both colours were registered as projecting effector-neurons (double-labelled). Double-labelled neurons often appeared yellow in merged mode. However, depending on yellow identification can result in miscounting when the intensity of one colour dominates the other. The back-and-forth procedure, which we used routinely, provides a more reliable estimate of double labelling.
At the time of counting, the individual making the count was blinded to the projection-target and laterality (ipsilateral or contralateral to the MPTA counting frame). Although we did not use replicate counting by independent investigators in the present study, we did so in two previous studies using the same alignment and counting methods [31,32]. There we obtained concordance values between 1.1 and 3.4%. In addition, we compared our counts of MPTA neurons projecting to the six projection-targets with those obtained in the two previous studies, which also employed CTB and FG as tracers, but used different visualization methods, DAB and Vector SG (Section 3).

2.3. Statistical Analysis

The fundamental information sought was whether MPTA effector-neurons in fact send an axon to one or another of the six regions determined in prior studies to receive input from (unidentified) MPTA projection-neurons, and if so, how many project to each target. A secondary aim was to catalogue (1) effector-neurons that have, and do not have, such projections and (2) MPTA projection-neurons that are not effectors. For the primary objective we focused on the circular regions of mCherry expression. Specifically, we examined a large number of individual MPTA effector-neurons identified by expression of mCherry (red), and asked whether they also expressed FG or CTB (green), markers of retrograde transport from one or the other of the projection-targets microinjected in the rat in question (double-labelled, red plus green). Counts of single-labelled (red or green) and double-labelled (red plus green) neurons from each rat in which a particular projection-target was assayed were summed across rats, always noting whether the retrograde tracer, FG or CTB, was delivered ipsilateral or contralateral to the MPTA being evaluated. Results are presented as a percentage, the absolute number of projecting effector-neurons (double-labelled) divided by the absolute number of effector-neurons sampled (red). Note that individual sections were immunolabelled for FG or CTB, but not both. Because of this we did not obtain direct information on whether axons of individual effector-neurons send collateral axon branches to more than one of the six projection-targets.
For the secondary objective we established the density of projecting MPTA neurons (green, neurons/mm2) based on scans of the entire 1.5 mm2 area of the MPTA counting frame. The density of MPTA effector-neurons (red, neurons/mm2) and the density of projecting MPTA effector-neurons (double-labelled, red and green, neurons/mm2) was based on scans of the circle of AAV8-mCherry expressing neurons that fell within the boundaries of the MPTA. All of these counts were performed independently for the six projection-targets ipsilateral to the MPTA counted, and the six contralateral. Both sets of calculations were performed separately for the two retrograde tracers used, FG and CTB. This allowed us to check whether one tracer was systematically more efficient than the other. Finally, we established the density of all neurons in the MPTA, unidentified as to projections or functional role, based on NeuN-immunoreactivity (NeuN-IR (RBFOX3)), noting that neurons exist, perhaps also in the MPTA, that do not express NeuN [45]. All values were collected separately for each rat in the same projection-target group, tracer used and laterality when available, with results then averaged across rats. Statistical significance was evaluated pairwise using 2-tailed Student’s t-tests with homogeneous or heterogeneous variance as appropriate. Results were later rounded to an accuracy consistent with the original measurements. Tests for laterality excluded two projection-targets, RVM and SC, as tracers microinjected into these targets accessed both sides, and in addition the PFC, for which too few retrogradely labelled neurons were collected. Correlations were tested with the Pearson regression analysis. The significance criterion used was p < 0.05.

3. Results

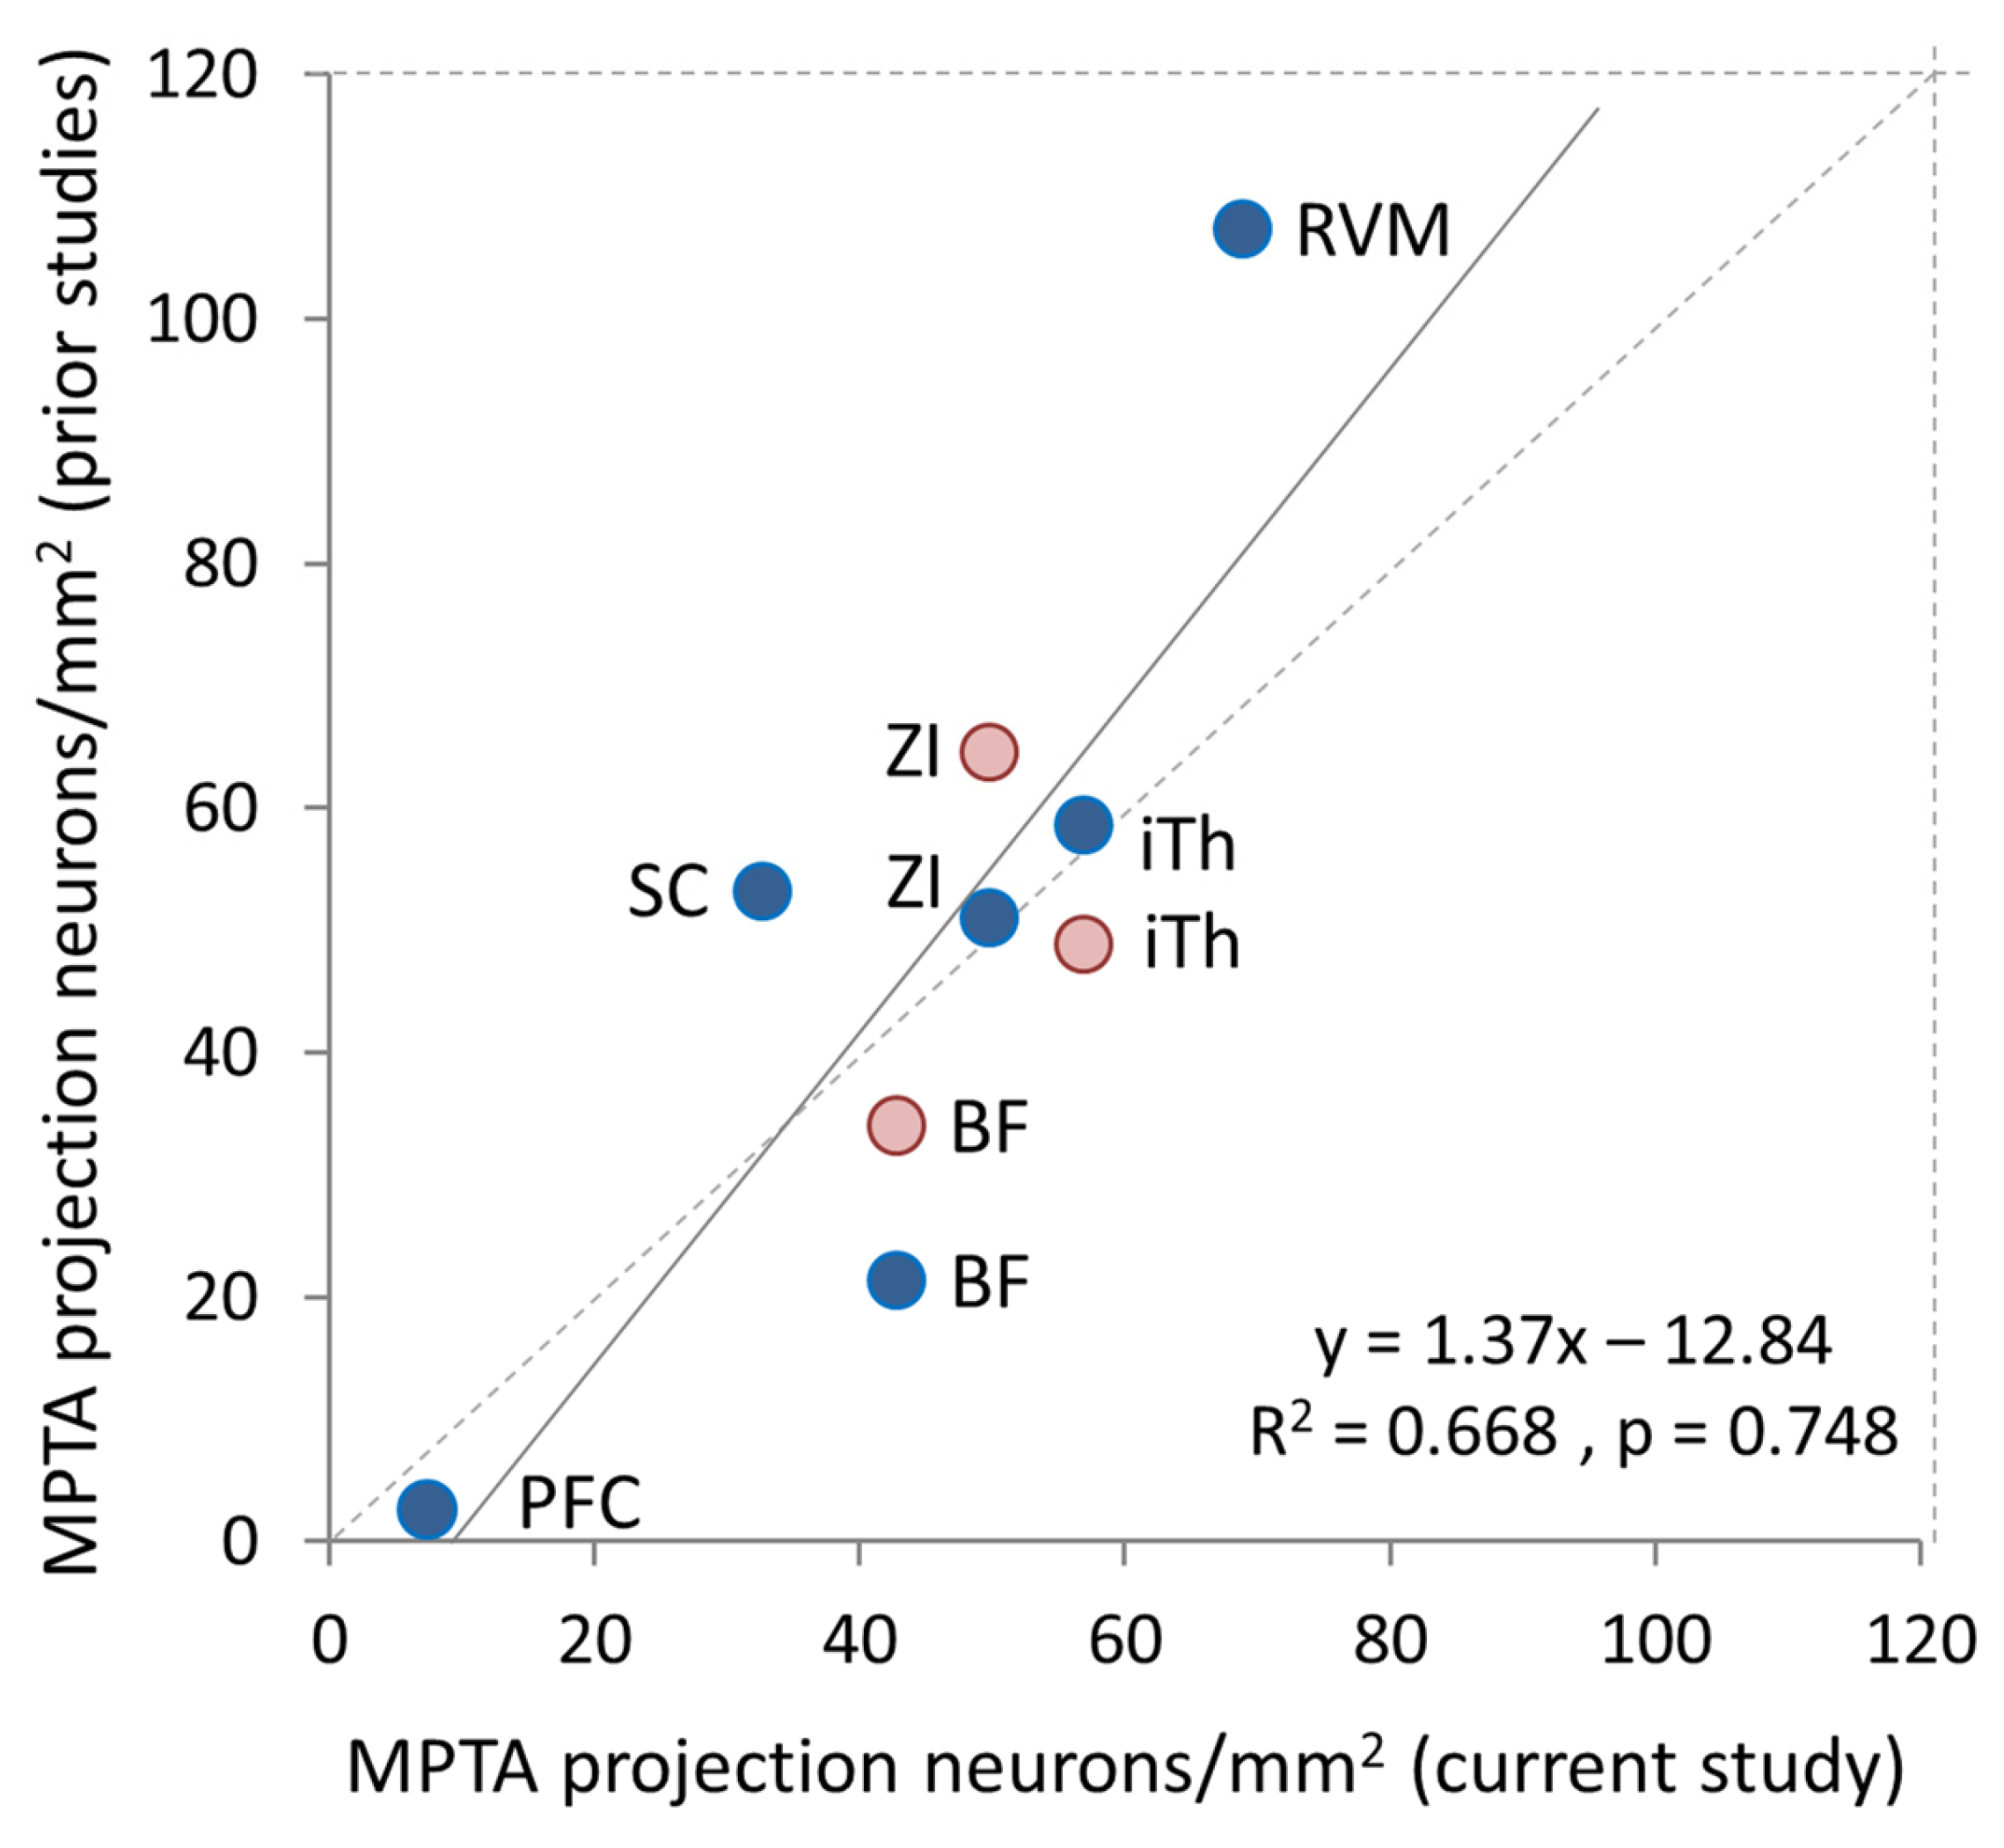
Densities of MPTA projection-neurons and of projecting effector-neurons, and the percent of MPTA projection-neurons that are effectors, are given in Table 2, Table 3 and Table 4. The similarity of our (blinded) density estimates of MPTA projection-neurons in the present study with those collected in two earlier studies [31,32] speaks to the reliability of the methods used (Figure 3). Likewise, all three studies found no significant difference in the efficiency of FG and CTB as retrograde tracers (together, ipsilateral p = 0.18, contralateral p = 0.53; both combined p = 0.16). On this basis, results using FG and CTB were combined in the foregoing analysis.

3.1. MPTA Effector-Neurons Project to the PFC, the Major Cortical Relay Nuclei, the RVM and the SC

Our main finding was that MPTA effector-neurons are indeed included among the MPTA neurons that send axonal projections to the six brain structures identified previously that appear to be the substrate regions for the various functional components of general anesthesia. AAV8-mCherry microinjections used to mark effector-neurons were on-target in all 16 rats included. These covered 32–100% of the area of the MPTA, depending on the volume microinjected and specific targeting, with the entire MPTA covered multiple times in aggregate (Figure 1). As noted, only red fluorescent effector-neurons within the boundaries of the MPTA were evaluated. Neurons outside of the MPTA counting frame that expressed mCherry were not included on the grounds that muscimol deposited outside the MPTA is not pro-anesthetic [28,29]. FG and CTB microinjected into the six MPTA projection-targets also filled much or all of the regions intended (Figure 2). Tracer spread beyond the intended target boundaries was tolerated, however, as we know from prior anterograde tracing studies that few, if any, terminals of MPTA projection-neurons end in these locations [33,37].
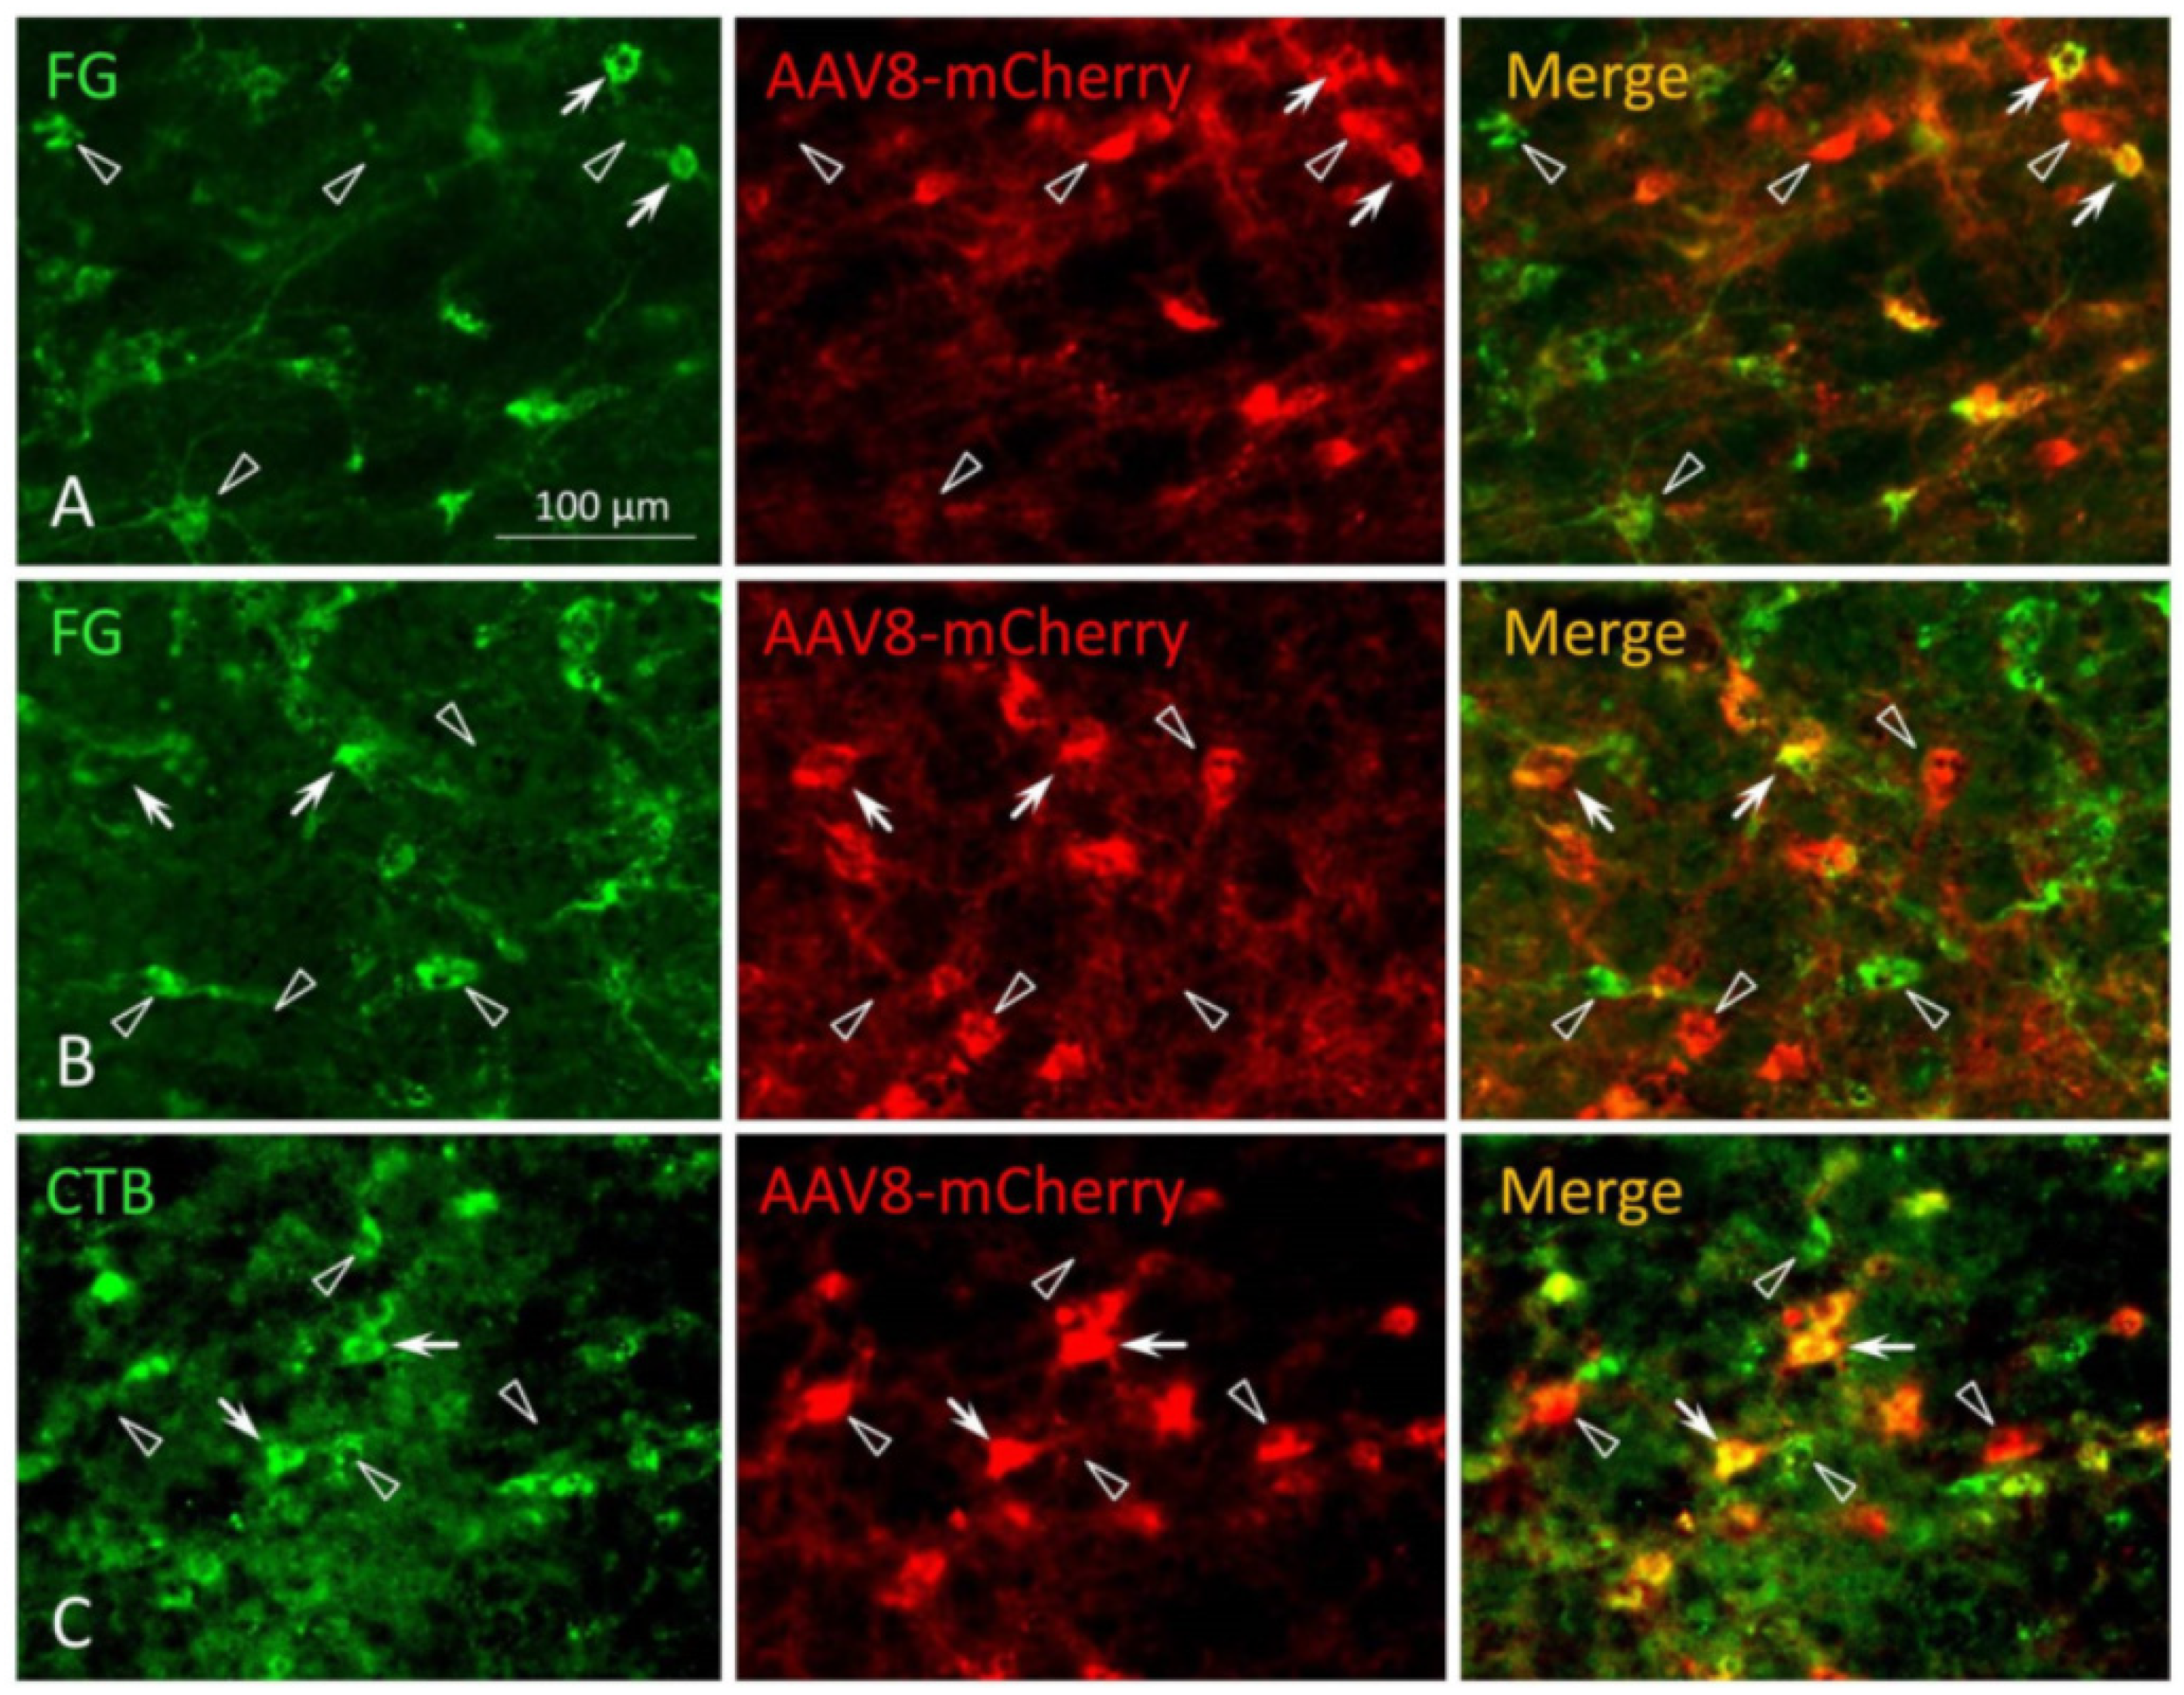
Overall, 3727 effector-neurons (red) were evaluated (30 MPTAs in 16 rats). Of them, 1383 were double-labelled (red and green; Figure 4), marking them as projecting effector-neurons, for an overall average of 37.1% (Table 3). Prior observations using anterograde and retrograde tracing revealed that the direct MPTA to PFC projection is small [32,33]. This was verified here for effector-neurons, explaining why we only encountered six retrogradely labelled effector-neurons, for an average of 1.5% of effector-neurons sampled. The remaining five projection-targets had much higher counts, which were quite similar among them (33.7–58.2%, mean 41.3%, Table 3). As each effector-neuron had a better than 40% chance on average of projecting to each and every one of these five targets, many of them must have sent collateral branches to more than one target, with a few perhaps projecting to all five (see Section 4). Obtaining complete information on axon collateralization will require the use of distinguishable markers for each target, an objective for future research. Regarding laterality, information was unavailable for the RVM and SC as noted, and was insufficient for PFC. Among the remaining projection-targets, BF, iTh and ZI, laterality of the projecting effector-neurons varied substantially (Table 3).

3.2. Prevalence of Effector-Neurons

The density of mCherry expressing neurons (effectors) in the MPTA was measured as 58.2 ± 19.7/mm2. This value is based on counts from 30 separate microinjection sites and the measurement of the area of each which fell within the boundaries of the MPTA. Measured density on the left and right sides did not differ significantly (p > 0.1), although a small difference might have been obscured by the high variability among density readings (SD = ±19.7/mm2). This variability may partly be due to the centre-to-periphery gradient in the density of mCherry-expressing neurons, with variability expected as a result of the higher concentration of AAV8-mCherry deposited near the tip of the injection micropipette.
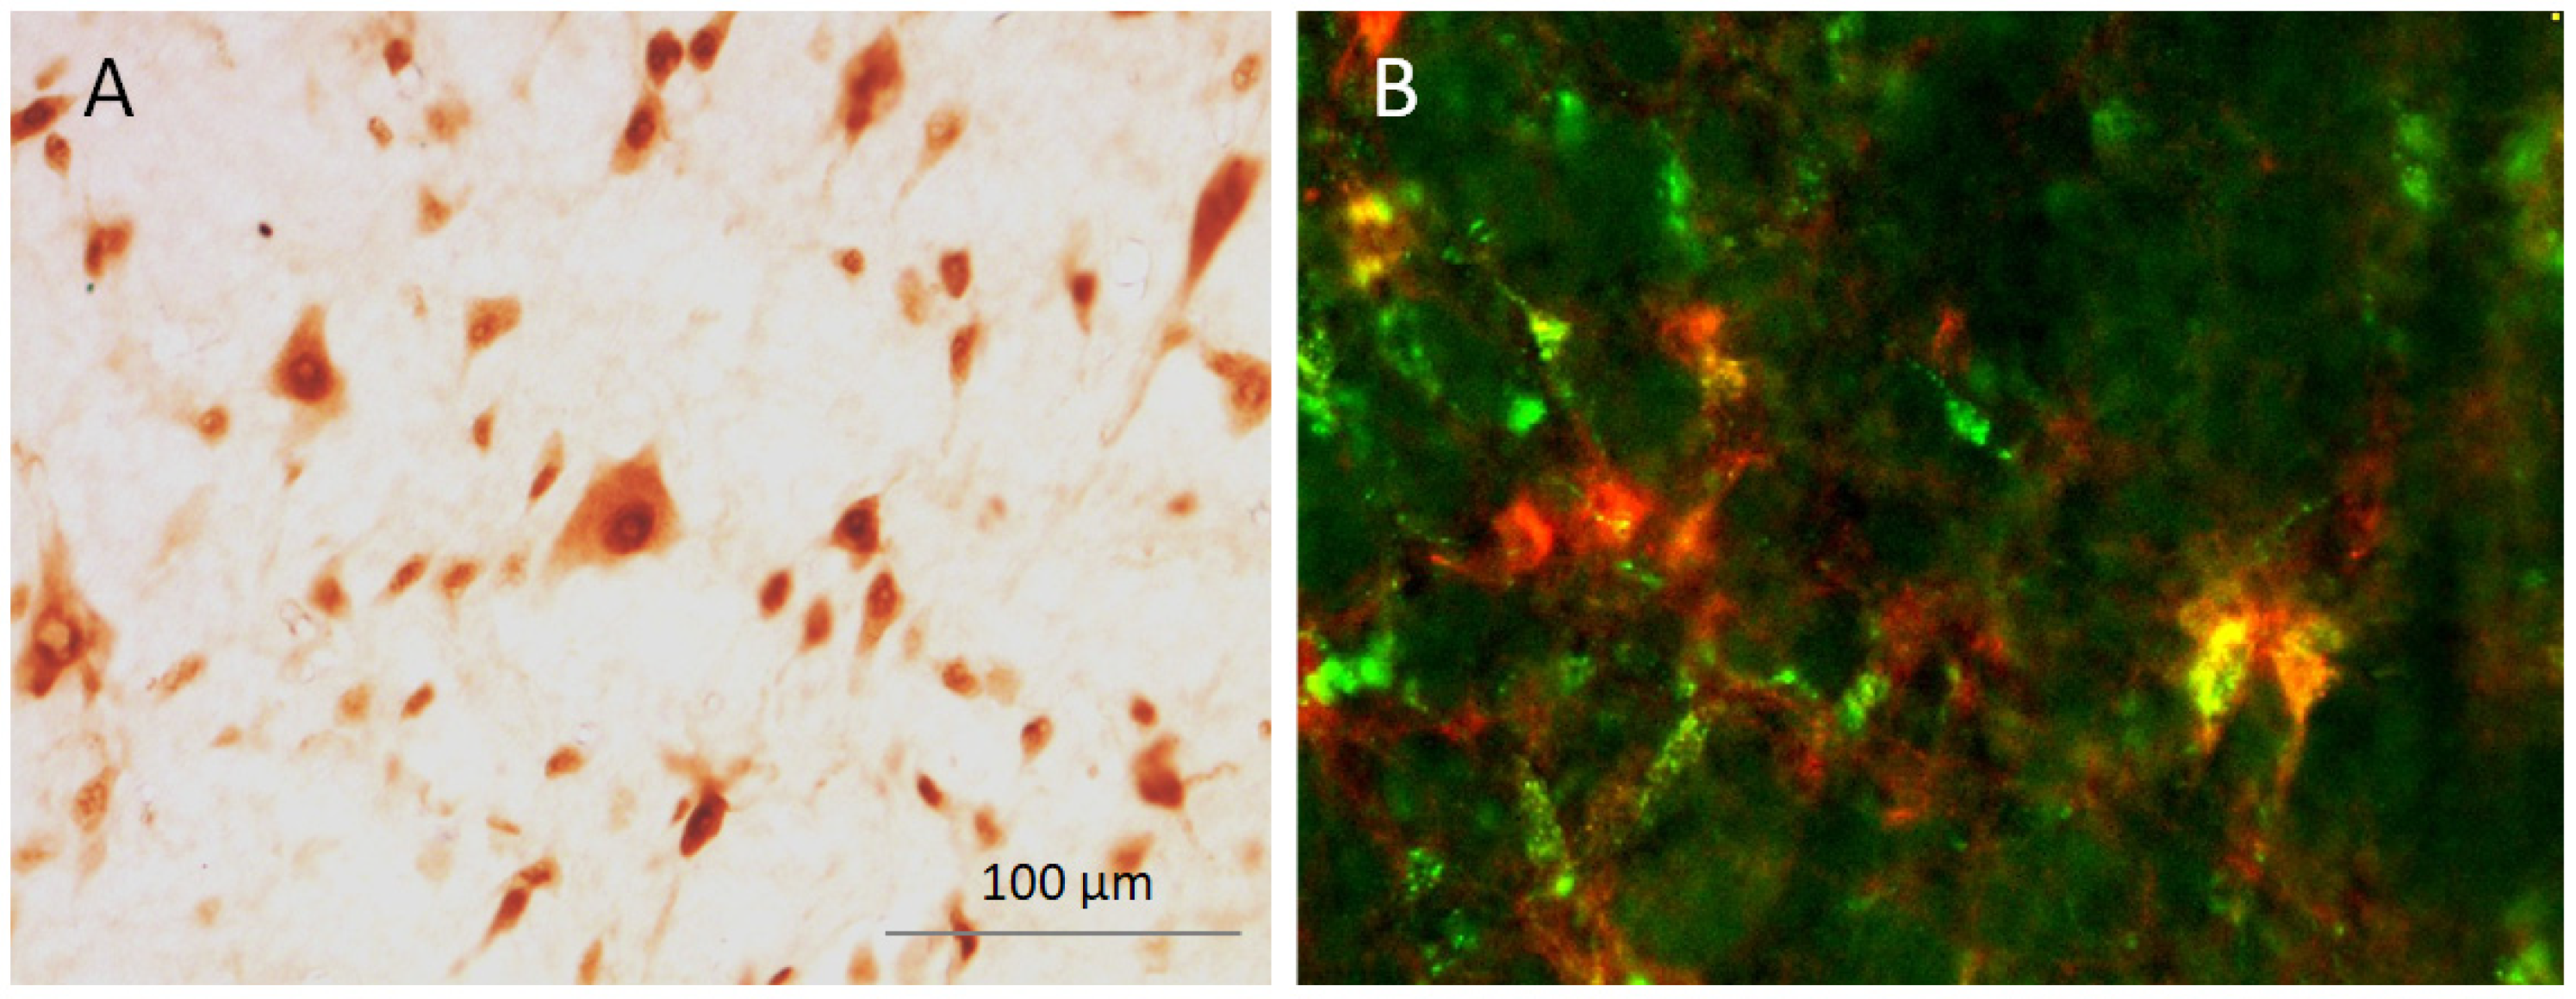
Another value of interest is the number of MPTA effector-neurons among all MPTA neurons. This was determined by counting NeuN-IR neurons in the MPTA on both sides in 7 rats (14 MPTAs; Figure 5A). Mean density was calculated in each rat and then averaged across rats. The result was 435.4 ± 86.6 neurons/mm2. From this value we can conclude that 13.4% of all MPTA NeuN-IR neurons are effector-neurons (58.2/435.4 = 0.134). Based on the large proportion (~40% on average) that project to multiple projection-targets, virtually all of these are likely to be projecting effector-neurons. We should add, however, that there may be additional effector-neurons, including projecting effector-neurons, that for one reason or another did not become infected by the AAV8-mCherry and were therefore not counted. The 13.4% value should therefore be considered a lower boundary.

3.3. MPTA Projection-Neurons That Are Not Effectors

The population of MPTA projection-neurons not marked by AAV8-mCherry and hence probably not effectors (green, but not red) was estimated in two ways: The first was based on our systematic survey of the entire 1.0 × 1.5 mm MPTA counting frame. From Table 2, subtracting the density of all projecting effector-neurons (red 122.5/mm2) from the total density of projecting neurons (green, 287.8/mm2) yields the density of ipsilaterally projecting neurons that are not effectors, 165.3/mm2. Adding this to the corresponding value for contralaterally projecting MPTA neurons from Table 4 (220.9 − 105.7 = 115.2/mm2) yields a total of 280.5/mm2 projection-neurons that are not effectors. The second approach focused exclusively on the circular regions within the MPTA in which mCherry was expressed. The value for projecting non-effectors using this approach was 232.5/mm2. Averaging both approaches yields 256.5/mm2, a density which represents 59.0% of the overall neuronal population MPTA neurons based on NeuN-IR (435.4 ± 86.6 neurons/mm2). Adding this value, the percent of MPTA projection-neurons that are not effectors, to 13.4%, the percent of MPTA projection-neurons that are effectors, yields 72%. The remaining 28% of NeuN-IR neurons in the MPTA are neither effectors, nor neurons that project to the six defined MPTA projection-targets. These may play a role in sleep and arousal by way of neuronal interactions in nearby reticular formation structures outside of the MPTA such as the pedunculopontine tegmental nucleus (PPTg) or the deep mesencephalic nucleus (DpMe), and/or by interneurons within the MPTA itself.

4. Discussion

Using a chemogenetic approach, we previously identified a population of MPTA “effector-neurons” which, when excited, induces the spinal and the cortical components of general anesthesia including atonia, analgesia, δ-power EEG and presumably amnesia and LOC [37]. Here, using neuroanatomical tract tracing, we established that virtually all of these effector-neurons send ascending or descending axons to one or more of the BF, iTh, ZI and RVM, relay nuclei from where signals originating in the MPTA can be passed onwards to effector regions in the cerebral cortex via ascending axonal pathways (ZI, iTh, BF), and/or to effector regions in the medulla and spinal cord via descending pathways (RVM). In addition to these relays, MPTA effector-neurons contribute a small direct ascending pathway to the PFC as well as a prominent direct bulbo-spinal pathway to the SC. Effector inputs to all of the MPTA projection-targets are bilateral. However, based on the three projection-targets assessed, the proportion of fibres that cross the midline varies from target to target. The functional significance of this is uncertain. However, the overall proportion that cross and that remain ipsilateral is consistent with the observation that unilateral microinjection of GABAergic agonists into the MPTA causes functional anesthetic effects bilaterally [9,29,37,38,46]. In defining the functional targets of the small population of projecting effector-neurons, we have added essential detail to the evolving dedicated pathways hypothesis of anesthetic action.

4.1. Limitations and Caveats

As in all research, there are inevitable limitations and caveats associated with the experimental outcomes and hence the conclusions that can be drawn. Tracer microinjections into projection-targets aimed at fixed stereotactic coordinates. However, factors such as skull size, the precise location of suture landmarks (bregma) and the volume of tracer extruded cause variability in the exposure of effector-neuron terminals to the tracer. Likewise, although blinding procedures were used, observer variability affects the evaluation of whether a particular effector-neuron was in fact double-labelled and whether a particular retrogradely labelled neuron was in fact an effector-neuron. In addition, we can only speak to the projections of effector-neurons that were infected and marked by AAV8-mCherry. We cannot rule out the possibility that other MPTA projection-neurons, ones not visualized, exist and play a role. Perhaps the most significant practical limitation relates to the use of only two retrograde tracers, CTB and FG. This allowed us to distinguish ipsilateral from contralateral projections, but it did not provide direct information on the question of axonal branching. From our observations we inferred substantial collateralization of individual projecting effectors to the various projection-targets. However, 12 distinguishable retrograde tracers would be needed to learn the details of collateralization of individual projecting-effector types, a noble objective for future research. Finally, although general anesthesia in rodents and humans shares many features, the similarity might not extend to cell types and connectivity.
From a previous study in which undefined MPTA neurons were labelled using NeuN-IR and MPTA effector-neurons were marked by AAV8-mCherry expression, we concluded that roughly half of the larger neurons in the MPTA are effectors [37]. Knowing now that only ~13% of MPTA neurons are effector-neurons, we surmise that ~6% of these are projecting effector-neurons and hence candidate participants in the induction of LOC. This is a small cell population, but of remarkable functional importance in the context of anesthesia, and of LOC in general. It should also be noted that MPTA effector-neurons, projecting and non-projecting, are probably not the neurons whose activity is directly modulated by general anesthetic agents that access the MPTA, via the circulation or by direct microinjection. Few if any of these neurons express the requisite GABAA-R isoform. The neurons that appear to be the direct targets of GABAergic anesthetics are δ-cells [29,37].

4.2. Additional Ascending and Descending Targets

Although not specifically documented, it is likely that a fraction of projecting effector-neurons also deliver axon terminals to additional locations at which they might impact neuronal function. Among these are nuclei that lie along the trajectories of the projection axons as they pass from the MPTA to their distal targets. For ascending fibres, two main trajectories have been identified. One, the ventral mesolimbic forebrain trajectory, passes through the lateral hypothalamus and preoptic area on the way to the BF. The second runs more dorsally en route to the iTh and just beyond, passing through more rostral parts of the mesopontine tegmentum itself, the pre-tectum, and continuing past the iTh into the corpus striatum. Descending MPTA fibre trajectories are more diffuse, passing through the pons and medulla, and into the spinal grey, including segments caudal to the cervical SC, the only locus where retrograde tracer was actually placed in the present study [34,47]. There are also large parts of the forebrain and hindbrain that appear to be avoided by projecting MPTA axons. Additional observations on the axonal trajectories of MPTA projection-neurons are given in the following references: [37,40,48].

4.3. Laterality and Collateralization

Although the proportion of decussating MPTA projecting effector-neurons varies across projection-targets (Table 2, Table 3 and Table 4), the average is roughly 1:1. However, in our two prior studies we obtained a consistent ratio of 2:1, indicating a strong ipsilateral predominance [31,32]. The current and prior studies differed in two important ways that may explain this discrepancy. First, in these prior studies, we microinjected contrasting retrograde tracers into pairs (“dyads”) of synaptic targets of MPTA projection-neurons, the same ones studied here. The relevant dyads consisted of a single projection-target on the two sides. Second, unlike the present study in which the focus was on the select subpopulation of projecting effector-neurons in the MPTA, the focus then was on the much larger population of undefined NeuN-IR MPTA neurons. On the face of it, an outcome of 1:1 vs. 2:1 might seem irreconcilable. However, it is likely that both results are correct. As noted, projecting effector-neurons probably represent only ~6% of all MPTA neurons. In contrast, projecting non-effectors represent ~60%. Given the sampling error of both values, a small minority of projecting effector-neurons with a 1:1 crossing ratio could easily be obscured among a large majority of projecting-neurons with a 2:1 ratio.
A similar issue arises with respect to collateralization. In the two prior studies, in addition to examining dyads of synaptic targets on opposite sides of the brain, we also examined dyads on the same side. For both types we found that double-labelled neurons, neurons that send axon branches to two different projection-targets, were uncommon; they constituted only a few percent of single-labelled neurons. From this we concluded that, for the most part, (unidentified) MPTA projection-neurons send their axons to one projection-target, on one side, with very little collateralization [31,32]. In the present study, in contrast, we found that, excluding PFC, roughly 40% of projecting effector-neurons send an axon to each of the remaining five MPTA projection-targets. This means that many projecting-effectors must send collateral branches to at least two projection-targets with some collateralizing to three, four and perhaps more targets. Overall, the five main targets, excluding PFC, receive input from 5 × 40% = 200% of MPTA projection-neurons. Collateralization to two or more projection-targets must be the rule, not the exception. The explanation that we propose is the same as for lateralization. Specifically, projecting effector-neurons are a small, highly specialized and likely unique neuronal subpopulation tasked with driving brain-state transitioning between wakefulness and oblivion. This task apparently requires rich collateralization as well as balanced laterality. Because projecting effector-neurons represent only a small fraction of MPTA neurons at large, these peculiarities were not detected in our prior studies, which did not distinguish between non-effector MPTA projection-neurons and MPTA projecting-effectors.

4.4. Loss-of-Consciousness Beyond General Anesthesia

We have proposed that the projecting effector-neurons play a key role as drivers of surgical general anesthesia. This role in modern medicine, however, likely reflects a much broader, evolutionally adaptive role of LOC in the life cycle of complex organisms [49]. For example, we have shown that cell-specific lesions of the MPTA induce insomnia, with a decrease in both REM and non-REM sleep and a corresponding increase in time spent awake. Such lesions also affect the susceptibility of animals to LOC (syncope, fainting) in the presence of elevated CO2 levels (hypercapnia). Hibernation and perhaps death feigning (“playing ‘possum”), concussion, torpor and tonic inhibition might also be added to this list [42,43,50,51,52]. Different as these instances of LOC are in terms of triggers and context, they share the fundamental components of anesthetic induction and emergence. As such, they support the inference that anesthetics act by co-opting the brain’s own adaptive LOC circuitry by substituting for an intrinsic neurotransmitter(s), presumably GABA or glycine, and/or other endogenous GABAergic neuromodulatory agents such as somnogens and neurosteroids [10,30,51].

4.5. Conclusions and Future Scope

Our aim in the present study was to better define the axonal pathways that drive brain-state transitioning and LOC based on the previously identified targets of MPTA projection-neurons and the recent discovery that a discrete subset of these neurons, when excited, actually effect transitioning from wakefulness to oblivion. Results of anatomical tracing of the axonal projections of this special neuronal subset revealed that projecting effector-neurons, probably no more than ~6% of all MPTA neurons, contribute substantially to all of the MPTA projection-targets examined. This finding (1) reinforces the conclusion the anesthetic induction is driven by circuit nodes and dedicated axonal pathways rather than the widespread distribution of suppressive molecules; (2) helps to explain the selective suppression of conscious awareness without much affecting life-sustaining housekeeping functions; and (3) reiterates the importance of the brainstem mesopontine tegmentum as a key player in consciousness and its loss [9,49].
Whether LOC occurs in the context of surgical anesthesia, or under natural circumstances, its component “symptoms”, atonia, analgesia, amnesia and oblivion (unconsciousness), normally occur together, as a syndrome. These endpoints, however, are not inseparable; they occasionally dissociate. For example, during parasomnias, e.g., sleepwalking, the individual is unresponsive, unconscious, with NREM-like EEG, but with fully intact motor control and sensory–motor coordination. Such individuals can walk down stairs without incident, prepare a sandwich, and in rare instances are believed to have driven an automobile, including making correct turns and stopping at red lights [53,54]. Another example of dissociation is sleep paralysis. Here muscle atonia of REM sleep persists for a short time after the individual has fully regained consciousness. The occurrence of such dissociations strongly supports the dedicated pathways hypothesis of LOC over the global suppression (“wet-blanket”) hypothesis.
We propose that the multiple, independent pathways of projecting effector-neurons elaborated here constitute the anatomical substrate for this phenomenology. Additional research will be required to flesh out this hypothesis. For example, it is important to know what controls the activity of the GABA-receptive δ-cells which likely drive MPTA effector-neurons, and how this drive is accomplished. Likewise, it is important to understand the signals delivered by effector-neurons to their various target zones, how these signals differ from one another and how they act as an ensemble in the generation of “syndromes” like anesthesia, syncope and hibernation.
Finally, might different types of MPTA effector-neurons, by activity patterns and projection-targets, express unique membrane receptors or other handles that would permit their selective pharmacological activation or inhibition? If so, one can imagine the development of a new drug that could, for example, provide surgical-quality pain suppression, without paralysis or sedation, by selectively engaging effector-neurons with projections to spinal nociceptive circuitry. By the same token, it might be possible to develop a drug that selectively engages ascending pathways capable of awakening a comatose patient from oblivion.

Author Contributions

Conceptualization, M.D.; M.B. Methodology, J.M., A.M. and K.V.; Validation, J.M., A.M. and K.V.; Formal analysis A.M.; Investigation, M.K., S.H. and R.M.; Data curation, J.M., A.M., K.V. and M.D.; Writing—original draft, J.M., Writing—review & editing, J.M., A.M., M.B. and M.D.; Visualization, J.M., A.M. and K.V.; Supervision, M.D. and A.M.; Project administration A.M., K.V. and M.D.; Funding acquisition, M.D. All authors have read and agreed to the published version of the manuscript.

Funding

This research was supported by the Fund for Research on Anesthesia at the Hebrew University of Jerusalem (account #3175000539).

Data Availability Statement

Data are available from the senior author (MD) upon reasonable request.

Acknowledgments

We thank Shai-lee Yatziv-Schenk for her assistance with imaging, and the Charles Smith and Joel Elkes Laboratory for Collaborative Research in Psychobiology for the use of equipment.

Conflicts of Interest

The authors declare no financial conflicts of interest with respect to this report.

Abbreviations

AAV, adeno-associated virus; ABC, avidin-biotin conjugate; aRAS, ascending reticular activating system; BF, basal forebrain; BSA, bovine serum albumin; CNO, Clozapine N-Oxide; CNS, central nervous system; CTB, cholera toxin B subunit; DAB, diaminobenzidine; DpMe, Deep Mesencephalic area, DREADD, designer receptor exclusively activated by a designer drug; EEG, electroencephalogram; FG, Fluorogold; GABAA-Rs, gamma aminobutyric acid type A receptors; iTh, intralaminar thalamus; LOC, loss-of-consciousness; MPTA, mespontine tegmental anesthesia area; PBS, phosphate-buffered saline; PFC, prefrontal cortex; PPTg, pedunculopontine tegmental nucleus, REM, rapid eye movement; RVM, rostral ventromedial medulla; SC, spinal cord; TBS, phosphate-buffered saline containing triton; ZI, zona incerta.

References

  1. Antognini, J.F.; Carstens, E.; Tabo, E.; Buzin, V. Effect of differential delivery of isoflurane to head and torso on lumbar dorsal horn activity. Anesthesiology 1998, 88, 1055–1061. [Google Scholar] [CrossRef]
  2. Antognini, J.F.; Carstens, E.; Raines, D.E. (Eds.) Neural Mechanisms of Anesthesia; Human Press: Totowa, NJ, USA, 2003. [Google Scholar]
  3. Franks, N.P.; Lieb, W.R. Where do general anaesthetics act? Nature 1978, 274, 339–342. [Google Scholar] [CrossRef] [PubMed]
  4. Alkire, M.T.; Haier, R.J.; Shah, N.K.; Anderson, C.T. Positron emission tomography study of regional cerebral metabolism in humans during isoflurane anesthesia. Anesthesiology 1997, 86, 549–557. [Google Scholar] [CrossRef] [PubMed]
  5. Koblin, D. Mechanisms of action. In Anesthesia, 4th ed.; Miller, R., Ed.; Churchill Livingston: New York, NY, USA, 1994; pp. 67–99. [Google Scholar]
  6. Brown, E.N.; Purdon, P.L.; Van Dort, C.J. General anesthesia and altered states of arousal: A systems neuroscience analysis. Annu. Rev. Neurosci. 2011, 34, 601–628. [Google Scholar] [CrossRef] [PubMed]
  7. Lu, J.; Sherman, D.; Devor, M.; Saper, C.B. A putative flip-flop switch for control of REM sleep. Nature 2006, 441, 589–594. [Google Scholar] [CrossRef]
  8. Lu, J.; Nelson, L.E.; Franks, N.; Maze, M.; Chamberlin, N.L.; Saper, C.B. Role of endogenous sleep-wake and analgesic systems in anesthesia. J. Comp. Neurol. 2008, 508, 648–662. [Google Scholar] [CrossRef]
  9. Baron, M.; Devor, M. From molecule to oblivion: Dedicated brain circuitry underlies anesthetic loss of consciousness permitting pain-free surgery. Front. Mol. Neurosci. 2023, 16, 1197304. [Google Scholar] [CrossRef]
  10. Scharf, M.T.; Kelz, M.B. Sleep and anesthesia interactions: A pharmacological appraisal. Curr. Anesth. Rep. 2013, 3, 1–9. [Google Scholar] [CrossRef]
  11. French, J.; Verzeano, M.; Magoun, H. A neural basis of the anesthetic state. Arch. Neurol. Psychiat. 1953, 69, 519–529. [Google Scholar] [CrossRef]
  12. Magni, F.; Moruzzi, G.; Rossi, G.; Zanchetti, A. EEG arousal following inactivation of the lower brain stem by selective injection of barbiturate into the vertebral circulation. Arch. Ital. Biol. 1959, 97, 33–41. [Google Scholar]
  13. Grady, F.S.; Boes, A.D.; Geerling, J.C. A Century Searching for the Neurons Necessary for Wakefulness. Front. Neurosci. 2022, 16, 930514. [Google Scholar] [CrossRef]
  14. Leung, L.S.; Luo, T.; Ma, J.; Herrick, I. Brain areas that influence general anesthesia. Prog. Neurobiol. 2014, 122, 24–44. [Google Scholar] [CrossRef] [PubMed]
  15. Gelegen, C.; Miracca, G.; Ran, M.Z.; Harding, E.C.; Ye, Z.; Yu, X.; Tossell, K.; Houston, C.M.; Yustos, R.; Hawkins, E.D.; et al. Excitatory Pathways from the Lateral Habenula Enable Propofol-Induced Sedation. Curr. Biol. 2018, 28, 580–587.e5. [Google Scholar] [CrossRef] [PubMed]
  16. Zecharia, A.Y.; Yu, X.; Gotz, T.; Ye, Z.; Carr, D.R.; Wulff, P.; Bettler, B.; Vyssotski, A.L.; Brickley, S.G.; Franks, N.P.; et al. GABAergic inhibition of histaminergic neurons regulates active waking but not the sleep-wake switch or propofol-induced loss of consciousness. J. Neurosci. 2012, 32, 13062–13075. [Google Scholar] [CrossRef] [PubMed]
  17. Boly, M.; Massimini, M.; Tsuchiya, N.; Postle, B.R.; Koch, C.; Tononi, G. Are the Neural Correlates of Consciousness in the Front or in the Back of the Cerebral Cortex? Clinical and Neuroimaging Evidence. J. Neurosci. 2017, 37, 9603–9613. [Google Scholar] [CrossRef]
  18. Crick, F.C.; Koch, C. What is the function of the claustrum? Philos. Trans. R. Soc. Lond. B Biol. Sci. 2005, 360, 1271–1279. [Google Scholar] [CrossRef]
  19. Nauta, W.J.H. Hypothalamic regulation of sleep in rats. An experimental study. J. Neurophysiol. 1946, 9, 285–316. [Google Scholar] [CrossRef]
  20. Van der Werf, Y.D.; Witter, M.P.; Groenewegen, H.J. The intralaminar and midline nuclei of the thalamus. Anatomical and functional evidence for participation in processes of arousal and awareness. Brain Res. Brain Res. Rev. 2002, 39, 107–140. [Google Scholar] [CrossRef]
  21. Devor, M.; Zalkind, V. Reversible analgesia, atonia, and loss of consciousness on bilateral intracerebral microinjection of pentobarbital. Pain 2001, 94, 101–112. [Google Scholar] [CrossRef]
  22. Mao, R.; Cavelli, M.L.; Findlay, G.; Driessen, K.; Peterson, M.J.; Marshall, W.; Tononi, G.; Cirelli, C. Behavioral and cortical arousal from sleep, muscimol-induced coma, and anesthesia by direct optogenetic stimulation of cortical neurons. iScience 2024, 27, 109919. [Google Scholar] [CrossRef]
  23. Voss, L.J.; Young, B.J.; Barnards, J.P.; Sleigh, J. Differential anaesthetic effects following microinjection of thiopentone and propofol into the pons of adult rats: A pilot study. Anaesth. Intensive Care 2005, 33, 373–380. [Google Scholar] [CrossRef] [PubMed]
  24. Namjoshi, D.R.; McErlane, S.A.; Taepavarapruk, N.; Soja, P.J. Network actions of pentobarbital in the rat mesopontine tegmentum on sensory inflow through the spinothalamic tract. J. Neurophysiol. 2009, 102, 700–713. [Google Scholar] [CrossRef] [PubMed]
  25. Minert, A.; Devor, M. Brainstem node for loss of consciousness due to GABA receptor-active anesthetics. Exp. Neurol. 2016, 275, 38–45. [Google Scholar] [CrossRef] [PubMed]
  26. Minert, A.; Baron, M.; Devor, M. Reduced sensitivity to anesthetic agents upon lesioning the mesopontine tegmental anesthesia area in rats depends on anesthetic type. Anesthesiology 2020, 132, 535–550. [Google Scholar] [CrossRef]
  27. Yatziv, S.-L.; Yudco, O.; Dickmann, S.; Devor, M. Patterns of neural activity in the mouse brain: Wakefulness vs. General anesthesia. Neurosci. Lett. 2020, 735, 135212. [Google Scholar] [CrossRef]
  28. Minert, A.; Yatziv, S.L.; Devor, M. Location of the mesopontine neurons responsible for maintenance of anesthetic loss of consciousness. J. Neurosci. 2017, 37, 9320–9331. [Google Scholar] [CrossRef]
  29. Baron, M.; Vaso, K.; Ibraheem, A.; Minert, A.; Devor, M. Molecular and cellular targets of GABAergic anesthetics in the mesopontine tegmentum that enable pain-free surgery. Pain 2025, 166, 1549–1564. [Google Scholar] [CrossRef]
  30. Baron, M.; Devor, M. Neurosteroids foster sedation by engaging tonic GABAA-Rs within the mesopontine tegmental anesthesia area (MPTA). Neurosci. Lett. 2024, 843, 138030. [Google Scholar] [CrossRef]
  31. Lellouche, Y.; Minert, A.; Schreiber, C.; Aroch, I.; Vaso, K.; Fishman, Y.; Devor, M. Individual Mesopontine Neurons Implicated in Anesthetic Loss-of-consciousness Employ Separate Ascending Pathways to the Cerebral Cortex. Neuroscience 2020, 432, 188–204. [Google Scholar] [CrossRef]
  32. Goldenberg, A.M.; Minert, A.; Fishman, Y.; Wolf, G.; Devor, M. Mesopontine neurons implicated in anesthetic loss-of-consciousness have either ascending or descending axonal projections, but not both. Neuroscience 2018, 369, 152–167. [Google Scholar] [CrossRef]
  33. Sukhotinsky, I.; Zalkind, V.; Lu, J.; Hopkins, D.A.; Saper, C.B.; Devor, M. Neural pathways associated with loss of consciousness caused by intracerebral microinjection of GABA A-active anesthetics. Eur. J. Neurosci. 2007, 25, 1417–1436. [Google Scholar] [CrossRef] [PubMed]
  34. Sukhotinsky, I.; Reiner, K.; Govrin-Lippmann, R.; Belenky, M.; Lu, J.; Hopkins, D.; Saper, C.; Devor, M. Projections from the mesopontine tegmental anesthesia area to regions involved in pain modulation. J. Chem. Neuroanat. 2006, 32, 159–178. [Google Scholar] [CrossRef] [PubMed]
  35. Reiner, K.; Sukhotinsky, I.; Devor, M. Mesopontine tegmental anesthesia area projects independently to the rostromedial medulla and to the spinal cord. Neuroscience 2007, 146, 1355–1370. [Google Scholar] [CrossRef] [PubMed]
  36. Pei, Y.; Dong, S.; Roth, B.L. Generation of designer receptors exclusively activated by designer drugs (DREADDs) using directed molecular evolution. Curr. Protoc. Neurosci. 2010, 50, 4.33.1–4.33.25. [Google Scholar] [CrossRef]
  37. Baron, M.; Vaso, K.; Avigdor, T.; Charit, Y.; Minert, A.; Devor, M. Anesthetic loss of consciousness induced by chemogenetic excitation of mesopontine effector neurons. Exp. Neurol. 2022, 357, 114169. [Google Scholar] [CrossRef]
  38. Avigdor, T.; Minert, A.; Baron, M.; Devor, M. Paradoxical anesthesia: Sleep-like EEG during anesthesia induced by mesopontine microinjection of GABAergic agents. Exp. Neurol. 2021, 343, 113760. [Google Scholar] [CrossRef]
  39. Sukhotinsky, I.; Hopkins, D.A.; Lu, J.; Saper, C.B.; Devor, M. Movement suppression during anesthesia: Neural projections from the mesopontine tegmentum to areas involved in motor control. J. Comp. Neurol. 2005, 489, 425–448. [Google Scholar] [CrossRef]
  40. Sukhotinsky, I.; Minert, A.; Soja, P.; Devor, M. Mesopontine switch for the induction of general anesthesia by dedicated neural pathways. Anesth. Analg. 2016, 123, 1274–1285. [Google Scholar] [CrossRef]
  41. Namjoshi, D.; Vukicevic, S.; Sanoja, R.; Soja, P.J. Spinal Cord Targets of Relevance to the Anesthesiologist, Chapter 7. In Neuroscientific Foundations of Anesthesiology; Mashour, G.A., Lydic, R., Eds.; Oxford University Press: New York, NY, USA, 2011; pp. 91–106. [Google Scholar]
  42. Meiri, G.; Lanir, S.; Minert, A.; Devor, M. Transient loss of consciousness during hypercapnia and hypoxia: Involvement of pathways associated with general anesthesia. Exp. Neurol. 2016, 284, 67–78. [Google Scholar] [CrossRef]
  43. Hayes, R.L.; Pechura, C.M.; Katayama, Y.; Povlishock, J.T.; Giebel, M.L.; Becker, D.P. Activation of pontine cholinergic sites implicated in unconsciousness following cerebral concussion in the cat. Science 1984, 223, 301–303. [Google Scholar] [CrossRef]
  44. Paxinos, G.; Watson, C. The Rat Brain in Stereotaxic Coordinates, 4th ed.; Academic Press: San Diego, CA, USA, 1998. [Google Scholar]
  45. Schindelin, J.; Arganda-Carreras, I.; Frise, E.; Kaynig, V.; Longair, M.; Pietzsch, T.; Preibisch, S.; Rueden, C.; Saalfeld, S.; Schmid, B.; et al. Fiji: An open-source platform for biological-image analysis. Nat. Methods 2012, 9, 676–682. [Google Scholar] [CrossRef]
  46. Mullen, R.J.; Buck, C.R.; Smith, A.M. NeuN, a neuronal specific nuclear protein in vertebrates. Development 1992, 116, 201–211. [Google Scholar] [CrossRef]
  47. Devor, M.; Zalkind, V.; Fishman, Y.; Minert, A. Model of anaesthetic induction by unilateral intracerebral microinjection of GABAergic agonists. Eur. J. Neurosci. 2016, 43, 846–858. [Google Scholar] [CrossRef]
  48. Reiner, K.; Sukhotinsky, I.; Devor, M. Bulbospinal neurons implicated in mesopontine-induced anesthesia are substantially collateralized. J. Comp. Neurol. 2008, 508, 418–436. [Google Scholar] [CrossRef]
  49. Baron, M.; Minert, A.; Devor, M. Pain and the evolutionary origins of subjective experience. Behav. Brain Sci. 2025, 48, e80. [Google Scholar] [CrossRef]
  50. Lanir-Azaria, S.; Meiri, G.; Avigdor, T.; Minert, A.; Devor, M. Enhanced wakefulness following lesions of a mesopontine locus essential for the induction of general anesthesia. Behav. Brain Res. 2018, 341, 198–211. [Google Scholar] [CrossRef] [PubMed]
  51. Ibraheem, A.; Vaso, K.; Minert, A.; Yatziv, S.-L.; Baron, M.; Devor, M. Loss-of-consciousness: Sources of GABAergic input to the mesopontine tegmental anesthesia area. Front. Neurosci. 2025, 19, 1594984. [Google Scholar] [CrossRef] [PubMed]
  52. Carli, G.; Farabollini, F. Neurophysiological mechanisms involved in tonic immobility (TI). Prog. Brain Res. 2022, 271, 145–166. [Google Scholar] [PubMed]
  53. Cataldi, J.; Stephan, A.M.; Haba-Rubio, J.; Siclari, F. Shared EEG correlates between non-REM parasomnia experiences and dreams. Nat. Commun. 2024, 15, 3906. [Google Scholar] [CrossRef]
  54. Chicago Tribune. Sleepwalking Canadian Walks on Murder Charge. Chicago Tribune News, 17 July 1988. Available online: https://www.chicagotribune.com/1988/07/17/sleepwalking-canadian-walks-on-murder-charge/ (accessed on 3 September 2025).
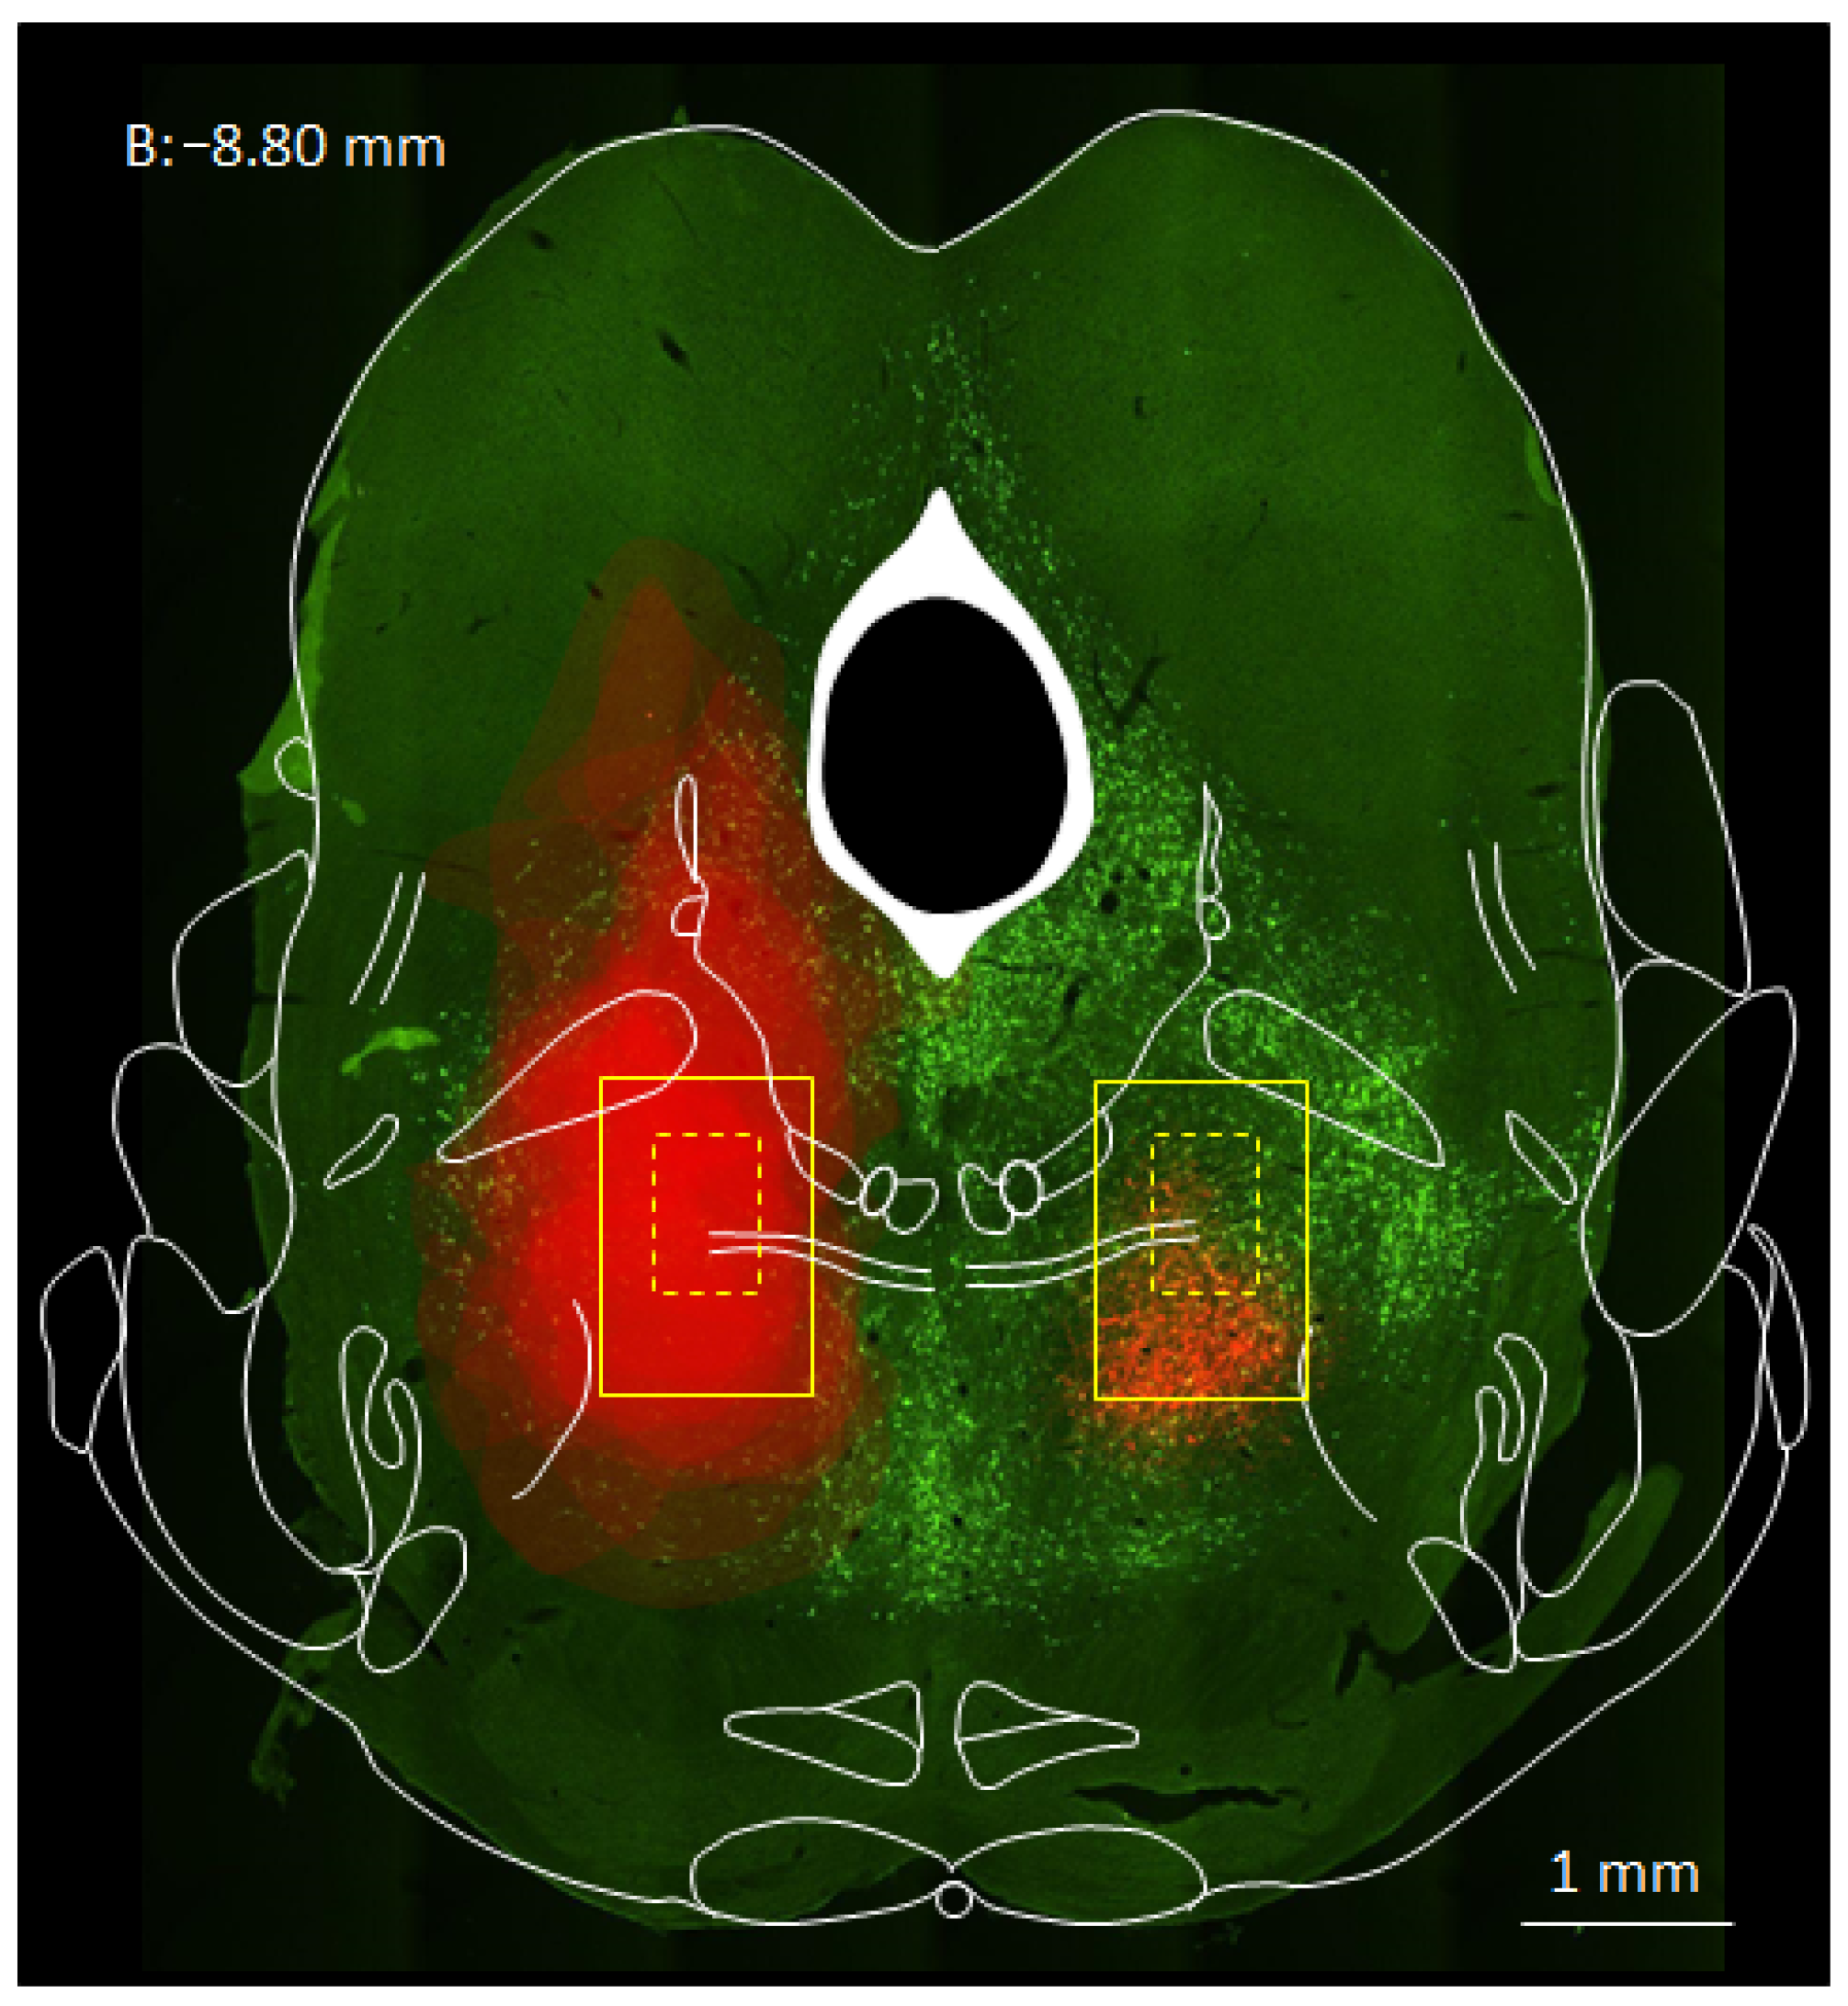
Figure 1. Frontal section through the rat mesopontine tegmentum (level −8.8 mm caudal to bregma) showing the location and boundaries of the MPTA (yellow squares, 1.0 mm × 1.5 mm), effector-neurons (red) and projection-neurons (green). The upper MPTA boundary is aligned with the dorsal raphe nucleus and the medial boundary 750 µm lateral to the midline. The location of a more focal region of interest (ROI) within the MPTA, the mMPTA, is marked by yellow dashed lines (0.5 mm × 0.75 mm). The cluster of red cells on the right shows effector-neurons infected by a single AAV8-mCherry microinjection (200 nL, rat# RDR119). The corresponding red cloud on the left shows superimposed transparencies of all 30 microinjections. Half were mirror-translated from the right to the left side. Green fluorescent dots are retrogradely labelled projection-neurons, some within the MPTA and others outside. On the left many are obscured by the cloud of effector-neurons labelled following the microinjection of FG into the iTh on the R side. White parcellation lines are from the rat brain atlas of Paxinos and Watson (1998) [44].
Anesthres 02 00026 g001
Figure 2. Location of retrograde tracer microinjections into the six MPTA projection-targets are indicated with blue patches on the left side of frontal rat brain sections from the rat atlas of Paxinos and Watson, 1998 [44]. Antero-posterior location from bregma is shown on each panel. (A) Medial prefrontal cortex (PFC medial division, 3 rats), (B) basal forebrain (BF, 4 rats), (C) zona incerta (ZI, 4 rats), (D) intralaminar thalamus (iTh, 4 rats), (E) rostroventromedial medulla (RVM, 6 rats), (F) cervical spinal cord level C3-4 (rat# MPTA361 bilateral dorsal horn, rat# MPTA360 left ventral horn). The blue patches were made by plotting all corresponding microinjections as superimposed transparencies. In the projection-targets illustrated about half of the microinjections were mirror-translated from the right to the left side. Corresponding Nissl-stained sections with parcellation lines (white) are shown on the right.
Anesthres 02 00026 g002
Figure 3. Close correspondence of density estimates of retrogradely labelled neurons from six MPTA projection-targets (neurons/mm2), using similar methods, but carried out by different individuals using different animals, indicates reliability of the methods used. Dark (blue) data points on the Y-axis represent results from Goldenberg et al. 2018 [32] Light (orange) data points on the Y-axis represent results from Lellouche et al. 2020 [31]. X-axis values (both colours) reflect observations from the current study.
Anesthres 02 00026 g003
Figure 4. Examples of single- (triangles) and double-labelled neurons (arrows) within the MPTA. Green immunofluorescence indicates neurons retrogradely labelled following microinjection of fluorogold (FG) or cholera toxin B-subunit (CTB) into one of the MPTA projection-targets (A) basal forebrain (BF); (B) intralaminar thalamus (iTh); (C) rostroventromedial medulla (RVM). Red fluorescence marks effector-neurons, cells expressing mCherry after infection by microinjection of AAV8-mCherry into the MPTA. Double-labelled neurons in the merged images (arrows, right column), which are projecting effector-neurons, usually appear yellow, but not always.
Anesthres 02 00026 g004
Figure 5. Not all neurons in the MPTA are effectors and/or projection neurons. (A) Pan-neuronal labelling of (unidentified) neurons within the mMPTA using anti-NeuN immunolabelling visualized with DAB (brown). (B) Image from the corresponding location (mMPTA) of a different rat showing effector-neurons (red) and projection neurons terminating within the intralaminar thalamus (iTh; FG (green)). Note the relative over-abundance of small diameter neurons in the NeuN immunolabelled panel A. Scale bar is identical for (A,B).
Anesthres 02 00026 g005
Table 1. Bilateral microinjection of the effector-neuron marker AAV8-mCherry into the MPTA was followed weeks later by unilateral microinjection of retrograde tracers FG or CTB into two of the six key MPTA projection-targets. Microinjection coordinates relative to bregma, the dural surface and the midline are indicated, as well as the tracers used and volumes microinjected.
MPTA
Bilateral
PFC *
Unilateral
BF
Unilateral
iTh *
Unilateral
ZI
Unilateral
RVM
Midline
SC
d/v Horn
anterior–posterior mm. post bregma−8.52.5, 3.1−0.5−3.3−3−11C3–4
dorsal–ventral
mm. below dura
−6.30.8−7.5−5, −6−7.5−100.5, 2.5
medio-lateral
mm. lateral to midline
±1.31.4, 1.92.51.21.50±1.5
number of cases
left/right
15/15
16 rats
3/02/23/11/362
retrograde tracer
FG/CTB
2/12/23/12/23/31/1
marker of effector-neuronsAAV8-mCherry
volume microinjected (nL)50–250200 × 4200200 × 2100–200100–200150–200
* PFC: Two microinjections at each of two A-P levels; iTh: microinjections at two different depths.
Table 2. Density estimates of (all) ipsilaterally projecting MPTA projection-neurons, and of the subset of projecting effector-neurons, those effector-neurons that send an axon to any of the six MPTA projection-targets. Projecting effector-neurons are double-labelled with CTB or FG, and also AAV8-mCherry. The percent of projecting effector-neurons among all MPTA projection-neurons is shown on the right.
Projection
Target
Ipsilateral
(n Rats CTB/FG)
CTB/
mm2
Singles
FG/
mm2
Singles
CTB + FG/
mm2 ± SD
Singles
CTB/
mm2
Doubles
FG/
mm2
Doubles
CTB + FG/
mm2 ± SD Doubles
CTB % DoublesFG % DoublesCTB + FG % Doubles
MPTA Projection-NeuronsProjecting Effector-EffectorsProjecting Effector-Neurons %
PFC (1/2)6.678.838.11 ± 4.990.000.780.52 ± 0.540.008.836.41
BF (1/2)12.6761.3345.11 ± 32.112.5026.1318.25 ± 24.1519.7342.6140.46
iTh (1/3)58.3377.0072.33 ± 23.9418.0431.6428.24 ± 11.3430.9341.0939.04
ZI (2/2)23.6797.8360.75 ± 44.3819.2631.8827.57 ± 12.4581.3732.5945.38
RVM * (2/3)32.61100.7268.85 ± 41.1516.5334.6025.57 ± 12.9050.6934.3537.14
SC * (1/1)43.0022.3332.67 ± 13.7029.4415.3322.38 ± 9.97 68.4768.6568.50
total 287.82 122.53
p-value0.111 0.223 0.801
* Mean of ipsilateral and contralateral combined.
Table 3. A large number of MPTA effector-neurons (n = 3727) were checked for double-labelling following microinjection of a retrograde tracer (CTB or FG) into one of the six previously identified MPTA projection-targets, ipsilateral or contralateral to the effector-neuron evaluated. The percent of double-labelled neurons, effector-neurons that send an axon to one or more of the six MPTA projection-targets (projecting effector-neurons), is given in the Total column (%).
Projection-
Target (n Rats)
Projecting Effector-Neurons
(Double-Labelled)
All MPTA Effector-Neurons Sampled
IpsiContraTotal (n)Ipsi (n)Contra (n)Total (n)Total (%)
PFC (3)2461822083901.5
BF (4)6415221621842364133.7
iTh (4)2049029438932371241.3
ZI (4)2456531052624176740.4
RVM * (6)4434431021102143.4
SC * (2)11411419619658.2
6 targets 1383 372737.1%
5 targets # 1377 333741.3%
* Ipsi- and contra-lateral values were not available separately and were therefore combined; # Excluding PFC due to minimal contribution.
Table 4. Density estimates of (all) contralaterally projecting MPTA projection-neurons, and of the subset of projecting effector-neurons, those effector-neurons that send an axon to any of the six MPTA projection-targets. Projecting effector-neurons are double-labelled with CTB or FG, and also AAV8-mCherry. The percent of projecting effector-neurons among all MPTA projection-neurons is shown on the right.
Projection-
Target
Contralateral
(n Rats CTB/FG)
CTB/mm2
Singles
FG/mm2
Singles
CTB + FG/
mm2 ± SD
Singles
CTB/mm2
Doubles
FG/mm2
Doubles
CTB + FG/mm2 ± SD
Doubles
CTB
% Doubles
FG
% Doubles
CTB +FG
% Doubles
MPTA Projection NeuronsMPTA Projecting EffectorsProjecting Effector-Neurons %
PFC (1/2)6.676.836.78 ± 4.830.791.431.21 ± 0.8311.8420.9417.85
BF (2/2)9.0073.1741.08 ± 37.548.7946.2327.51 ± 25.3197.6763.1866.97
iTh (1/2)54.6727.1736.33 ± 17.1620.9214.5116.65 ± 4.0938.2753.4045.83
ZI (2/1)17.1771.3335.22 ± 31.9412.8311.4912.38 ± 6.7174.7216.1135.15
RVM * (3/3)32.61100.7268.85 ± 41.1516.5334.6025.57 ± 12.9050.6934.3537.14
SC * (1/1)43.0022.3332.67 ± 13.7029.4415.3322.38 ± 9.9768.4768.6568.50
total 220.93 105.70
p-value0.212 0.488 0.377
* Mean of ipsilateral and contralateral combined.
Disclaimer/Publisher’s Note: The statements, opinions and data contained in all publications are solely those of the individual author(s) and contributor(s) and not of MDPI and/or the editor(s). MDPI and/or the editor(s) disclaim responsibility for any injury to people or property resulting from any ideas, methods, instructions or products referred to in the content.