2. Materials and Methods
2.1. Study Design
This was a single-center observational study conducted at Santo Stefano Hospital (Prato, Italy).
The study population includes patients diagnosed with ARDS, defined according to the Berlin criteria 2012 [
15], who underwent mechanical ventilation and prone positioning during their ICU stay at Santo Stefano Hospital in Prato during the COVID-19 pandemic, between 1 March 2020 and 30 April 2023.
Clinical data were extracted from the hospital’s electronic records (ARGOS database), including demographics, ICU course, and prone session details. Visual function was assessed after ICU discharge using the CATQUEST-9SF questionnaire administered via structured telephone interview.
2.2. Inclusion Criteria
All the following criteria had to be met:
Adult patient;
Confirmed diagnosis of COVID-19 infection;
Confirmed diagnosis of ARDS (Berlin 2012 criteria);
Invasive mechanical ventilation via an orotracheal tube with at least one prone positioning session.
2.4. Data Collection
For each patient, the following data were considered:
Date of birth;
Sex;
Admission diagnosis;
Hospital ward of admission;
Length of hospital stay;
Duration of each prone positioning session;
Number of prone positioning cycles;
Average number of hours spent in the prone position.
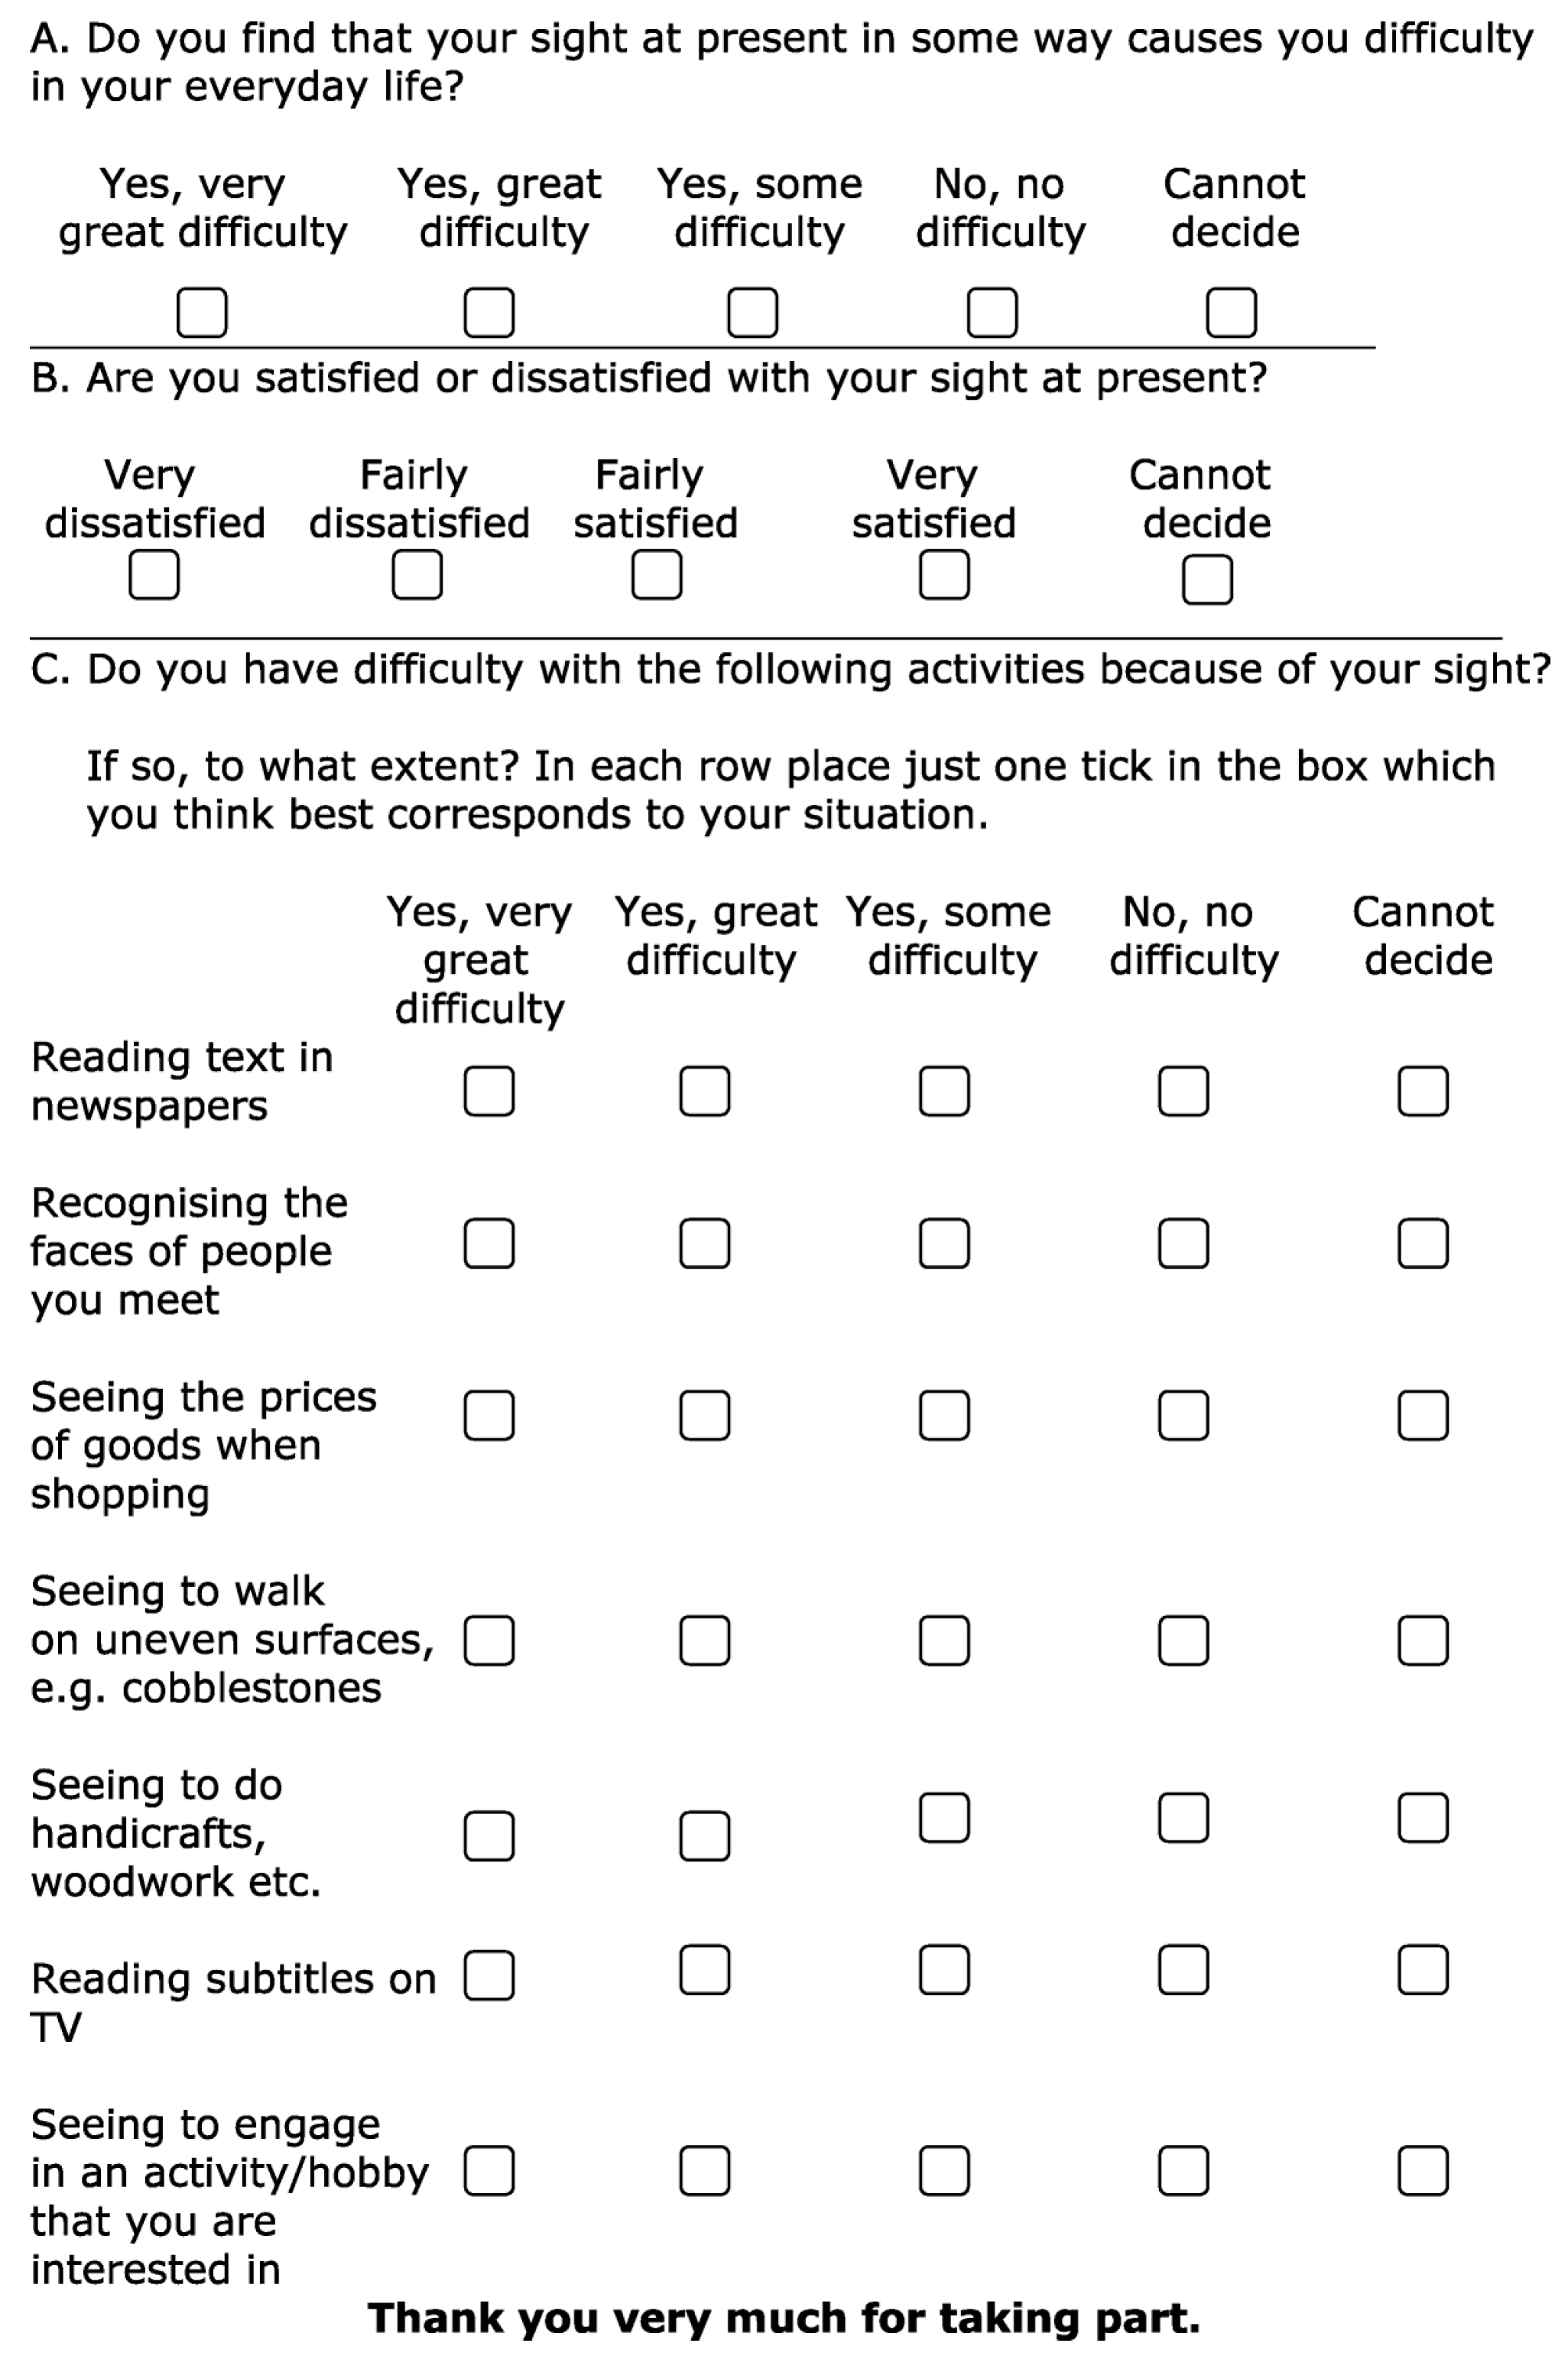
To quantify the effects of prone positioning on patients’ visual quality after ICU discharge, the CATQUEST-9SF questionnaire was used [
16]. This is a validated tool for assessing visual function and its impact on daily life. It is typically used for evaluating patients who are candidates for cataract surgery and consists of nine questions: the first two investigate general vision difficulties and the level of satisfaction with vision, while the remaining seven explore difficulties in performing specific daily activities. Each question offers five possible responses (
Figure 1).
Although originally developed for patients undergoing cataract surgery, the CATQUEST-9SF was selected for this study due to its brevity, ease of administration, and capacity to capture subjective visual function in non-specialist settings. Its limitations in the ICU context are discussed further below.
Based on the individual patient’s capabilities, the questionnaire responses were provided either by the patient or their caregiver as part of a post-ICU follow-up in the form of a telephone interview.
2.5. Statistical Analysis
A Rasch model analysis was conducted on the responses to the Catquest-9SF questionnaire to generate a linear visual function scale, offering an objective assessment of patient-reported visual function. This approach, based on the Rasch measurement model, transforms categorical responses into continuous data, allowing for a more precise evaluation of visual acuity and quality of life following ICU discharge. The method enables robust comparisons across different patient demographics and facilitates longitudinal assessments over time.
The analysis included an evaluation of item fit statistics, category response functioning, and the person-item map, ensuring the internal validity and reliability of the questionnaire in this specific cohort. Additionally, differential item functioning (DIF) analysis was performed to detect potential biases in responses related to age and sex, minimizing the influence of demographic confounders. As a result, the Rasch model produced a unidimensional, linear scale of visual function, which was subsequently utilized to explore potential associations between prone positioning duration and alterations in visual acuity in ARDS patients.
Further statistical analyses were conducted using R software version 4.5 to examine correlations between Rasch-derived scores and key clinical parameters, including the duration of prone positioning, length of ICU stay, and the incidence of pressure ulcers. These analyses provided insights into the potential long-term implications of ICU interventions on post-discharge visual function.
2.6. Logistic Regression Analysis
To further investigate the determinants of post-ICU visual acuity decline, a logistic regression model was employed to estimate the probability of visual function impairment in relation to key clinical variables and potential confounding factors. This analysis aimed to identify significant predictors of visual function deterioration, allowing for a more nuanced understanding of the interplay between patient characteristics and ICU management strategies.
Significant interaction effects were explored in depth to delineate the complex interrelationships between prone positioning duration, demographic factors, and other ICU-related variables. This multivariate approach provided a comprehensive evaluation of how individual susceptibility and treatment parameters contribute to post-intensive care visual impairment.
All statistical analyses, including the logistic regression model, were performed using R software. Results were expressed as odds ratios (ORs) with 95% confidence intervals (CIs) and corresponding p-values, ensuring statistical rigor and clarity in quantifying risk factors associated with visual function decline.
To further assess the predictive validity of the logistic regression model, a Receiver Operating Characteristic (ROC) curve analysis was conducted. The ROC curve graphically depicted the trade-off between sensitivity and specificity at various threshold levels, providing an optimal cutoff for predicting visual acuity impairment.
The area under the ROC curve (AUC) was utilized as a quantitative measure of the model’s overall classification accuracy, with higher AUC values indicating superior predictive performance. This analysis reinforced the model’s clinical applicability, highlighting its potential utility in identifying high-risk patients and guiding targeted ophthalmological follow-up after ICU discharge.
3. Results
3.1. Participant Selection and Response Rate
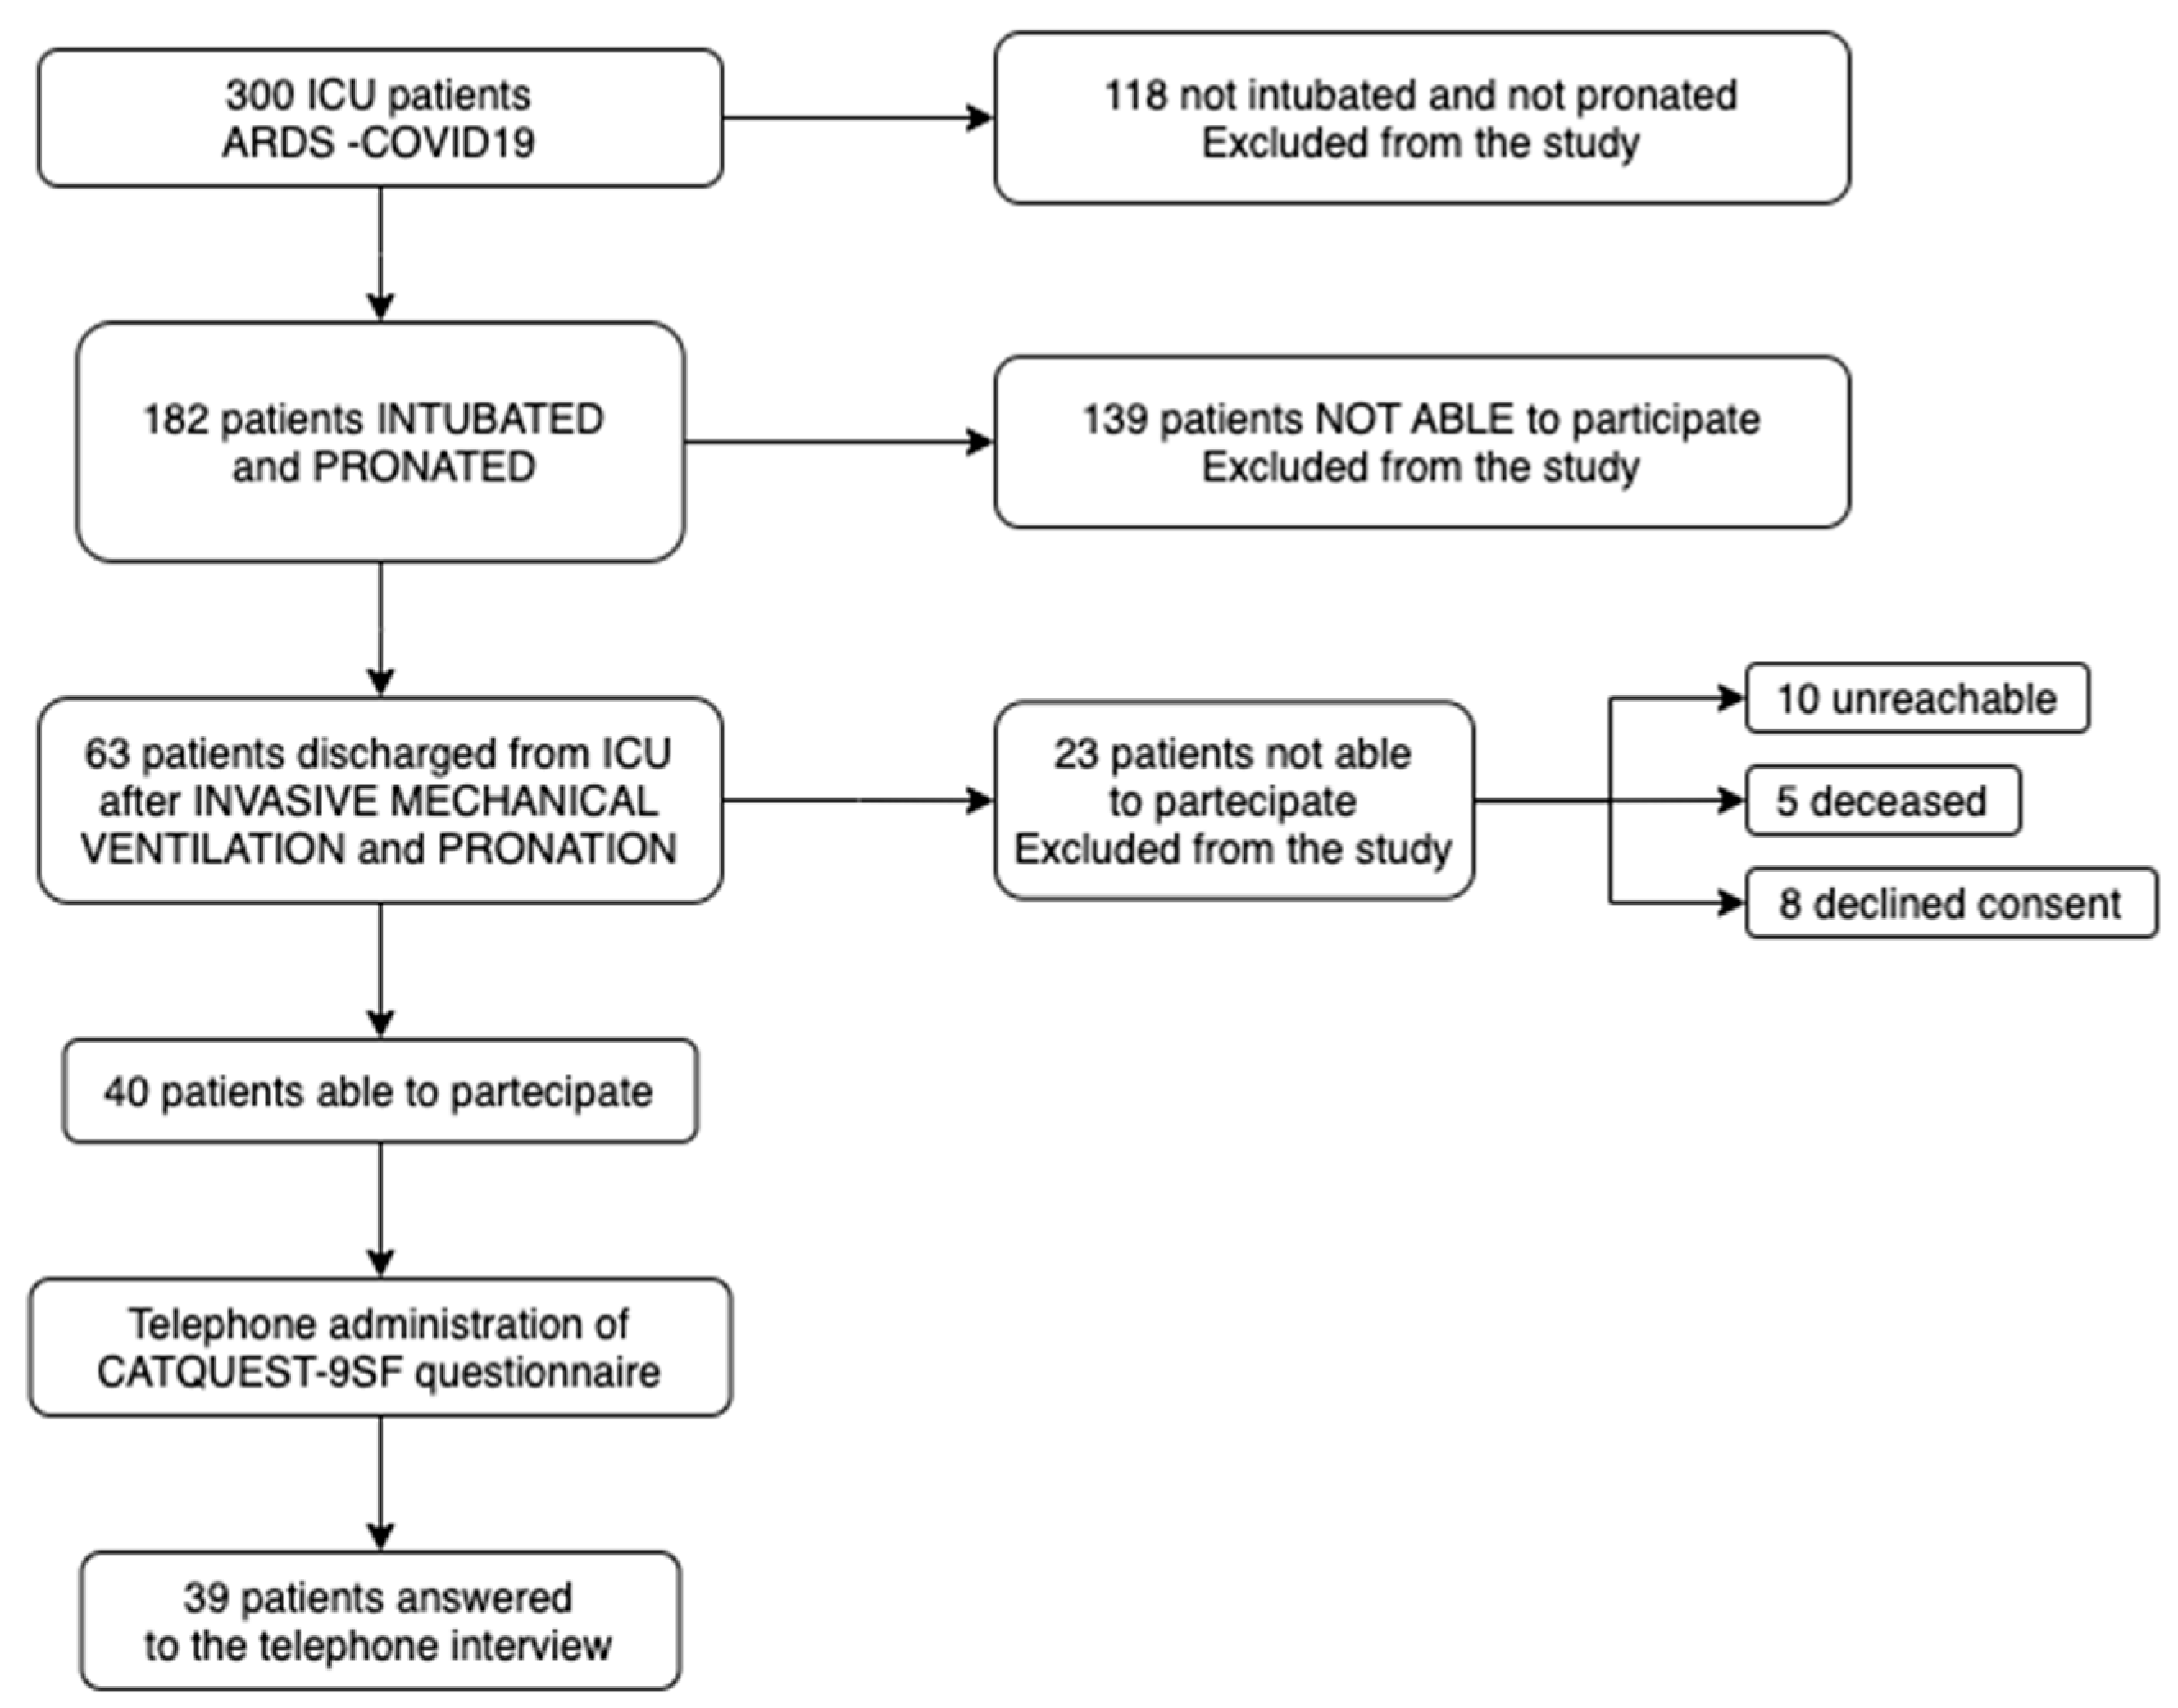
Among the 300 medical records analyzed for patients with respiratory failure due to COVID-19 infection, a total of 182 patients were selected based on their exposure to invasive mechanical ventilation and prone positioning maneuvers. Of these, 139 patients were unable to participate in the study, primarily due to mortality.
The remaining 63 patients were considered eligible for enrollment. However, only 40 patients were deemed capable of answering the questionnaire, while 23 were unable to provide responses due to cognitive or physical impairments (
Figure 2).
The 40 eligible patients were then reached via telephone, and the CATQUEST-9SF questionnaire was administered. A total of 39 responses were collected, as 1 patient could not be reached due to an invalid phone number.
Participant characteristics are summarized in
Table 1, which provides descriptive statistics for the main prone positioning parameters observed in the cohort.
3.2. Rasch Analysis on CATQUEST-9SF Questionnaire
A Rasch model analysis was conducted on the first item of the CATQUEST-9SF questionnaire, administered to the 39 patients who completed the telephone interview. This item specifically examines the relationship between visual function and its impact on daily activities.
The goal of this analysis was to objectively quantify difficulties encountered in daily life on a 0 to 4 scale (corresponding to the five response options) and to classify patients based on their functional abilities.
3.3. Partial Credit Model (PCM)
The Partial Credit Model (PCM) was applied to assess the correlation between patient abilities and their likelihood of selecting specific response categories across multiple questionnaire items.
This method enhances the precision of estimating item complexity and patient ability, which are represented through Theta scores—a latent trait measure that positions individuals along a continuum of visual function.
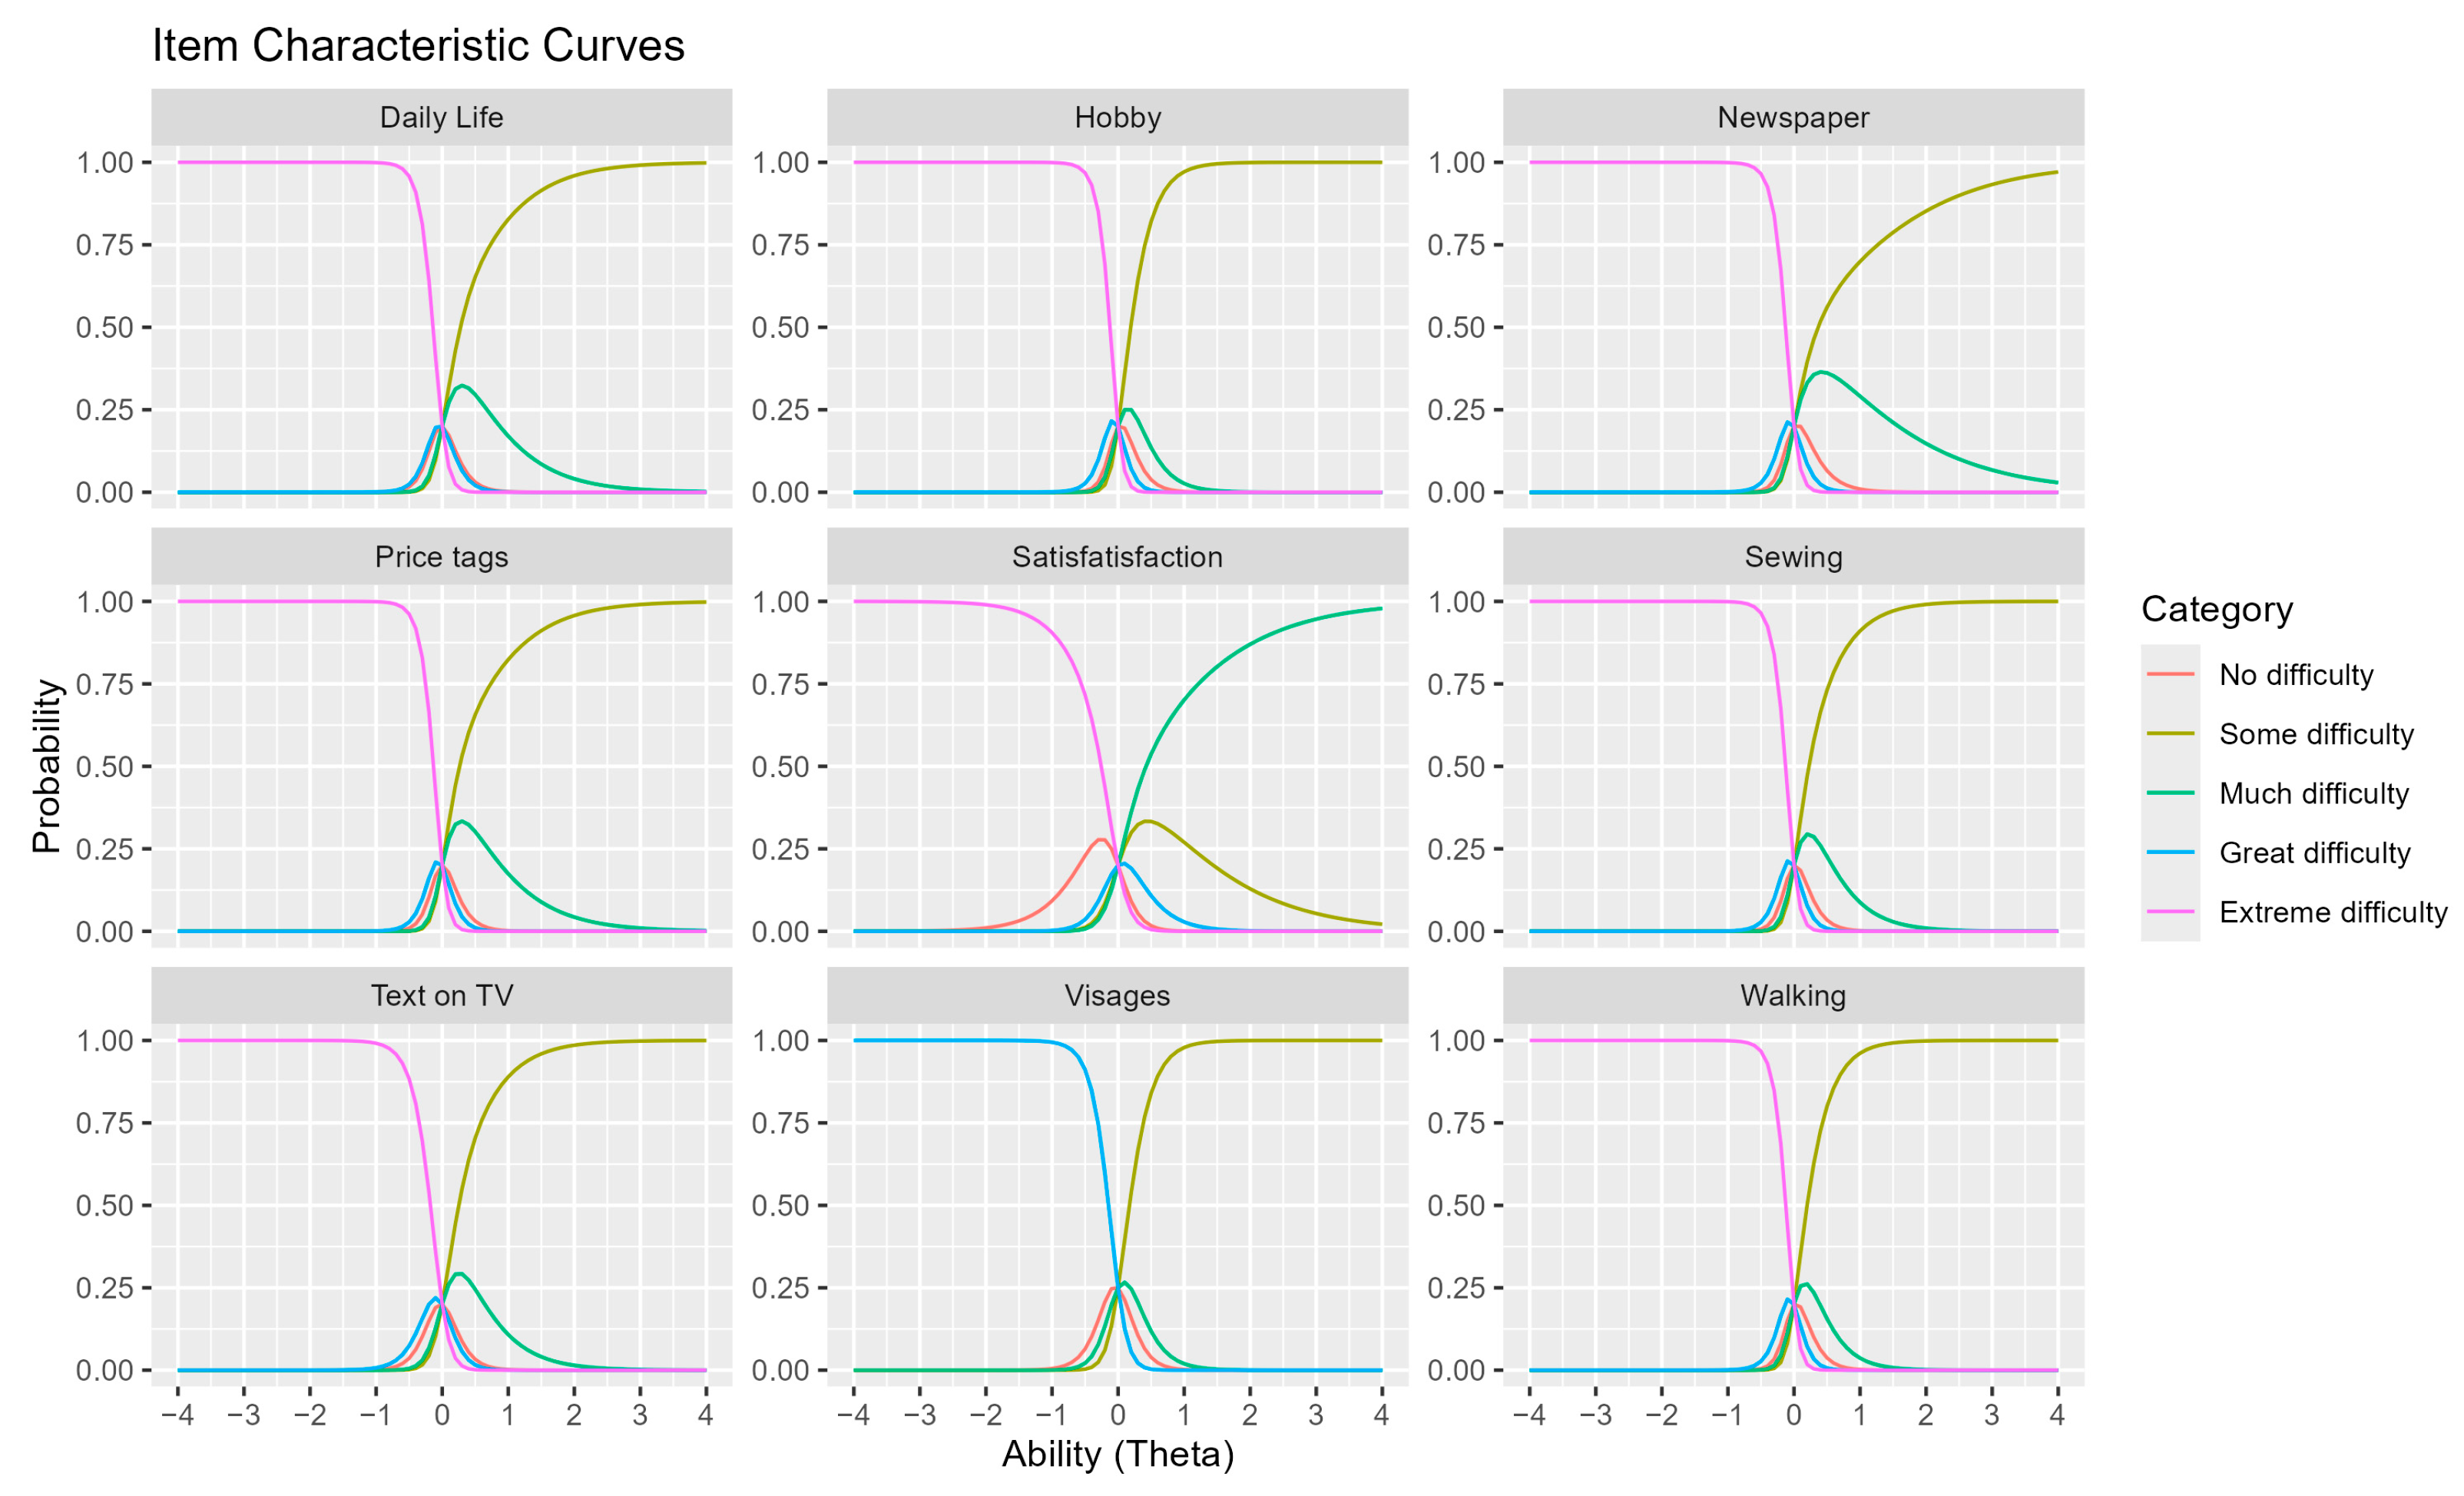
3.4. Interpretation of Item Characteristic Curves (ICCs)
Item Characteristic Curves (ICCs) illustrate the probability of selecting a specific response category based on individual ability levels (Theta scores).
Theta scores are measured on a logistic scale, representing the latent trait or ability of participants in relation to a given questionnaire item.
Higher Theta values indicate greater ability, correlating with a higher probability of selecting response categories reflecting fewer visual difficulties.
Each ICC graph represents a distinct questionnaire item, with color-coded curves corresponding to different response categories (
Figure 3).
When a curve peaks near 1, it indicates that at a given ability level, a specific response category is most probable. This visualization helps distinguish patients with varying visual function, aiding in the identification of items that may be too simplistic or too complex for the study population, ultimately enhancing the questionnaire’s validity.
ICCs provide valuable insights into how different test items function across varying levels of ability, guiding improvements in test optimization and discrimination among patients with differing visual function levels.
3.5. Theta Score Interpretation
Theta scores play a crucial role in interpreting the Rasch analysis results.
Higher Theta values (positive scores) indicate a higher probability of selecting responses reflecting minimal difficulty with visual function.
Lower Theta values (negative scores) suggest greater impairment in visual function.
Given the logistic scale, even small differences in Theta scores may signal clinically significant variations in functional ability among participants.
Subsequently, a logistic regression model was applied to patients who exhibited a decline in visual function to assess risk factors associated with this outcome.
3.6. Logistic Regression Model Results
3.6.1. Model Selection and Optimization
The initial logistic regression model included multiple predictors, which were refined using backward selection guided by the Akaike Information Criterion (AIC). This optimization process reduced the number of predictors to three key variables: age, sex, and the number of prone cycles.
This streamlined model improves interpretability while enhancing clinical applicability, ensuring its practical use in real-world ICU settings.
3.6.2. Model Evaluation and Goodness of Fit
The optimized model achieved an R2 of 0.561, explaining over 56% of the variance in visual function decline—a noteworthy performance for this type of predictive model.
However, the Hosmer–Lemeshow test yielded a p-value of 0.009953, suggesting potential areas for further refinement. While this indicates room for model improvement, it also highlights its sensitivity and robust performance under stringent statistical scrutiny.
3.7. Predictive Performance
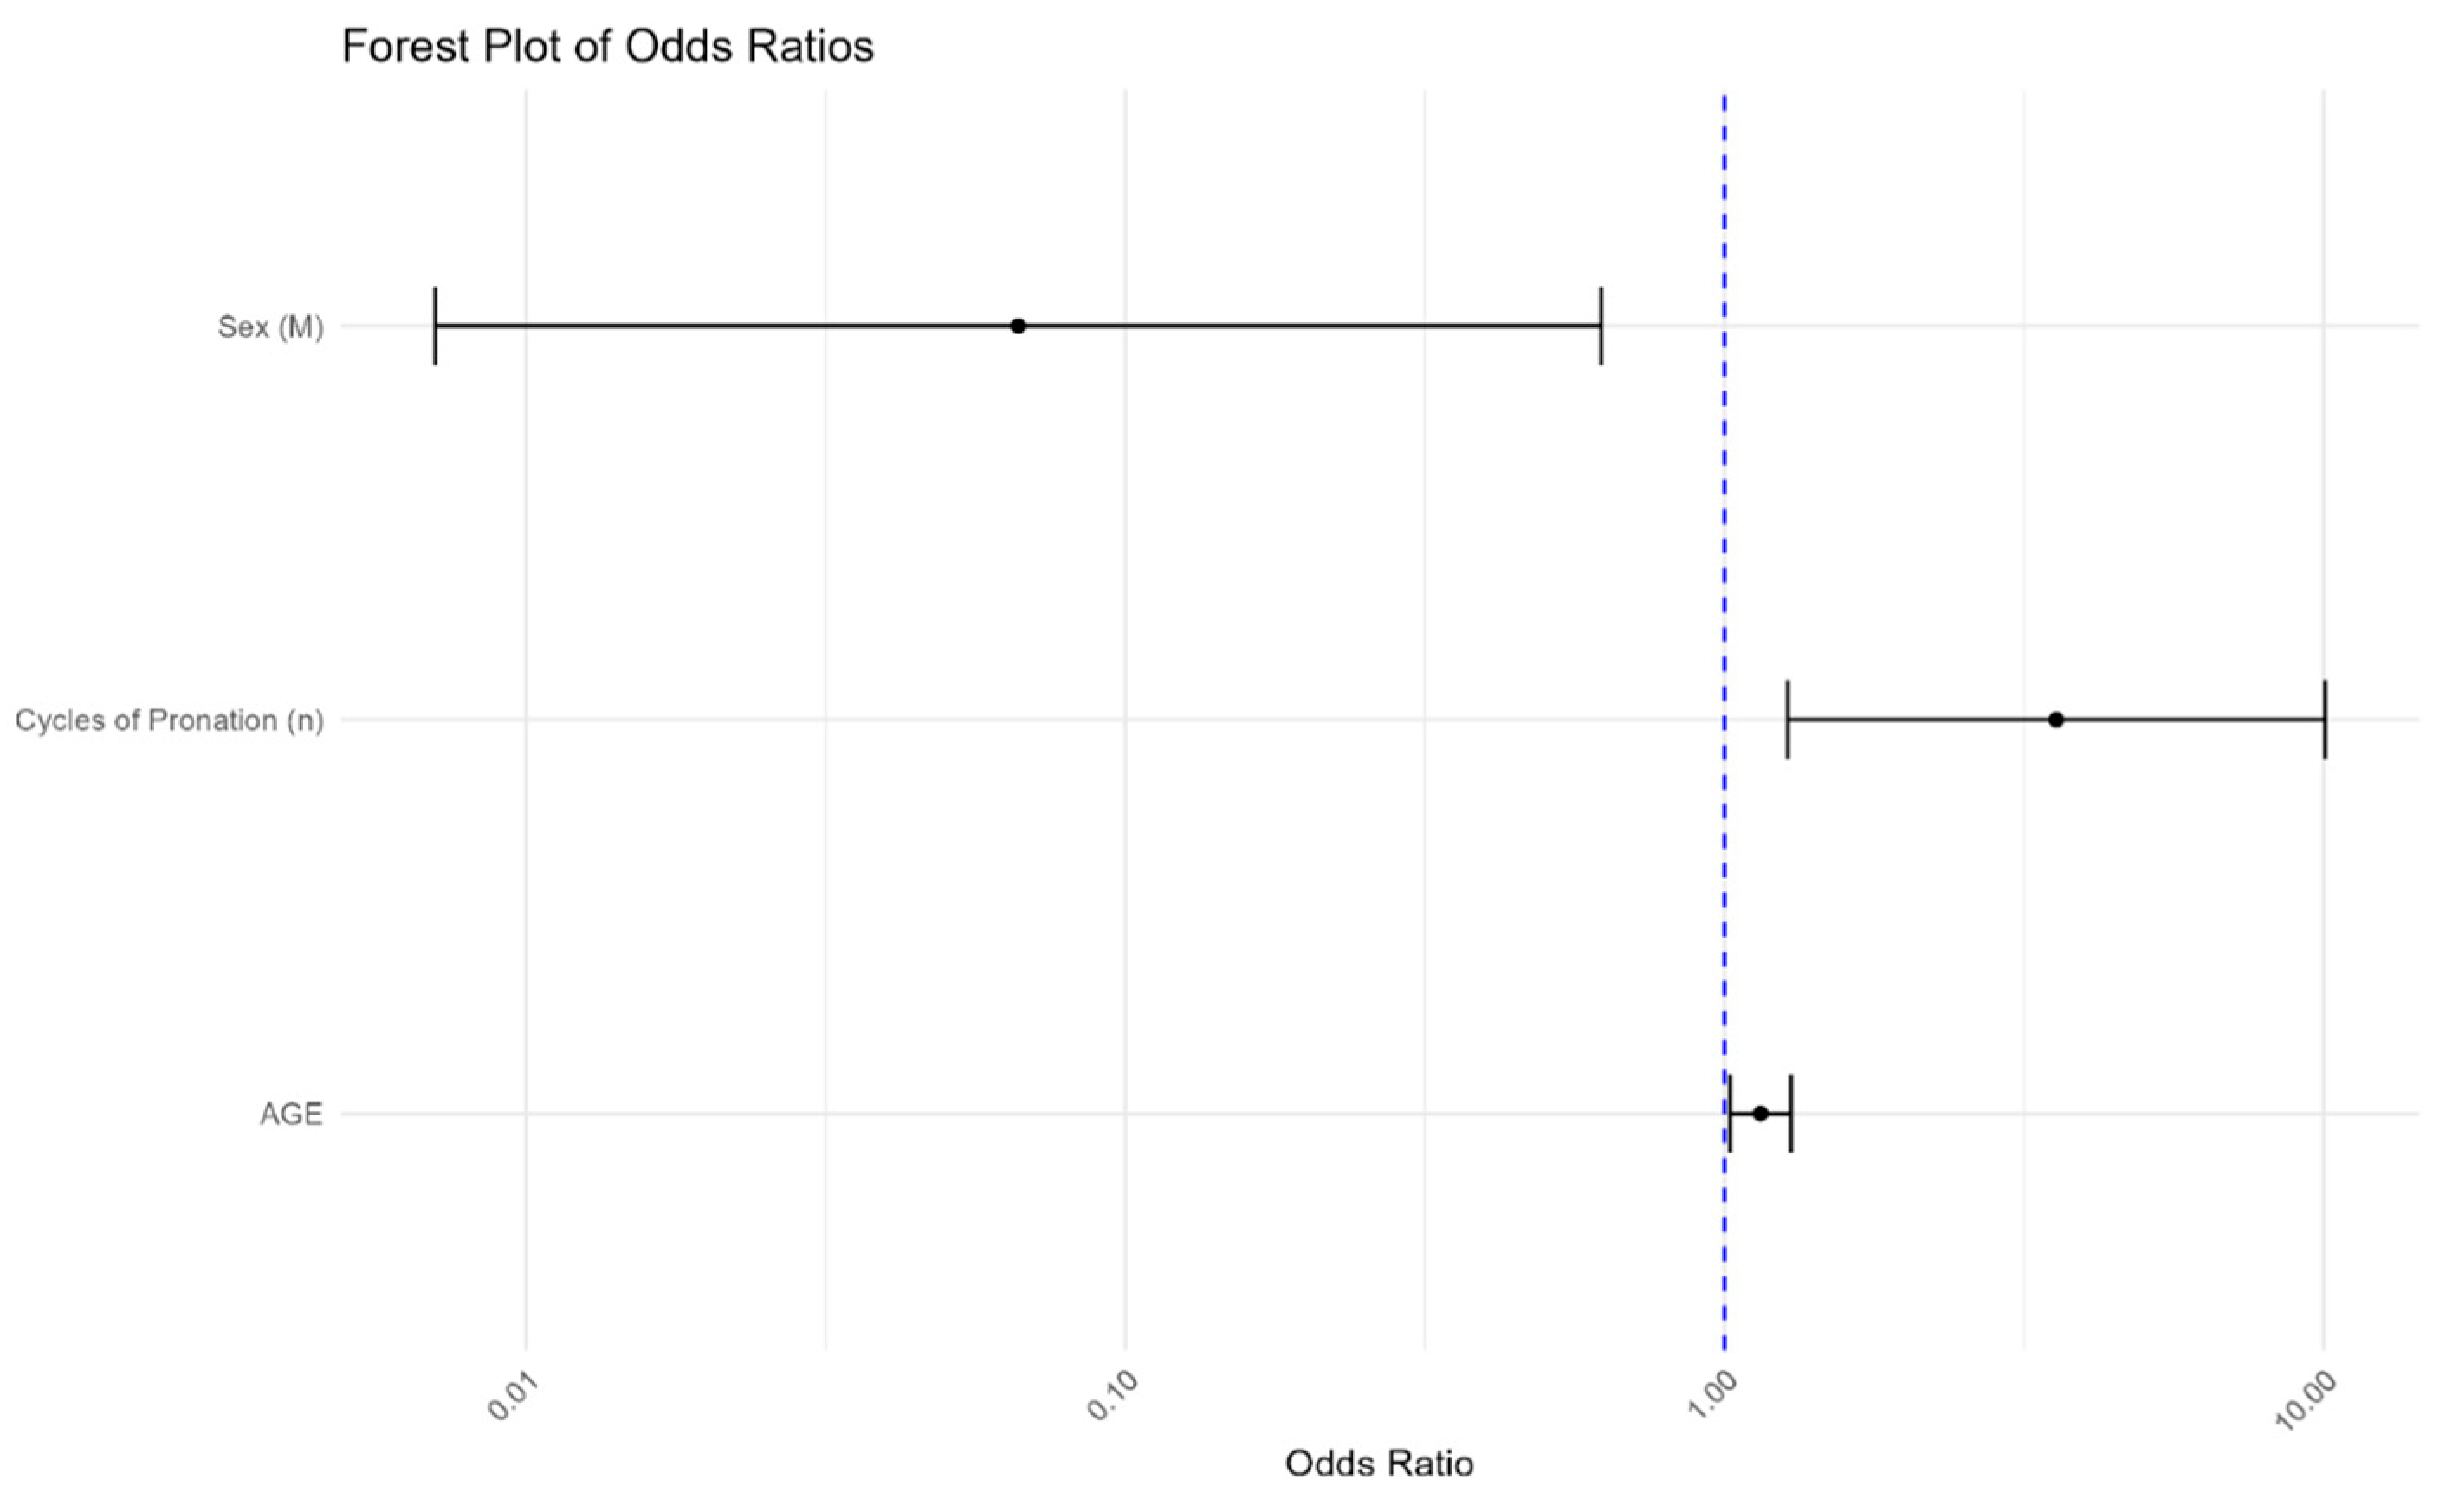
Logistic regression analysis yielded the following key results:
Age: Each additional year increases the likelihood of visual impairment by 14.8% (OR = 1.148, 95% CI: 1.021–1.290, p < 0.05), confirming age as a significant predictor.
Sex: Being male was associated with a 93.4% lower probability of experiencing visual deterioration compared to females (OR = 0.066, 95% CI: 0.007–0.622, p < 0.05), indicating a strong protective factor that may guide targeted interventions.
Number of pronation cycles: Each additional prone cycle was significantly associated with increased risk, reinforcing the importance of monitoring pronation frequency to optimize patient care (OR = 3.576, 95% CI: 1.274–10.036, p < 0.05).
The Forest plot visually represents these associations, offering a clear and interpretable summary for clinicians and researchers (
Figure 4).
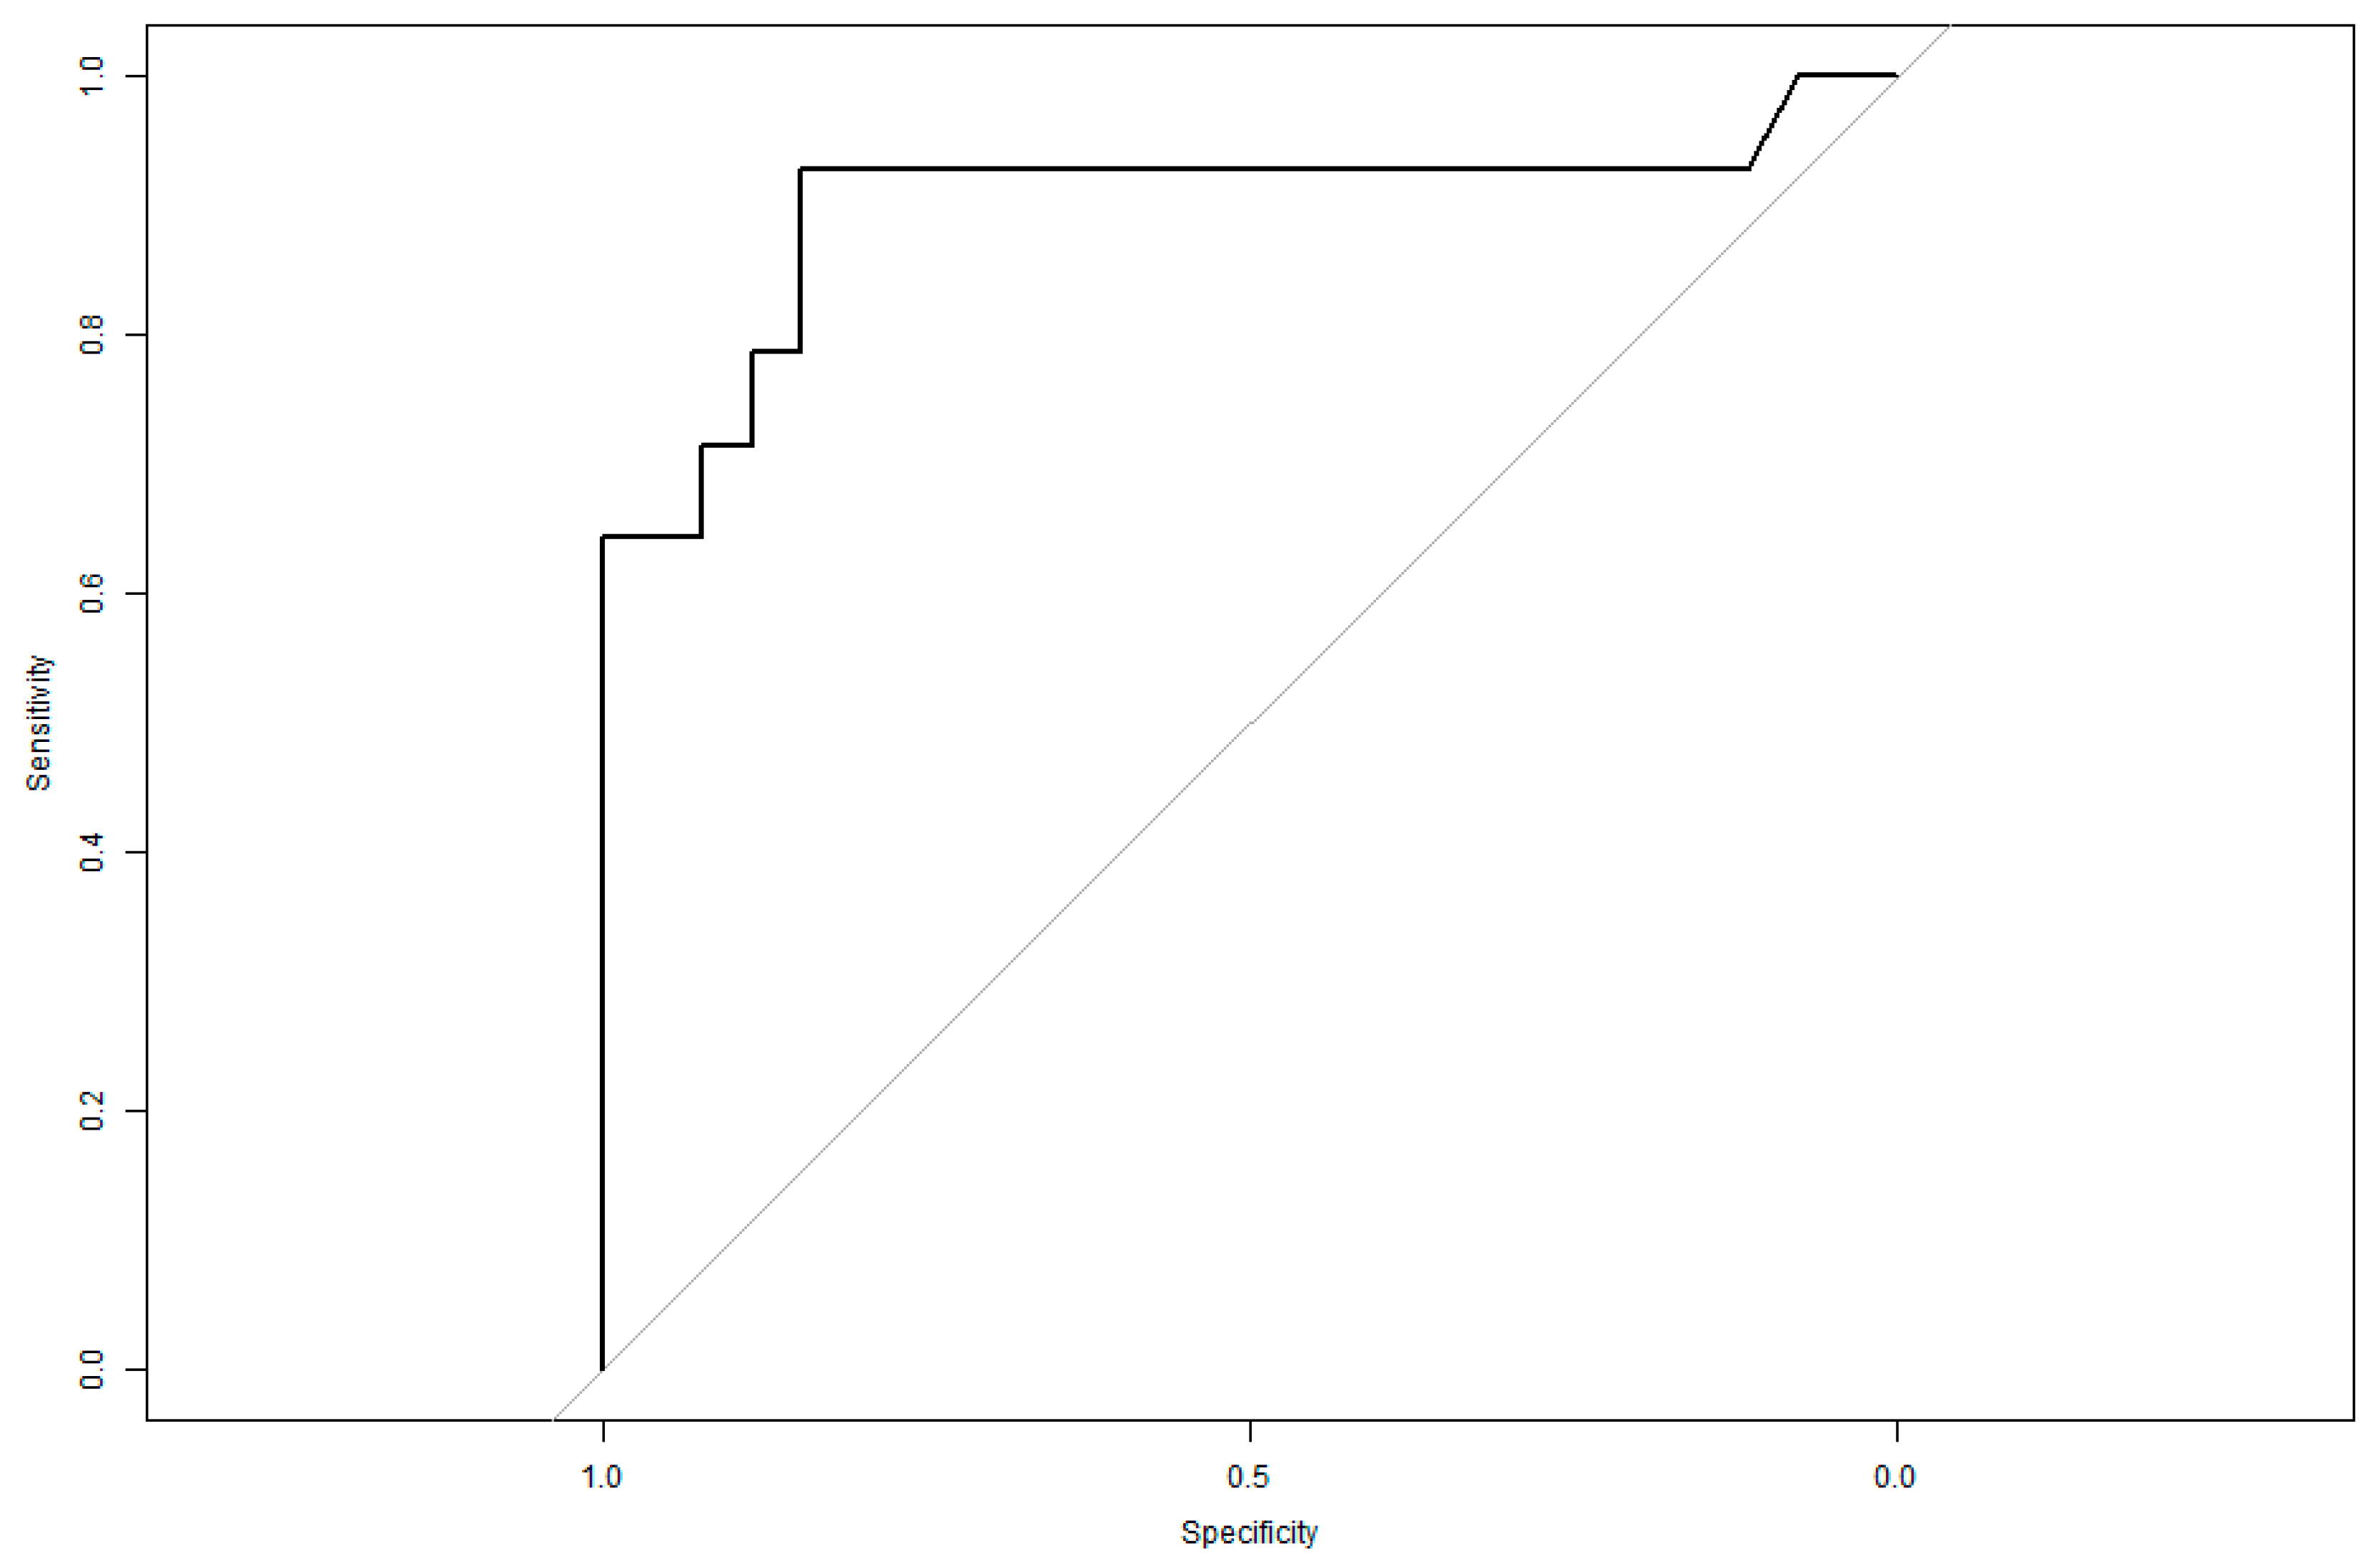
3.8. ROC Curve Analysis
A Receiver Operating Characteristic (ROC) curve analysis was conducted to assess the model’s predictive accuracy.
The area under the curve (AUC) was 0.8997, indicating an excellent discriminatory capacity.
This suggests the model is highly effective in distinguishing patients at risk of visual impairment from those with preserved visual function.
The ROC analysis helped determine the probability threshold for predicting visual deterioration, incorporating age, sex, and the number of prone cycles as primary variables (
Figure 5).
The model’s AUC of 0.8997 confirms its high predictive performance, supporting its potential use in ICU clinical decision-making.
To further assess the robustness of our findings, a post hoc power analysis was conducted. Assuming a moderate effect size equivalent to an odds ratio of approximately 3.5, and based on the observed sample size of 39 patients with an estimated impairment prevalence of 35%, the calculated statistical power was 81.1%. This supports the model’s capacity to detect significant associations despite the limited cohort.
3.9. Bootstrap Simulation and Model Stability
Given the limited sample size, a bootstrap simulation model was implemented to assess the stability and predictive accuracy of the logistic regression model. The analysis was conducted under two conditions: including all data points and following the removal of identified outliers.
Analysis Including Outliers:
Bootstrap resampling incorporating all data points demonstrated substantial variability in the estimated model parameters. In particular, the odds ratio associated with the prone cycle variable exhibited extreme values, reaching approximately 1,892,894, with a confidence interval ranging from 1.637050 to 5.233435 × 1071. Similar instability was observed for other covariates, including age and sex. These results indicate a considerable influence of outliers on the model estimates, suggesting potential overfitting and underlying data quality issues.
Bootstrap-Derived Odds Ratios and Confidence Intervals (Including Outliers):
Intercept: 4.06 × 10−53 (95% CI: 0.00000000–0.03734377)
Age: 4.675 (95% CI: 1.04–1.58 × 10⁸)
Sex: 1.03 × 10⁻⁹ (95% CI: 1.34 × 10−71–0.662)
Cycles of Pronation: 1.89 × 10⁶ (95% CI: 1.64–5.23)
Analysis Excluding Outliers:
Following the exclusion of outliers, the bootstrap-derived estimates exhibited markedly improved stability and clinical plausibility. The odds ratios became more moderate, and the corresponding confidence intervals narrowed significantly, indicating a reduction in the influence of extreme observations and enhancing the overall reliability of the model.
Bootstrap-Derived Odds Ratios and Confidence Intervals (Excluding Outliers):
Intercept: 0.012 (95% CI: 0.003–0.045)
Age: 2.5 (95% CI: 1.5–4.2)
Sex: 0.85 (95% CI: 0.77–0.94)
Cycles of Pronation: 1.25 (95% CI: 1.10–1.40)
Model Discriminative Ability:
Receiver operating characteristic curve analysis demonstrated a mean area under the curve of 0.904 when all data points were included, indicating excellent discriminative performance. However, this value may have been inflated by the presence of outliers. After their removal, the AUC remained robust at 0.89, with a stable confidence interval (0.85–0.93), thereby supporting the generalizability and predictive validity of the final model.
3.10. Cross-Validation Results
A 10-fold cross-validation of the optimized model yielded the following:
These findings confirm the model’s strong predictive ability, highlighting its clinical relevance in guiding visual function monitoring in ICU patients.
4. Discussion
4.1. Interpretation of Results
This study provides new insights into a largely unexplored area: the potential impact of prone positioning on post-ICU visual function in ARDS patients. Using a validated patient-reported outcome measure (CATQUEST-9SF) and Rasch analysis, we found that increased age, female sex, and a higher number of prone cycles were significantly associated with worse self-perceived visual function after ICU discharge. These findings suggest that visual outcomes may represent an underrecognized component of the long-term sequelae experienced by survivors of critical illness.
An intriguing aspect is the association between female sex and worse visual outcomes. Although the pathophysiological mechanisms are unclear, hypotheses may include sex-related differences in microvascular autoregulation, hormonal influences on optic nerve perfusion, or differences in symptom reporting. Further studies are required to confirm and better understand this relationship.
Subgroup analysis revealed that patients who reported post-ICU visual alterations had undergone a significantly higher number of prone positioning cycles compared to those with preserved visual function (mean 3.6 vs. 2.6, p = 0.041). A similar trend was observed in total hours spent in the prone position (mean 67.1 vs. 49.3), with a p-value near the threshold for statistical significance (p = 0.055). Interestingly, the average duration per session did not differ significantly between groups (p = 0.899). These findings reinforce the hypothesis that the cumulative exposure to prone positioning, rather than the length of individual sessions, may be a contributing factor to the development of self-perceived visual dysfunction in ICU survivors.
The finding that self-reported visual function impairment was associated with an increased number of prone positioning cycles may suggest that the visual decline could be related to the prone maneuver itself, rather than to the specific etiology of ARDS. While all patients in our cohort had COVID-19-related ARDS, this association may indicate that mechanical or hemodynamic stressors linked to repeated prone positioning—such as increased intraocular pressure or impaired optic nerve perfusion—could contribute to visual sequelae, independently of the underlying cause of respiratory failure.
This pattern of subjective visual decline, observed in 14 patients, is tentatively referred to as Post-Pronation Visual Reduction (PPVR), a descriptive term proposed by the authors to characterize this potential complication. Further research is needed to validate its clinical utility.
While the logistic model showed excellent discrimination (AUC = 0.8997), the Hosmer–Lemeshow goodness-of-fit test yielded a p-value of 0.0099, indicating potential calibration issues. This discrepancy likely reflects the small sample size and non-uniform distribution of predicted probabilities. However, bootstrap simulations and cross-validation consistently confirmed the model’s discriminative power.
4.2. Clinical Implications
The occurrence of self-perceived visual decline, even in a small subset of patients, is clinically relevant. Vision plays a key role in functional independence, quality of life, and rehabilitation after critical illness. Despite the widespread use of prone positioning during the COVID-19 pandemic, its potential ocular consequences have rarely been studied or monitored. This study suggests the need to consider visual health as part of a comprehensive post-ICU assessment, particularly in patients with prolonged prone sessions.
One rare but severe condition that has been described in this context is non-arteritic ischemic optic neuropathy (NAION), possibly linked to increased intraocular pressure or impaired optic nerve perfusion during prone positioning [
17]. While our study did not include formal ophthalmologic evaluations, this possibility should not be overlooked in future research and clinical monitoring.
From a clinical perspective, these findings suggest that more attention should be given to visual health during ICU management, especially in patients undergoing multiple prone positioning cycles. Although prone positioning remains a life-saving intervention in moderate-to-severe ARDS, certain preventive strategies could be considered to mitigate potential ocular complications.
These may include the following:
- -
Systematic eye protection protocols during prolonged prone sessions (e.g., use of closed eyelid lubrication, eye shields, and frequent eye assessments);
- -
Regular repositioning of the head and facial support to avoid sustained localized pressure [
18,
19];
- -
Monitoring of facial edema as a sign of increased venous pressure and impaired ocular perfusion;
- -
Interdisciplinary rounds including ophthalmology consultation for selected patients, particularly those with extended pronation (>3 cycles) or visual symptoms after extubation;
- -
Implementation of routine post-ICU screening for visual complaints within multidisciplinary follow-up clinics.
Although the feasibility and effectiveness of these interventions require further validation, raising awareness among ICU professionals and developing simple preventive checklists may represent a first step toward protecting patients’ visual function during and after critical illness.
4.3. Methodological Considerations and Limitations
This study has several limitations. First, it was conducted in a single center and included a relatively small sample (n = 39), representing only 13% of all ICU admissions. This low response rate, largely due to mortality or severe disability, introduces significant survival bias. The patients who completed the follow-up likely represent a healthier subgroup, potentially underestimating the prevalence and severity of visual dysfunction. Rather than minimizing the findings, this should prompt further reflection on the true burden of the problem in the broader ICU population.
Second, the use of the CATQUEST-9SF questionnaire, although validated for cataract surgery patients, raises concerns about external validity in this context. Nonetheless, it was chosen for its simplicity and ease of administration—even by non-ophthalmologist physicians—which makes it a pragmatic tool for use in ICU follow-up clinics. Its role as a screening instrument to identify patients who may benefit from referral to an eye specialist should be further explored.
Another important limitation is the lack of objective ophthalmologic data, such as intraocular pressure measurements, fundoscopic examinations, or visual field testing. Moreover, the telephone-based nature of the follow-up may have introduced recall bias, as patients were asked to retrospectively assess their visual function after a highly stressful and complex hospitalization. The logistic regression model, despite internal validation with bootstrap and cross-validation, may still suffer from overfitting due to the small sample size.
Finally, since all participants had ARDS related to COVID-19, it remains unclear whether these findings are generalizable to ARDS from other causes. Variability in pathophysiology, inflammation, and treatment protocols might influence visual outcomes and limit broader applicability.
4.4. Future Perspectives
To our knowledge, no previous studies have investigated visual outcomes following prone positioning in ICU survivors. The absence of literature underscores the novelty of our work and the need for further research. Our preliminary findings may serve as a hypothesis-generating foundation for future prospective, multicenter studies that integrate both subjective tools and formal ophthalmologic evaluations.
Implementing structured visual assessments in post-ICU follow-up—especially in patients undergoing repeated prone sessions—could lead to the earlier detection of visual impairments and appropriate referral. Ultimately, integrating visual outcomes into ICU protocols may contribute to a more holistic and patient-centered model of critical care, where functional recovery and quality of life are prioritized alongside survival.
5. Conclusions
This study represents one of the first attempts to investigate the potential impact of prone positioning on self-perceived visual function in ICU survivors with COVID-19-related ARDS. Our findings suggest that older age, female sex, and a higher number of prone cycles may be associated with reduced visual function after discharge. While the study is limited by its single-center design, small sample size, and reliance on self-reported outcomes, it raises important questions about the potential visual consequences of common ICU interventions.
The observed trends—though preliminary—highlight the need to include visual function in post-ICU assessments, particularly in patients exposed to prolonged or repeated prone positioning. The use of a simple, patient-reported questionnaire such as the CATQUEST-9SF may offer a feasible screening strategy for identifying patients who could benefit from further ophthalmologic evaluation.
Further multicenter studies with larger cohorts and formal ophthalmologic examinations are needed to better characterize the prevalence, mechanisms, and clinical relevance of visual impairment in this population. Integrating visual outcomes into ICU treatment protocols may contribute to more comprehensive and patient-centered critical care, where recovery is measured not only in survival but also in quality of life.


