Abstract
The research related to subsea inspection, and the prediction of corrosion is a challenging task, and the progress in this area is continuously generating exciting new developments that may be used in subsea inspection. Wall thickness monitoring is an important tool to control and predict corrosion, such as on platforms for the infrastructure of floating offshore wind power production. This study shows the results obtained in marine environments. For this experiment, a steel plate equipped with ultrasound transducers was placed in seawater to corrode naturally. The sensor test setup consisted of 15 ultrasound transducers and 1 temperature sensor, which were installed in the cassette. The data acquisition system was based on a standard industrial computer with software written in Python and MATLAB. The ultrasound signals were collected at regular intervals and processed to calculate the instantaneous wall thickness. The progress of corrosion was evaluated by trend plots of wall thickness versus time, and the change in shape of the ultrasonic back wall reflection waveform measured by each sensor.
1. Introduction
In the last few years, renewable energies have gained significant importance, especially offshore wind energy, and Europe is a leader for offshore wind turbine (OWT) manufacturing [1]. As is well known, there are two types of OWT structures: fixed platforms, which are principally located in shallow waters, and floating platforms, which are installed in deep waters [2]. In the last decades, there has been strong evidence to indicate that the future of offshore wind is centered around floating structures [2]. Presently, the energy produced using renewable energies has an important impact on the world. For this reason, it is essential to reduce downtime and ensure maximum availability in any system of the industrial environment, which is a need common to every sector and application. The integration of the reliability and availability of all the components assumes vital importance for the performance of any industrial system. To analyze the reliability of any system or component, it is important to clearly understand what a system or component’s failure is in order to gain a better understanding of the potential failure modes that can cause a failure, both at the component level and through propagation to the system level. A failure is the event that ends the ability of a component or system to perform the required function. Each system function may have several failure modes, which can involve different component failure modes; thus, it is important to have the system failures clearly defined [3,4], and corrosion is one of the main causes that can produce offshore structural failure [5,6,7].
As is well known, marine corrosion is a complex process, especially for steel structures. There are many interactions involving the metal matrix and the marine environment that change the corrosion. This interaction is affected by several factors, such as temperature, water depth, water temperature, dissolved oxygen, pH, and salinity, which are flagged as the most important ones [2,8].
In the literature [8], it is described that the corrosion in an OWT has been observed at different locations, and it must be specified that there are various corrosion mechanisms existing. To understand the different mechanisms, it is important to consider the different regions or zones according to the environment of exposure, such as the atmospheric zone, splash zone, submerged zone, and mud zone. From what has been exposed, it is easy to understand that the corrosion can be classified according to the appearance of the corrosion damage or the mechanism of attack, namely, uniform or general corrosion, pitting corrosion, crevice corrosion, filiform corrosion, galvanic corrosion, erosion-corrosion, intergranular corrosion, dealloying, environmentally-assisted cracking, stress-corrosion cracking, corrosion fatigue, and hydrogen damage [8].
In recent years, there has been more interest in studies conducted by researchers and engineers to develop health monitoring systems and safety evaluation techniques for OWTs. However, corrosion monitoring is one of the major challenges of a structural health monitoring system (SHMS) for OWT. Usually, corrosion detection measures can be direct measures of metal loss due to corrosion, corrosion rate, or indirect measures of any parameter that may be a cause or consequence of the metal loss or corrosion [5,8]. It is documented that the wall thickness loss rate is the major parameter that defines the corrosion process [5], but due to the harsh environment and the location of the OWT, it is challenging to find the most suitable wall thickness monitoring technique. The ultrasound technique was pointed out as being one of the nondestructive techniques more commonly used, and it is reliable for detecting thickness loss due to corrosion [3,8].
In ultrasound techniques, the frequency range of ultrasound waves used for NDT of materials is normally 1 MHz to 15 MHz. These waves of high-frequency ultrasound travel along the material. The velocity of the ultrasound wave propagation through a material is a function of the elastic modulus and density of the material [5]. It is important to note that the acoustic impedance changes due to different materials or medium properties. Based on that, the thickness loss due to corrosion will be given as a function of propagating velocity, frequency, and energy components. The method can be designed based on the following two techniques [5]:
- Pulse-echo method: A short period of ultrasonic energy is introduced into the test component with a systematic pause, and the reflected part of the ultrasonic wave is utilized for the analysis. The transmitter and receiver probes use the same transducers [5].
- Transmission method: The transmitted part of the ultrasound wave is used for the analysis. Separate transducers placed on opposite sides are used as the transmitter and receiver probes [5]. The presence of flaws or discontinuities is revealed when the receiver detects a reduction in the intensity of the waves emitted [2].
These methods allow for thickness measurements of the metal, corrosion products, and coatings [2,5].
Wall thickness is extracted from the arrival time difference between different wave packets. Once the arrival times of individual wave packets has been established and the wave path is known, this is a simple exercise. According with the literature, [9] Equation (1) describes how to calculate the wall thickness based on the arrival times:
where c is the velocity of the ultrasonic wave, dt is the time difference between t1 and t2, the arrival time of the first and second wave packet respectively, and D is the separation between the transmitting and receiving transducer [9]. The Hilbert transform is another method to achieve the thickness and in this method it applies a 90° phase shift to all frequency components of the signal. This allows the envelope to be calculated using Equation (2):
where f(t) is the signal for which the envelope is determined, H(f(t)) is the Hilbert transform of f(t), and E(t) is the computed signal envelope. Once the envelope is computed for a waveform, its maximum peaks are presumed to be the arrival times of the diverse wave packets [9].
First arrival is a complementary common technique to estimate arrival times. It also varies on calculating an envelope for the waveform; first arrival then gets the highest peak for each wave packet. Following this, a threshold is requested to each peak as a function of the amplitude of that peak (e.g., −6 dB). The first intersection of the expected threshold with the envelope signal is then acquired as the arrival time for the given wave packet [9]. The cross-correlation process for real valued functions is defined by Equation (3):
where h(t) is the cross-correlation of function f(t) with a Kernel function g(t). The peaks of the successive correlation function are determined and assumed as arrival times. This is because at those times, offset values of the received signal are most similar to the transmitted signal [9].
In this work, the preliminary results obtained for this system will be presented to permit the evaluation of the thickness loss promoted by corrosion. For this aim, the following specifications were considered: the wall thickness detection technique should be non-intrusive and non-destructive; the monitoring system requires a consistent and permanent acquisition of monitoring data with minimum interruptions; and robust communication is needed to rely on sensor data sent.
2. Materials and Methods
In order to test the developed asset management platform, devices were submerged in seawater. For this, an instrumented steel plate in the same material used in offshore structures and equipped with thickness measuring probes and temperature sensors, was prepared according to the procedure described in the following paragraphs. These systems were then submerged in seawater to corrode naturally.
2.1. Preparation of the Physical Arrangement
The physical arrangement included a steel plate of common offshore steel used in the construction of offshore structures. Ultrasonic thickness measurements were executed using 15 ultrasonic single element pulse/echo transducers and piezo composite, operating at 5 MHz. A thin layer of Molykote 111 (DuPont™, Wilmington, DE, USA) silicone grease was on the face of each ultrasound transducer and the temperature transducer. The purpose of this grease was to provide acoustic coupling for the ultrasound and some thermal coupling for the temperature transducer. When installed, all transducers were pushed towards the test plate by the springs.
A mechanical arrangement was constructed to guarantee insulation of the electronic components and their enclosure, free of seawater. All of the arrangements were required to be robust enough to be placed in a splash zone of seawater, as seen in Figure 1.
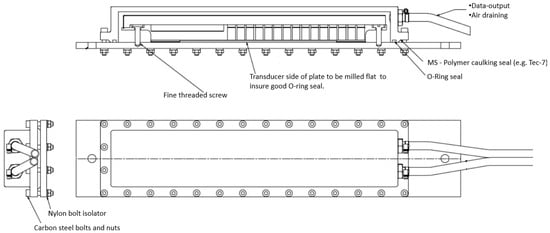
Figure 1.
Test plate with instrumentation for marine corrosion test.
The place chosen to install the equipment was located in Oeiras Marina, near Cascais, Portugal.
The cassette containing the array of ultrasound single crystal pulse-echo probes that were measuring and sending the signal of the thickness measurements is represented in Figure 2 below.
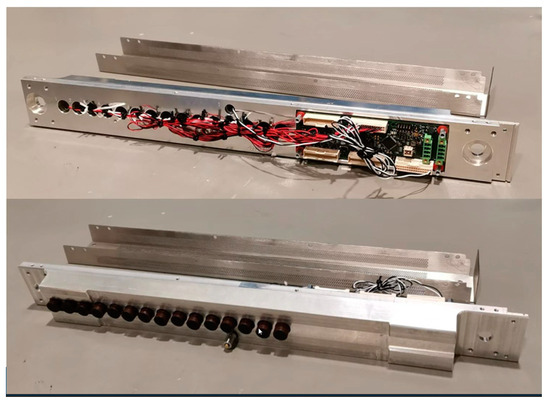
Figure 2.
Electronics of the ultrasound probes attached to the test plate to be installed on seawater.
These instruments and probes were connected to a steel plate that was installed in a real seawater environment, as mentioned above. This simulated the installation of such an arrangement on a real offshore floating platform. One face of the steel plate was totally in contact with seawater, such as in a splash zone or temporally immersed zone. Real conditions at a floating structure, like those used in a wind float structure.
Figure 3 presents the final arrangement with the steel plate and the sensors attached on one face of it, protected by a chamber where the connection of the sensors for measuring conditions was guaranteed during the assembly of this testing plate. Figure 4 shows the schematic representation of the data acquisition system for the corrosion test.
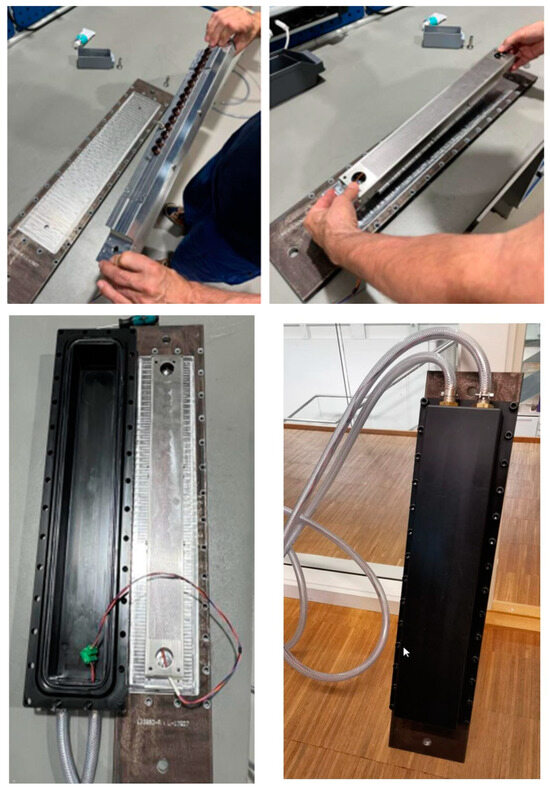
Figure 3.
Test plate with sensors attached and protected from seawater.
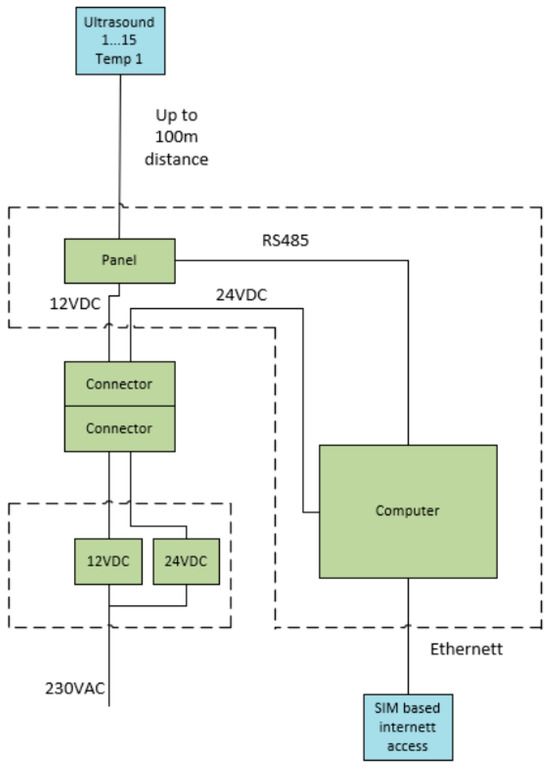
Figure 4.
Data acquisition system for corrosion test. The required acquisition computer and power supplies were installed in a weatherproof enclosure.
2.2. In-Situ Data Collector Device
The data acquisition system seen in Figure 5, is based on a standard industry panel PC (Advantech TCP1571, Taipei City, Taiwan) with software written in Python 3.10 and MATLAB R2023a. The device, which performs the actual ultrasound measurements, is shown in Figure 2. The electronics consisted of a single board with transmitter and receiver electronics for ultrasound. The transducers, which can also be seen in Figure 2, had a center frequency of 5 MHz and were in this system excited by a one-period square wave pulse. The excitation voltage of this pulse was adjusted between 5 and 15 v.
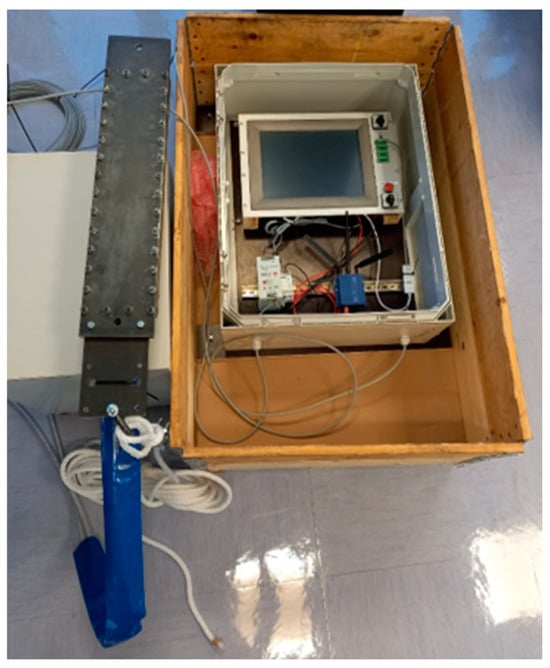
Figure 5.
Equipment for thickness measurement of steel plate and remote sending that data.
The acquisition system worked as follows:
- At regular intervals, ultrasound pulse-echo waveform was measured from 15 transducers, and temperature from 1 temperature sensor;
- Thickness was calculated from the waveforms using correlation;
- Wrote raw data (reflected ultrasound waveforms) to .mat files;
- Wrote measurements (processed thickness values) to a CSV file.
A standard industry panel PC (Advantech TCP1571) was responsible for the following:
- Measurement scheduling;
- Processing data;
- Storing logfiles;
- Communication.
It was also used as a wireless Ethernet router.
The data acquisition system was connected to the steel plate, which was a central part of the project architecture. The device autonomously collected in-situ data and periodically uploaded the information to the central data repository via a RESTful API (interface to exchange information securely over the internet).
In Figure 5, it is possible to see the device that communicates with the sensor and sends the data to be analyzed on a central web platform.
Every two minutes, the data collector device read information from the sensors and wrote it to a local CSV file. It also saved the A-scan files locally, which will be used for further thickness analysis.
On top of this architecture, a Python routine was developed to call an API endpoint, every thirty minutes, to batch insert new data acquired into a Postgres database. This API endpoint and database was hosted by a cloud provider, allowing improved accessibility, higher performance, and security.
Finally, these measurements were presented in an Asset Management Platform that assists the asset owner in carrying out preventive strategies in real-time, supporting him in the decisions to be taken based on the data made available.
3. Results and Discussion
In this work, the data gathered from the analysis was made available in mat and.csv files. MATLAB was used to read and process the data, including A-scans, which represent the amplitude value of the input echoes, as well as the thickness of the plate over the observed days for all 15 different sensors, as mentioned before. The main data from the experiment were accumulated in a CSV file named history.csv, and the text file had a semicolon as a separation character, which means that the file can be opened directly using, for example, Excel (version 365) (Table 1). Due to the large number of data points, only one example is available for sensors 1 and 2 in Table 1, providing a similar sequence of the data obtained for the other sensors.

Table 1.
Example of the data results obtained in Excel format for sensor 1 and 2 (representative).
For this work, a simple linear temperature compensation method was used. The model was described in [10]. A rule-of-thumb value for the temperature effect of the sound velocity in carbon steel commonly used in the industry is 10−4 per °C. For most common NDT applications, this means that the temperature compensation of UT measurements can be ignored. But since our application targets very fine resolution, temperature compensation using the linear model was implemented.
In Table 1, the first line shows the ID for each column in the CSV file. For each of the 15 ultrasound transducers in the system, there are four columns. For example, for sensor 1: temperature (Temp_1), temperature-compensated thickness (Thick_c_1), uncompensated thickness (Thick_uc_1), and a quality parameter (Qual_1). The quality parameter is an integer flag value which is calculated as part of the Sensorlink thickness processing. The value is a qualitative indication of how well the measured ultrasound waveform matches the measurement model which the thickness calculation is based on. A quality value of 0 means that no thickness estimate can be made, 1 means poor thickness estimate, 2 means fair, and 3 and 4 mean very good.
The timestamp represented a string as shown: a 15 elements vector with temperatures and a 15 × 2048 element matrix with one echo waveform for each transducer. Over the course of 130 days, data was collected every 2 min. However, owing to the substantial volume of data gathered, analysis was only conducted at two specific times of the day for the 15 sensors: 00:06:03 AM and 12:06:03 PM. These specific times were chosen after a careful analysis of the results. These times were selected considering an interval of 12 h between them, and with this, there was an attempt to evaluate if there were changes, taking into account the tide variations.
The system of monitoring was based on ultrasound waves, as mentioned previously. Corrosion was evaluated by estimating the wall thickness loss that happens due to corrosion. There are different approaches to monitoring these corrosion mechanisms; in this study, the technique selected was ultrasonic testing (UT). The UT signal travelled from the sensor head through a stainless-steel plate. It was then reflected, particularly on both the external (first echo) and internal (second echo) plate surfaces. The corresponding UT waveform (or A-scan) is shown in Figure 6.
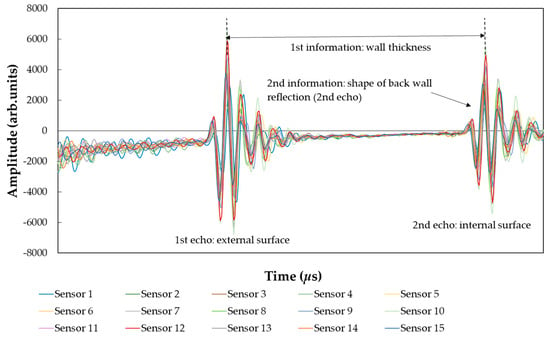
Figure 6.
Data analysis for all sensors, on the same day (26 July 2023) at the same time (00:06:03 h).
As we well know, there are two important parameters for each sensor [5,8] which are as follows:
- Wall thickness;
- -
- Calculated by time-of-flight analysis from the interval between both main echoes that are detected by the envelope peaks approach.
- -
- Used to calculate corrosion rates (by trending wall thickness over time) as a measurement of general wall loss at the corresponding [8,9,11,12].
- Shape of back wall reflection.
- -
- Compared to the back wall echo shape from previous and subsequent measurements and interpreted as a measure of change in roughness of the internal surface [8,10].
The wall thickness is the parameter that allows conclusions in relation to elevated corrosion activity, and the shape of the back wall reflection is the parameter that permits the identification of low degrees of corrosion [8].
Figure 6 illustrates the evolution of the signal’s amplitude by overlaying the data from 15 sensors on the same day at the same time.
The graph depicted in Figure 7 illustrates the analysis conducted for sensor 1, which serves as an example for the other sensors as well. The analysis involved two time points during the day (00:06:03 AM and 12:06:03 PM) on five different dates (23 March 2023, 21 April 2023, 26 May 2023, 26 June 2023, and 26 July 2023). The measurements were overlaid by hours to visualize the evolution of signal amplitude over time. This approach provided insight into how the signal amplitude changes with time, for each sensor.
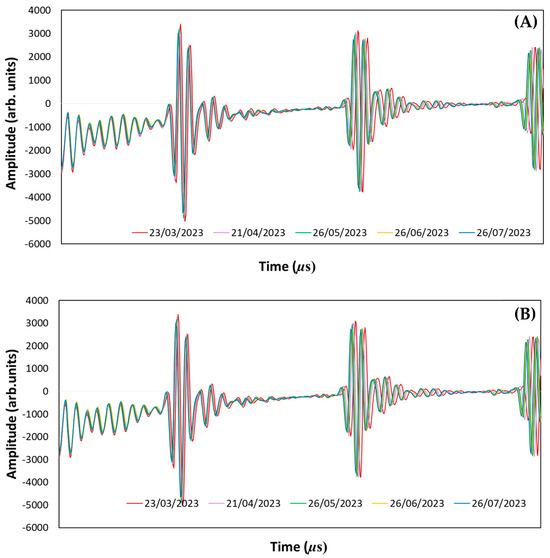
Figure 7.
Representation for sensor 1 at two different times (A) 00:06:03 AM and (B) 12:06:03 PM, during 5 different days.
In Figure 7A,B, it is observed that on five different days at the same hour over the months. From the analysis of the A-scans, it is possible to observe a signal phase shift in the back wall. The signal phase shifts observed are related to the reduction in the thickness of the steel plate, promoted by localized corrosion. In addition to what has been mentioned when comparing the initial wave packet with that obtained at the end of the test, a slight alteration in the shape of the back wall of the wave packet was also observed, which is related to the active corrosion in the object under study. As mentioned earlier, the shape of the back wall reflection is a parameter sensitive to even low degrees of corrosion. In this case, the change in surface morphology is promoted by the localized corrosion in the steel plate, and consequently, this corrosion promotes the small changes in the thickness of the wall in the steel plate. The aspects mentioned above are evidently an ultrasonic phenomenon that is a result of the interaction of the ultrasonic wave with the non-uniform surface morphology of the component that is being monitored [8,9,12].
In Figure 8, comparing the thickness measured on the first day with the thickness on the last day, it is possible to conclude that there was a reduction of 0.16955 mm. Moreover, by superimposing the data, it is possible to visualize the thickness values per sensor. From this analysis, it is noticeable that the sensors with the most significant reduction in thickness, when compared to their reference values, were sensor 4 with 0.1948 mm, and sensor 15 with 0.18715 mm. In this study, the average thickness loss across all sensors was approximately 0.14887 mm.
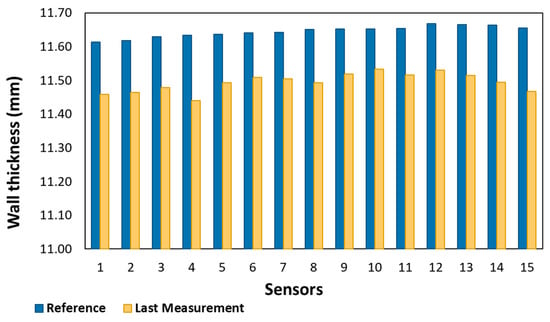
Figure 8.
Thickness reduction values per sensor.
Corrosion is a very complex phenomenon and can produce very different surface morphologies. Based on ultrasound waves, corrosion can be evaluated by estimating the wall thickness loss that happens due to corrosion. The parameter that can be used to define the rate at which any metal deteriorates in a specific environment is the corrosion rate [13]. The calculation for the corrosion rate as a function of the thickness measurement is given by Equation (4) [14]:
where CR is the corrosion rate (mm/y), Ti is the initial thickness (mm), Tf is the final thickness (mm), and t is the time of exposure in days [14].
Figure 9 represents the variation of the wall thickness during the 130 days of exposure for sensor 1.
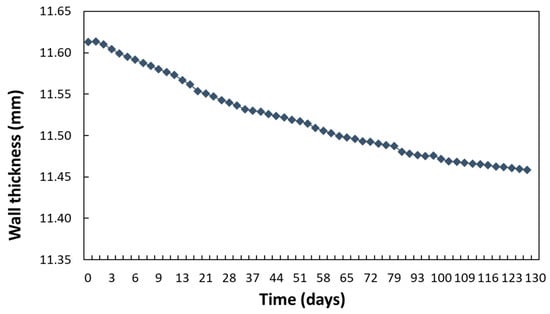
Figure 9.
Variation of the wall thickness during the 130 days of exposure (example).
The analysis of the graphic obtained for the thickness variation over time allowed us to conclude that it was in the first 79 days that the greatest variation in thickness was more significant; after this time, it was possible to observe that the variation was smaller. This fact is expected because, when materials are exposed to a corrosive medium, after a period of time, the material presents a natural stabilization with regard to the speeds of the reactions involved in the corrosive process. This behavior is similar to all sensors.
The corrosion rates were determined for all of the sensors using Equation (4), and the results are listed in Table 2. The average value of the corrosion rate obtained is 0.421 ± 0.056 (mm/y).

Table 2.
Corrosion rate values for all sensors.
The variation of the values obtained for the corrosion rates that were determined is essentially due to the behavior of the resistance of the steel plate when exposed to the corrosive medium. As is well known, the corrosion resistance behavior of materials is quite complex since it depends on several factors, such as the surrounding environment where the material is exposed and the inherent characteristics of the material itself, such as the presence of intermetallic particles in the material [13].
In the present study, we have found that the corrosive medium is the water of the marina in Oeiras, which is characterized in the following paragraphs. Nevertheless, in this case, the factor that seems to contribute to the localized variations of the wall thickness promoted by localized corrosion is the presence of intermetallic particles in the steel. The presence of these particles can induce different behaviors regarding corrosion resistance in the presence of the corrosive medium, thus promoting small, localized variations in the thickness of the material that are detected by the sensors. However, studying the behavior and influence of these intermetallic particles present in the steel matrix is not the subject of this study.
Table 3 displays the analysis of the seawater in which the component is submerged. As mentioned earlier, the tests took place in the marina in Oeiras. The marina is located in the estuary of the Tagus River. According to the literature [15,16], the Tagus estuary is a partially mixed estuary characterized by high amplitudes, where the flow of fresh water is reduced, and the turbulence caused by the currents is higher and tends to cause a greater mixture between fresh water and salt water, increasing the salinity with depth.

Table 3.
Analysis of the seawater in which the component is submerged on 19 April 2023.
According to the results obtained from the analysis of the marina water where the long-term tests are carried out, there are some parameters that need a more careful analysis since they influence the corrosion rates, namely the salt content, the content of oxygen dissolved, the pH factor, and the conductivity. The conductivity of seawater is the capacity of water to conduct electricity. Conductivity increases with temperature, so high conductivity affects the intensity of corrosion [17,18,19]. In the present study, the conductivity is 4.8 × 10⁴ S/cm. Gases that dissolve in water are the most important ones for corrosion risk. The oxygen dissolved acts as a depolarizer in the cathodic half-cell and enhances corrosion risk [18,19]; the results obtained in the present study are 9.8 mg/L.
Figure 10 and Figure 11 show the conditions before and after the immersion tests. At the end of the tests, it is possible to identify that the area where the sensors are located on the opposite side presents signs of localized corrosion, resulting in a reduction of thickness in that zone. It is also possible to identify signs of galvanic corrosion, as expected, near the areas of the screws and nuts.

Figure 10.
Photographic record obtained for: (A) steel plate before the exhibition in the Oeiras marina; (B) detail of the screws before the exhibition in the Oeiras marina; (C) steel plate after the exposure in the Oeiras marina marked with zones (1), (2), and (3) that are detailed in Figure 11; and (D) detail of the screws after the exposure in the Oeiras marina.

Figure 11.
Photographic record obtained from the different zones identified in Figure 10, where it is possible to see in some detail (1) reduction of thickness after exposure; (2) degradation observed near an end containing screws; and (3) degradation observed near the opposite zone 2.
In the future, it is planned to build one offshore asset management system that is intended to be an integrated solution for assistance and support in asset integrity management and risk-based management. It is intended to assist the asset owner in carrying out proximity and preventive management in real-time, supporting him in the decisions to be taken based on the data received and collected.
Using such a platform, the identification of critical resources and equipment is supported by the use of available real-time qualitative and quantitative risk assessments, the management of threats to the integrity of the asset, the establishment of maintenance and inspection strategies, as well as the creation of the respective plans, management documentation, data related to inspections and maintenance carried out throughout the useful life of the asset, and Key Performance Indicators (KPIs) for alerting and monitoring.
Asset management is strongly based on the knowledge of the asset. For this, it largely contributes to having integrated real-time information about the asset being managed to make the right decisions at the right time. Collecting, gathering, and integrating the relevant data available on the offshore platforms, or data about the surrounding and environmental conditions that can impact the integrity of the platform, is fundamental for this type of asset management. Such a system enables the following:
- Supporting optimized maintenance and inspection strategies;
- Increased focus on risk areas and equipment thanks to a prioritization of critical items;
- Disclosure of risk assessments with the organization (owner of the asset and maintenance, operation, and inspection teams);
- Making decisions based on data and records (maintenance, inspection, operation, and risk assessment reports, as an example);
- Supporting the allocation of material, equipment, human, and financial resources according to a plan adjusted to the needs of operation, maintenance, and inspection;
- Making decisions based on a structured view of risk and priorities (KPIs);
- Supporting budgeting decisions.
4. Conclusions
This paper presents a smart corrosion monitoring system for offshore wind turbines based on the ultrasound pulse-echo technique. The results obtained in this work permit the conclusion that the corrosion monitoring system demonstrated robustness during the collection of the data. This work permit created a large database of ultrasound raw signals that were used to validate the algorithms implemented. The analysis of the results obtained allowed us to conclude that the sensor system proved to be robust and sensitive to small variations in thickness measurements over the time, in which the tests took place in the Oeiras marina, and it was verified that there was a slight decrease in thickness; the average thickness measurement was 0.14887 mm with an average corrosion rate of 0.421 ± 0.056 (mm/y). The analysis of the graph obtained for the thickness variation over time permits us to conclude that it was in the first 79 days that the greatest variation in thickness was more significant; after this time, it was possible to observe that the variation was reduced.
Author Contributions
Conceptualization, M.R., A.C. and C.S.P.; methodology, M.R., A.C., Ø.B. and C.S.P.; software, A.C., G.C. and Ø.B.; validation, M.R., A.C., Ø.B. and C.S.P.; formal analysis, F.S., M.R., Ø.B. and C.S.P.; investigation, F.S., M.R., A.C., Ø.B. and C.S.P.; writing—original draft preparation, F.S., M.R., A.C., G.C., Ø.B. and C.S.P.; writing—review and editing, M.R., G.C. and C.S.P.; visualization, F.S., M.R., A.C., Ø.B. and C.S.P.; supervision, M.R., A.C. and C.S.P.; project administration, M.R. All authors have read and agreed to the published version of the manuscript.
Funding
The ASTRIIS project was co-funded by Portugal 2020 with Nº 046092.
Informed Consent Statement
Not applicable.
Data Availability Statement
Data are contained within the article.
Conflicts of Interest
Author Øystein Baltzersen was employed by the company Sensorlink. The remaining authors declare that they have no conflict of interest. The funders had no role in the design of the study; in the collection, analyses, or interpretation of data; in the writing of the manuscript; or in the decision to publish the results.
References
- Verhelst, J.; Coudron, I.; Ompusunggu, A.P. SCADA-Compatible and Scaleable Visualization Tool for Corrosion Monitoring of Offshore Wind Turbine Structures. Appl. Sci. 2022, 12, 1762. [Google Scholar] [CrossRef]
- Price, S.J.; Figueira, R.B. Corrosion Protection Systems and Fatigue Corrosion in Offshore Wind Structures: Current Status and Future Perspectives. Coatings 2017, 7, 25. [Google Scholar] [CrossRef]
- ISO/IEC 2382-14:1997; Information Technology—Vocabulary—Part 14: Reliability, Maintainability, and Availability. ISO: Geneva, Switzerland, 1997.
- ISO 14224:2016; Petroleum and Natural Gas Industries—Collection and Exchange of Reliability and Maintenance Data for Equipment. ISO: Geneva, Switzerland, 2016.
- Thibbotuwa, U.C.; Cortés, A.; Irizar, A. Ultrasound-Based Smart Corrosion Monitoring System for Offshore Wind Turbines. Appl. Sci. 2022, 12, 808. [Google Scholar] [CrossRef]
- Khodabux, W.; Causon, P.; Brennan, F. Profiling Corrosion Rates for Offshore Wind Turbines with Depth in the North Sea. Energies 2020, 13, 2518. [Google Scholar] [CrossRef]
- Brijder, R.; Hagen, C.H.M.; Cortés, A.; Irizar, A.; Thibbotuwa, U.C.; Helsen, S.; Vásquez, S.; Ompusunggu, A.P. Review of corrosion monitoring and prognostics in offshore wind turbine structures: Current status and feasible approaches. Front. Energy Res. 2022, 10, 991343. [Google Scholar] [CrossRef]
- Philipp, S.; Karsten, P.; Micha, T. About the correlation between crude oil corrosiveness and results from corrosion monitoring in an oil refinery. Corrosion 2016, 72, 843–855. [Google Scholar]
- Gajdacsi, A.; Cegla, F. The effect of corrosion induced surface morphology changes on ultrasonically monitored corrosion rates. Smart Mater. Struct. 2016, 25, 115010. [Google Scholar] [CrossRef]
- Baltzersen, Ø.; Waag, T.I.; Johnsen, R. Wall Thickness Monitoring of pipelines using ultrasound. In Proceedings of the 12th Middle East Corrosion Conference, New Orleans, LA, USA, 16–20 March 2008. Paper No. 08074. [Google Scholar]
- Lian, J.; Cai, O.; Dong, X.; Jiang, Q.; Zhao, Y. Health Monitoring and Safety Evaluation of the Offshore Wind Turbine Structure: A Review and Discussion of Future Development. Sustainability 2019, 11, 494. [Google Scholar] [CrossRef]
- Cleland, D. Ultrasonic Methods of Non-Destructive Testing; Wiley-Blackwell: Oxford, UK, 2011. [Google Scholar]
- Bhandari, J.; Khan, F.; Abbassi, R.; Garaniya, V.; Ojeda, R. Modelling of pitting corrosion in marine and offshore steel structures–A technical review. J. Loss Prev. Process Ind. 2015, 37, 39–62. [Google Scholar] [CrossRef]
- Sousa, E.D. Análise de Corrosão por Meio de Perda de Massa e Espessura em Aços Pela Ação da Água Produzida de Poços Petrolíferos. Master’s Thesis, Universidade Federal de Sergipe, São Cristóvão, Brazil, 2010; 143p. [Google Scholar]
- Centre for Nondestructive Evaluation ISU. Wavelength and Defect Detection. Available online: https://www.nde-ed.org/Physics/Waves/defectdetect.xhtml (accessed on 22 March 2024).
- Neves, F.D. Dynamics and Hydrology of the Tagus Estuary: Results from In Situ Observations. Ph.D. Thesis, Faculdade de Ciências, Universidade de Lisboa, Lisbon, Portugal, 2010. [Google Scholar]
- Amaro, C. Monitorização e Simulação de Afluências Salinas a Sistema de Saneamento em Zonas Costeiras. Master’s Thesis, Instituto Superior Técnico, Universidade de Lisboa, Lisbon, Portugal, 2016. [Google Scholar]
- Ivosevic, S.; Kovac, D. The Overview of the Varied Influences of the Seawater and Atmosphere to Corrosive Process. In Proceedings of the International Conference of Maritime Science & Technology (Naše More), Dubrovnik, Croatia, 17–18 October 2019. [Google Scholar]
- Zakowski, K.; Narozny, M.; Szocinski, M.; Darowicki, K. Influence of water salinity on corrosion risk—The case of the southern Baltic Sea coast. Environ. Monit. Assess. 2014, 186, 4871–4879. [Google Scholar] [CrossRef] [PubMed]
Disclaimer/Publisher’s Note: The statements, opinions and data contained in all publications are solely those of the individual author(s) and contributor(s) and not of MDPI and/or the editor(s). MDPI and/or the editor(s) disclaim responsibility for any injury to people or property resulting from any ideas, methods, instructions or products referred to in the content. |
© 2024 by the authors. Licensee MDPI, Basel, Switzerland. This article is an open access article distributed under the terms and conditions of the Creative Commons Attribution (CC BY) license (https://creativecommons.org/licenses/by/4.0/).