
Optical Gain in Eu-Doped Hybrid Nanocrystals Embedded SiO2-HfO2-ZnO Ternary Glass-Ceramic Waveguides


Abstract
:1. Introduction
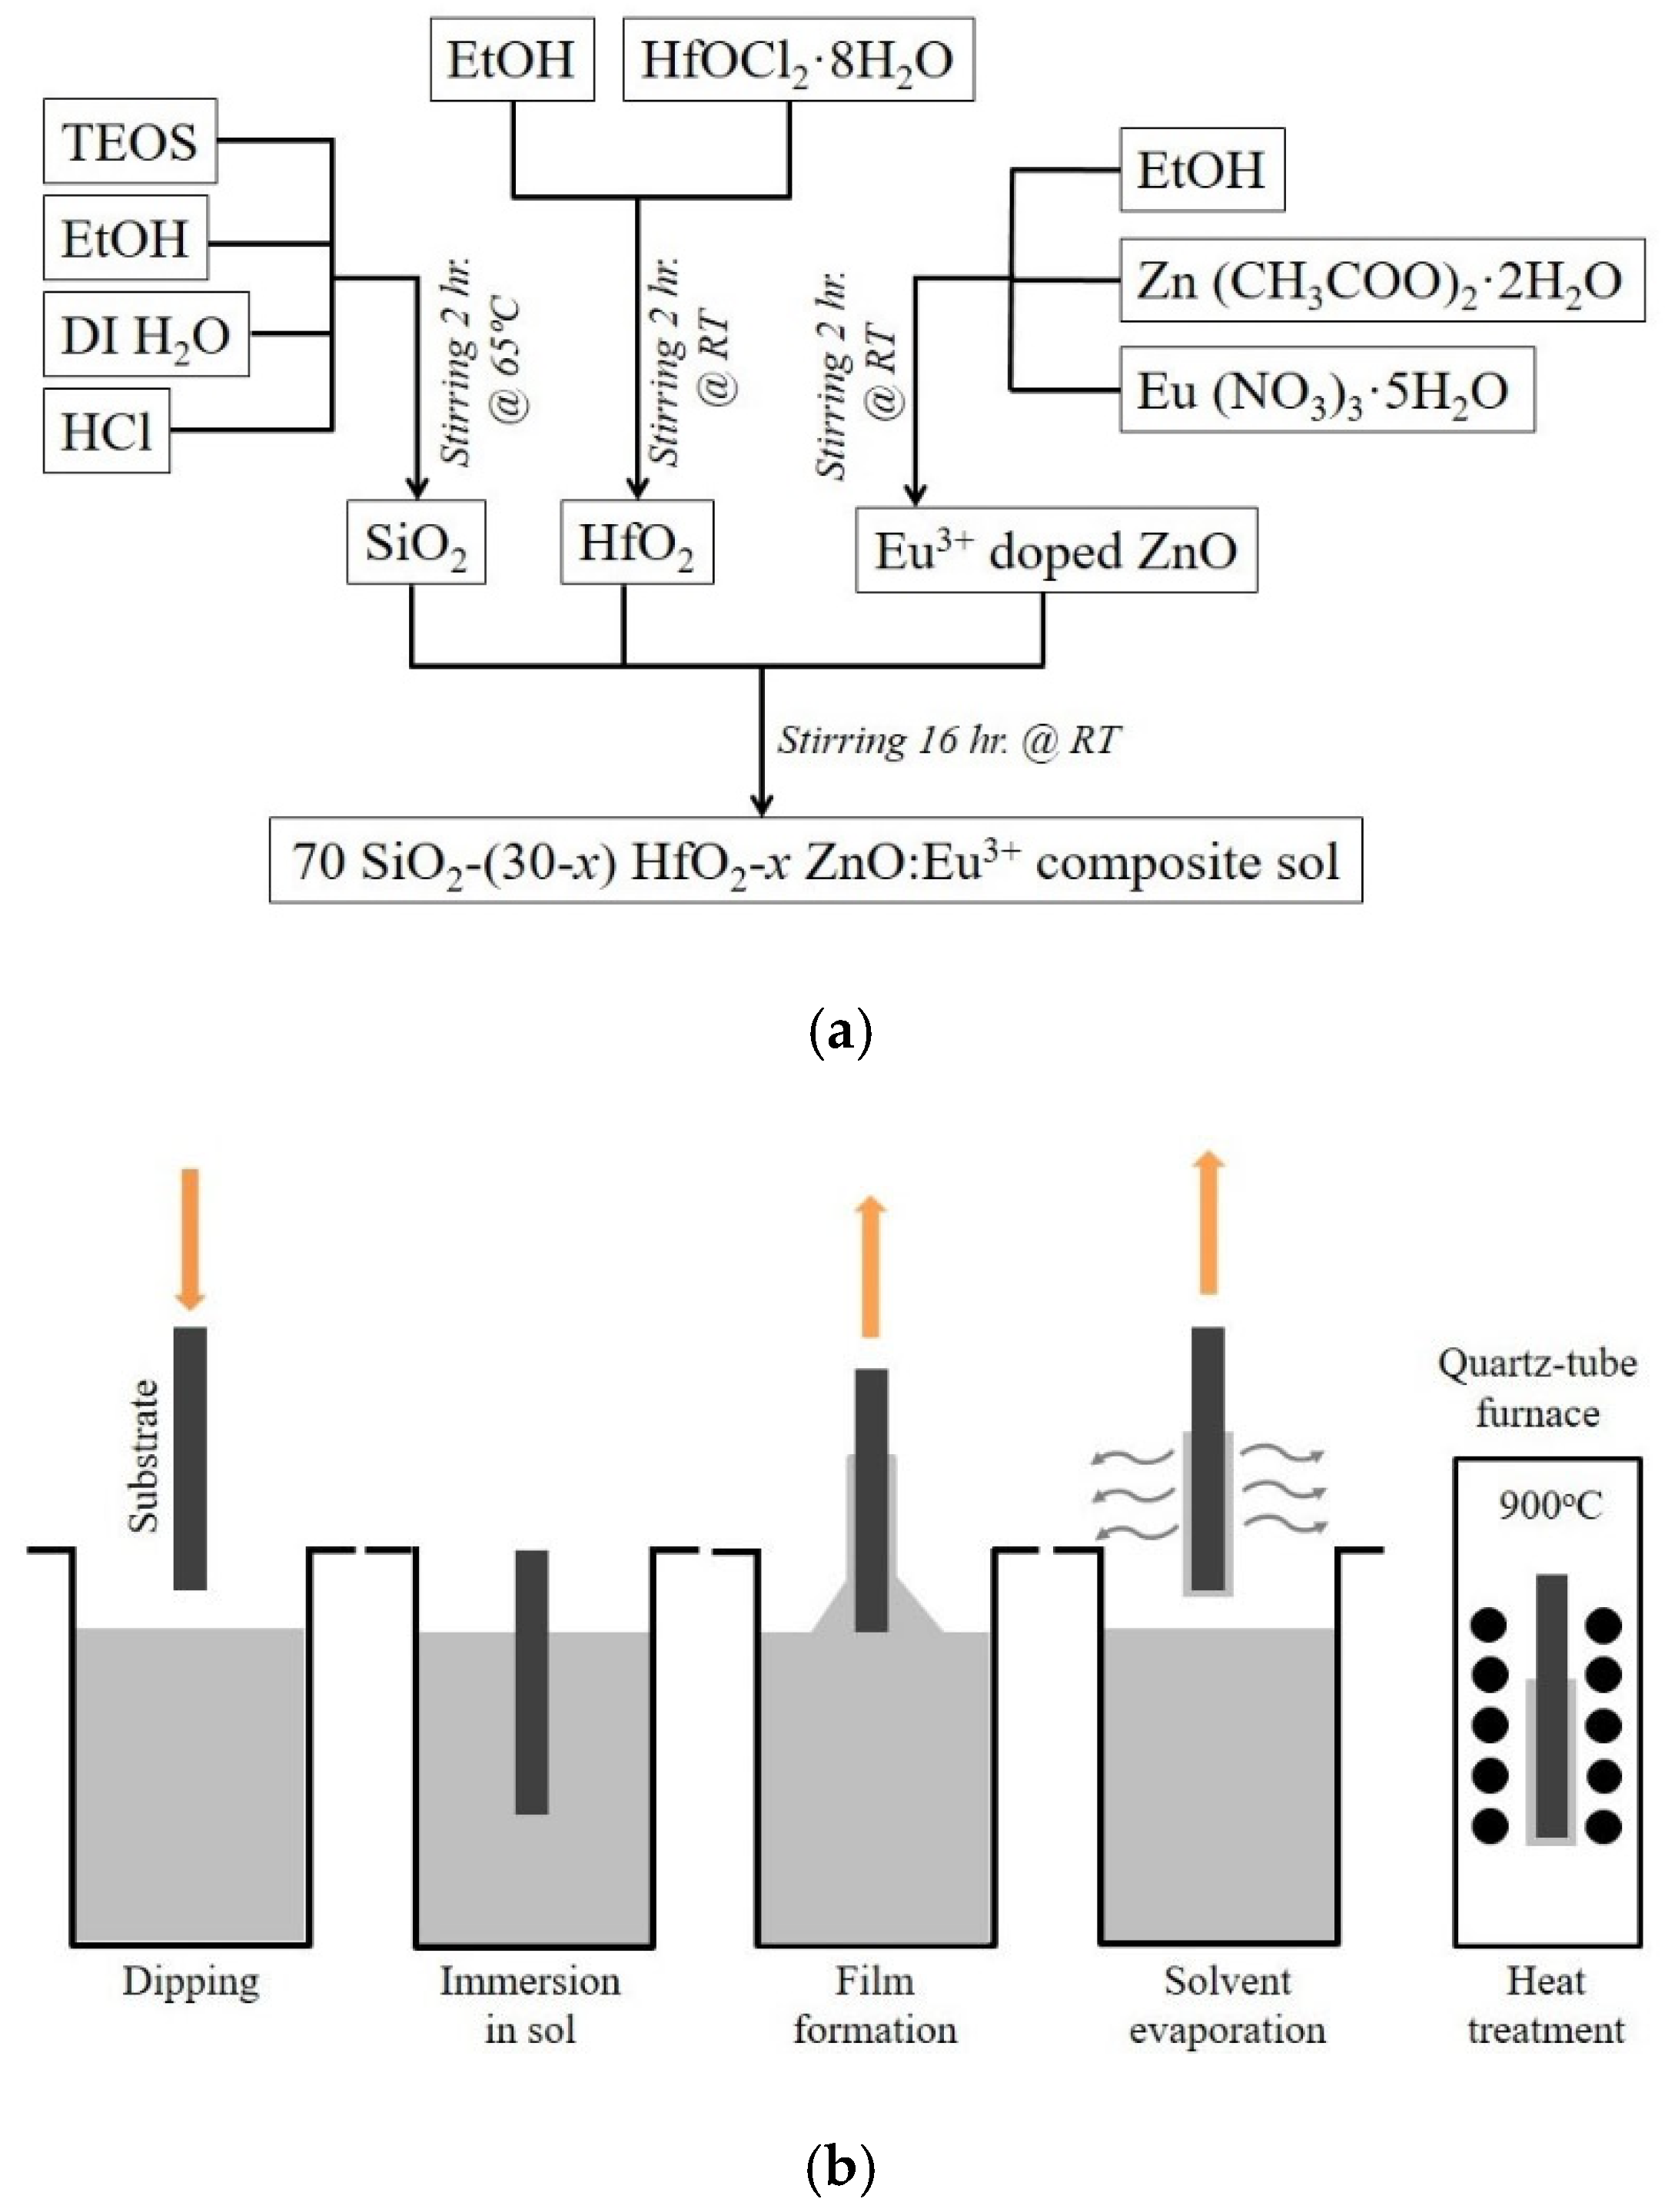
2. Materials and Methods
3. Characterizations
4. Results and Discussions
5. Conclusions
Author Contributions
Funding
Institutional Review Board Statement
Informed Consent Statement
Data Availability Statement
Conflicts of Interest
References
- Kurkjian, C.R.; Prindle, W.R. Perspectives on the history of glass composition. J. Am. Ceram. Soc. 1998, 81, 795–813. [Google Scholar] [CrossRef]
- Ferrari, M.; Righini, G.C. Glass-ceramic materials for guided-wave optics. Int. J. Appl. Glass Sci. 2015, 6, 240–248. [Google Scholar] [CrossRef]
- Rastogi, R.; Chaurasia, S. Advances in and Future Perspectives on High-Power Ceramic Lasers. Photonics 2024, 11, 942. [Google Scholar] [CrossRef]
- Mortier, M.; Vivien, D. Ceramic and glass-ceramic lasers. Ann. De Chim. Sci. Des Matériaux 2003, 28, 21–33. [Google Scholar] [CrossRef]
- Dieke, G.H.; Crosswhite, H.M.; Crosswhite, H.M. Spectra and Energy Levels of Rare Earth Ions in Crystals; Interscience Publishers: New York, NY, USA, 1968; Volume 5. [Google Scholar]
- Wang, Y.; Ohwaki, J. New transparent vitroceramics codoped with Er3+ and Yb3+ for efficient frequency upconversion. Appl. Phys. Lett. 1993, 63, 3268–3270. [Google Scholar] [CrossRef]
- Tick, P.A.; Borrelli, N.F.; Cornelius, L.K.; Newhouse, M.A. Transparent glass ceramics for 1300 nm amplifier applications. J. Appl. Phys. 1995, 78, 6367–6374. [Google Scholar] [CrossRef]
- Tick, P.A. Are low-loss glass–ceramic optical waveguides possible? Opt. Lett. 1998, 23, 1904–1905. [Google Scholar] [CrossRef]
- Blanc, W.; Dussardier, B. Formation and applications of nanoparticles in silica optical fibers. J. Opt. 2016, 45, 247–254. [Google Scholar] [CrossRef]
- Kamrádek, M.; Kašík, I.; Aubrecht, J.; Mrázek, J.; Podrazký, O.; Cajzl, J. Nanoparticle and Solution Doping for Efficient Holmium Fiber Lasers. IEEE Photonics J. 2019, 11, 1–10. [Google Scholar] [CrossRef]
- Ferreira, P.H.D.; Fabris, D.C.N.; Villas Boas, M.O.C.; Bezerra, I.G.; Mendonça, C.R.; Zanotto, E.D. Transparent glass-ceramic waveguides made by femtosecond laser writing. Opt. Laser Technol. 2021, 136, 106742. [Google Scholar] [CrossRef]
- Dymshits, O.; Shepilov, M.; Zhilin, A. Transparent glass-ceramics for optical applications. MRS Bull. 2017, 42, 200–205. [Google Scholar] [CrossRef]
- Cao, H.; Xu, J.Y.; Seelig, E.W.; Chang, R.P.H. Microlaser made of disordered media. Appl. Phys. Lett. 2000, 76, 2997–2999. [Google Scholar] [CrossRef]
- Son, D.I.; Kwon, B.W.; Park, D.H.; Seo, W.-S.; Yi, Y.; Angadi, B.; Lee, C.-L.; Choi, W.K. Emissive ZnO–graphene quantum dots for white-light-emitting diodes. Nat. Nanotechnol. 2012, 7, 465. [Google Scholar] [CrossRef] [PubMed]
- Mears, R.J.; Reekie, L.; Poole, S.B.; Payne, D.N. Neodymium-doped silica single-mode fibre laser. Electron. Lett. 1985, 21, 738–740. [Google Scholar] [CrossRef]
- Kik, P.G.; Polman, A. Erbium-doped optical-waveguide amplifiers on silicon. MRS Bull. 1998, 23, 48–54. [Google Scholar] [CrossRef]
- Zhao, Q.; Li, J.; Zha, T.; Zhang, P.; Long, Y.; Fang, Z. Low-Temperature Fluoro-Borosilicate Glass for Controllable Nano-Crystallization in Glass Ceramic Fibers. Nanomaterials 2023, 13, 1586. [Google Scholar] [CrossRef]
- Lahoz, F.; Capuj, N.E.; Navarro-Urrios, D.; Hernández, S.E. Stimulated emission and light amplification in Ho3+ doped oxyfluoride glasses and glass-ceramics. Photonic Mater. Devices Appl. II 2007, 6593, 176–183. [Google Scholar]
- Ghosh, S.; Bhaktha, S.N.B. Eu-doped ZnO-HfO2 hybrid nanocrystal-embedded low-loss glass-ceramic waveguides. Nanotechnology 2016, 27, 105202. [Google Scholar] [CrossRef]
- Tien, P.K. Light Waves in Thin Films and Integrated Optics. Appl. Opt. 1971, 10, 2395–2413. [Google Scholar] [CrossRef]
- Ji, Y.; Zhong, Q.; Yang, X.; Li, L.; Li, Q.; Xu, H.; Chen, P.; Li, S.; Yan, H.; Xiao, Y.; et al. Surface Engineering Enables Efficient AgBiS2 Quantum Dot Solar Cells. Nano Lett. 2024, 24, 10418–10425. [Google Scholar] [CrossRef]
- Pavesi, L.; Dal Negro, L.; Mazzoleni, C.; Franzo, G.; Priolo, F. Optical gain in silicon nanocrystals. Nature 2000, 408, 440–444. [Google Scholar] [CrossRef] [PubMed]
- Yamashita, K.; Takeuchi, N.; Taniguchi, H.; Yuyama, S.; Oe, K.; Mibuka, N.; Suzuki, A.; Mataki, H. Amplification properties of Tb(III) green emission in polymeric waveguide doped with Tb–Al nanocluster. J. Lumin. 2009, 129, 526–530. [Google Scholar] [CrossRef]
- McGehee, M.D.; Gupta, R.; Veenstra, S.; Miller, E.K.; Diaz-Garcia, M.A.; Heeger, A.J. Amplified spontaneous emission from photopumped films of a conjugated polymer. Phys. Rev. B 1998, 58, 7035. [Google Scholar] [CrossRef]
- Shaklee, K.L.; Leheny, R.F. Direct determination of optical gain in semiconductor crystals. Appl. Phys. Lett. 1971, 18, 475–477. [Google Scholar] [CrossRef]
- Yariv, A. Quantum Electronics, 3rd ed.; John Wiley & Sons: Hoboken, NJ, USA, 1989. [Google Scholar]
- Bhaktha, S.N.B.; Beclin, F.; Bouazaoui, M.; Capoen, B.; Chiasera, A.; Ferrari, M.; Kinowski, C.; Righini, G.C.; Robbe, O.; Turrell, S. Enhanced fluorescence from Eu3+ in low-loss silica glass-ceramic waveguides with high SnO2 content. Appl. Phys. Lett. 2008, 93, 211904. [Google Scholar] [CrossRef]
- Ghosh, S.; Valligatla, S.; Lukowiak, A.; Chiasera, A.; Ferrari, M.; Bhaktha, S.N.B. Time-resolved photoluminescence studies in Eu-doped SiO2—HfO2—ZnO glass-ceramic waveguides. Ceram. Int. 2017, 43, 1145–1149. [Google Scholar] [CrossRef]
- Ghosh, S.; Bhaktha, S.N.B. Effect of structural evolution of ZnO/HfO2 nanocrystals on Eu2+/Eu3+ emission in glass-ceramic waveguides for photonic applications. Nanotechnology 2018, 29, 225202. [Google Scholar] [CrossRef]


| Waveguide Composition (mol%) | Refractive Index (n) (±0.005) | Thickness (d) (±0.1 µm) | Propagation Loss @ 632.8 nm (±0.2 dB/cm) | Nanocrystal Size (nm) | Optical Gain (g) cm−1 |
|---|---|---|---|---|---|
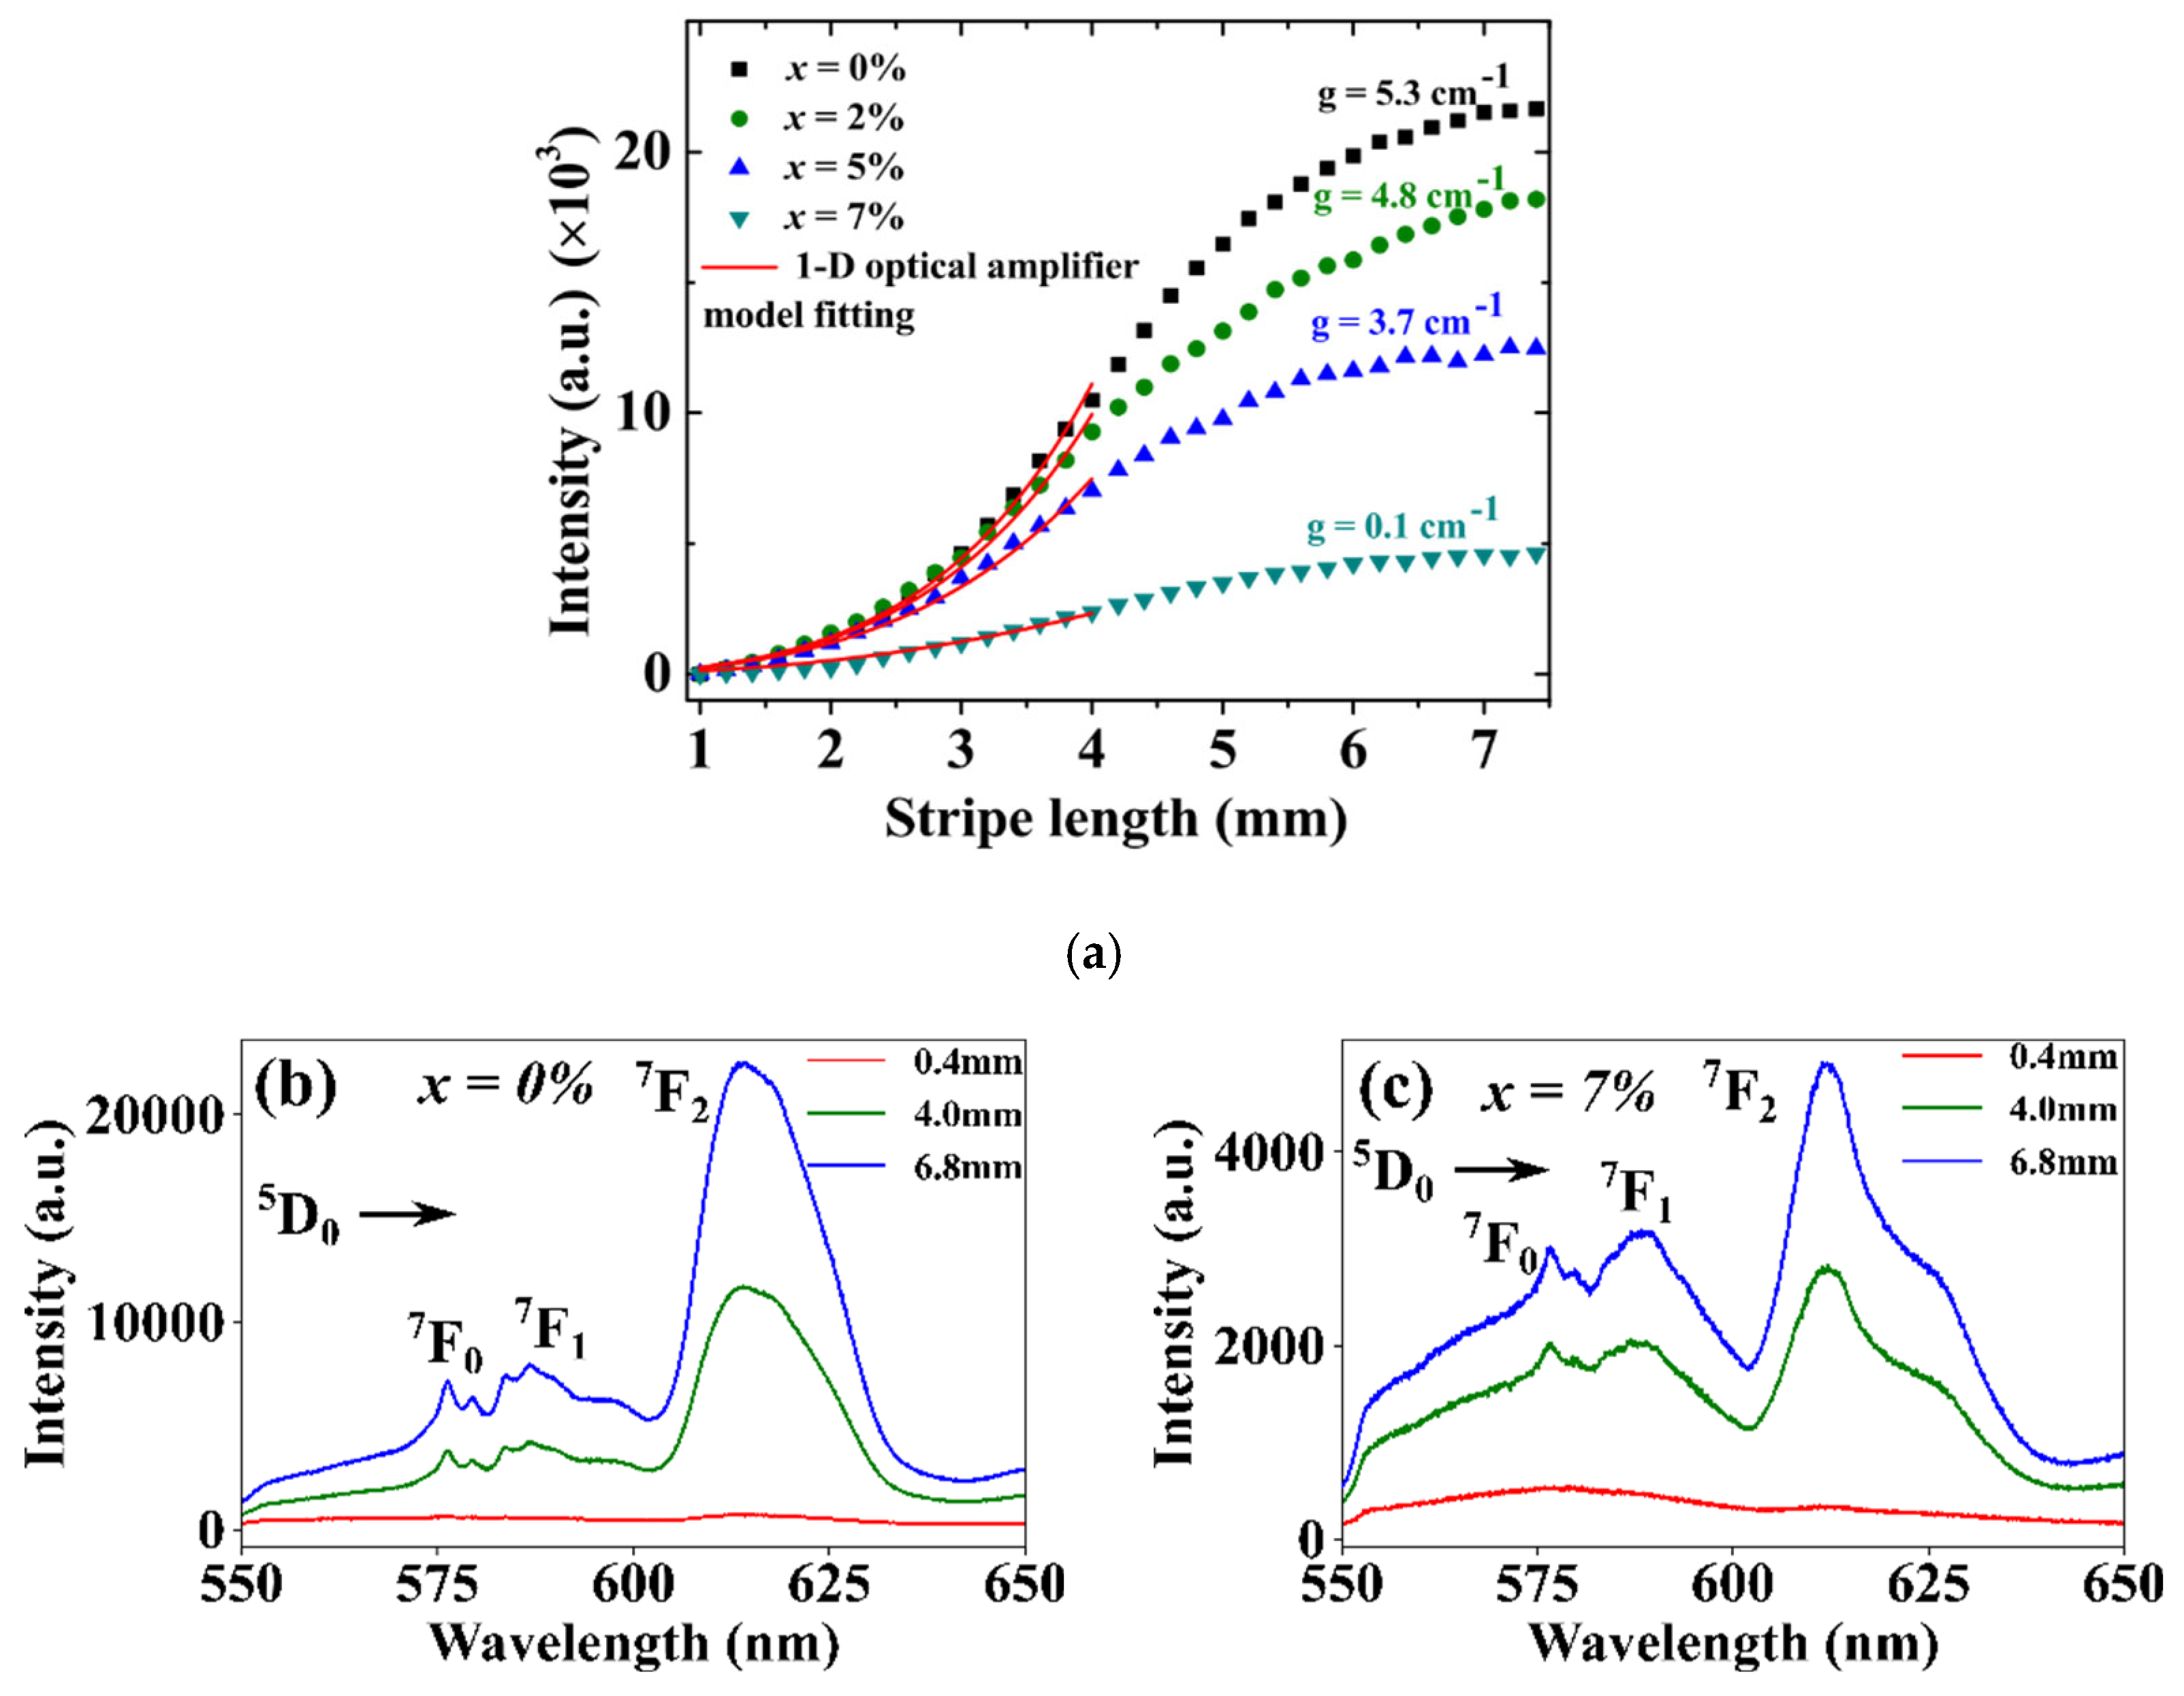
| 70 SiO2–30 HfO2 | 1.503 | 0.9 | 0.4 | - | 5.3 |
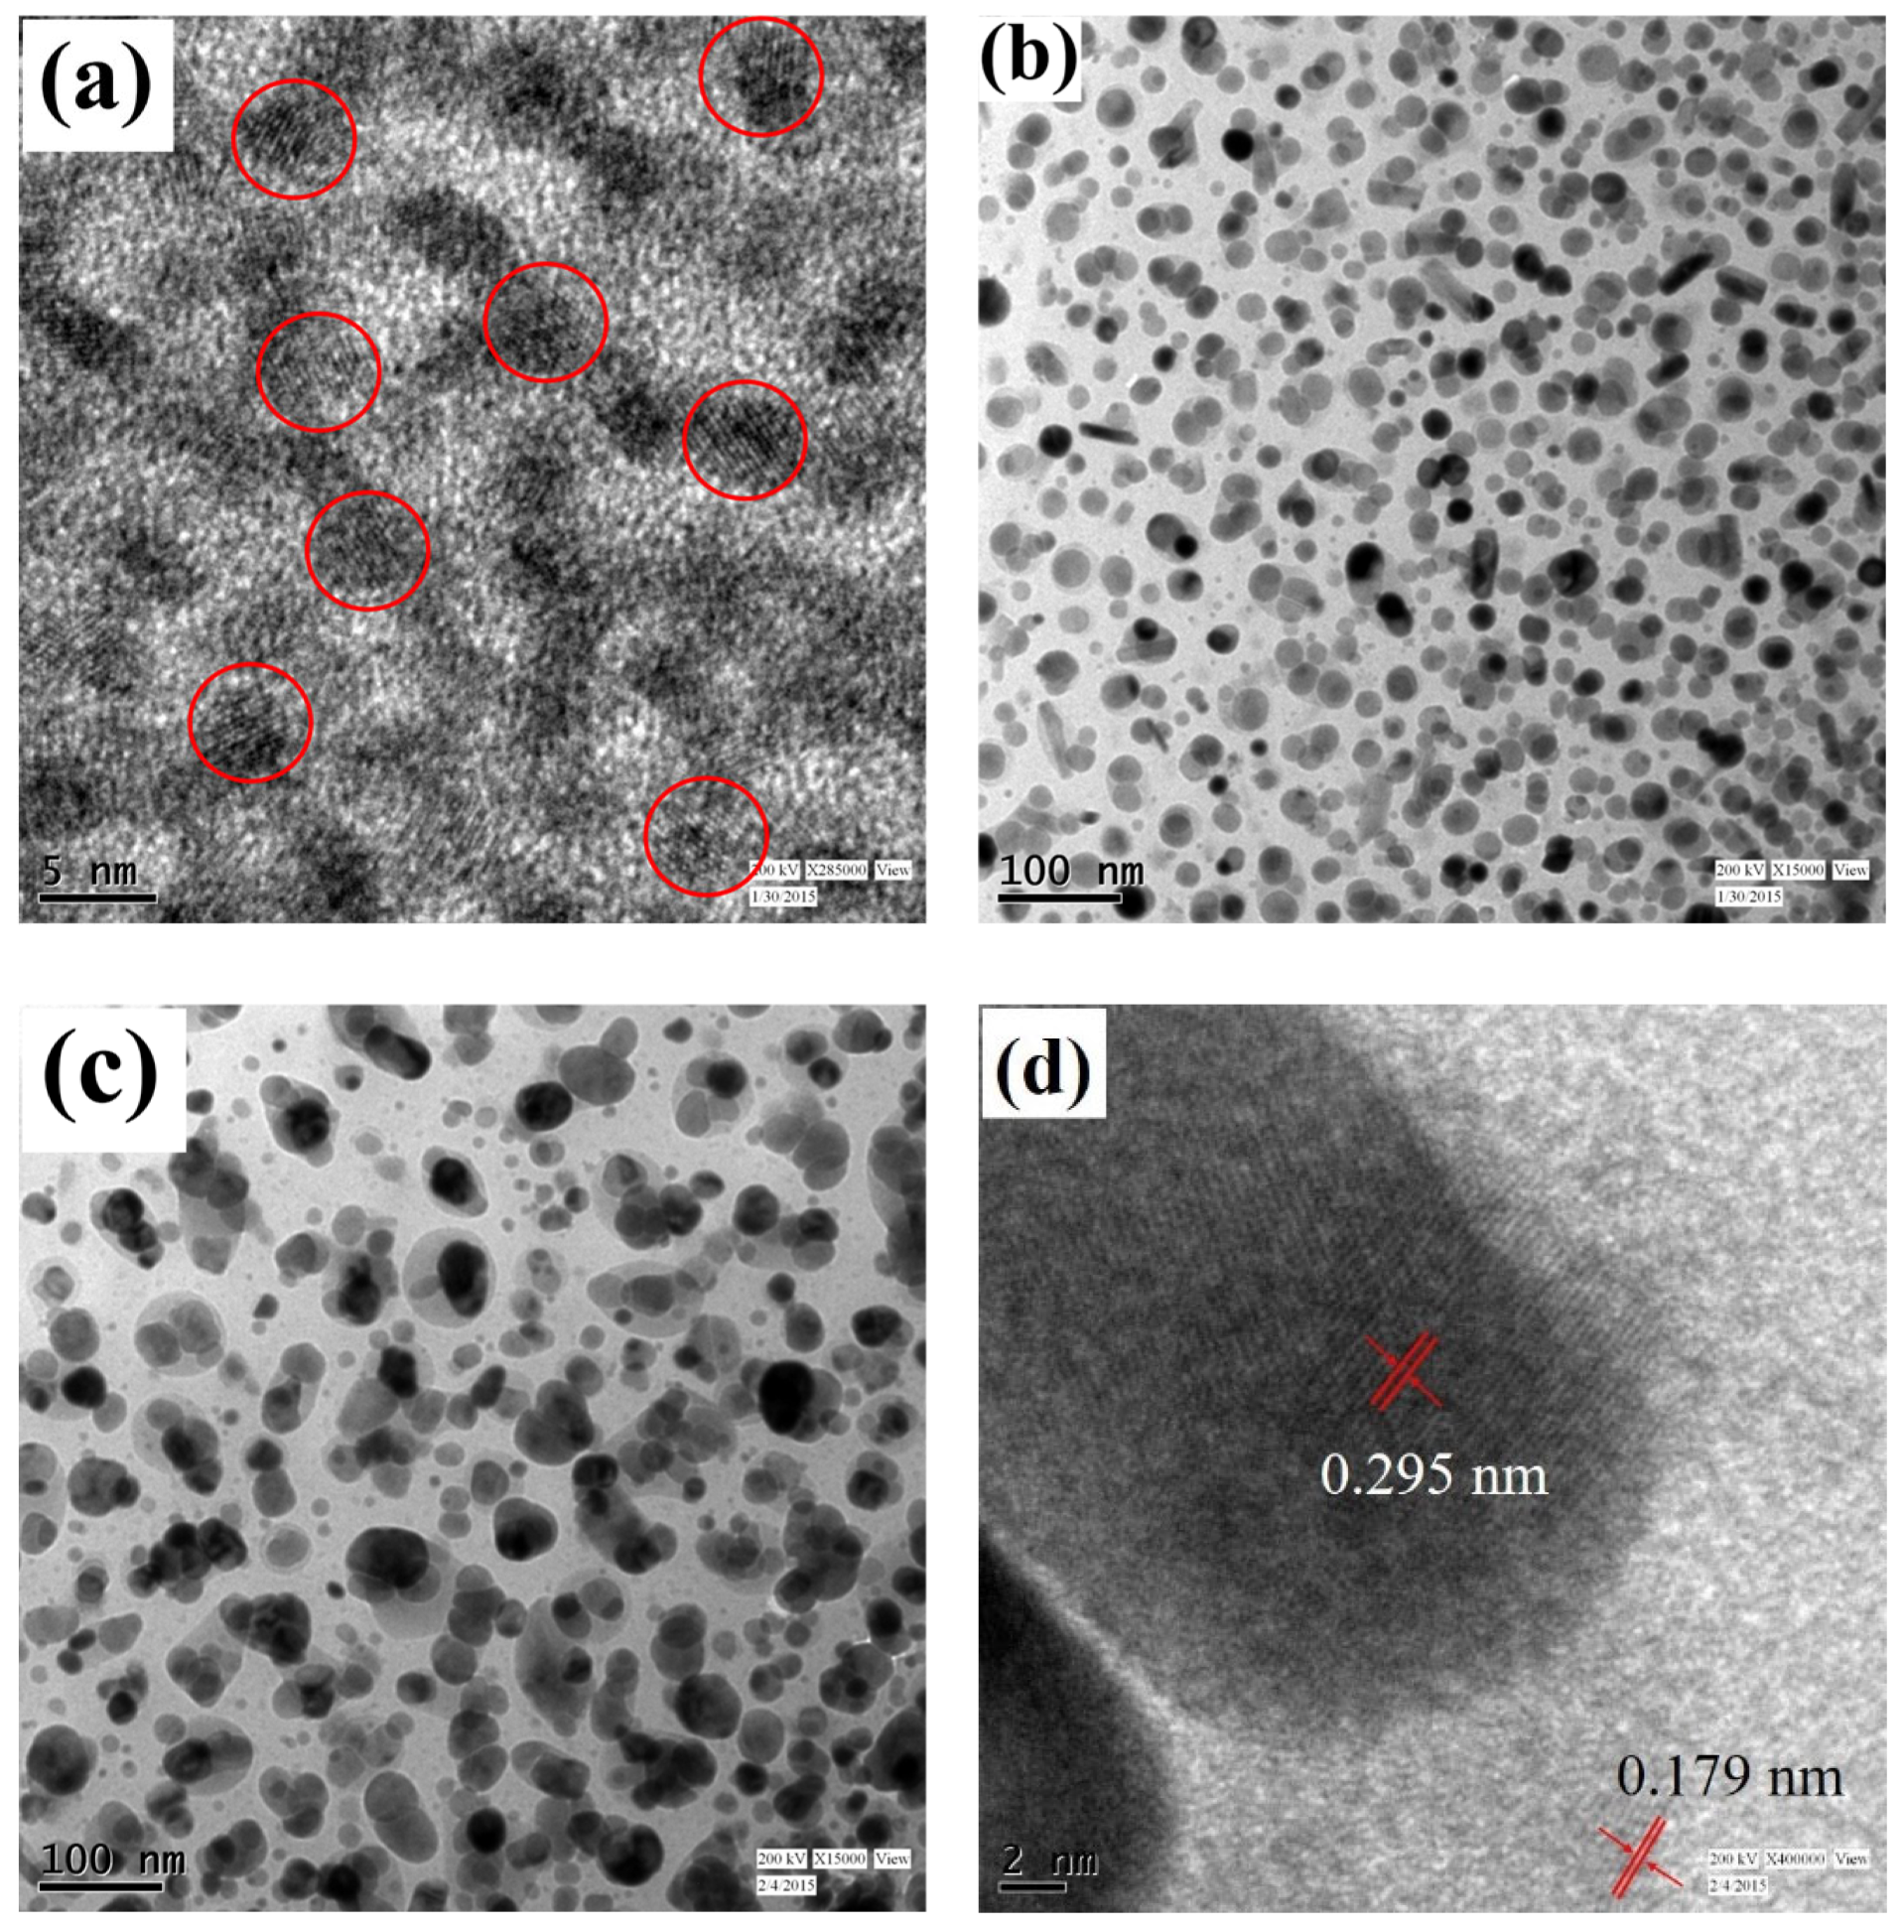
| 70 SiO2–28 HfO2–2 ZnO | 1.502 | 0.9 | 0.6 | 3 | 4.8 |
| 70 SiO2–25 HfO2–5 ZnO | 1.506 | 0.9 | 0.3 | 17 | 3.7 |
| 70 SiO2–23 HfO2–7 ZnO | 1.499 | 0.9 | 0.5 | 22 | 0.1 |
Disclaimer/Publisher’s Note: The statements, opinions and data contained in all publications are solely those of the individual author(s) and contributor(s) and not of MDPI and/or the editor(s). MDPI and/or the editor(s) disclaim responsibility for any injury to people or property resulting from any ideas, methods, instructions or products referred to in the content. |
© 2025 by the authors. Licensee MDPI, Basel, Switzerland. This article is an open access article distributed under the terms and conditions of the Creative Commons Attribution (CC BY) license (https://creativecommons.org/licenses/by/4.0/).
Share and Cite
Ghosh, S.; Turrell, S.; Ferrari, M.; N., S.B.B. Optical Gain in Eu-Doped Hybrid Nanocrystals Embedded SiO2-HfO2-ZnO Ternary Glass-Ceramic Waveguides. Spectrosc. J. 2025, 3, 3. https://doi.org/10.3390/spectroscj3010003
Ghosh S, Turrell S, Ferrari M, N. SBB. Optical Gain in Eu-Doped Hybrid Nanocrystals Embedded SiO2-HfO2-ZnO Ternary Glass-Ceramic Waveguides. Spectroscopy Journal. 2025; 3(1):3. https://doi.org/10.3390/spectroscj3010003
Chicago/Turabian StyleGhosh, Subhabrata, Sylvia Turrell, Maurizio Ferrari, and Shivakiran Bhaktha B. N. 2025. "Optical Gain in Eu-Doped Hybrid Nanocrystals Embedded SiO2-HfO2-ZnO Ternary Glass-Ceramic Waveguides" Spectroscopy Journal 3, no. 1: 3. https://doi.org/10.3390/spectroscj3010003
APA StyleGhosh, S., Turrell, S., Ferrari, M., & N., S. B. B. (2025). Optical Gain in Eu-Doped Hybrid Nanocrystals Embedded SiO2-HfO2-ZnO Ternary Glass-Ceramic Waveguides. Spectroscopy Journal, 3(1), 3. https://doi.org/10.3390/spectroscj3010003