Review

Advantages of In Situ Mössbauer Spectroscopy in Catalyst Studies with Precaution in Interpretation of Measurements

Budapest Neutron Centre, Institute of Energy Security and Environmental Safety, HUN-REN Centre for Energy Research, Konkoly-Thege M. Street, 29-33, 1121 Budapest, Hungary
Spectrosc. J. 2025, 3(1), 10; https://doi.org/10.3390/spectroscj3010010
Submission received: 11 February 2025 / Revised: 6 March 2025 / Accepted: 10 March 2025 / Published: 17 March 2025
(This article belongs to the Special Issue Feature Papers in Spectroscopy Journal)

Abstract

:
Mössbauer spectroscopy can be advantageous for studying catalysts. In particular, its use in in situ studies can provide unique access to structural features. However, special attention must be paid to the interpretation of data, since in most studies, the samples are not perfectly homogeneous. Balance and compromise should be found between the refinement of evaluations by extracting and interpreting data from spectra, while also considering the presence of possible inhomogeneities in samples. In this review, examples of studies on two types of catalysts are presented, from which, despite possible inhomogeneities, clear statements can be derived. The first example pertains to selected iron-containing microporous zeolites (with 57Fe Mössbauer spectroscopy), from which unique information is collected on the coordination of iron ions. The second example is related to studies on supported PtSn alloy particles (with 119Sn probe nuclei), from which reversible modifications of the tin component due to interactions with the reaction partners are revealed.

1. Introduction

Mössbauer spectroscopy is an exceptionally sensitive tool for measuring minuscule energy changes. It is able to attain a relative resolution with an order of magnitude of 10−10. This tiny change can be measured using the Doppler effect, which tunes the energies to reach resonance between the emitted and absorbed gamma rays of the source and absorbent nuclei. On the other hand, the number of elements suitable for study using this convenient method is limited. Fortunately, iron is suitable and is abundant in the Earth’s crust (the fourth most abundant element, with a 5.63% mass). Hence, iron is present in various places in the environment. Tin is the other suitable element. It should also be noted that the occurrence of the Mössbauer phenomenon is not connected to elements in general, and only certain isotopes of a given element exhibit the effect. Thus, the natural abundance of the given isotope is also an important parameter. The dedicated isotope for iron is 57Fe (2.12% natural abundance in iron), and for tin, 119Sn (8.59%). Significant development has taken place in the application of Mössbauer spectroscopy since the discovery of the principal phenomenon in 1958, as demonstrated by several excellent early [1,2,3] and more recent textbooks [4,5,6].
To attain high resolution in the determination of energy shifts, high precision is necessary. The natural line widths for iron and tin are 0.21 and 0.62 mm s−1, respectively, as expressed in units of the modified Doppler velocity scale. Details of its experimental implementation can be found in several excellent textbooks, e.g., [7].
In conventional measurements, the absorbance of gamma-rays is recorded independently of the velocity of the modulating Doppler movement. Counts of nuclear events are collected; thus, a certain length of time is necessary to attain an acceptable signal-to-background ratio. The lines in the spectra primarily have a Lorentzian shape due to the physical process involved.
Spectra are usually suitable for the qualitative detection of different components. Quantitative analysis is more sophisticated, since the response factor, the sensitivity, may differ between components (so-called f-factor). In most cases, spectra should be collected independently of temperature for determining the quantitative ratios of the detected components.
The accuracy of the measurements depends primarily on the physical parameters (sample geometry, linearity of drive signal [8], etc.) and on the number of channels in which spectra are collected. In a normal arrangement, spectra are collected in 1000 (or 1024) channels in a multichannel analyzer. The resolution depends on the concept of fitting [9] and can be improved by increasing the number of recording channels (at the expense of an increase in the time required for recording to maintain an acceptable signal-to-background ratio [10]) or by using a resonance detector [11]. The initial Lorentzian line shape can be distorted by thickness effects or by aging of the emitting source [12]. For evaluating the measurements, several computer programs have been developed (i.e., NORMOS [13], Mosswinn [14], Recoil, [15], CONFIT [16], Fit;o) [17], Moessfit [18]). Most of these programs are able to refine parameters (e.g., with distributions or non-linearity [19]) to obtain a better match with the measured data. It is advisable to check whether these presumptions have a real basis. The necessary circumstances for the unambiguous interpretation of measurements and data evaluation are discussed in detail in [20,21]. Provided there is sufficient confidence in the data and in their evaluation, comprehensive databases can be constructed in the next stage [22].
There are only a few instances of the interlaboratory comparison of measurements on the same samples to test the method’s reliability. For instance, good correspondence was obtained in the measured parameters of mineral samples in [23]. However, if we formulate the task a little more generally, for instance, in the case of determining the Fe2+/Fe3+ ratio in glass samples, mistakes can already be introduced by setting the wrong experimental parameters (e.g., selecting an incorrect velocity range for recording) or by failing to correctly evaluate the data. This was clearly demonstrated in an interlaboratory comparison with 46 participating laboratories, in which only ca. half of them reported acceptable results [24]. Generally, it is worth following the proposed practices and protocols for measurements and making every effort to avoid misinterpretations.
Catalysts can also be studied with Mössbauer spectroscopy. In particular, in situ conditions can easily be implemented, since gamma radiation easily penetrates an isolated cell; both the source and the detector can be placed outside at a certain distance from the sample. The literature on catalyst studies is rather rich (see, e.g., reviews [25,26,27,28]). Various types of in situ cells have also been described [29,30]; in addition, advanced models allow for treatment at high pressures [31,32]. Another stage of catalyst studies is using operando cells [33]. Their usage is more restricted than the use of other cells for two reasons. First, the previously mentioned f-factor is inversely proportional to the temperature, and most reactions take place at elevated temperatures; thus, more time is necessary for performing the measurements. Furthermore, the catalysts may change during the measurement process, and the collected spectrum may reflect an integrated sum of various stages in the evolution of states. As a compromise, reactions taking place at room temperature can also be assessed under in situ (simultaneously operando) conditions. Recently, excellent results have been achieved in studies of electrocatalysts with either iron [34] or tin [35]. However, in the following sections, only studies on conventional catalysts are presented.
Employing Mössbauer spectroscopy to study supported metal catalysts is also preferred. Usually, oxides of low-mass-number elements (Mg, Al, Si) are used as supports, and are nearly translucent under gamma rays, whereas transition metal particles absorb the radiation to a greater extent.
It is worth looking closer at the supported catalysts, which are illustrated in Figure 1. Here, gamma rays illuminate the entire cross section of the sample, where both the atoms located inside the bulk phase of particles and the catalytically important atoms located on the surface contribute to the recorded spectrum. The two types of atoms may differ in terms of their catalytic processes, since only the surface atoms interact with their reaction partners.
High-dispersion supported metal catalysts can easily be prepared with 70–80% surface exposure. Usually, the sizes of particles are not uniform, so size distribution should also be taken into account. The catalytic properties are barely influenced by the presence of a few larger particles, whereas larger particles have a greater influence on the summarized Mössbauer spectra when present in bulk.
Other inhomogeneities may also occur for various practical reasons when using in situ cells. For instance, the treatments may not be perfectly uniform in the whole cross section of the sample (there can be temperature gradients, flow rate differences between treating gases, etc.). A similar approach may be valid for the measurement temperature (if different from the room temperature). Another important factor is whether the sample is pelletized through compression (compression significantly increases the response factor of the effect [36]). In contrast, powder samples in sealed quartz ampoules are measured without any compression in several cases (e.g., [37,38]). Thus, the experimental conditions may play a significant role in the quality of the results, and they should always be considered during the interpretation of measurements and when comparing the results from various laboratories.
In most cases, effort is primarily devoted to finding the tightest fit of the measured spectra, and the inhomogeneities in the samples are neglected. Considering this additional condition in case of in situ catalyst studies, the range of this uncertainty may exceed 2–3 times the natural line width of the components. In the following sections, examples are presented that allow this increase in the line width to represent an acceptable compromise in efforts to obtain clear and interesting interpretations of spectra. In the first group of examples, 57Fe studies are presented on zeolites where separate iron ions contribute to building the porous structure. In these studies, distinct behaviors of charge-compensating extra-framework ions in LTA zeolites and framework-substituted ions in FER zeolites are demonstrated. In the second group of examples, 119Sn measurements reveal interactions of reaction partners with tin in supported PtSn bimetallic catalysts during the hydrodechlorination of dichloroethane at 473 K and during the oxidation of carbon monoxide at room temperature.

2. Experimental Background and Selected Materials

2.1. Samples

Zeolites containing iron in extra-framework sites have conventionally been prepared using methods such as impregnation [39], sonication [40], or solid-state ion exchange. In our case, the study of extra-framework iron was based on the utilization of red mud, a by-product of the Bayer process, in the first stages of aluminum production. Deferration was attempted in a secondary by-product with high SOD content in a series of experiments, using a modest amount of acid to obtain an amorphous product from which the excess iron was removed with reducing/complexing agents. The deferration resulted in the desired whitening, and the product was easily recrystallized to SOD and LTA structures. Interestingly the framework siting of iron was retained in the SOD-type end-product, whereas the extra-framework siting of iron was primarily characteristic of LTA [41]. In this series, a low-iron-content LTA sample (Si/Fe = 200) containing almost exclusively 57Fe was also studied.
FER-structure analog porous ferrisilicate, containing iron in structure-building framework sites, was prepared with a nominal Si/Fe ratio of 16. A solution of Fe2(SO4)3·6H2O was acidified with sulfuric acid to pH = 1.58, and in the next step, this solution was slowly added to a required amount of sodium silicate solution with stirring (28% SiO2 and 9% Na2O, pH = 11.0). A highly basic pyrrolidine template was added in the next stage, and FER crystals were formed via hydrothermal treatment in an autoclave at 433 K for 48 h. The samples were calcined at 773 K. The Na+/H+ form was converted to a NH4+ form via multiple ion exchange in 2M ammonium nitrate solution. After drying at 383 K, the final H+ form was set with stepwise calcination at 753 K for 6 h. Further details are given in [42].
Supported bimetallic PtSn catalysts were studied in two instances. For the hydrodechlorination of dichloroethane at 473 K, PtxSny/SiO2 catalysts were prepared with various Pt/Sn atomic ratios (x = 10, 2, 1; y = 0, 1, 2, 3), with a 1 wt% metal content [43] and with pore volume co-impregnation of Pt and Sn chlorides from their common solution. To study the oxidation of carbon monoxide at room temperature, a sample was prepared with a Pt/Sn ratio of 0.68 (at/at) by directly anchoring tin to the surface of Pt particles from 119Sn(CH3)4 to the 3 wt% Pt/SiO2 precursor in benzene at 323 K in a hydrogen atmosphere [44]. This applied Pt/Sn ratio corresponds to a nominal Pt:Sn = 3:2 composition.
Sample discs with a 2 cm diameter and 1–2 mm thickness were prepared by compressing the sample powders with 0.7 kBar cm−2 pressure.

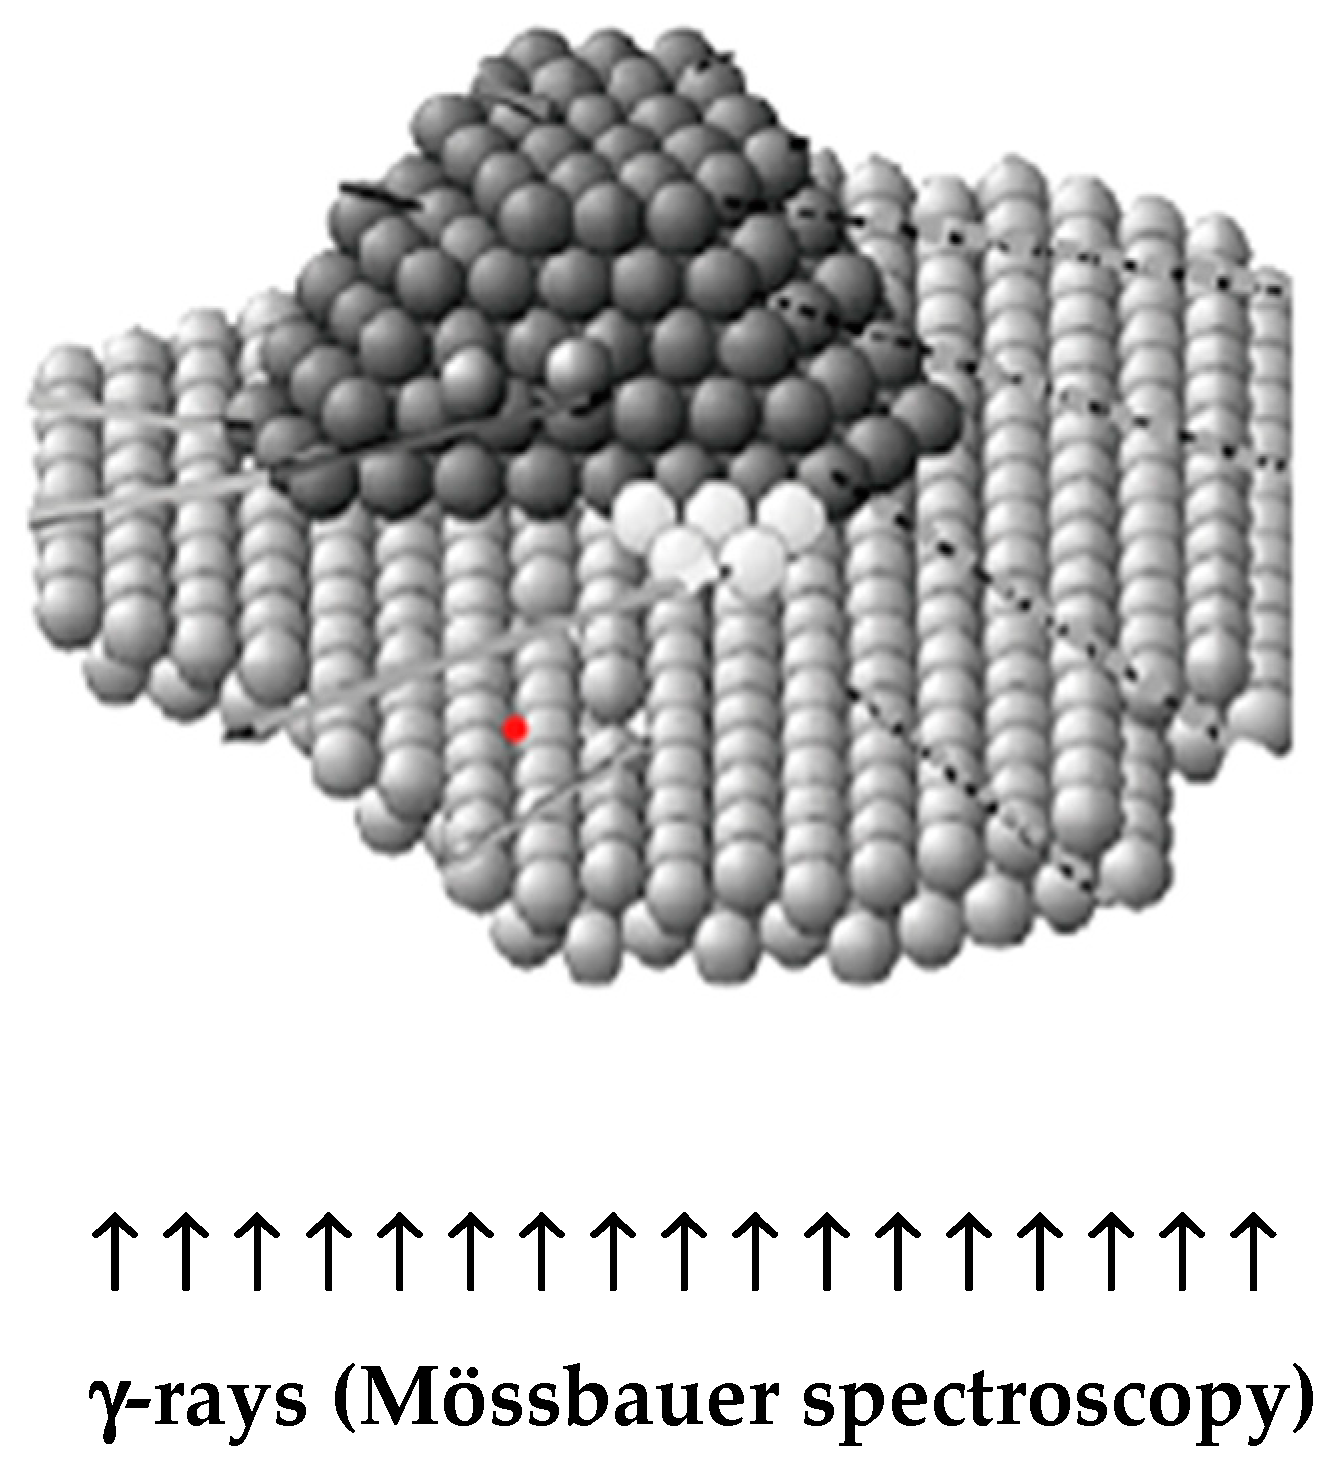
2.2. In Situ Mössbauer Measurements

The in situ cell described in [45] was used for performing measurements. The sample holder can be heated or cooled to liquid nitrogen temperature without opening the cell or changing the position of the sample. The cell can be evacuated to ca. 10 Pa or filled with various treating gases or mixtures of them. A series of treatments under different temperatures and atmospheric conditions were carried out for 2 h at each step. For 57Fe measurements, a 1 GBq 57Co/Rh source (with a 0.21 mm s−1 line width) was used, and for platinum–tin measurements, a 119mSn-containing calcium stannate source was used (400 MBq activity, 1.0 mm s−1 line width). The spectra were collected in 1000 channels using a triangular drive signal in constant acceleration mode. The two mirrored wings of the spectra, collected from the upward and downward branches of the triangle signal, were folded, resulting in a spectrum composed of 500 points (the hydrodechlorination spectra were collected in only 500 channels). A KFKI spectrometer was used with scintillation detection of gamma counts. The spectra were evaluated in terms of their fitting with Lorentzian line shapes using the SIRIUS program [46]. The quality of the fittings was evaluated by assessing the χ2 values (the normalized sums of the deviations of the measured and calculated count numbers). All of the fits presented in the figures are characterized by χ2 < 1.5. Additionally, the differences per channel are displayed at the bottom of each figure. Isomer shifts are related to metallic α-iron and BaSnO3, respectively. No spectral parameters were fixed at the fittings, and an accuracy of ±0.03 mm s−1 was estimated for the position parameters. Considering the possible occurrence of various inhomogeneities resulting from the experiment, line widths exceeding 2–3 times the natural ones were allowed to be assigned to components of the spectra.

3. Mössbauer Studies on Zeolites (Example 1)

Iron-containing zeolites may play a dominant role in various important catalytic processes [47]. They have received much interest since the observation of their strong oxidation potential after activation with N2O [48]. The objective of recent related studies is to reveal the stabilization α-oxygen in various zeolite structures in the framework of Al3+-extra-framework Fe2+ bridges ([49,50]).
Iron in zeolites is either dispersed in the inner channels or may play a role in the construction of the aluminosilicate porous structure. Iron can be incorporated both into charge-compensating extra-framework sites and into the structure-building framework site at the center of tetrahedrons. The primary cations are usually Si4+ and Al3+ in the latter positions, and the siting of iron is less common there. Ferrous ions occupy only extra-framework sites, whereas ferric ions may be located both in extra-framework and structure-building framework sites in the center of tetrahedrons, since the ionic diameters are different in tetrahedral coordination, at 77 pm for Fe2+ and 63 pm for Fe3+. The slimmer Fe3+ can be tightly incorporated into the central sites of tetrahedrons, while Fe2+ is too bulky and can only be located in the large structural cages of the framework. One primary Mössbauer parameter, isomeric shift (δ), is distinctly different for ferric and ferrous ions; thus, the two oxidation states can easily be distinguished. The other important Mössbauer parameter, quadrupole splitting, (Δ), depends strongly on the charge symmetry close to the ion; this parameter is an important tool for the identification of symmetry at an iron site. A δ-Δ diagram for ferric and ferrous ions in minerals has been constructed that can also be used for zeolites [51]. The first studies on zeolites with the Mössbauer technique were performed on extra-framework iron ions in Y zeolite in 1970 [29]. Clear identification of the framework siting of ferric iron took place several years later in ferrisilicate ZSM-5, in 1988 [52] and 1991 [53]. In both cases, an external magnetic field and a very low measuring temperature (4.2 K) were necessary to prove the framework siting of iron. The framework siting of iron was also confirmed by using simpler room-temperature in situ measurements in a vacuum (after dehydration at a higher temperature) on (Fe)ZSM-5, as deduced from large quadrupole splitting (Δ = 1.77 mm/s) in the same year (1991) [54]. Large quadrupole splitting indicates tetrahedral symmetry. However, if the sample is kept in air, water close to the iron is adsorbed [55], quadrupole splitting decreases, and the identification of tetrahedral siting is less convincing. Thus, the advantage of using in situ conditions for studying the emplacement of iron in zeolites was proven. Several studies have been performed since then. Here, we present two convincing examples: one demonstrating the various possibilities for extra-framework coordination in sodalite A zeolite, and another illustrating the variations in the coordination of framework iron occasionally combined with extra-framework iron in ferrierite (FER).

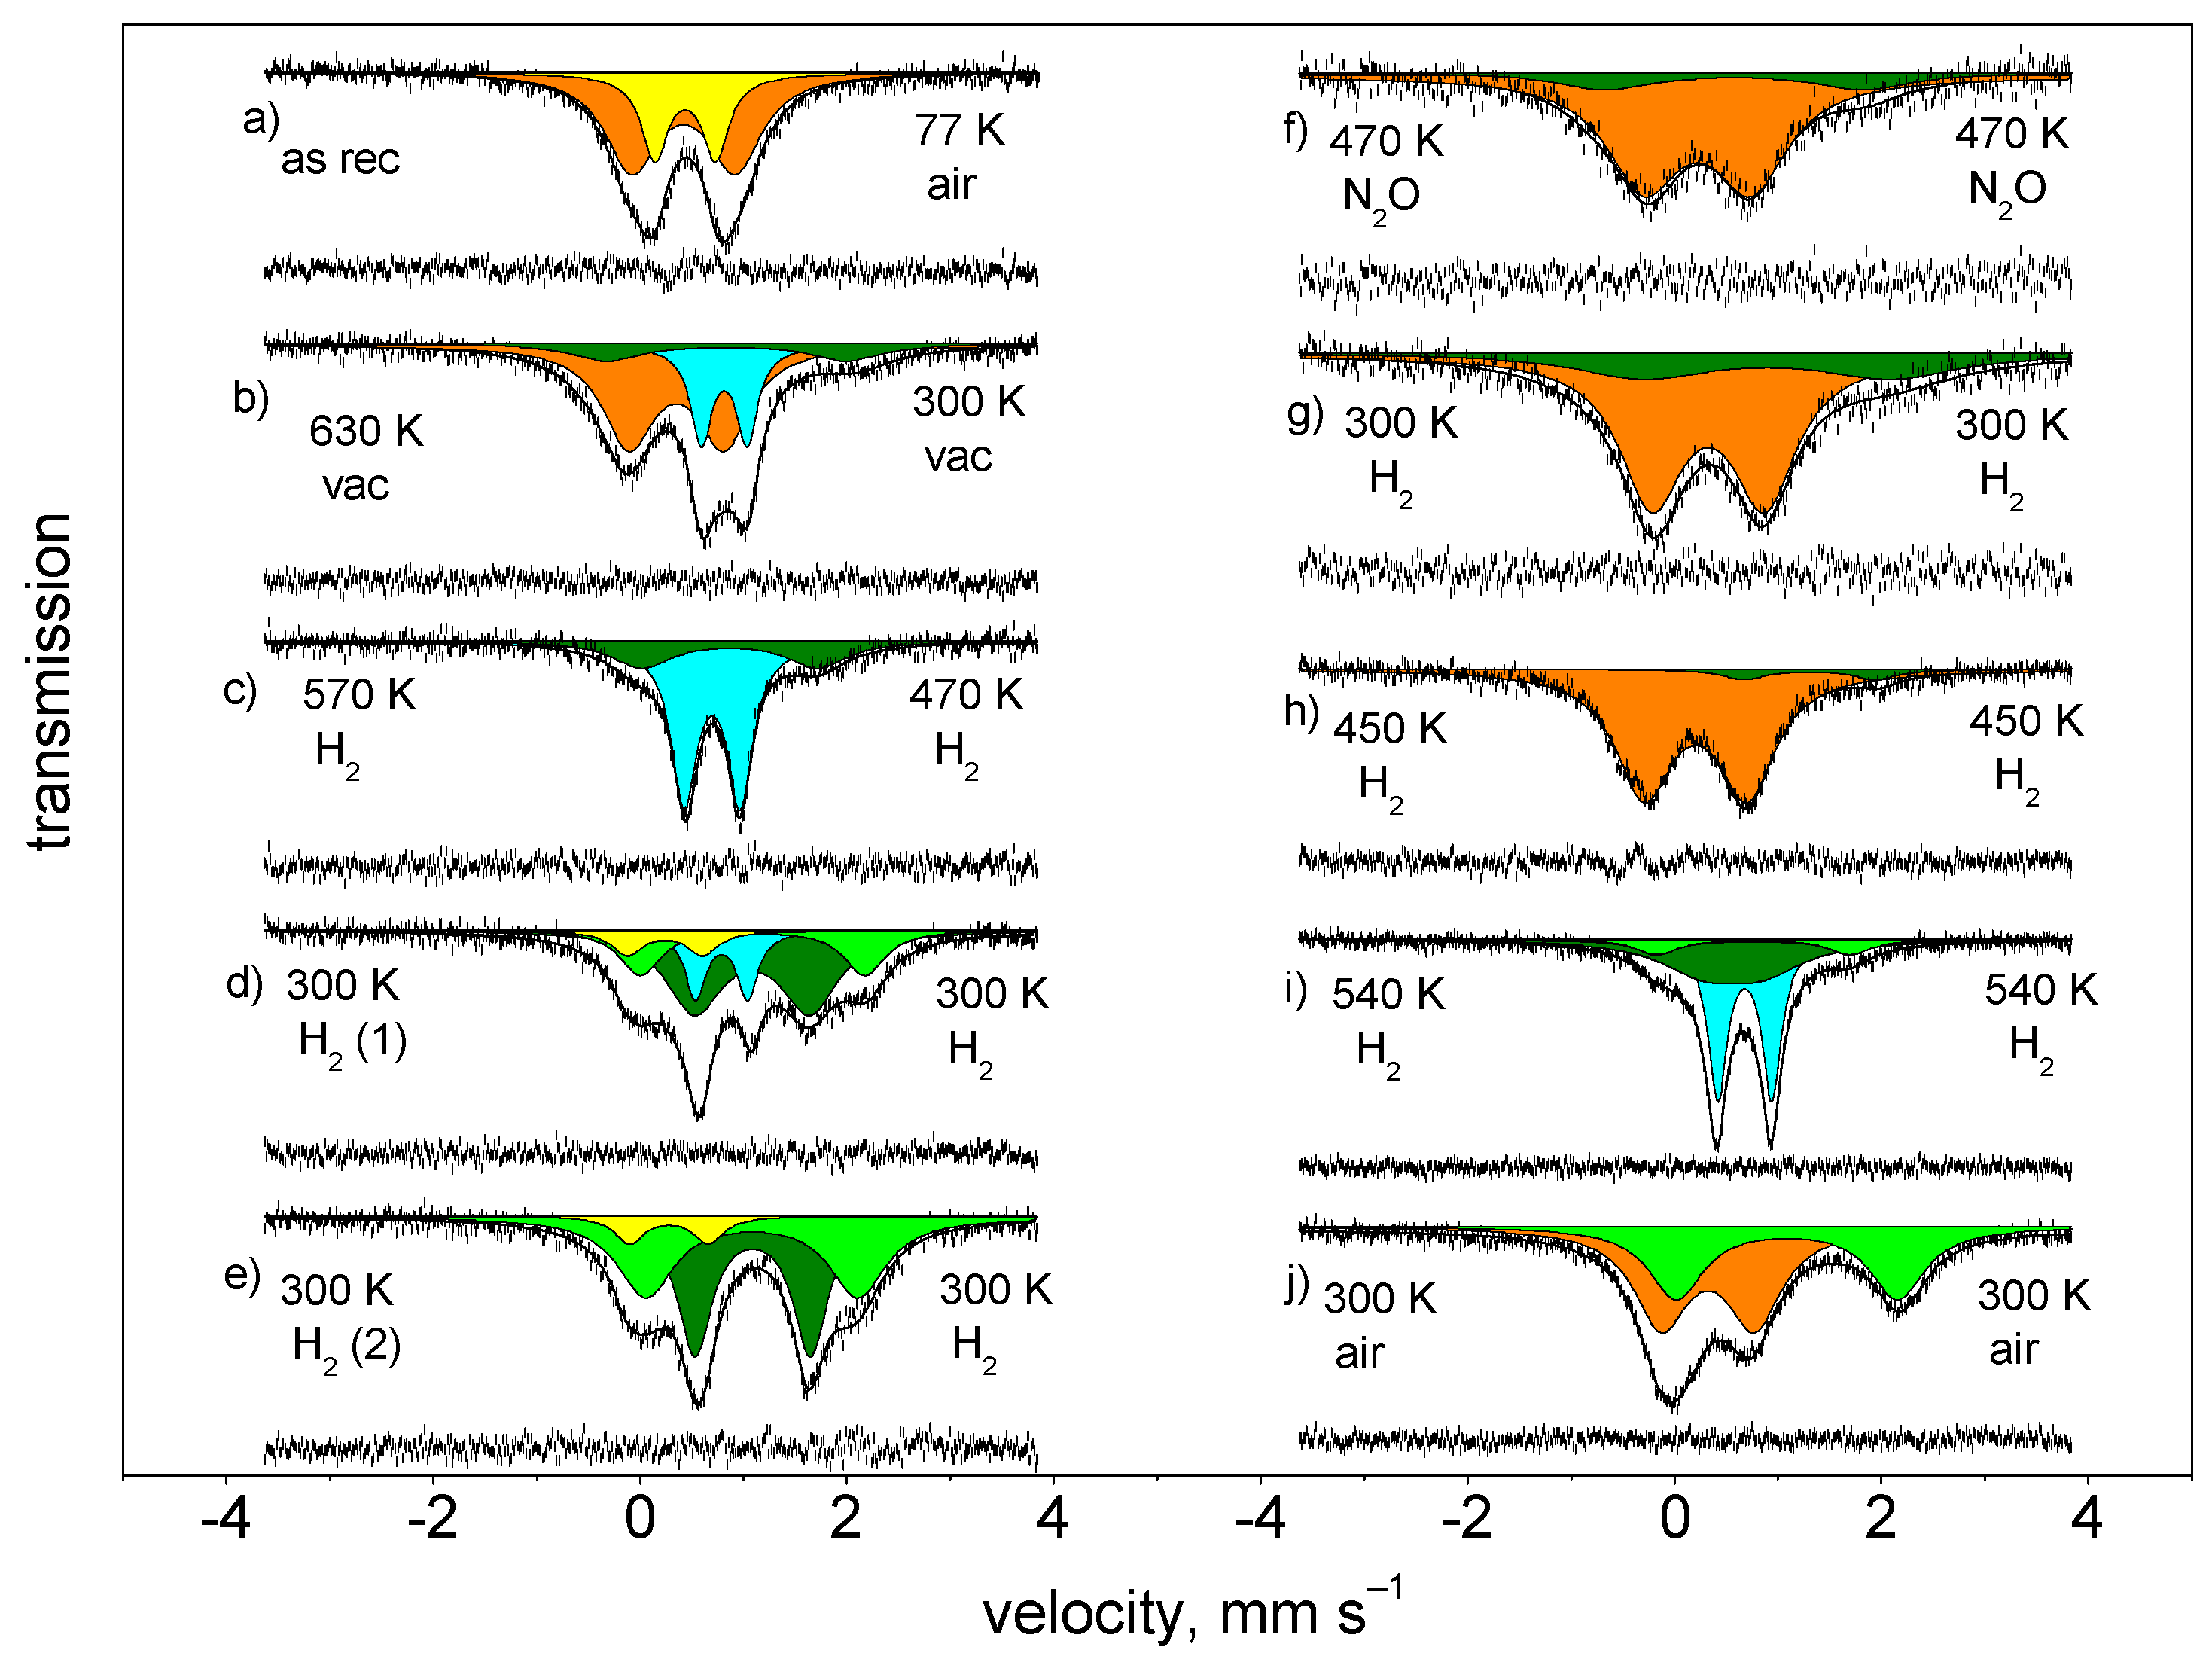
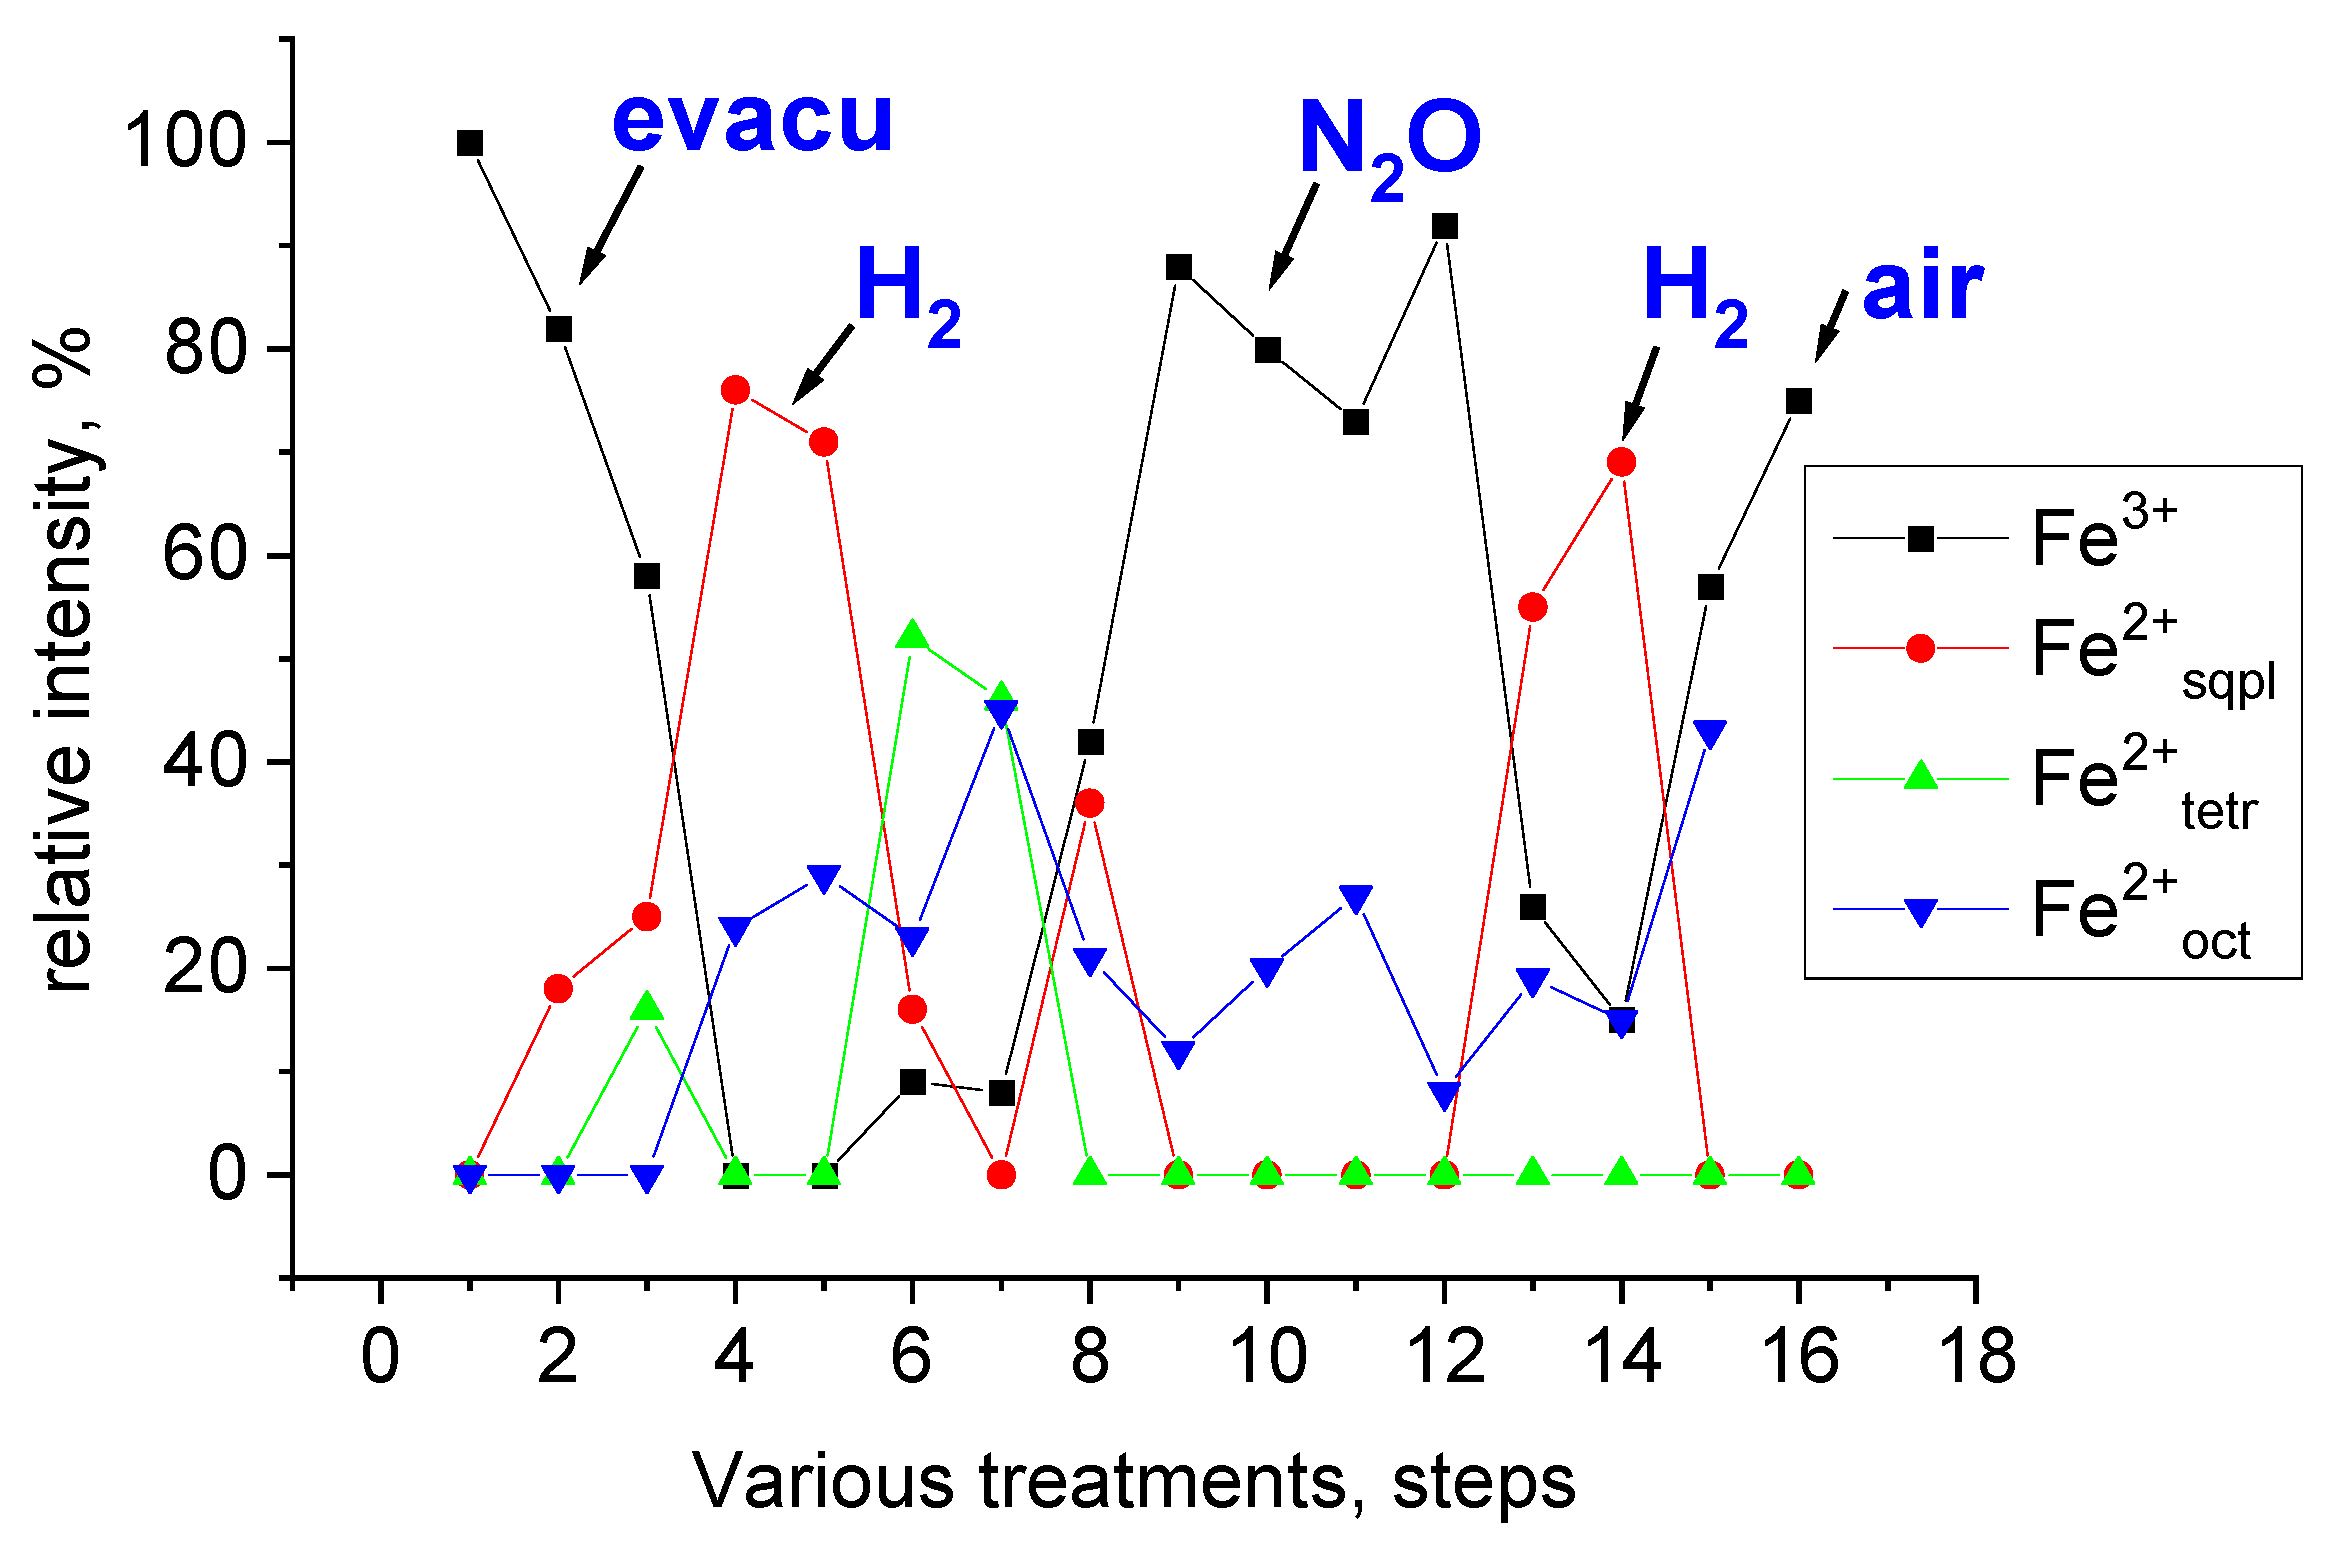
3.1. Demonstration of Extra-Framework Siting of Iron in Various Coordinations in 57Fe LTA Sample

The Mössbauer spectra obtained in the series of in situ measurements on this sample are presented in Figure 2 (the distinction of species follows the classification shown in [51]). Both ferric/ferrous oxidation states and changes in coordination are clearly demonstrated. The data extracted from the decomposition of the spectra are listed in Table 1 (it is important to note that spectra were recorded at different temperatures).
The presence and transformation of different oxidation and coordination states and their interconversion in the series of treatments are clearly shown. In Figure 2a, the spectrum of calcined samples is composed of two Fe3+ doublets. Regarding the evacuation results for the autoreduction of ferric ions, ca. 40% of them are reduced to a ferrous state (Figure 2b). This phenomenon was induced by the adsorbed water, as already observed on extra-framework iron in Y zeolites in previous studies [38]. Reduction to a ferrous state can be attained by 2 h of treatment in hydrogen at 570 K for the whole amount of iron (Figure 2c). During two-day storage in hydrogen in the in situ cell at room temperature, water is gradually coordinated to the ferrous ions, completing their coordination sphere (it should be noted that in comparison to Figure 2d,e, the hydrogen used was slightly moist). N2O was used for the re-oxidization of ferrous iron at 470 K. Note that the collection of this spectrum also took place at 470 K; thus, this spectrum is representative of an operando spectrum, as is the spectrum shown in Figure 2f. The attempted re-reduction of hydrogen resulted in limited ferrous content at room temperature (Figure 2g), and even at 450 K (Figure 2h). The modest elevation of temperature to 540 K was successful, resulting in complete reduction to a ferrous state (Figure 2i). Opening the in situ cell and exposing it to air for 7 h resulted in gradual, slow oxidation with the retention of a significant portion of the ferrous component (Figure 2j). It should be noted that the starting sample contained a significant amount of adsorbed moisture, and ca. 20% of the starting weight was lost during treatments (a)–(i). This weight was fully regained upon keeping the sample in air before and during collection of the final spectrum (Figure 2j). The presented series of spectra demonstrates that coordination changes around the extra-framework ferrous ions take place primarily at room temperature, and at higher temperature (540 K), the site characterized by δ ≈ 0.6 mm s−1, Δ ≈ 0.6 mm s−1 doublet is dominant. Further, both the ferrous and ferric states are relatively stable, and the ferric-to-ferrous reduction of hydrogen proceeds only above ca. 500 K (Table 1).
Various coordination sites can be assigned to doublets characterized by different δ-Δ pairs of parameters [51]. Assuming three accessible coordination states for ferrous iron (square planar, tetrahedral, and octahedral) and one for the ferric site, the changes in the proportions of the spectra can be determined (Figure 3). The actual series of treatments consisted of 16 stages (some evacuation treatments are omitted from Figure 2 and Table 1 for conciseness).
The previous series of treatments can be summarized into two observations: i. a variety of coordinations can be derived for Fe2+ ions (in particular, the inclusion of water in the coordination sphere is clearly reflected); ii. the reduction of Fe3+ extra-framework ions to Fe2+ in hydrogen starts ca. above 500 K.
The influence of water is worth mentioning. DFT calculations show that various extra-framework catalytic centers may form and act depending on the water content in N2O decomposition [57]. More recent studies have reported, e.g., the application of BEA, MFI, and FER catalysts containing extra-framework iron ions for N2O decomposition and the oxidation of methane [50,58].

3.2. Framework Iron Ions in Ferrierite Analog Ferrisilicate

Only ferric iron, with its 63 pm diameter, is suitable for the isomorph substitution of silicon in the centers of elementary structure-building [SiO4/2] tetrahedrons in zeolites. The presence of trivalent cations in the center of the [O4/2]4- tetrahedron results in the appearance of an uncompensated negative charge, which should be compensated with a suitable extra-framework cation. In the synthesis of ferrisilicates, a small fraction of ferric ions may be left out of the tetrahedral sites, taking part in charge compensation alongside protons or hydroxonium ions. Depending on the conditions, the hydroxyl group, water, or various reactants can also be coordinated to fill the coordination sphere of extra-framework ions, in addition to the ferric/ferrous redox capability of the extra-framework iron ions. Thus, ferrisilicates are suitable catalysts for mild oxidation reactions.
A zeolite analog ferrisilicate with a ferrierite (FER) structure was selected to illustrate the potential of in situ Mössbauer spectroscopy for characterizing various iron sites. Particular attention was devoted to detecting the presence of occasional Fe3+ (framework)–Fe2+/3+ (extra-framework) pairs that may play roles in redox catalytic processes. Spectra were collected in an in situ cell in each step of the series of treatments (Figure 4). The data obtained from the decomposition of the spectra are presented in Table 2.
The spectrum shown in Figure 4a was recorded for the starting calcined sample, and two Fe3+ doublets were obtained from its decomposition. The evacuation at an elevated temperature (620 K) resulted in a decrease in isomeric shift and a significant increase in quadrupole splitting (δ = 0.24 mm s−1, Δ = 1.98 mm s−1), as reflected in two-thirds of the spectrum in Figure 4b. This component with large quadrupole splitting is attributed to the framework-substituted iron in the tetrahedral site. It is worth mentioning that evacuation at a higher temperature and taking measurements in a vacuum were essential to observe these parameters. The spectrum shown in Figure 4a reflects almost the same structure. The only difference is that a small amount of coordinated water fills the coordination near the tetrahedral iron (Figure 4a), and the removal of the water results in appearance of clear tetrahedral coordination, as shown in Figure 4b. It should also be noted that autoreduction does not take place, contrasting with the case of extra-framework iron shown in Figure 2a,b. Treatment at 620 K in H2 results in an Fe3+-to-Fe2+ transformation in only ca. half of the iron (Figure 4c). In comparison, in the LTA sample, ferric-to-ferrous reduction in hydrogen was achieved for all iron at 540 K (Figure 2c). The Fe2+ state is less stable, and only a small portion of iron is retained in this reduced form in hydrogen at room temperature (Figure 4d). Unexpectedly, the presence of a ferrous doublet with large quadrupole splitting becomes more pronounced upon cooling the sample to 80 K (Figure 4e). This may indicate that the detection sensitivity and response and f-factor depend more strongly for Fe2+ than for Fe3+ on the measurement temperature. The second evacuation at 620 K practically restores the state observed after the first evacuation (the spectrum in Figure 4f is rather similar to the shape in Figure 4b). Repeating the hydrogen treatment at 620 K changes the structure to a minor extent, as reflected in the comparison of Figure 4g with Figure 4c. The Fe2+ state is retained in a vacuum, and decreases with an increase in recording temperature (140 K in Figure 4h and 300 K in Figure 4i). During the evacuation/reduction cycles, a minor change in the structure probably takes place, since 13% of the spectral area can be assigned to the ferrous component, and there is a stable prevalence of the tetrahedrally coordinated ferric iron with the δ = 0.24, Δ = 1.96 mm s−1 parameters in the spectrum recorded at room temperature after the third evacuation at 620 K (Figure 4j).
It is worth highlighting the three main observations deduced from the series of Fe(framework)-FER spectra in comparison with those of the Fe(extra-framework)-LTA series:
i. Autoreduction does not take place in the FER samples upon evacuation at 620 K. It should be noted that the amount of adsorbed water in the FER structure is much smaller than that in LTA, and the weight loss in this series was only 8% for the FER sample, in comparison to the mentioned 20% for the LTA one.
ii. A maximum of only half the amount of ferric iron can be reduced in hydrogen at 620 K, and the ferric–ferrous transformation is reversible for this part. This strongly suggests that connected Fe3+(framework)–Fe2+/3+(extra-framework) couples may exist, since there are no other charge-compensating ions present, except the extra-framework ones. (In comparison, the whole amount of iron was involved in the ferric-to-ferrous reversible transformation in LTA.)
iii. Different temperature dependence was observed for the f-factors of the Fe3+ and Fe2+ contributions. (This is the subject of a more detailed analysis, as described in [59].)
Two oxidation reactions were also carried out using the mentioned Fe-FER samples containing Fe3+(framework)–Fe2+/3+(extra-framework) couples. Oxidation of n-hexane and phenol was carried out with hydrogen peroxide, and 15% and 50% conversions to hexanone and hydroquinone, respectively, were achieved. Further details are given in [42].

4. Metals/Alloys (Example 2)

High-dispersion supported metallic particles are also widely used as catalysts. Noble metals (Pt, Pd, etc.) play a primary role in catalyzing important processes in industry and in the production of pharmaceutics and other refined chemicals. Several important large-scale industrial processes related to carbon–hydrogen reactions are based on the Mössbauer active element, iron, or on its alloys (Fischer–Tropsch processes, water–gas shift reactions, methane conversions, etc.). The elementary stages of these reactions have also been studied in advanced in situ Mössbauer cells (e.g., [31,32]).
The other widely used Mössbauer active element, tin, is usually not applied as a principal component in catalysts; instead, it is commonly used as a catalyst modifier, e.g., in Pt-based catalysts. A particular advantage of studying PtSn bimetallic catalysts is that the isomer shift linearly depends on the composition of the alloy [60]. Thus, in addition to the oxidation state of tin (doublets of Sn4+, Sn2+), the composition of the PtxSny alloy can also be deduced in the zerovalent metallic phase. In the case of a Pt-Sn binary system, five distinct binary alloys exist (Pt3Sn, PtSn, Pt2Sn3, PtSn2, PtSn4), and each of them has its own crystal structure [61]. Their different compositions and structures have a very important consequence from the point of view of catalysis. Namely, the different structures form different crystal faces, and thus, the surface coverage of Pt and Sn atoms in the planes of various Miller indices may be distinctly different. The roles of Pt and Sn are different in the process of catalysis; thus, the differences in the extent of their surface exposure may have a direct influence on their catalytic performance [62]. Several in situ studies have been carried out to study PtSn catalysts. For example, one study provided evidence on the existence of metallic tin on the surface of bimetallic catalysts [28], and another observed redox changes in tin [63].
In the following section, two other unique examples are presented to demonstrate the potential of in situ Mössbauer studies.

4.1. In Situ Dehydrochlorination of 1,2-Dichloroethane, ClCH2-CH2Cl

The process of in situ dehydrochlorination is important, since dichloroethane is a toxic by-product in PVC production that can be converted with an appropriate catalyst into more useful ethene. Various catalysts were prepared and they have also been studied using the 119Sn Mössbauer method [43]. Prior to the reaction, bimetallic phases were formed and stabilized through the two-stage reduction of hydrogen at 490 and 620 K. Finally, the catalysts were exposed to the flow of a mixture of ClCH2-CH2Cl + H2 + N2 (1:5:25) for 24 h at 473 K in the in situ cell. Consecutive Mössbauer spectra were recorded after each stage of the series at 77 K. The series of spectra of the most active Pt1Sn2 catalyst is shown in Figure 5.
Significant changes in the state of tin and, consequently, in the state of the (bi)metallic phases can be deduced from the evaluation of the spectra. In the first stage, impregnation with the SnCl2 solution was carried out. In contrast, after drying and storage in air, only Sn4+ was detected in the spectrum in Figure 5a. The distinction of the five different Pt-Sn alloys in the spectra shown in Figure 5b–d is not convincing; thus, for simplicity, the Pt-Sn phases were decomposed into only two components containing tin to a smaller or larger extent (marked as Pt-Sn(a) and Pt-Sn(b), respectively). All three oxidation states of tin (Sn4+, Sn2+, Sn(0)) appear in the spectrum recorded after the reduction of hydrogen at 493 K. The process of alloy formation is still in the early stages, and the observed average isomer shift for Pt-Sn(a) is only 1.39 mm s−1, less than that of the most Pt-rich component, Pt3Sn [59]. In contrast, the isomer shift achieved for the other component, Pt-Sn(b), is even closer to the δ value of metallic tin (2.57 mm s−1) than to that of the most tin-rich component, PtSn4 (2.28 mm s−1). Upon increasing the temperature of reduction to 623 K (significantly exceeding the melting point of tin at 505 K), alloy formation is more expressed. The largest part of the spectrum in Figure 5c displays a component with δ = 2.16 mm s−1, a value that characterizes PtSn2 composition [59], in full correspondence with the starting nominal Pt-to-Sn ratio at impregnation. Thus, the second treatment in hydrogen at a more elevated temperature stabilizes the nominal 1:2 Pt-to-Sn ratio in three-quarters of the bimetallic component. Surprisingly, Pt-Sn separation takes place during 24 h treatment in the reaction mixture at a lower temperature (473 K). The observed isomer shift for the Pt-Sn(b) component is the same as that for β-Sn. More than half of the tin segregates are in metallic form, most likely as a result of strong interaction with an intermediate chlorine-containing reaction. On the other hand, since tin has left the bimetallic alloy, the remaining component becomes tin-rich. In a first rough approximation, different roles can be attributed to these two metallic components. Namely, β-Sn fixes ClCH2-CH2Cl and the other reaction component; hydrogen molecules are dissociated and activated in the Pt-rich phase. After the formation of two HCl molecules, ethene is also desorbed.
Further information can also be extracted from this series of measurements performed in the in situ cell. The measuring geometry was the same, the cell was not opened, and the position of the sample was not changed; thus, the stepwise gross Mössbauer relative absorptions (the spectral absorption area related to the intensity of the blank base line without absorption) can also be compared (Srel values, the seventh column in Table 3). In the first approximation, it gives information on the average bonding strength of various tin species. Tin is bonded most loosely after impregnation and drying. Heat treatments and alloy formation significantly increase the average bonding strength. A slight decrease can be observed in the final treatment, as reflected in the corresponding series of Srel values in Table 3. The Srel value is practically reflecting the average of the bonding strengths of the different components, which are strongly connected to the mentioned f-factors. The approximate f-factors can be deduced from the temperature-dependent measurements of the center shift [64], and the relative spectral areas [65] and bonding strengths of individual components can also be estimated, as detailed in the following paragraphs.
To summarize the previous series, a change in the composition of the bimetallic catalyst due to an interaction with a reaction component was clearly demonstrated.

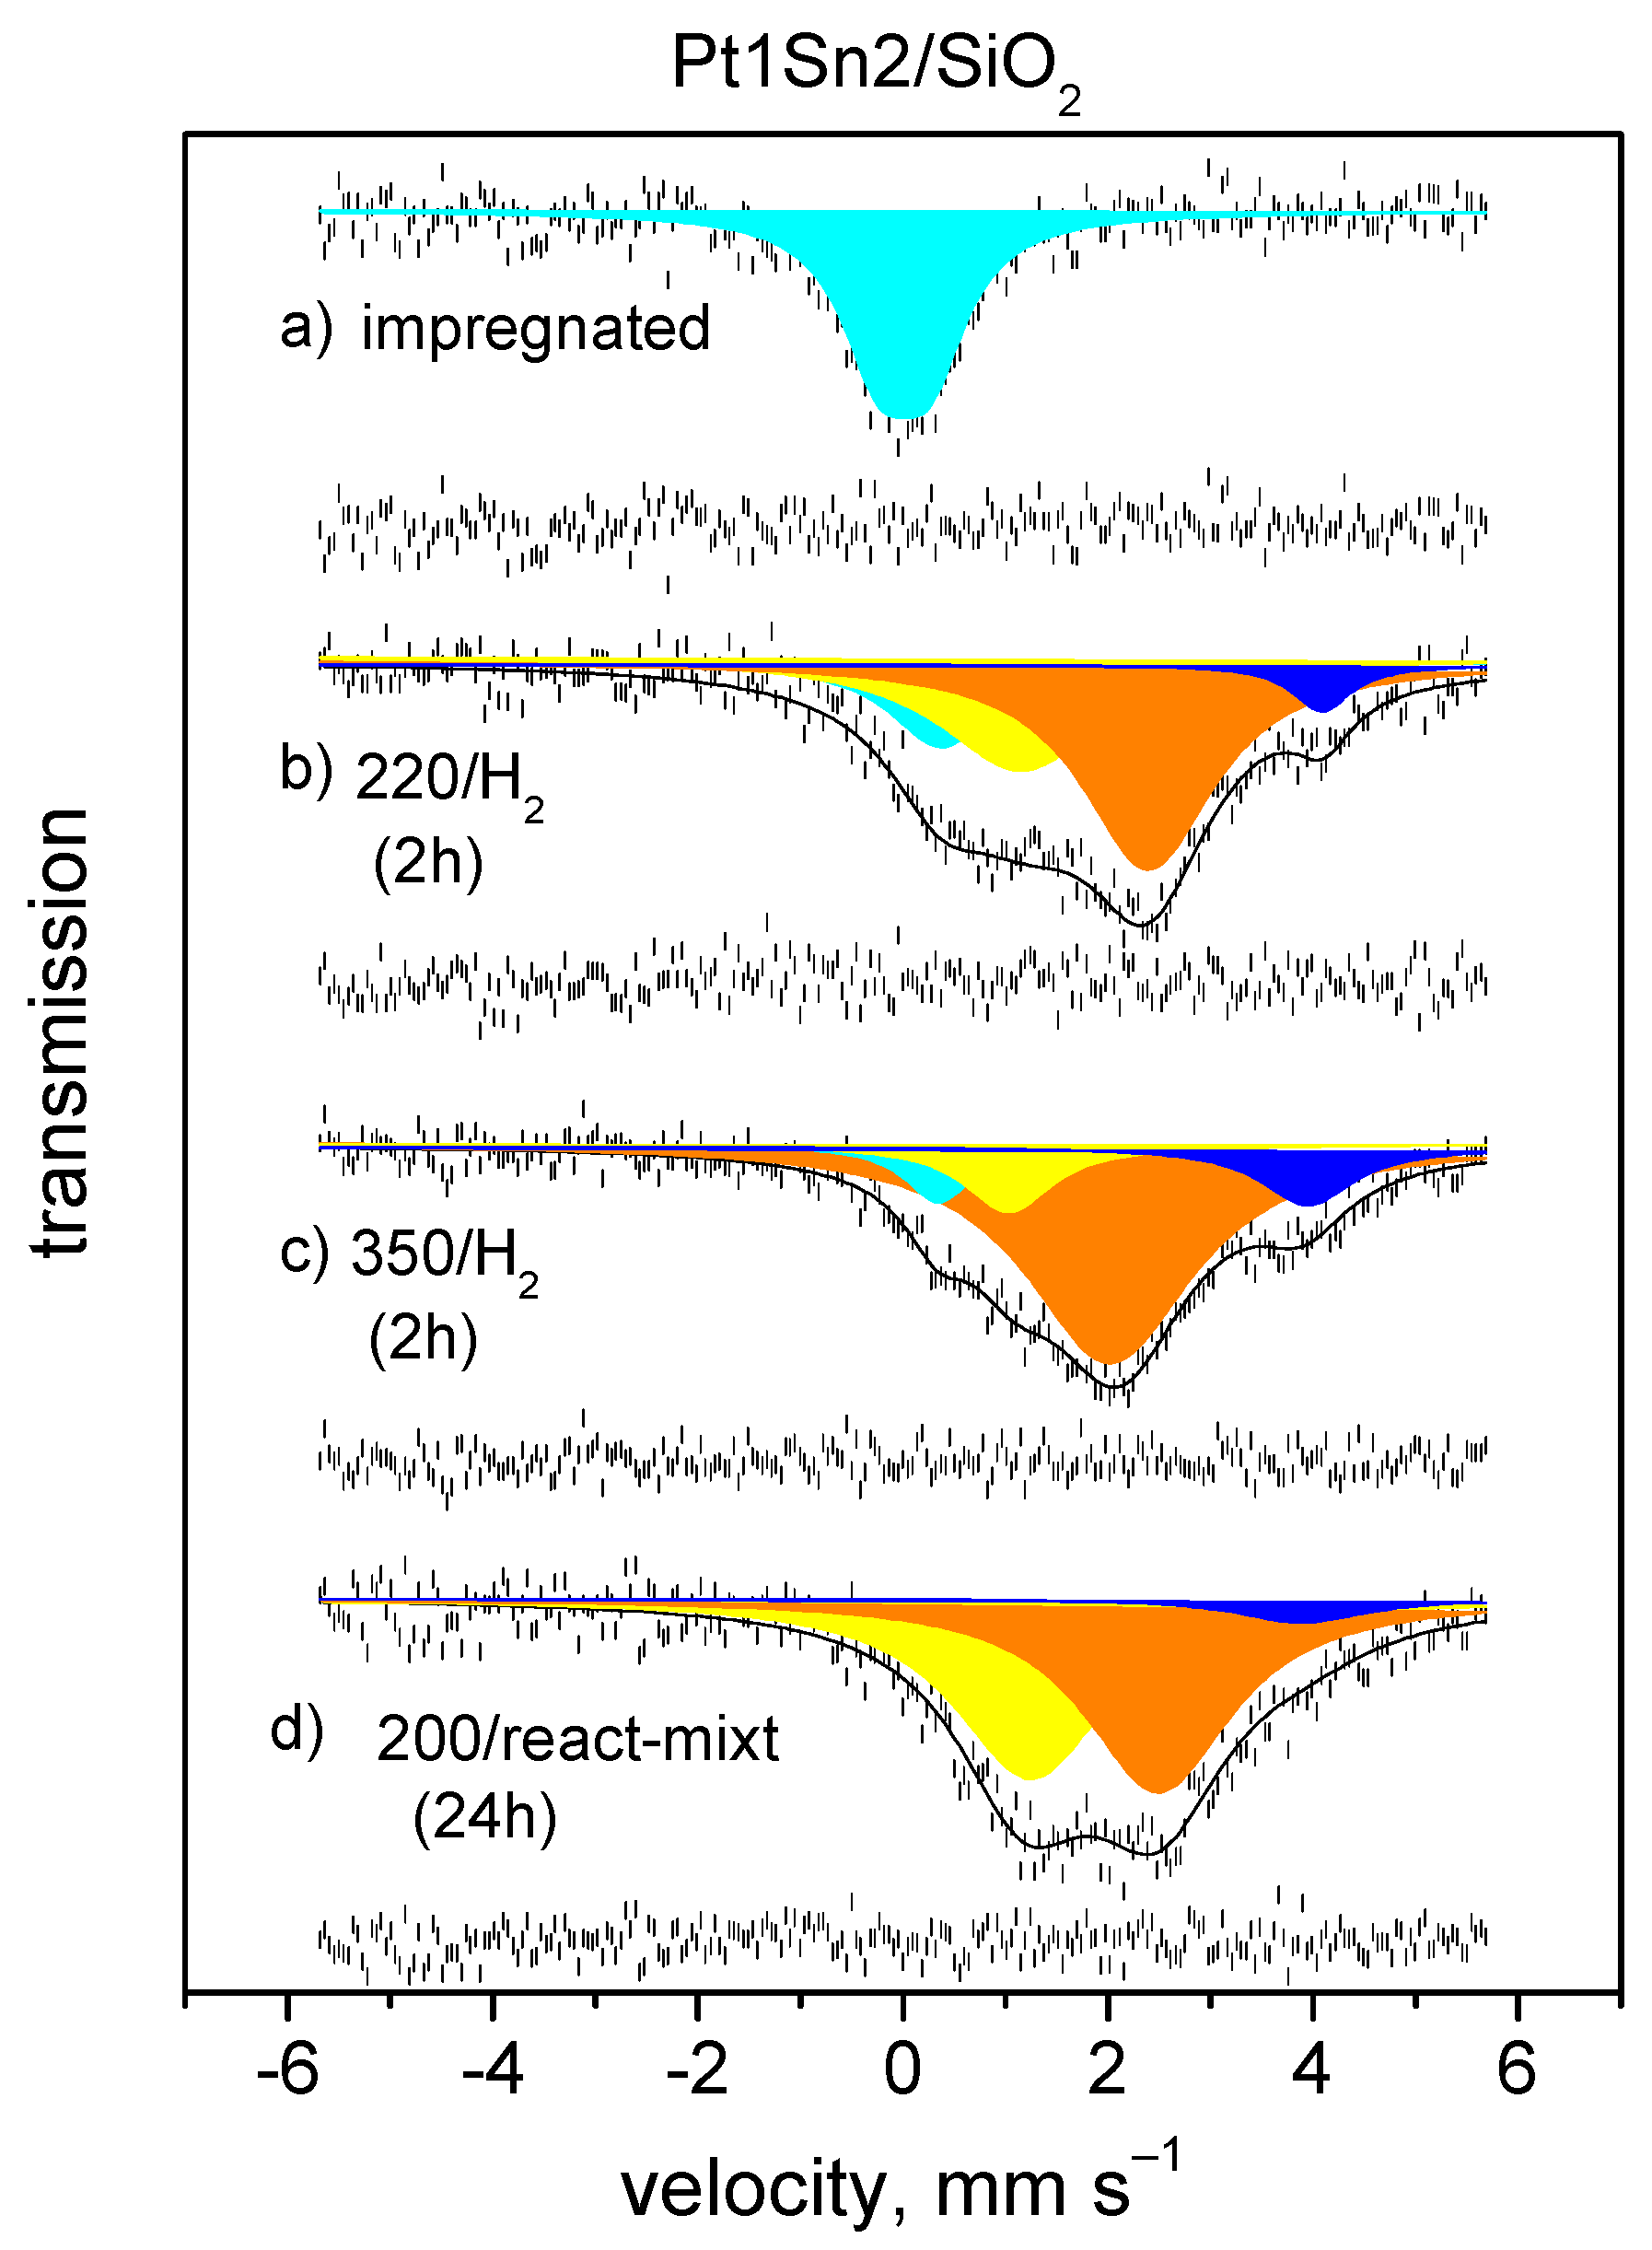
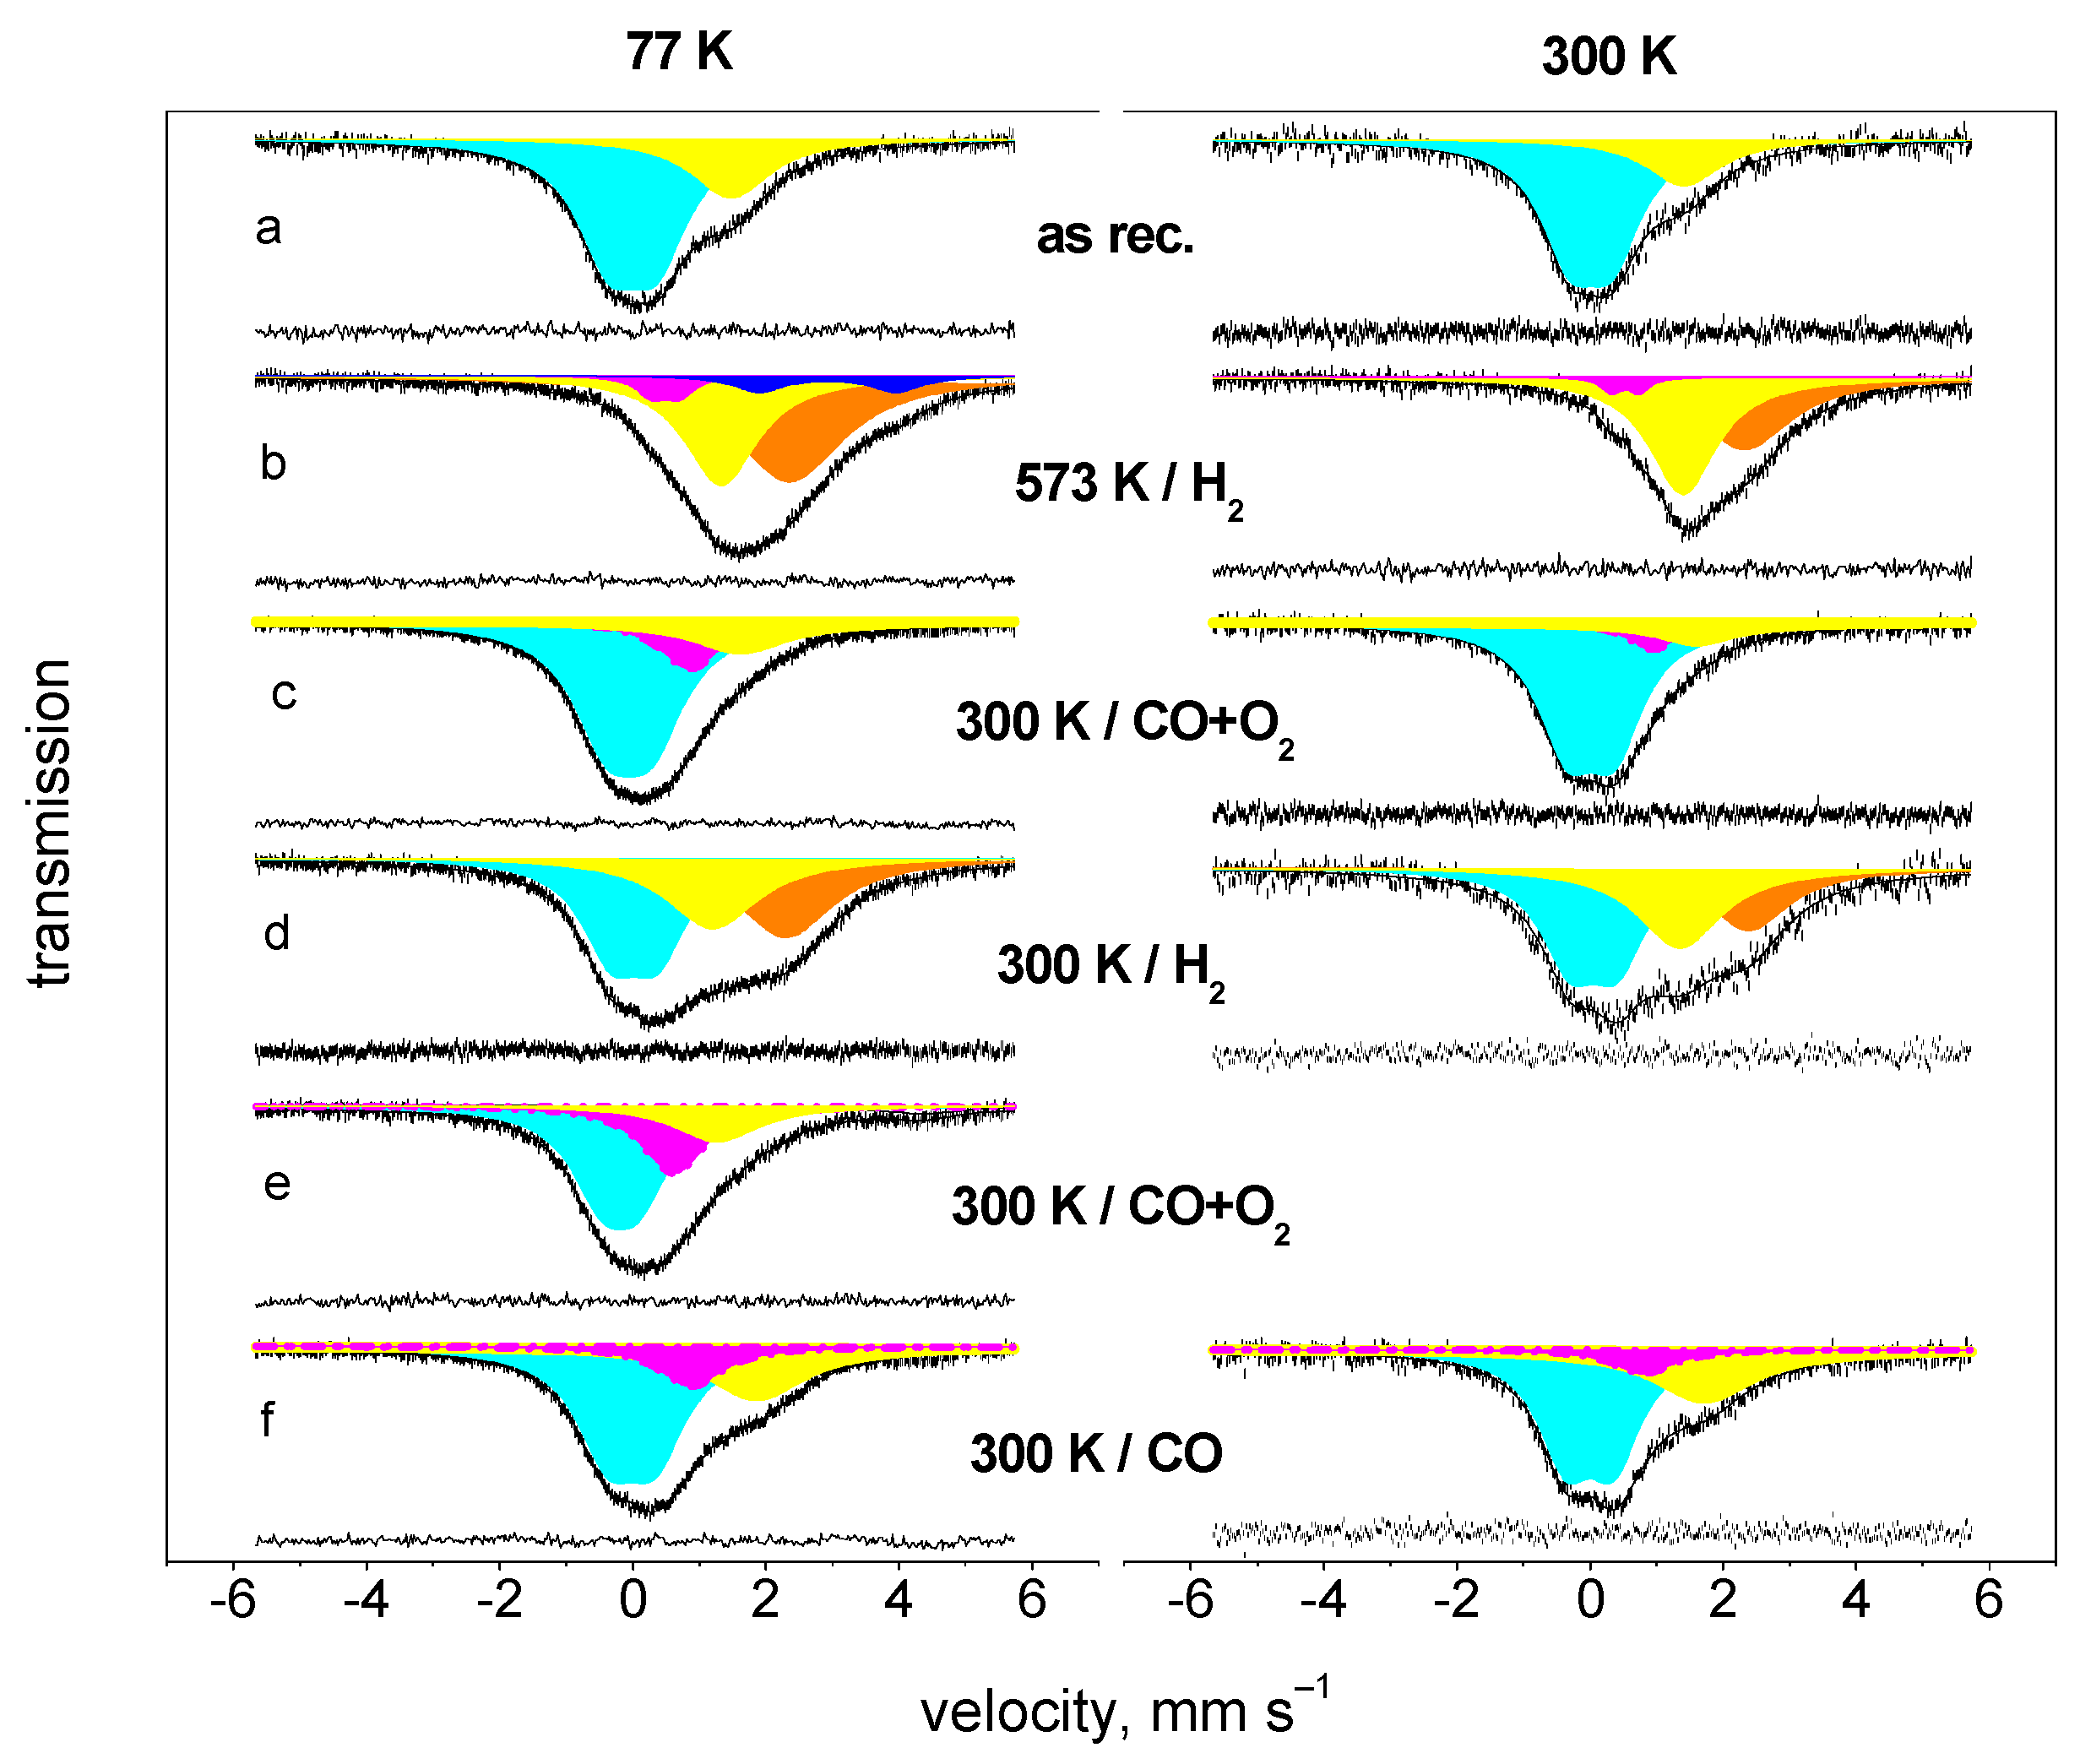
4.2. Oxidation of CO on Pt-Sn Catalyst at Room Temperature

The presence of poisonous CO in the environment should be avoided. Several attempts have been made to develop an efficient catalyst for this purpose. These catalysts usually contain noble metals, e.g., a Pd-containing catalyst is efficient at ambient temperature [66]. Pt is also useful, but its optimal working temperature is slightly above room temperature. The temperature at the beginning of a reaction can be significantly reduced, even below room temperature, by adding a tin promoter to platinum. An in situ Mössbauer study was performed on a silica-supported bimetallic Pt-Sn catalyst with a nominal atomic Pt:Sn ratio of 3:2. Parallel catalytic measurements proved that the oxidation of CO proceeds with high efficiency at room temperature on this catalyst [44].
Mössbauer measurements were performed in six stages, and the corresponding spectra were recorded both at room temperature and at 77 K in order to estimate the bonding strengths of various tin species. For a relative comparison of their bonding strengths, the partial d(lnA)/dT values can be used (where A is the relative spectral area of the given component in the corresponding spectrum). To obtain these d(lnA)/dT values, two measuring temperatures are sufficient, including room temperature and liquid nitrogen temperature. This approach is widely applied [67]. Six pairs of spectra were collected in subsequent stages. Firstly, after anchoring tin to Pt from tetramethyl–tin (Figure 6a), activation was carried out, i.e., alloy formation in hydrogen at 573 K (Figure 6b). The following four exposures were carried out at room temperature: exposure to CO + O2 (1:1) (Figure 6c), exposure to hydrogen (Figure 6d), repeating exposure to the CO + O2 mixture (Figure 6e), and finally, exposure to pure CO (Figure 6f).
The changes in the amounts and compositions of bimetallic Pt-Sn phases at room temperature due to exposure to various treating gases are obvious. In the first stage, dominance of Sn4+ is observed; however, tin–tetramethyl-covered Pt particles preserve a certain amount of the tin in a zerovalent state in the Pt-Sn bimetallic form, even under slight exposure to air (Figure 6a). Treatment in hydrogen at 573 K results in the formation of bimetallic phases. The bimetallic PtSn alloy does not exist with the starting nominal Pt:Sn=3:2 composition; the mentioned ratio corresponds roughly to a 1:4 mixture of the nearest stable Pt3Sn and PtSn alloys. The contributions from various Pt-Sn bimetallic phases were decomposed into only two components, similarly to the previous case of the dehydrochlorination catalyst, one for the Pt-rich (PtSn(a)) mixture of phases and another one for the Sn-rich (PtSn(b)) mixture. Almost all of the tin is incorporated into these two metallic components (Figure 6b). Room-temperature exposure to a 1:1 mixture of CO and oxygen results in the oxidation of almost all of the tin to Sn4+ (Figure 6c). Replacing the surrounding gas with pure hydrogen at room temperature in the next step results in the reduction of a significant amount of tin to a zerovalent state, again enabling the formation of bimetallic alloys (Figure 6d). The repetition of exposure to the CO + O2 mixture again results in the oxidation of a large amount of tin to Sn4+ (Figure 6e). The ability of carbon monoxide to reduce tin without the presence of hydrogen was demonstrated in the last stage, where a noticeable increase in the bimetallic phase can be observed (Figure 6f).
The spectra in Figure 6 were decomposed, and the numerical data obtained are presented in Table 4. Provided all of the platinum and tin are incorporated into a joint bimetallic phase, the nominal Pt:Sn = 3:2 ratio used would result in a weighted average of isomer shifts between those of PtSn (δ ≈ 1.9 mm s−1) and Pt3Sn (δ ≈ 1.5 mm s−1). The isomer shift values obtained for PtSn(a) are not far from this range, and they are shifted slightly to higher Pt content. The other bimetallic component, PtSn(b), is further from this averaged value, δ ≈ 2.3 mm s−1, a value that is characteristic of the most tin-rich PtS4 alloy. This evaluation clearly proves that different metallic PtSn phases coexist in the catalysts. Further, a significant portion of tin is present in the Sn4+ oxidized form. Contrarily, a counterpart of Pt may exist in a purer form that is not detectable with the 119Sn Mössbauer technique. The Sn4+ component can also be decomposed into two types: a strict Sn4+(ox) characterized by δ ≈ 0.0 mm s−1, and another that exhibits δ ≈ 0.8–1.0 mm s−1, denoted as Sn4+(surf). In the assignment of this Sn4+(surf) component, the mentioned –dlnA/dT values can be utilized, which characterize the bonding strengths of a given component. The −dln(A300/A77)/dT × 10−3 values are collected in the frel column of Table 4. For the calculation of these frel data, the separate spectral areas of the individual components obtained from the decomposition of the spectra recorded at 300 and 77 K were used. The weaker the bonding strength is, the larger the frel value. The bonding of tin in the PtSn(a) and Sn4+ forms is average, displaying frel values around 3–4. The bonding strength of tin in the PtSn(b) and Sn4+(surf) forms is significantly weaker, with values between 5.5 and 7.0.
In summary, the most important observation from this series of in situ measurements is that there are significant changes in the compositions of small bimetallic PtSn alloy particles at room temperature, combined with simultaneous reversible Sn4+ ⇔ Sn(0) changes. The oxidation of small tin particles at room temperature was also demonstrated in other studies with HRTEM measurements [68]. In our case, the activation of hydrogen on platinum probably significantly promoted the reduction efficiency.

5. Conclusions

In general, the conventional Mössbauer method presents integrated information as a sum of a great number of local data. Thus, uniformity in the sample is essential. With this presumption in mind, effort is usually devoted to achieving the best match between the measured and fitted Mössbauer spectra. However, sometimes, this presumption is not fulfilled. In the case of in situ catalysts studies, inherent inhomogeneities may occur in samples for various reasons (preparation, particle geometries, etc.), which may result in a significant increase in the line width. However, unique information can be extracted using the in situ technique. In this study, two examples are presented of methods that allow reasonable concessions in the fitting of spectra in order to achieve reliable and unique information on the ongoing changes under in situ conditions. In the first example, the existence of various iron coordination states and their reversible interconversion is demonstrated in zeolites. The second case clearly demonstrates the occurrence of compositional variations in PtSn bimetallic catalysts due to interactions with the reaction components.

Funding

This research received no external funding.

Institutional Review Board Statement

Not available.

Informed Consent Statement

Not available.

Data Availability Statement

No new data were created or analyzed in this study.

Conflicts of Interest

The author declares no conflicts of interest.

References

  1. Greenwood, N.N.; Gibb, T.C. Mössbauer Spectroscopy; Chapman and Hall: London, UK, 1971. [Google Scholar]
  2. Cohen, R.L. Applications of Mössbauer Spectroscopy; Academic Press: Cambridge, MA, USA, 1976; Volumes 1–2. [Google Scholar]
  3. Long, G.J. Application of Mössbauer Spectroscopy to Inorganic Chemistry; Plenum Press: NewYork, NY, USA, 1984; Volumes 1–3. [Google Scholar]
  4. Gütlich, P.; Bill, E.; Trautwein, A.X. Mössbauer Spectroscopy and Transitional Metal Chemistry; Springer: Berlin/Heidelberg, Germany, 2011. [Google Scholar]
  5. Mössbauer Spectroscopy. In Applications in Chemistry, Biology and Nanotechnology; Sharma, V.K., Klingelhöfer, G., Nishida, T., Eds.; Wiley: Hoboken, NJ, USA, 2013. [Google Scholar]
  6. Modern Mössbauer Spectroscopy. In Topics in Applied Physics; Yoshida, Y., Langouche, G., Eds.; Springer: Berlin/Heidelberg, Germany, 2021; Volume 137. [Google Scholar]
  7. Murad, E.; Cashion, J. Mössbauer Spectroscopy of Environmental Materials and Their Industrial Utilization; Springer: Berlin/Heidelberg, Germany, 2004. [Google Scholar]
  8. Filter, W.F.; Sands, R.H.; Dunham, W.R. An ultra-high-stability Mössbauer spectrometer drive using a type-2 feedback system. Nucl. Instrum. Methods Phys. Res. B 1996, 119, 565–582. [Google Scholar] [CrossRef]
  9. Nagy, D.L.; Röhlich, U. An overview on model-independent data reduction methods in Mössbauer spectroscopy. Hyperfine Interact. 1991, 66, 105–126. [Google Scholar] [CrossRef]
  10. Alenkina, I.V.; Ushakov, M.V.; Morais, P.C.; Selvan, R.K.; Kuzmann, E.; Klencsár, Z.; Felner, I.; Homonnay, Z.; Oshtrakh, M.I. Mössbauer spectroscopy with a high velocity resolution in the studies of nanomaterials. Nanomaterials 2022, 12, 3748. [Google Scholar] [CrossRef] [PubMed]
  11. Maltsev, Y.; Mehner, H.; Menzel, M.; Rogozev, B. Precision in Mössbauer spectroscopy. Hyperfine Interact. 2002, 139/140, 679–684. [Google Scholar] [CrossRef]
  12. Spiering, H.; Ksenofontov, V.; Leupold, O.; Kusz, J.; Deák, L.; Németh, Z.; Bogdán, C.; Bottyán, L.; Nagy, D.L. Line shape of 57Co sources exhibiting self absorption. Hyperfine Interact. 2016, 237, 58. [Google Scholar] [CrossRef]
  13. Brand, R.A. Normos Mössbauer Fitting Program. The NORMOS Program is Available from Wissel GmbH. Nucl. Instrum. Methods Phys. Res. 1987, 28, 398. [Google Scholar] [CrossRef]
  14. Klencsár, Z.; Kuzmann, E.; Vértes, A. User-friendly software for Mössbauer spectrum analysis. J. Radioanal. Nucl. Chem. 1996, 210, 105–118. [Google Scholar] [CrossRef]
  15. Lagarec, K.; Rancourt, D.G. Recoil User Manual—Mössbauer Spectral Analysis Software for Windows; University of Ottawa: Ottawa, ON, Canada, 1998. [Google Scholar]
  16. Zak, T.; Jirásková, Y. CONFIT: Mössbauer spectra fitting program. Surf. Interface Anal. 2006, 38, 710–714. [Google Scholar] [CrossRef]
  17. Hjøllum, J.; Madsen, M.B. Fit;o)-A Mössbauer spectrum fitting program. arXiv 2009, arXiv:0912.0449v1. [Google Scholar]
  18. Kamusella, S.; Klauss, H.-H. Moessfit A free Mössbauer fitting program. Hyperfine Interact. 2016, 237, 82. [Google Scholar] [CrossRef]
  19. Spiering, H.; Nagy, D.L.; Németh, Z.; Bogdán, C.; Deák, L. Non-linearity correction of the velocity scale of a Mössbauer spectrum. Nucl. Instrum. Methods Phys. Res. B 2020, 480, 98–104. [Google Scholar] [CrossRef]
  20. Kuzmann, E.; Nagy, S.; Vértes, A. Critical review of analytical applications of Mössbauer spectroscopy illustrated by mineralogical and geological examples. Pure Appl. Chem. 2003, 75, 801–858. [Google Scholar] [CrossRef]
  21. Grandjean, F.; Long, G.J. Best practices and protocols in Mössbauer spectroscopy. Chem. Mater. 2021, 33, 3878–3904. [Google Scholar] [CrossRef]
  22. Klencsár, Z.; Wang, J.; Ge, R.; Zhou, W.; Liu, D.; Rykov, A.I.; Zhang, T. The new WEB-accessible online database of the Mössbauer Effect Data Center. Hyperfine Interact. 2021, 242, 15. [Google Scholar] [CrossRef]
  23. Dyar, M.D. Precision and interlaboratory reproducibility of measurements of the Mössbauer effect in minerals. Am. Mineral. 1984, 69, 1127–1144. [Google Scholar]
  24. Mehner, H.; Menzel, M.; Nofz, M. Laboratory intercomparison on the determination of the Fe(II)/Fe(III) ratio in glass using Mössbauer spectroscopy. Hyperfine Interact. 2004, 156/157, 347–352. [Google Scholar] [CrossRef]
  25. Dumesic, J.A.; Topsøe, H. Mössbauer spectroscopy applications to heterogeneous catalysis. Adv. Catal. 1977, 26, 121–246. [Google Scholar]
  26. Millet, J.-M.M. Mössbauer spectroscopy in heterogeneous catalysis. Adv. Catal. 2007, 51, 309–350. [Google Scholar] [CrossRef]
  27. Liu, K.; Rykov, A.I.; Wang, J.; Zhang, T. Recent advances in the applications of Mössbauer spectroscopy in heterogeneous catalysis. Adv. Catal. 2015, 58, 1–142. [Google Scholar] [CrossRef]
  28. Lázár, K. Mössbauer spectroscopy of catalysts, Ch. 4. In Mössbauer Spectroscopy: Applications in Chemistry and Materials Science; Garcia, Y., Wang, J., Zhang, T., Eds.; Wiley: Hoboken, NJ, USA, 2024; pp. 113–143. [Google Scholar]
  29. Fischer, N.; Claeys, M. In situ characterization of Fischer-Tropsch catalysts: A review. J. Phys. D Appl. Phys. 2020, 53, 293001. [Google Scholar] [CrossRef]
  30. Bibicu, I.; Frunza, L. Characterization of oxide catalysts by in situ Mössbauer spectroscopy. Rom. Rep. Phys. 2006, 58, 427–453. [Google Scholar]
  31. Crajé, M.W.J.; van der Kraan, A.M.; van de Loosdrecht, J.; van Berge, P.J. The application of Mössbauer emission spectroscopy to industrial cobalt based Fischer-Tropsch catalysts. Catal. Today 2002, 71, 369–379. [Google Scholar] [CrossRef]
  32. Wezendonk, T.A.; Santos, V.P.; Nasalevich, M.A.; Warringa, Q.S.; Dugulan, A.I.; Chojecki, A.; Koeken, A.C.J.; Ruitenbeek, M.; Meima, G.R.; Islam, H.-U.; et al. Elucidating the nature of Fe species during pyrolysis of the Fe-BTC MOF into highly active and stable Fischer-Tropsch catalysts. ACS Catal. 2016, 6, 3236–3247. [Google Scholar] [CrossRef]
  33. Zeng, Y.; Li, X.; Wang, J.; Sougrati, M.T.; Huang, Y.; Zhang, T.; Liu, B. In situ/operando Mössbauer spectroscopy for probing heterogeneous catalysis. Chem. Catal. 2021, 1, 1215–1233. [Google Scholar] [CrossRef]
  34. Liu, P.; Farid, S.; Liu, M.; Wang, J. In-situ/operando Mössbauer spectroscopic investigations of Fe-involved metal hydroxide-based OER electrocatalysts. Catal. Surv. Asia 2024, 28, 361–374. [Google Scholar] [CrossRef]
  35. Chen, R.; Zhao, J.; Li, Y.; Cui, Y.; Lu, Y.-R.; Hung, S.-F.; Wang, S.; Wang, W.; Huo, G.; Zhao, Y.; et al. Operando Mössbauer spectroscopic tracking the metastable state of atomically dispersed tin in copper oxide for selective CO2 electroreduction. J. Am. Chem. Soc. 2023, 145, 20683–20691. [Google Scholar] [CrossRef]
  36. Bussiere, P. Mössbauer spectroscopy, dispersion and catalysis. Hyperfine Interact. 1991, 66, 39–50. [Google Scholar] [CrossRef]
  37. Dubkov, K.A.; Ovanesyan, N.S.; Shteinman, A.A.; Starokon, E.V.; Panov, G.I. Evolution of iron states and formation of α-sites upon activation of FeZSM-5 zeolites. J. Catal. 2002, 207, 341–352. [Google Scholar] [CrossRef]
  38. Candy, J.-P.; Roisin, E.; Basset, J.-M.; Uzio, D.; Morin, S.; Fischer, L.; Olivier-Fourcade, J.; Jumas, J.-C. Evidence for direct observation by Mössbauer spectroscopy of surface tin atoms in platinum-tin particles. Hyperfine Interact. 2005, 165, 55–60. [Google Scholar] [CrossRef]
  39. Garten, R.L.; Delgass, W.N.; Boudart, M. A Mössbauer spectroscopic study of the reversible oxidation of ferrous ions in Y zeolite. J. Catal. 1970, 18, 90–96. [Google Scholar] [CrossRef]
  40. Villegas, V.A.R.; Ramirez, J.I.D.L.; Pérez-Cabrera, L.; Pérez-Sicairos, S.; Chávez-Méndez, J.R.; Petranovskii, V. Analysis of catalytic sites in FeY zeolite prepared by sono-assisted exchange of Fe(II) ions. Microporous Mesoporous Mater. 2024, 380, 113306. [Google Scholar] [CrossRef]
  41. Fejes, P.; Kiricsi, I.; Lázár, K.; Marsi, I.; Rockenbauer, A.; Korecz, L. Attempts to produce uniform Fe(III) siting in Fe content SOD and LTA zeolites; An EPR and Mössbauer study. Appl. Catal. A Gen. 2003, 242, 63–76. [Google Scholar] [CrossRef]
  42. Lázár, K.; Lejeune, G.; Ahedi, R.K.; Shevade, S.; Kotasthane, A.N. Interpreting the oxidative catalytic activity in iron-substituted ferrierites using in situ Mössbauer spectroscopy. J. Chem. Phys. B 1998, 102, 4865–4870. [Google Scholar] [CrossRef]
  43. Rhodes, W.; Lázár, K.; Kovalchuk, V.I.; d’Itri, J.L. Hydrogen-assisted 1,2-dichloroethane dechlorination catalyzed by Pt-Sn/SiO2: Effect of the Pt/Sn atomic ratio. J. Catal. 2002, 211, 173–182. [Google Scholar] [CrossRef]
  44. Margitfalvi, J.L.; Borbáth, I.; Hegedűs, M.; Szegedi, Á.; Lázár, K.; Gőbölös, S.; Kristyán, S. Low-temperature oxidation of CO over tin modified Pt/SiO2 catalysts. Catal. Today 2002, 73, 343–353. [Google Scholar] [CrossRef]
  45. Lázár, K.; Matusek, K.; Mink, J.; Dobos, S.; Guczi, L.; Vizi-Orosz, A.; Markó, L.; Reiff, W. Spectroscopic and catalytic study on metal carbonyl clusters supported on Cab-O-Sil. J. Catal. 1984, 87, 163–178. [Google Scholar] [CrossRef]
  46. Kulcsár, K.; Nagy, D.L.; Pócs, L. A complete package of programs for the evaluation of Mössbauer and gamma spectra. KFKI Rep. 1971, 67. [Google Scholar]
  47. Zhang, J.; Tang, X.; Yi, H.; Yu, Q.; Zhang, Y.; Wei, J.; Yuan, Y. Synthesis, characterization and application of Fe zeolite: A review. Appl. Catal. A Gen. 2022, 630, 118467. [Google Scholar] [CrossRef]
  48. Panov, G.I.; Sobolev, V.I.; Kharitonov, A.S. The role of iron in N2O decomposition on ZSM-5 zeolite and reactivity of the surface oxygen formed. J. Mol. Catal. 1990, 61, 85–97. [Google Scholar] [CrossRef]
  49. Bols, M.L.; Devos, J.; Rhoda, H.M.; Plessers, D.; Solomon, E.I.; Schoonheydt, R.A.; Sels, B.F.; Dusselier, M. Selective formation of α-Fe(II) sites on Fe-zeolites through one-pot synthesis. J. Am. Chem. Soc. 2021, 143, 16243–16255. [Google Scholar] [CrossRef]
  50. Kornas, A.; Mlekodaj, K.; Tabor, E. Nature and redox properties of iron sites in zeolites revealed by Mössbauer spectroscopy. ChemPlusChem 2024, 89, e202300543. [Google Scholar] [CrossRef] [PubMed]
  51. Burns, R.G. Mineral Mössbauer spectroscopy: Correlation between chemical shift and quadrupole splitting parameters. Hyperfine Interact. 1994, 91, 739–745. [Google Scholar] [CrossRef]
  52. Meagher, A.; Nair, V.; Szostak, R. A Mössbauer study of ZSM-5 type ferrisilicates. Zeolites 1988, 8, 3–11. [Google Scholar] [CrossRef]
  53. Kumar, R.; Date, S.K.; Bill, E.; Trautwein, A. Mössbauer spectroscopic study of iron ferrisilicate analog of zeolite BETA. Zeolites 1991, 11, 211–213. [Google Scholar] [CrossRef]
  54. Lázár, K.; Borbély, G.; Beyer, H. In situ Mössbauer study of framework-substituted (Fe)ZSM-5 zeolites. Zeolites 1991, 11, 214–222. [Google Scholar] [CrossRef]
  55. Inui, T.; Tanaka, Y. Evaluation of water adsorption on different kinds of zeolite through Monte Carlo simulation. Stud. Surf. Sci. Catal. 1995, 98, 229–231. [Google Scholar]
  56. Lázár, K.; Vincent, C.; Fejes, P. Variety of available coordination sites for extra-framework iron in LTA and MFI zeolites. Hyperfine Interact. 2008, 187, 1–6. [Google Scholar] [CrossRef]
  57. Yakovlev, A.L.; Zhidomirov, G.M.; van Santen, R.A. DFT calculations on N2O decomposition by binuclear Fe complexes in Fe/ZSM-5. J. Phys. Chem. B 2001, 105, 12297–12302. [Google Scholar] [CrossRef]
  58. Sazama, P.; Wichterlová, B.; Tábor, E.; Šťastný, P.; Sathu, N.K.; Sobalík, Z.; Dědeček, J.; Sklenák, Š.; Klein, P.; Vondrová, A. Tailoring of the structure of Fe-cationic species in Fe-ZSM-5 by distribution of Al atoms in the framework for N2O decomposition and NH3-SCR-NOx. J. Catal. 2014, 312, 123–138. [Google Scholar] [CrossRef]
  59. Lázár, K.; Kotasthane, A.N.; Fejes, P. Oxygen transfer centers in Fe-FER and Fe-MFI zeolites: Redox behavior and Debye temperature derived from in situ Mössbauer spectra. Catal. Lett. 1999, 57, 171–177. [Google Scholar] [CrossRef]
  60. Charlton, J.S.; Cordey-Hayes, M.; Harris, I.R. A study of the 119Sn Mössbauer isomer shifts in some platinum-tin and gold-tin alloys. J. Less-Common Met. 1970, 20, 105–112. [Google Scholar] [CrossRef]
  61. Hu, J.; Xie, M.; Chen, Y.; Fang, J.; Zhang, Q. Thermodynamic reassessment of Au-Pt-Sn system. Mater. Res. Express 2022, 9, 016507. [Google Scholar] [CrossRef]
  62. Kappenstein, C.; Guerin, M.; Lázár, K.; Matusek, K.; Paál, Z. Characterization and activity in n-hexane rearrangement reactions of metallic phases on Pt-Sn/Al2O3 catalysts of different preparation. J. Chem. Soc. Faraday Trans. 1998, 94, 2463–2473. [Google Scholar] [CrossRef]
  63. Olivier-Fourcade, J.; Womes, M.; Jumas, J.-C.; Le Peltier, F.; Morin, S.; Didillon, B. Investigation of redox properties of different PtSn/Al2O3 catalysts. ChemPhysChem 2004, 5, 1734–1744. [Google Scholar] [CrossRef]
  64. Dubiel, S.M.; Cieslak, J.; Alenkina, I.V.; Oshtrakh, M.I.; Semionkin, V.A. Evaluation of the Debye temperature for iron cores in human live ferritin and its pharmaceutical analogue, Ferrum Lek, using Mössbauer spectroscopy. J. Inorg. Biochem. 2014, 140, 89–93. [Google Scholar] [CrossRef]
  65. Lengyel, A.; Klencsár, Z.; Homonnay, Z.; Sipos, P.; Bajnoczi, E.; Kuzmann, E. Goldanskii-Karyagin effect on hyperalkaline tin(II)-hydroxide. J. Radioanal. Nucl. Chem. 2016, 307, 1195–1201. [Google Scholar] [CrossRef]
  66. Srivastava, A.K.; Saxena, A.; Shah, D.; Mahato, T.H.; Singh, B.; Shrivastava, A.; Gutch, P.; Shinde, C. Catalytic removal of carbon monoxide over carbon supported palladium catalyst. J. Hazard. Mater. 2012, 241–242, 463–471. [Google Scholar] [CrossRef]
  67. Parish, R.V. Structure and bonding in tin compounds, Ch. 16. In Mössbauer Spectroscopy Applied to Inorganic Chemistry; palladium catalys; Long, G.J., Ed.; Springer: Berlin/Heidelberg, Germany, 1984; Volume I, pp. 527–575. [Google Scholar]
  68. Sutter, E.; Ivars-Barcelo, F.; Sutter, P. Size-dependent room temperature oxidation of tin particles. Part. Part. Syst. Charact. 2014, 31, 879–885. [Google Scholar] [CrossRef]
Figure 1. A schematic representation of a catalyst particle on a support.
Spectroscj 03 00010 g001
Figure 2. The Mössbauer spectra recorded for extra-framework iron ions in the series of measurements in an in situ cell. Different treatments and recording temperatures are marked on the spectra (left: treatment; right: recording temperature; yellow: Fe3+oct(1); orange: Fe3+oct(2); cyan: Fe2+sqpl; olive: Fe2+tetr; green: Fe2+oct). For an explanation of subfigures (aj), see the main text below.
Spectroscj 03 00010 g002
Figure 3. Changes in the relative contributions of ferrous ions in square planar, tetrahedral, and octahedral states, and ferric iron in octahedral coordination in a series of treatments, most of which are shown in Figure 2 (reproduced from [56] with permission).
Spectroscj 03 00010 g003
Figure 4. Series of in situ spectra recorded in series of treatments of ferrisilicate with FER structure and ratio of Si:Fe = 16 (treatments are marked on left side of spectra, and conditions of measurements on right; modified from [42] with permission). For explanation of subfigures (aj), see main text below.
Spectroscj 03 00010 g004
Figure 5. Series of 77 K spectra recorded in subsequent steps of treatments (from top to bottom). Sn4+: light blue; PtSn(a): yellow; PtSn(b): dark yellow; SnCl2: blue (modified from [43] with permission). For explanation of subfigures (ad), see main text below.
Spectroscj 03 00010 g005
Figure 6. Pairs of 77 and 300 K in situ Mössbauer spectra of Pt:Sn = 3:2 silica-supported catalysts in series of treatments (from top to bottom): activation at 573 K in hydrogen and repeated treatments in CO + O2 mixture at room temperature (light blue: Sn4+; magenta: Sn4+(surf); blue: Sn2+; yellow: PtSn(a); dark yellow: PtSn(b); adapted and modified from [44] with permission). For explanation of subfigures (af), see main text.
Spectroscj 03 00010 g006
Table 1. Mössbauer data extracted from spectra shown in Figure 2.
TreatmentAtm.Temp. ofComponentδ aΔ bFWHM cRel. Int. d
Meas. K mm s−1mm s−1mm s−1%
As rec.air77Fe3+0.451.040.5965.9
Fe3+0.460.630.3534.1
630 K/vacuum300Fe3+0.360.930.6158.4
vac Fe2+0.830.450.2825.5
Fe2+0.872.440.8916.1
570/H2H2470 Fe2+ 0.72 0.52 0.29 71.2
Fe2+ 0.87 1.71 0.70 28.8
NoneH2300Fe3+0.250.750.37 8.7
(1st part) Fe2+0.840.500.2416.2
Fe2+1.081.120.6852.1
Fe2+1.122.190.5123.0
NoneH2300Fe3+0.280.800.35 8.2
(2nd part) Fe2+1.101.080.3946.2
Fe2+1.082.040.6545.6
470/N20N2O470Fe3+0.251.000.8385.2
Fe2+0.572.600.9014.7
RT/H2H2300Fe3+0.341.060.7473.0
Fe2+0.882.461.6227.0
450/H2H2450Fe3+0.210.990.6794.1
Fe2+ 1.37 1.25 0.52 6.9
540/H2H2540 Fe2+ 0.57 0.60 0.95 39.2
Fe2+ 0.69 0.53 0.23 50.5
Fe2+ 0.78 1.89 0.48 10.2
300/airair300Fe3+0.320.850.6156.7
Fe2+1.152.090.6343.2
a Isomer shift, relative to α–iron; b quadrupole splitting; c line width (full width at half maximum); d relative intensity. Fe2+ is emphasized in bold, and italics denote measuring temperatures different from 300 K.
Table 2. Mössbauer data extracted from spectra recorded for Fe-FER (Si:Fe = 16) in series of in situ measurements (reproduced from [42] with permission).
TreatmentTemp.Atm.Comp.δ aΔ bFWHM cRel. Int. d
Meas. (K) mm s−1mm s−1mm s−1%
Calcined300airFe3+0.280.600.4313.4
/air Fe3+0.351.030.7486.6
620 K/vac300vacuumFe3+0.241.980.6170.9
Fe3+0.371.171.0829.1
620 K/H277hydrogenFe3+0.331.830.3813.6
Fe3+0.541.160.8237.6
Fe2+ 1.17 1.98 0.77 36.4
Fe2+ 1.15 3.03 0.56 12.3
None300hydrogenFe3+0.301.620.5935.6
Fe3+0.310.970.6156.1
Fe2+0.782.460.443.3
Fe2+1.262.490.495.0
None77hydrogenFe3+0.401.480.6952.5
(repeat) Fe3+0.400.880.5435.9
Fe2+ 1.25 2.26 0.25 1.9
Fe2+ 1.40 2.96 0.61 9.7
620 K/vac300vacuumFe3+0.221.980.5660.8
Fe3+0.461.521.2539.2
620 K/H277hydrogenFe3+0.371.660.4513.5
Fe3+0.421.130.7928.6
Fe2+ 1.09 2.21 0.76 36.9
Fe2+ 1.42 2.53 0.59 21.0
140 K/vac140 KvacuumFe3+0.311.730.5327.9
Fe3+0.321.140.6138.6
Fe2+ 0.99 2.02 0.58 12.4
Fe2+ 1.31 2.30 0.77 21.1
300 K/vac300 KvacuumFe3+0.251.630.5247.5
Fe3+0.320.980.5926.9
Fe2+1.042.140.9625.6
620 K/vac300vacuumFe3+0.241.960.5058.6
Fe3+0.401.270.9527.6
Fe2+1.221.500.9113.7
a Isomer shift, relative to α-iron; b quadrupole splitting; c line width (full width at half maximum); d relative intensity. Fe2+ is emphasized in bold, and italics denote measuring temperatures different from 300 K.
Table 3. Mössbauer data extracted from decomposition of subsequent series of in situ spectra collected on Pt:Sn = 2 silica-supported catalyst (reproduced from [43] with permission).
TreatmentComp.δ aΔ bFWHM cRel. Int. dSrel e
mm s−1mm s−1mm s−1%
As preparedSn4+0.070.500.891001.00
H2/493 KSn4+0.54-1.31241.54
Pt-Sn(a)1.39-1.6421
Pt-Sn(b)2.45-1.4850
SnCl24.15-0.745
H2/623 KSn4+0.38-0.6861.74
Pt-Sn(a)1.11-1.2919
Pt-Sn(b)2.16-1.6964
SnCl23.95-1.1412
React. mixt. fPt-Sn(a)1.22-1.59431.42
473 KPt-Sn(b) ≈ β-Sn2.53-1.7652
SnCl23.96-1.585
a Isomer shift, relative to BaSnO3; b quadrupole splitting; c line width (full width at half maximum); d relative intensity; e relative areas of full spectra (in comparison to base line); f 24 h treatment in ClCH2-CH2Cl + H2 + N2 (1:5:25) mixture for 24 h at 473 K.
Table 4. Mössbauer parameters extracted from 77 and 300 K in situ spectra of silica-supported Pt:Sn = 3:2 catalysts in series of treatments (Figure 6) (reproduced from [44] with permission).
TreatmentComp.77 K 300 K
δ aΔ bFWHM cRel. Int. dδ aΔ bFWHM cRel. Int. df(rel) e
mm s−1mm s−1mm s−1%mm s−1mm s−1mm s−1%
As receivedSn4+0.000.721.17740.010.641.07774.14
PtSn(a)1.49-1.43261.42-1.16234.87
H2/573 KSn4+(surf)0.490.420.5960.530.430.3947.43
Sn2+2.882.111.069
PtSn(a)1.31-1.27371.41-1.25553.78
PtSn(b)2.32-2.00482.38-1.60406.50
CO + O2Sn4+0.000.681.25720.010.721.06832.88
300 KSn4+(surf)0.86-1.10160.93-0.8886.28
PtSn1.77-1.41121.60-1.3294.06
H2/300 KSn4+0.040.701.09420.050.711.03455.49
PtSn(a)1.22-1.58241.36-1.54324.53
PtSn(b)2.31-1.79332.39-1.48237.35
CO + O2Sn4+−0.190.571.1053
300 KSn4+(surf)0.66-1.2429
Sn2+3.232.301.307
PtSn(a)1.40-1.4112
CO/300 KSn4+−0.020.711.13620.000.730.99643.54
Sn4+(surf)0.88-1.17140.80-1.1085.79
PtSn1.86-1.69241.72-1.74273.14
a Isomer shift, relative to BaSnO3; b quadrupole splitting; c line width (full width at half maximum); d relative intensity; e f(rel) = −dln(A300/A77)/dT × 10−3.
Disclaimer/Publisher’s Note: The statements, opinions and data contained in all publications are solely those of the individual author(s) and contributor(s) and not of MDPI and/or the editor(s). MDPI and/or the editor(s) disclaim responsibility for any injury to people or property resulting from any ideas, methods, instructions or products referred to in the content.

