
Laser-Induced Breakdown Spectroscopy Applied to Elemental Analysis of Aqueous Solutions—A Comprehensive Review


Abstract
1. Introduction
2. Methods
- -
- Element(s) investigated,
- -
- LoD(s) achieved,
- -
- Sampling method/sample pre-treatment,
- -
- Peculiarities in LIBS setup and beam geometry,
- -
- Laser wavelength used,
- -
- Pulse energy used,
- -
- Year of publication,
- -
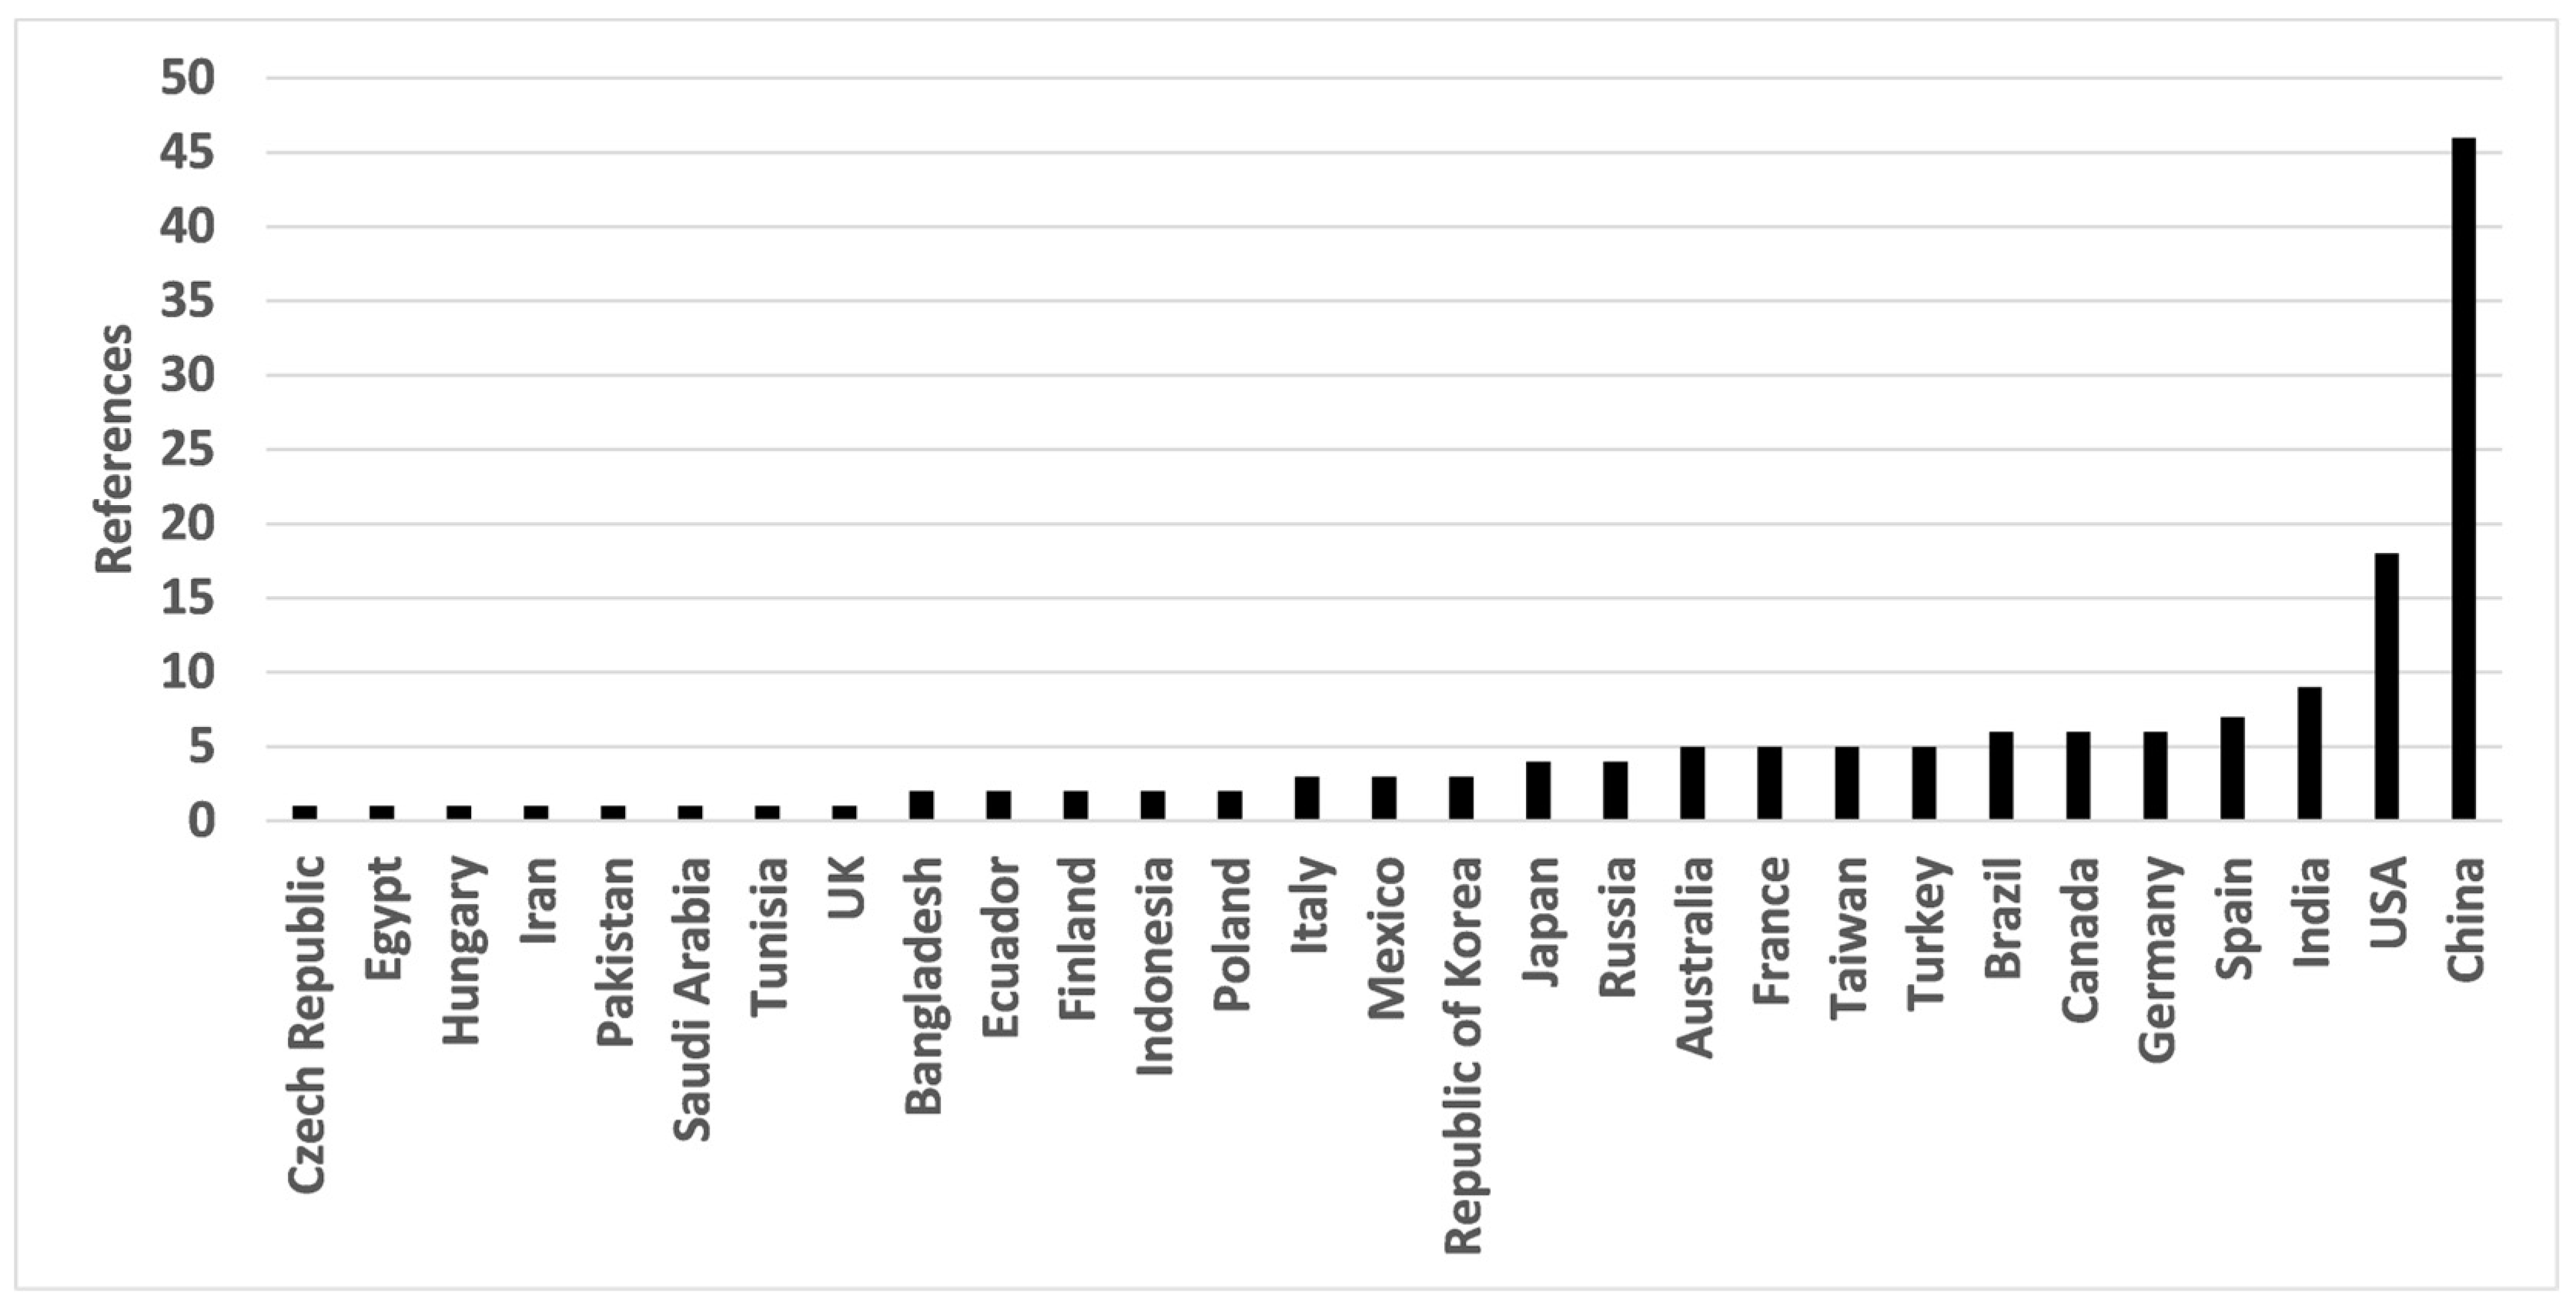
- First author country of affiliation,
- -
- Sample type.
3. Results
3.1. Historical Aspects
3.2. Types of Aqueous Solutions
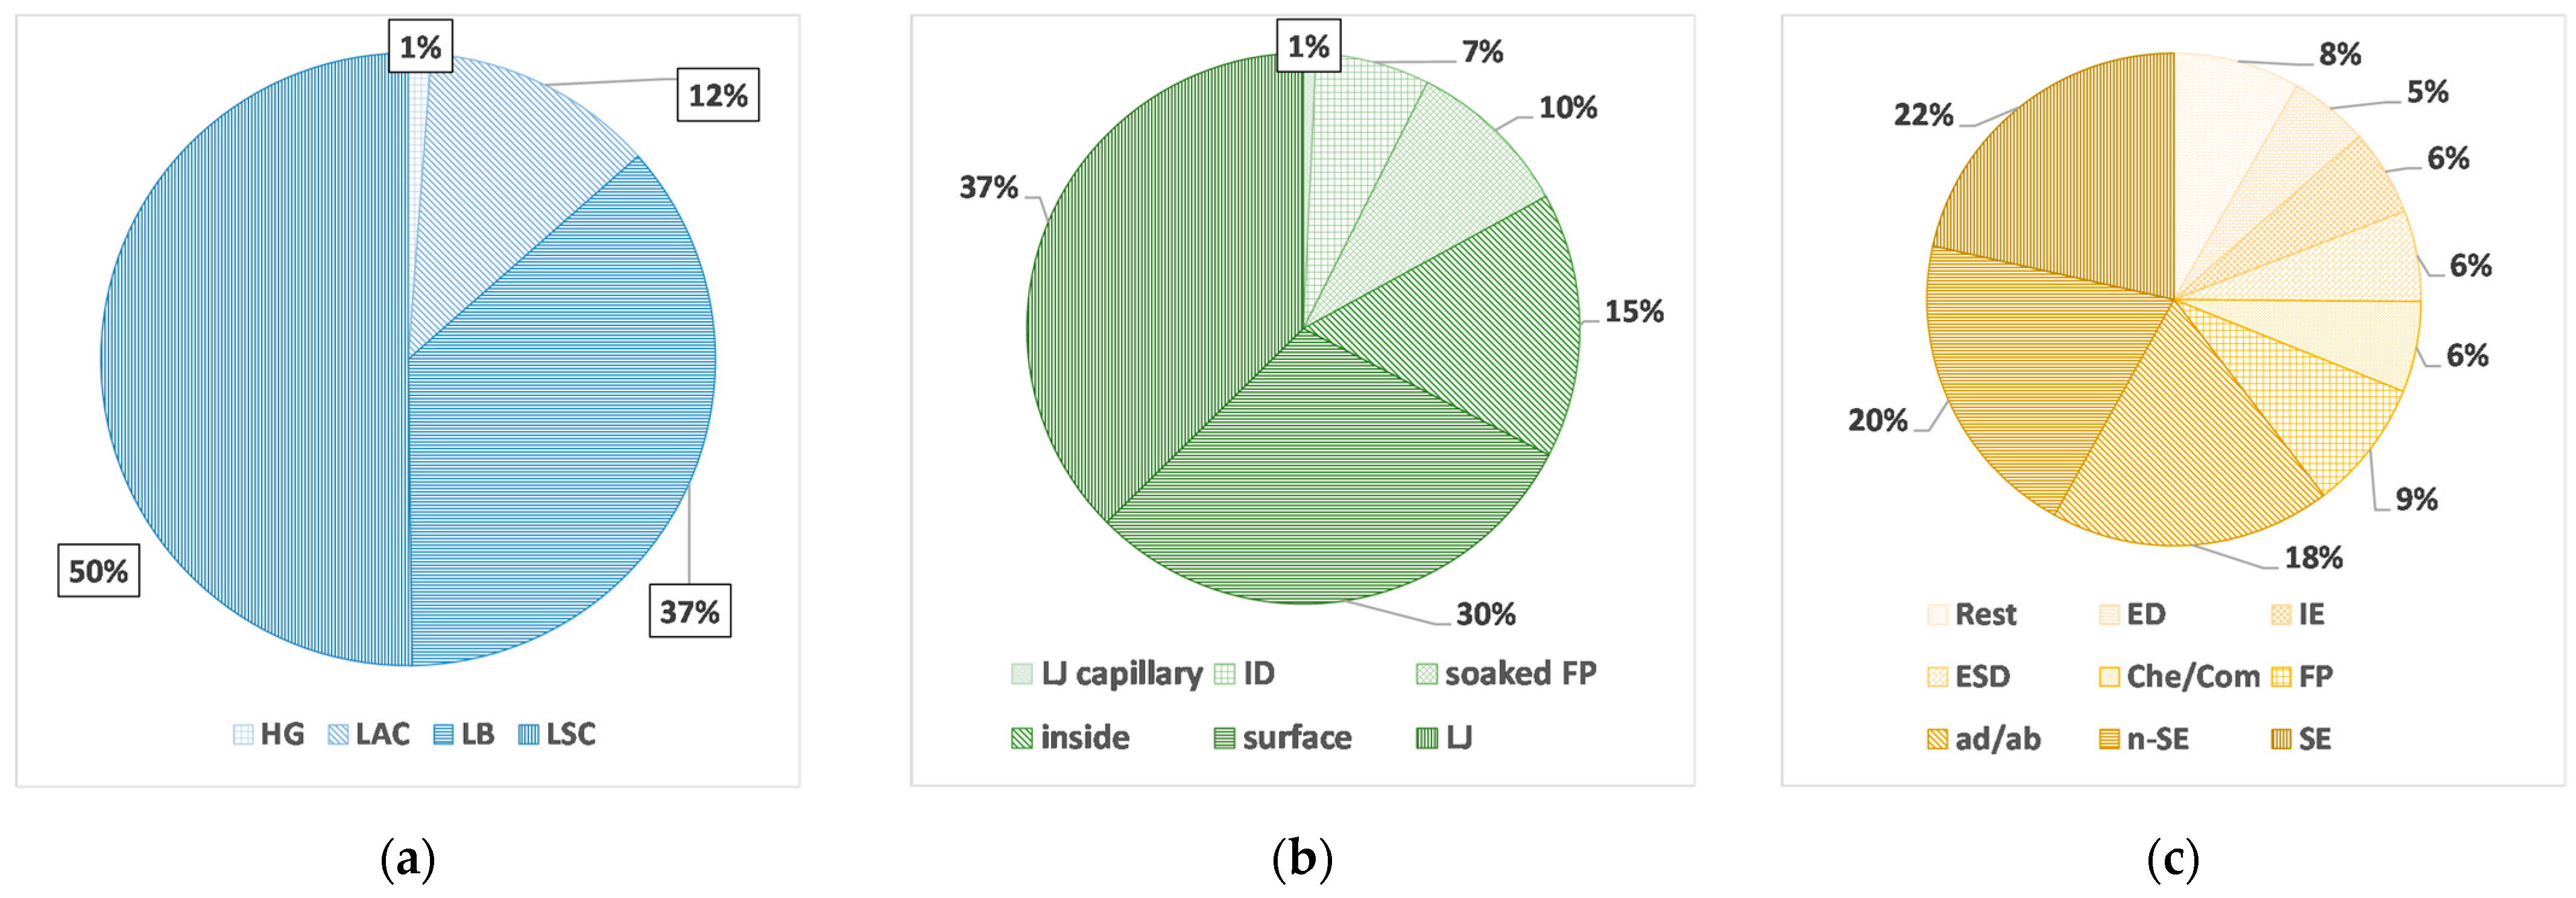
3.3. Sample Preparation Techniques
- (1)
- LB
- (2)
- LSC
- (3)
- LAC
- (4)
- HG
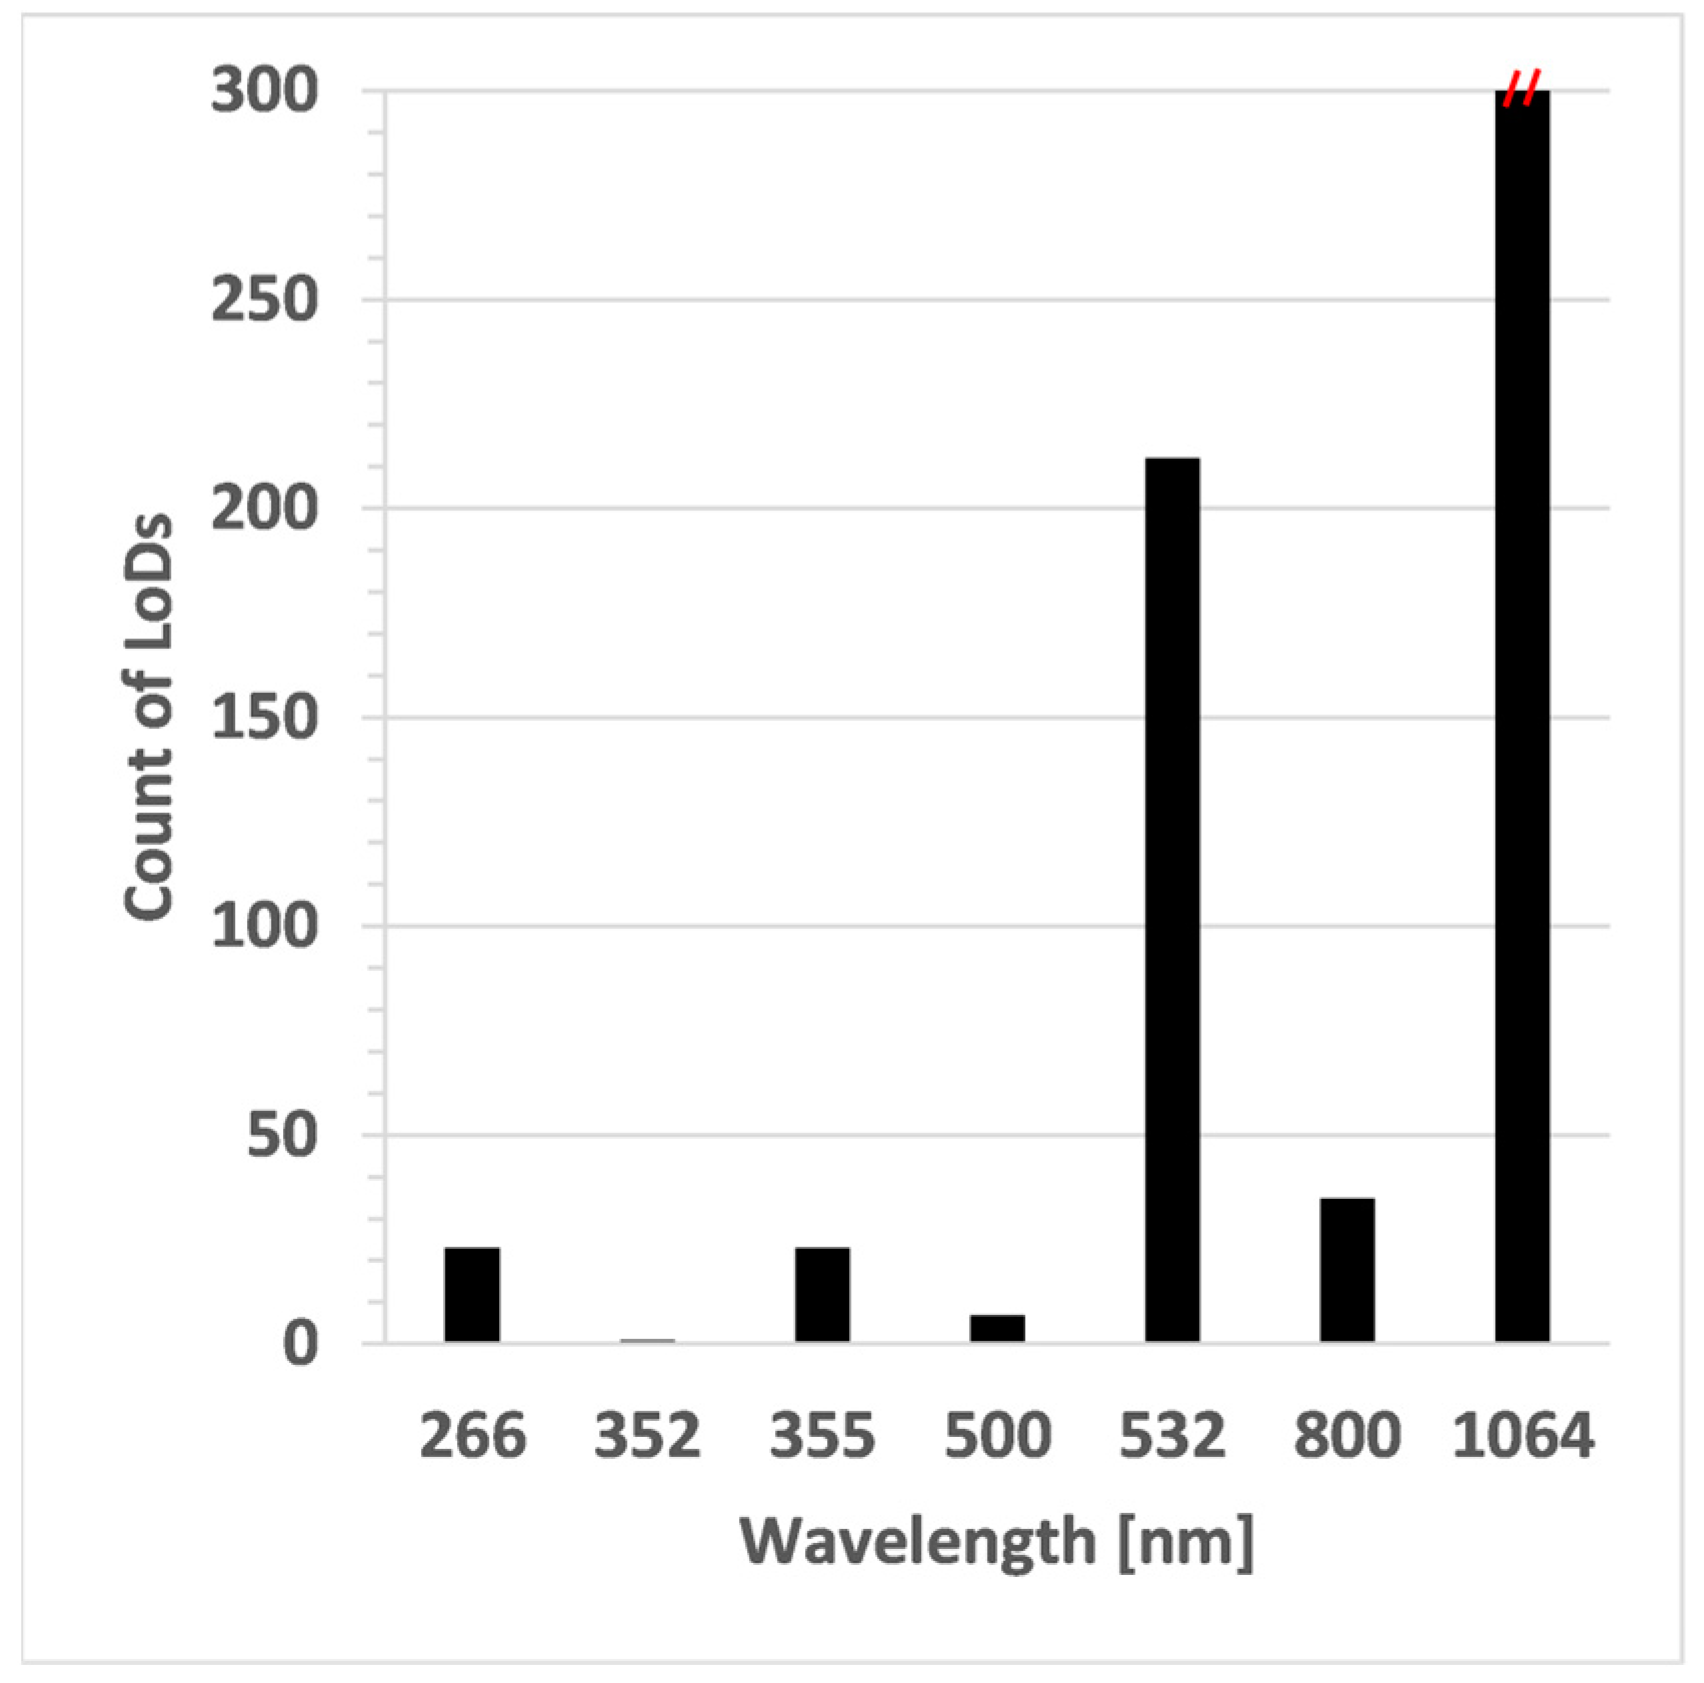
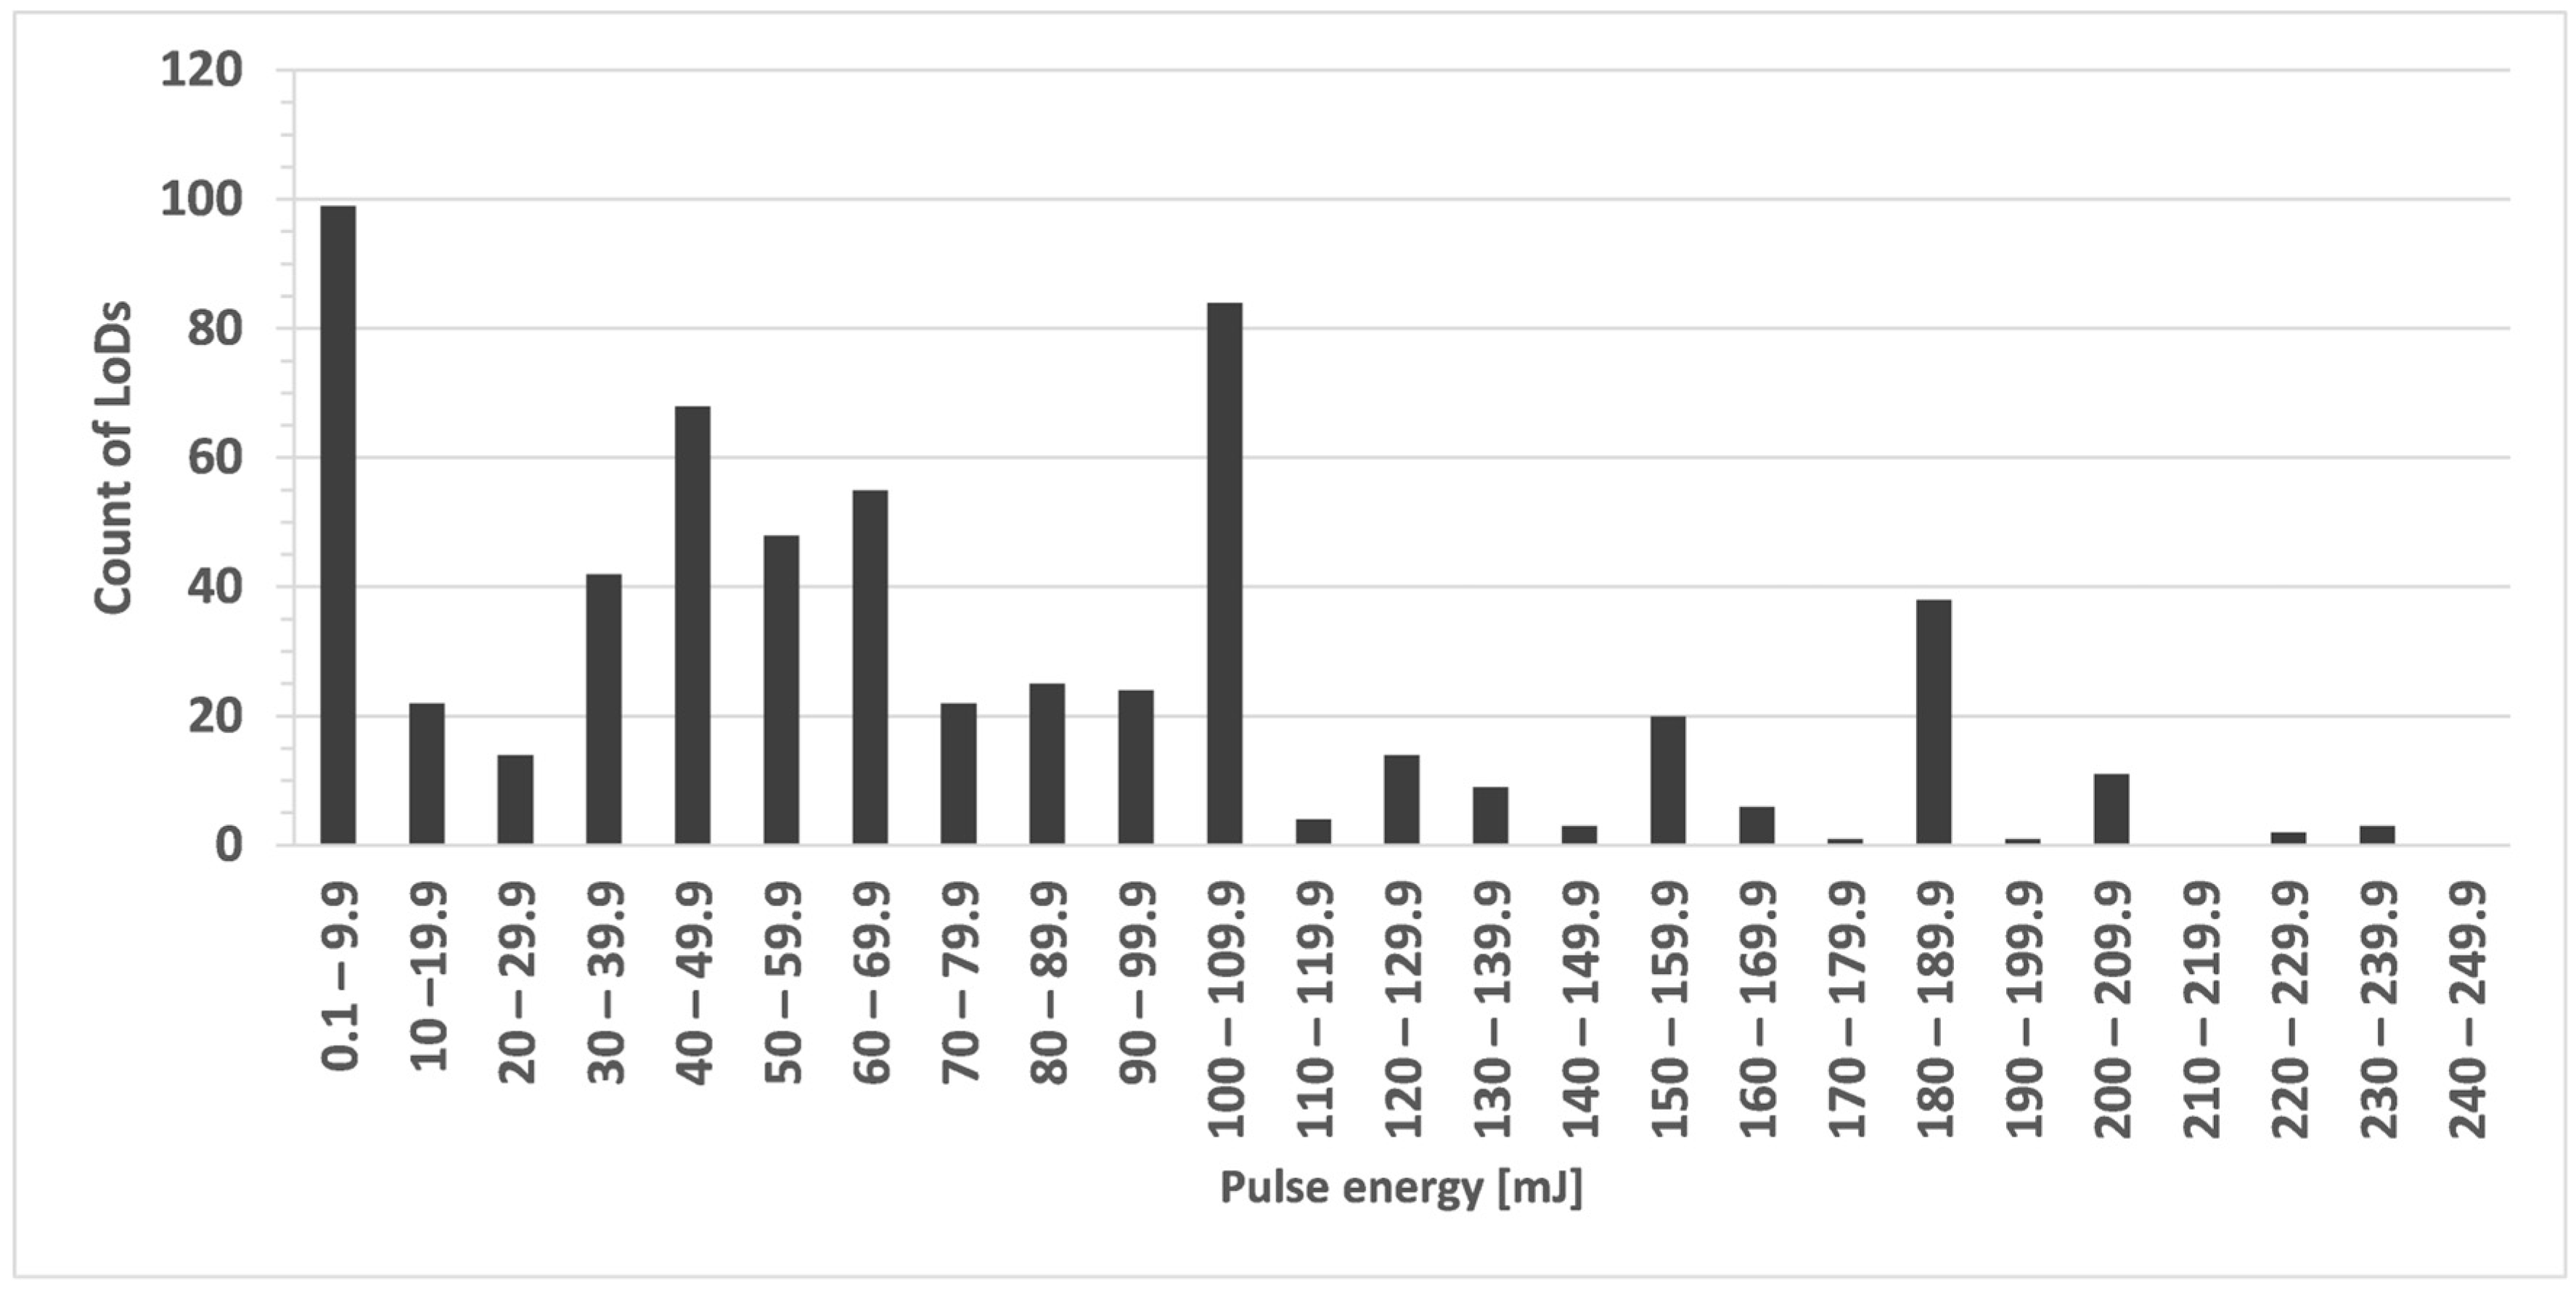
3.4. Instrument Types, Experimental Setups, and Acquisition Settings
3.5. Calibration Techniques and Spectral Treatment (Chemometrics)
3.6. Self-Absorption and Self-Reversal Correction
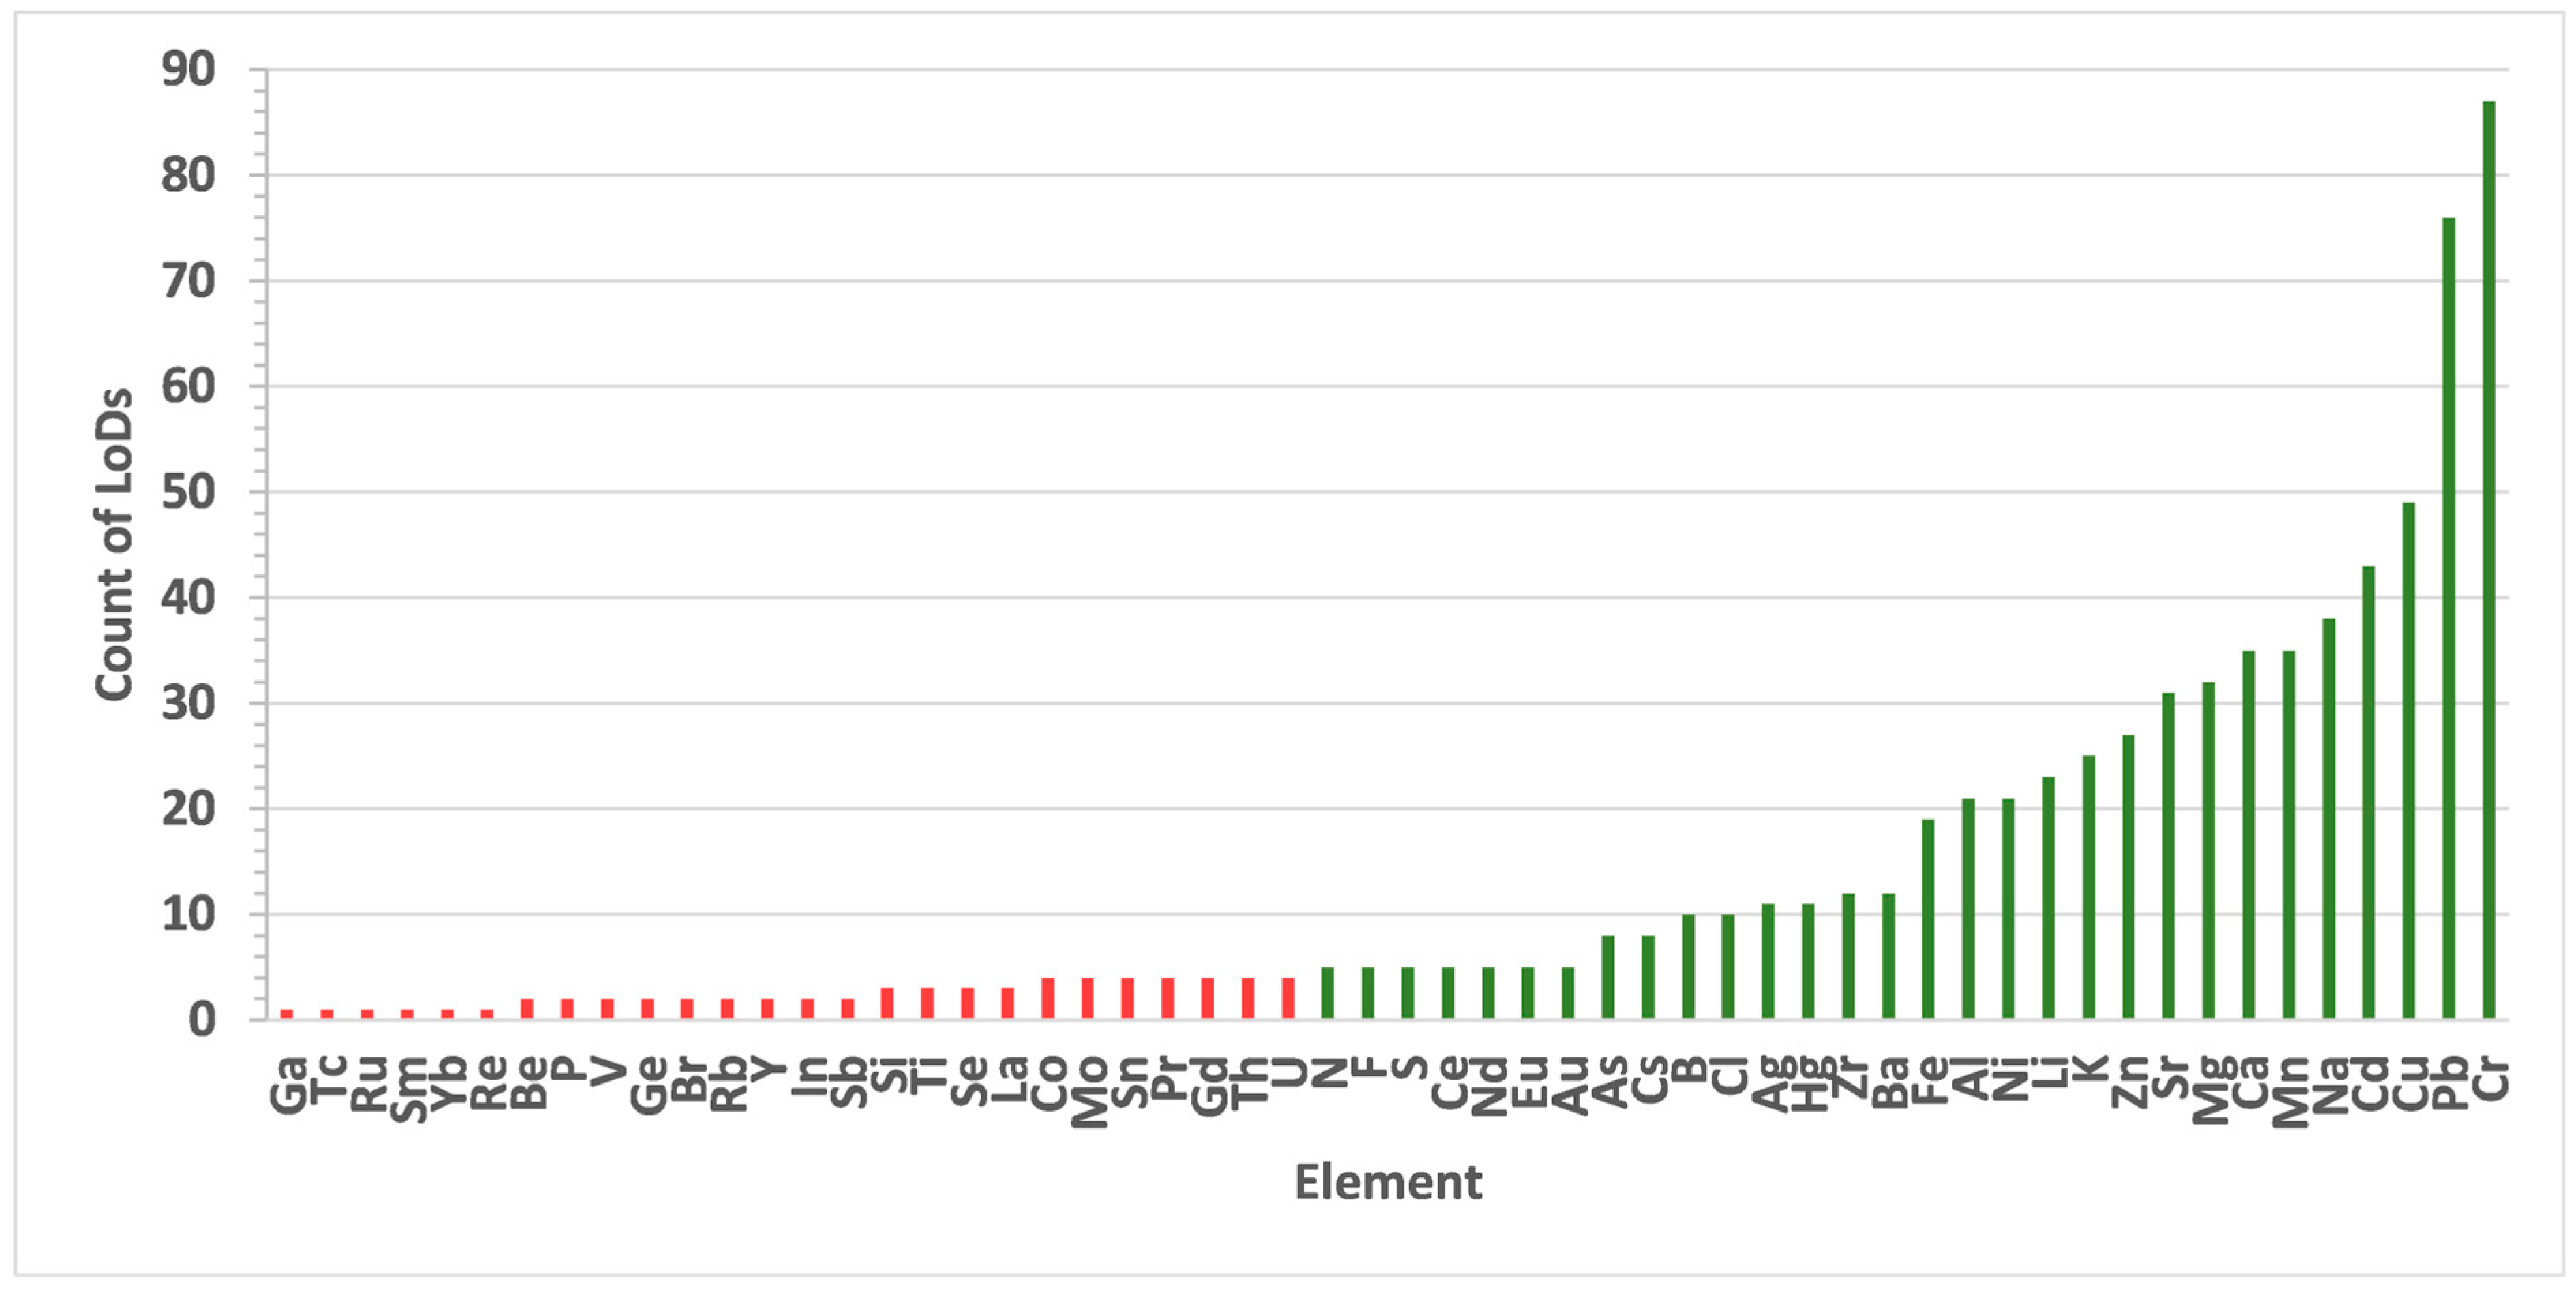
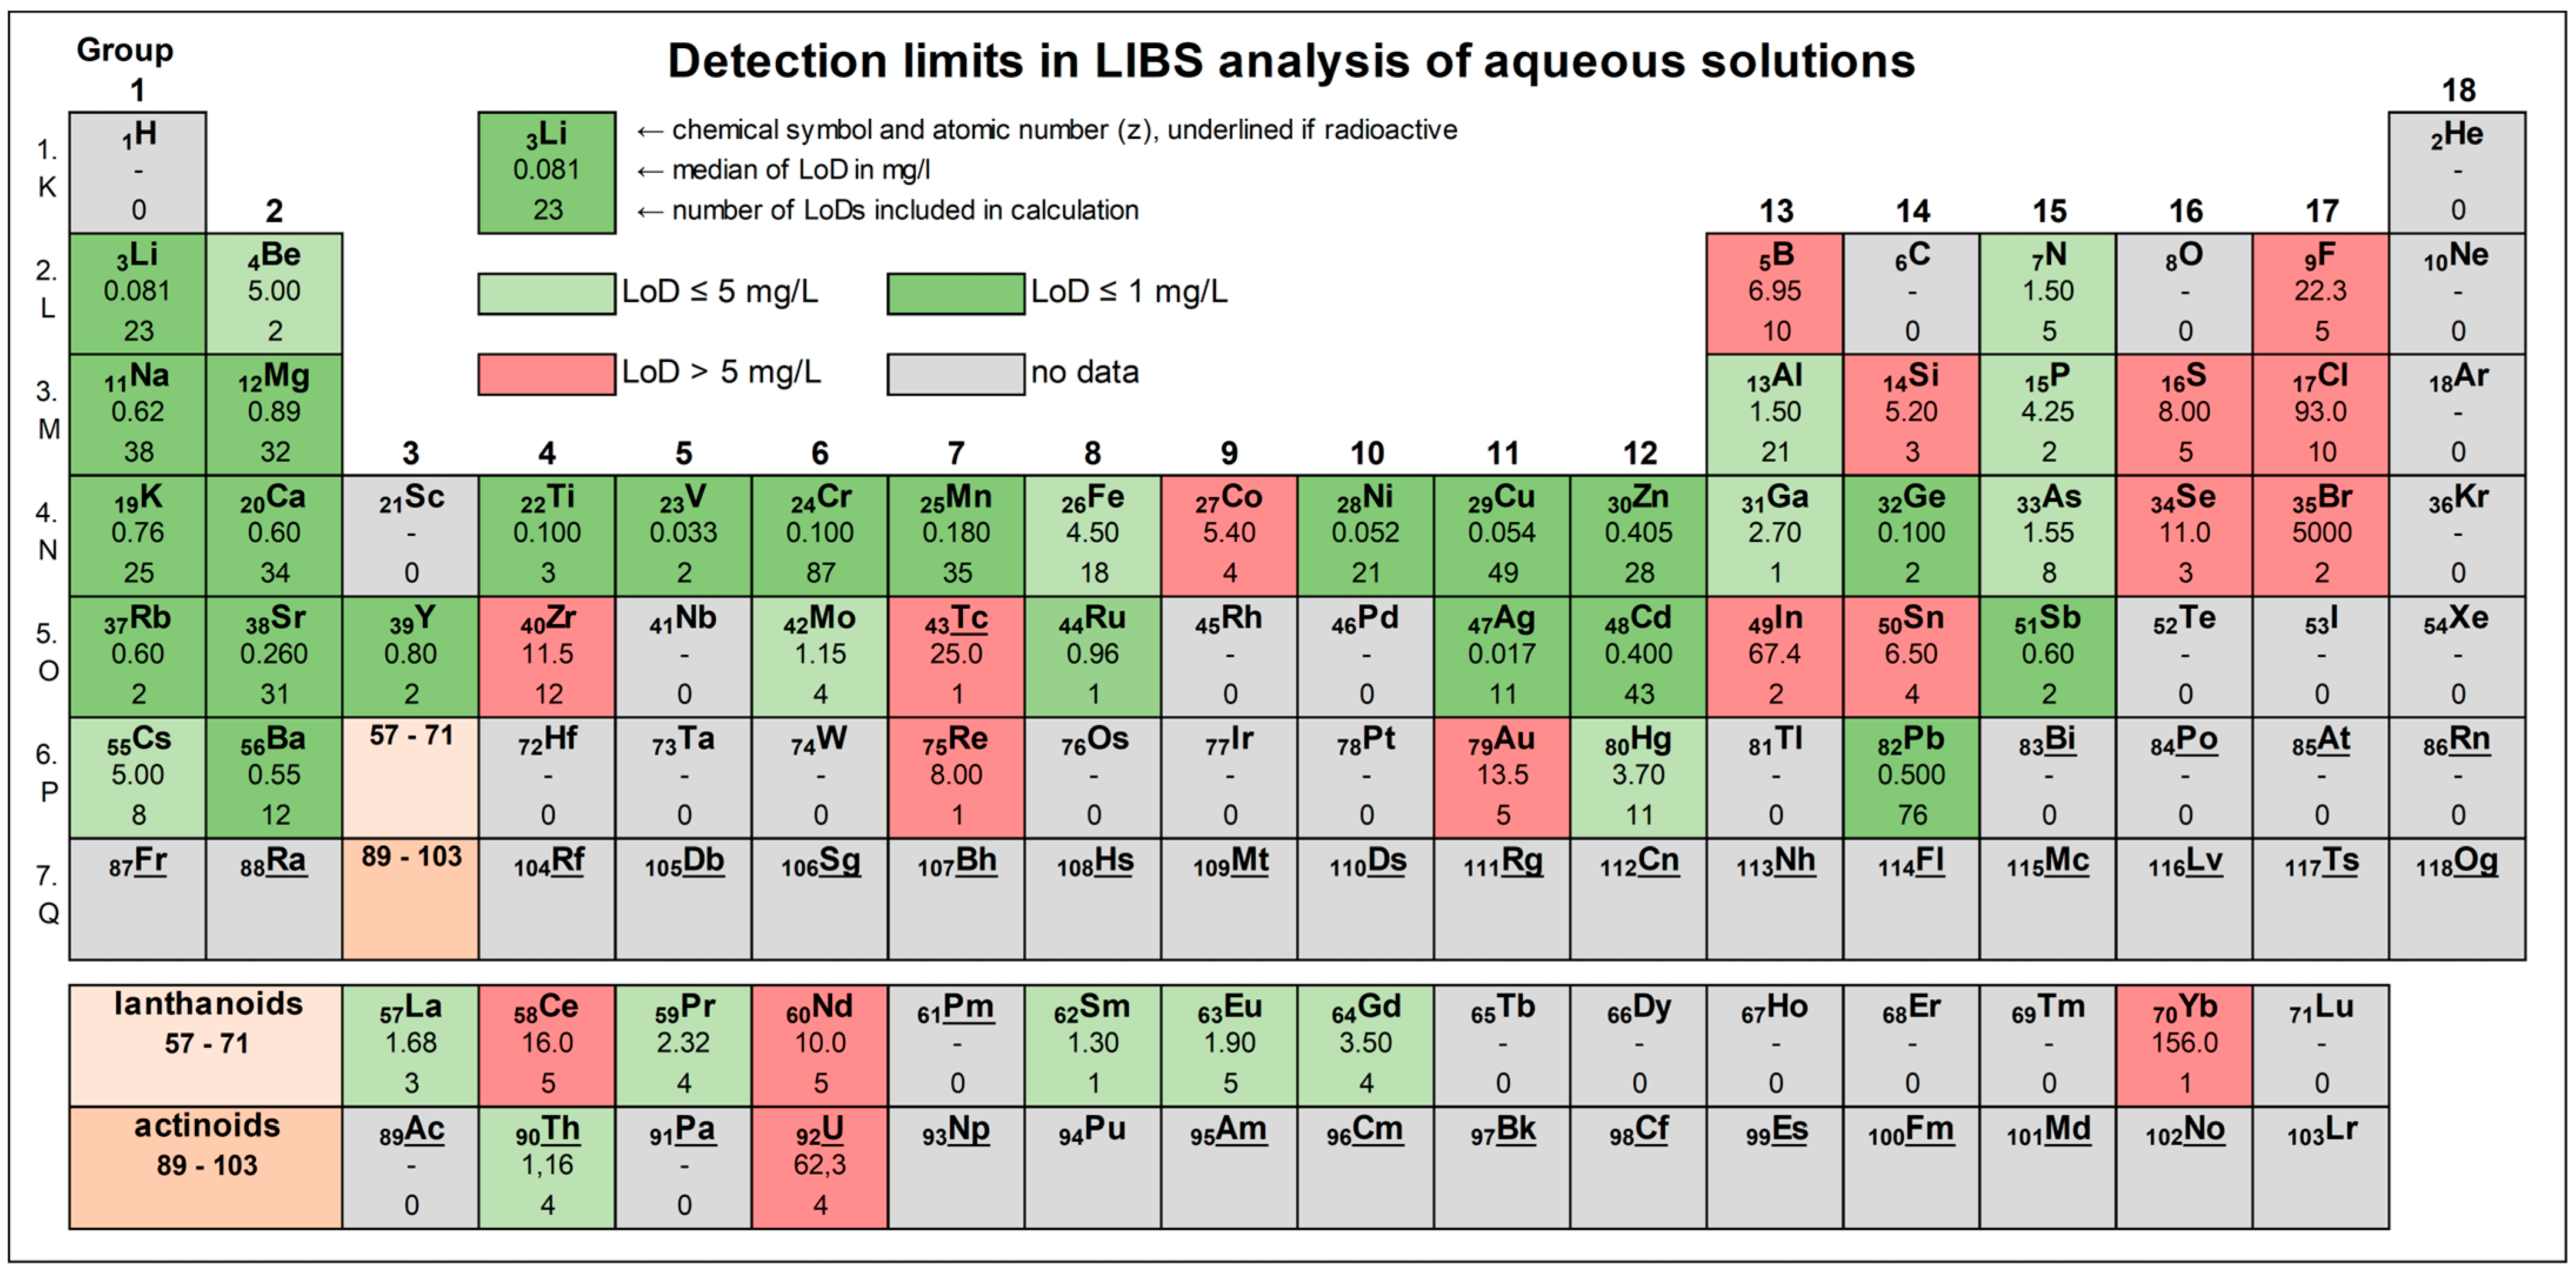
3.7. Elements Analysed by LIBS in Aqueous Solutions
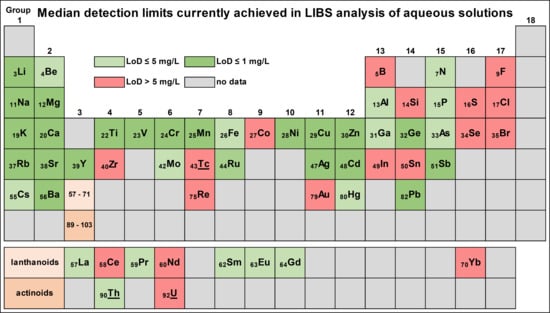
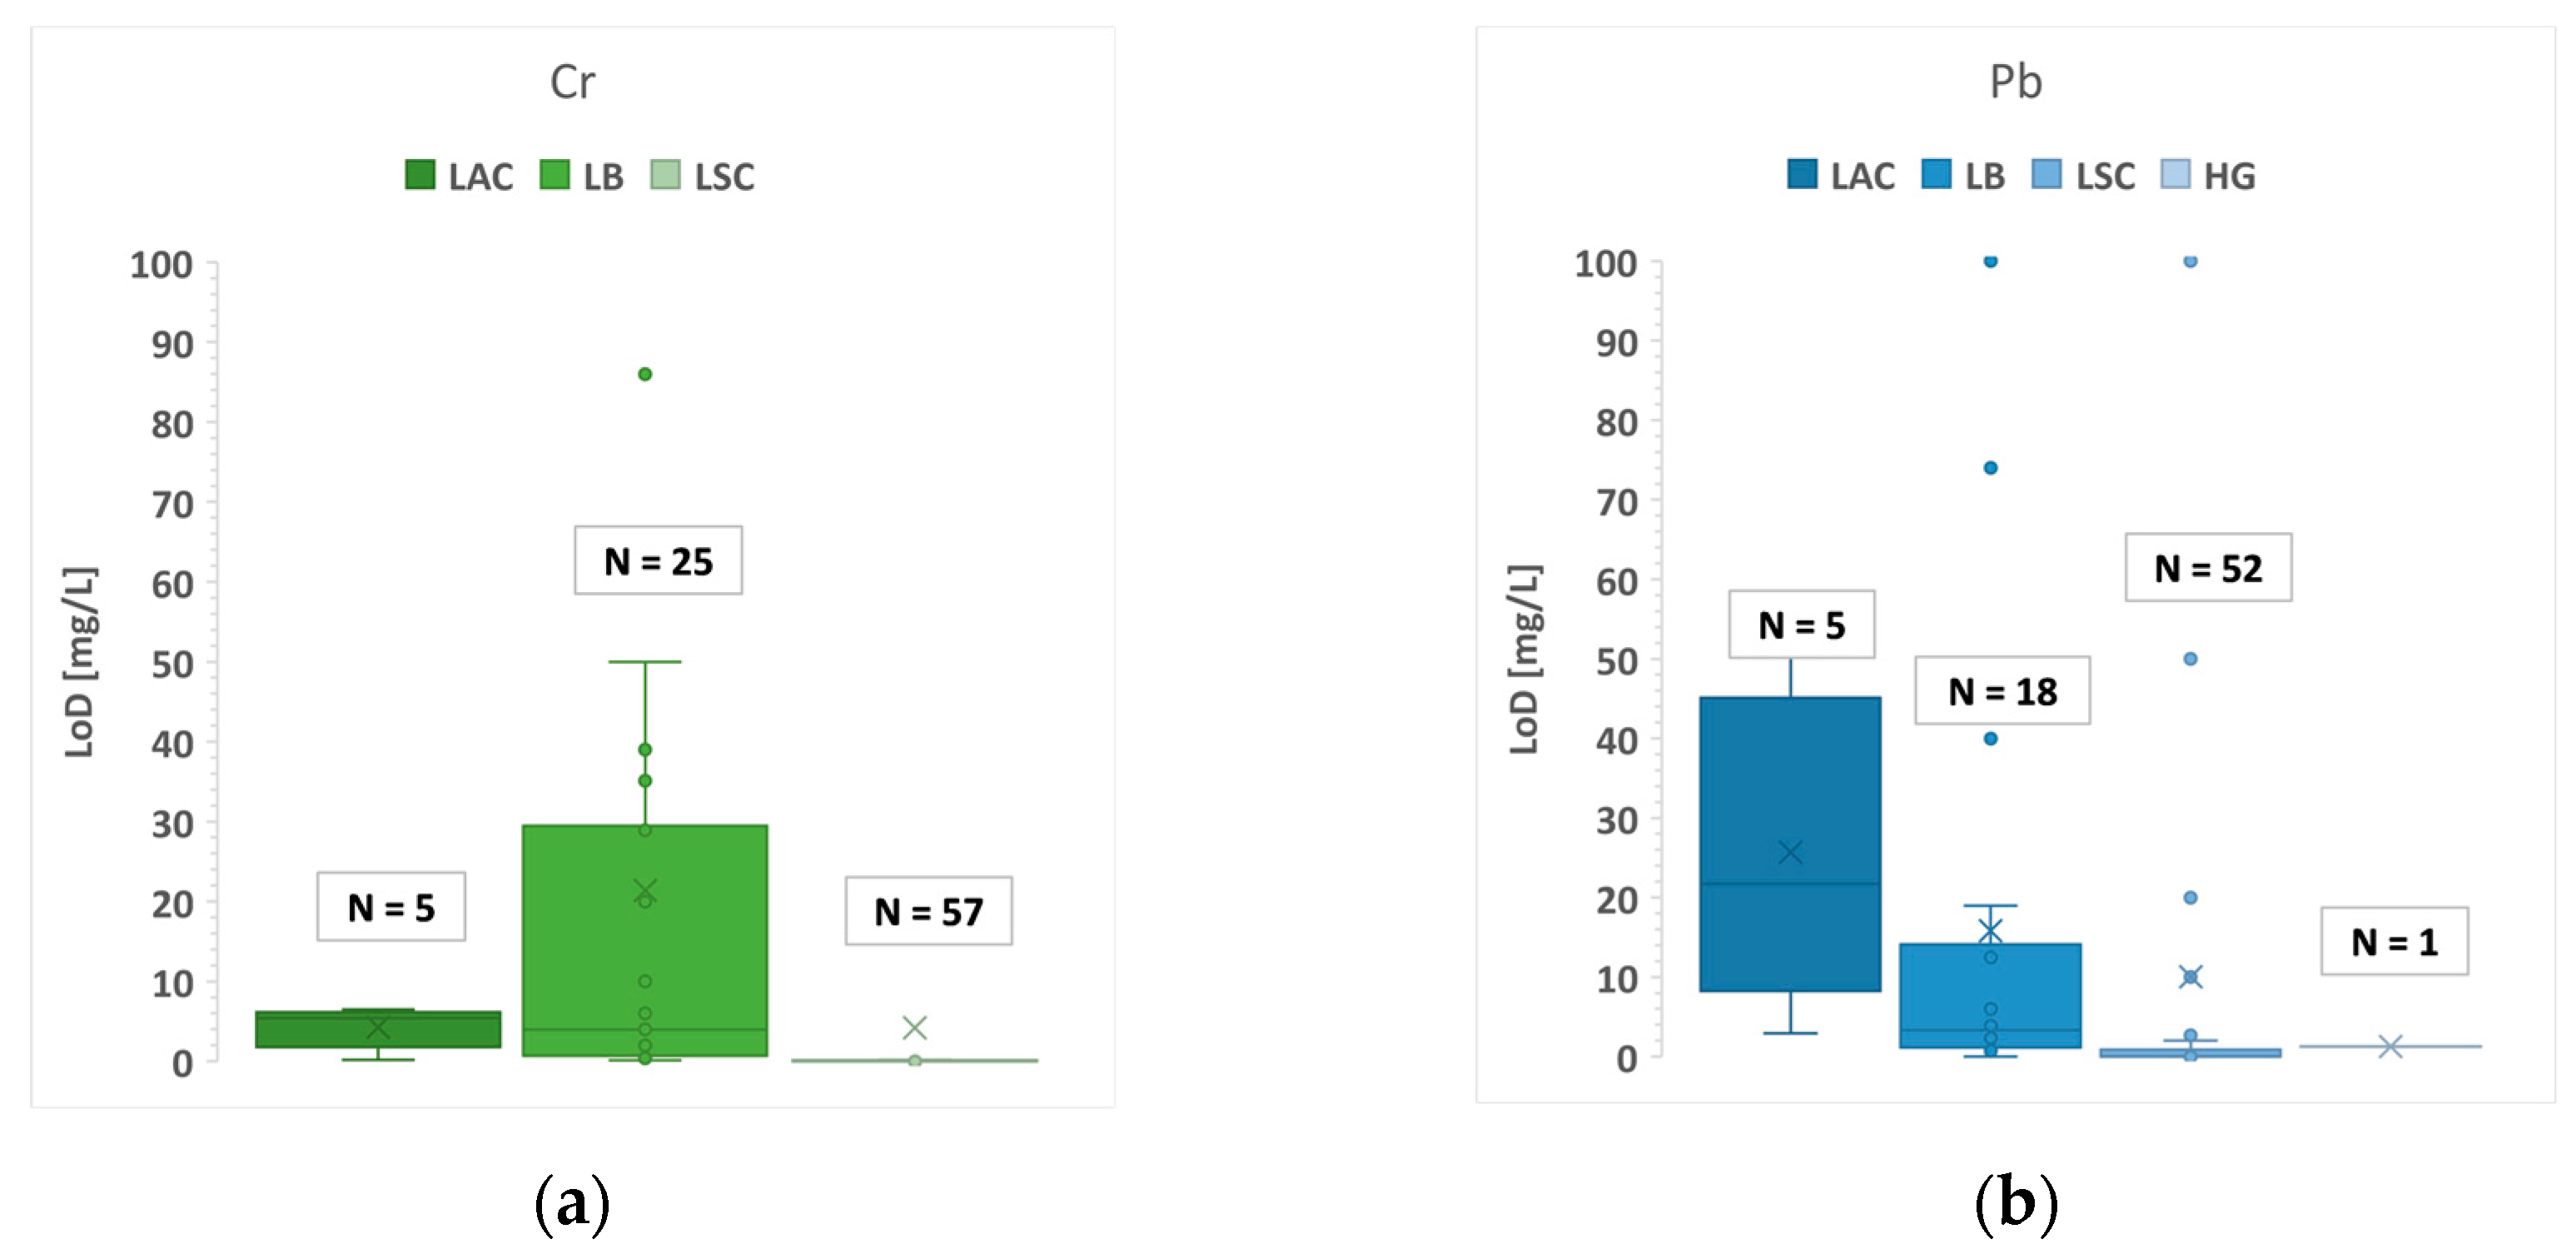
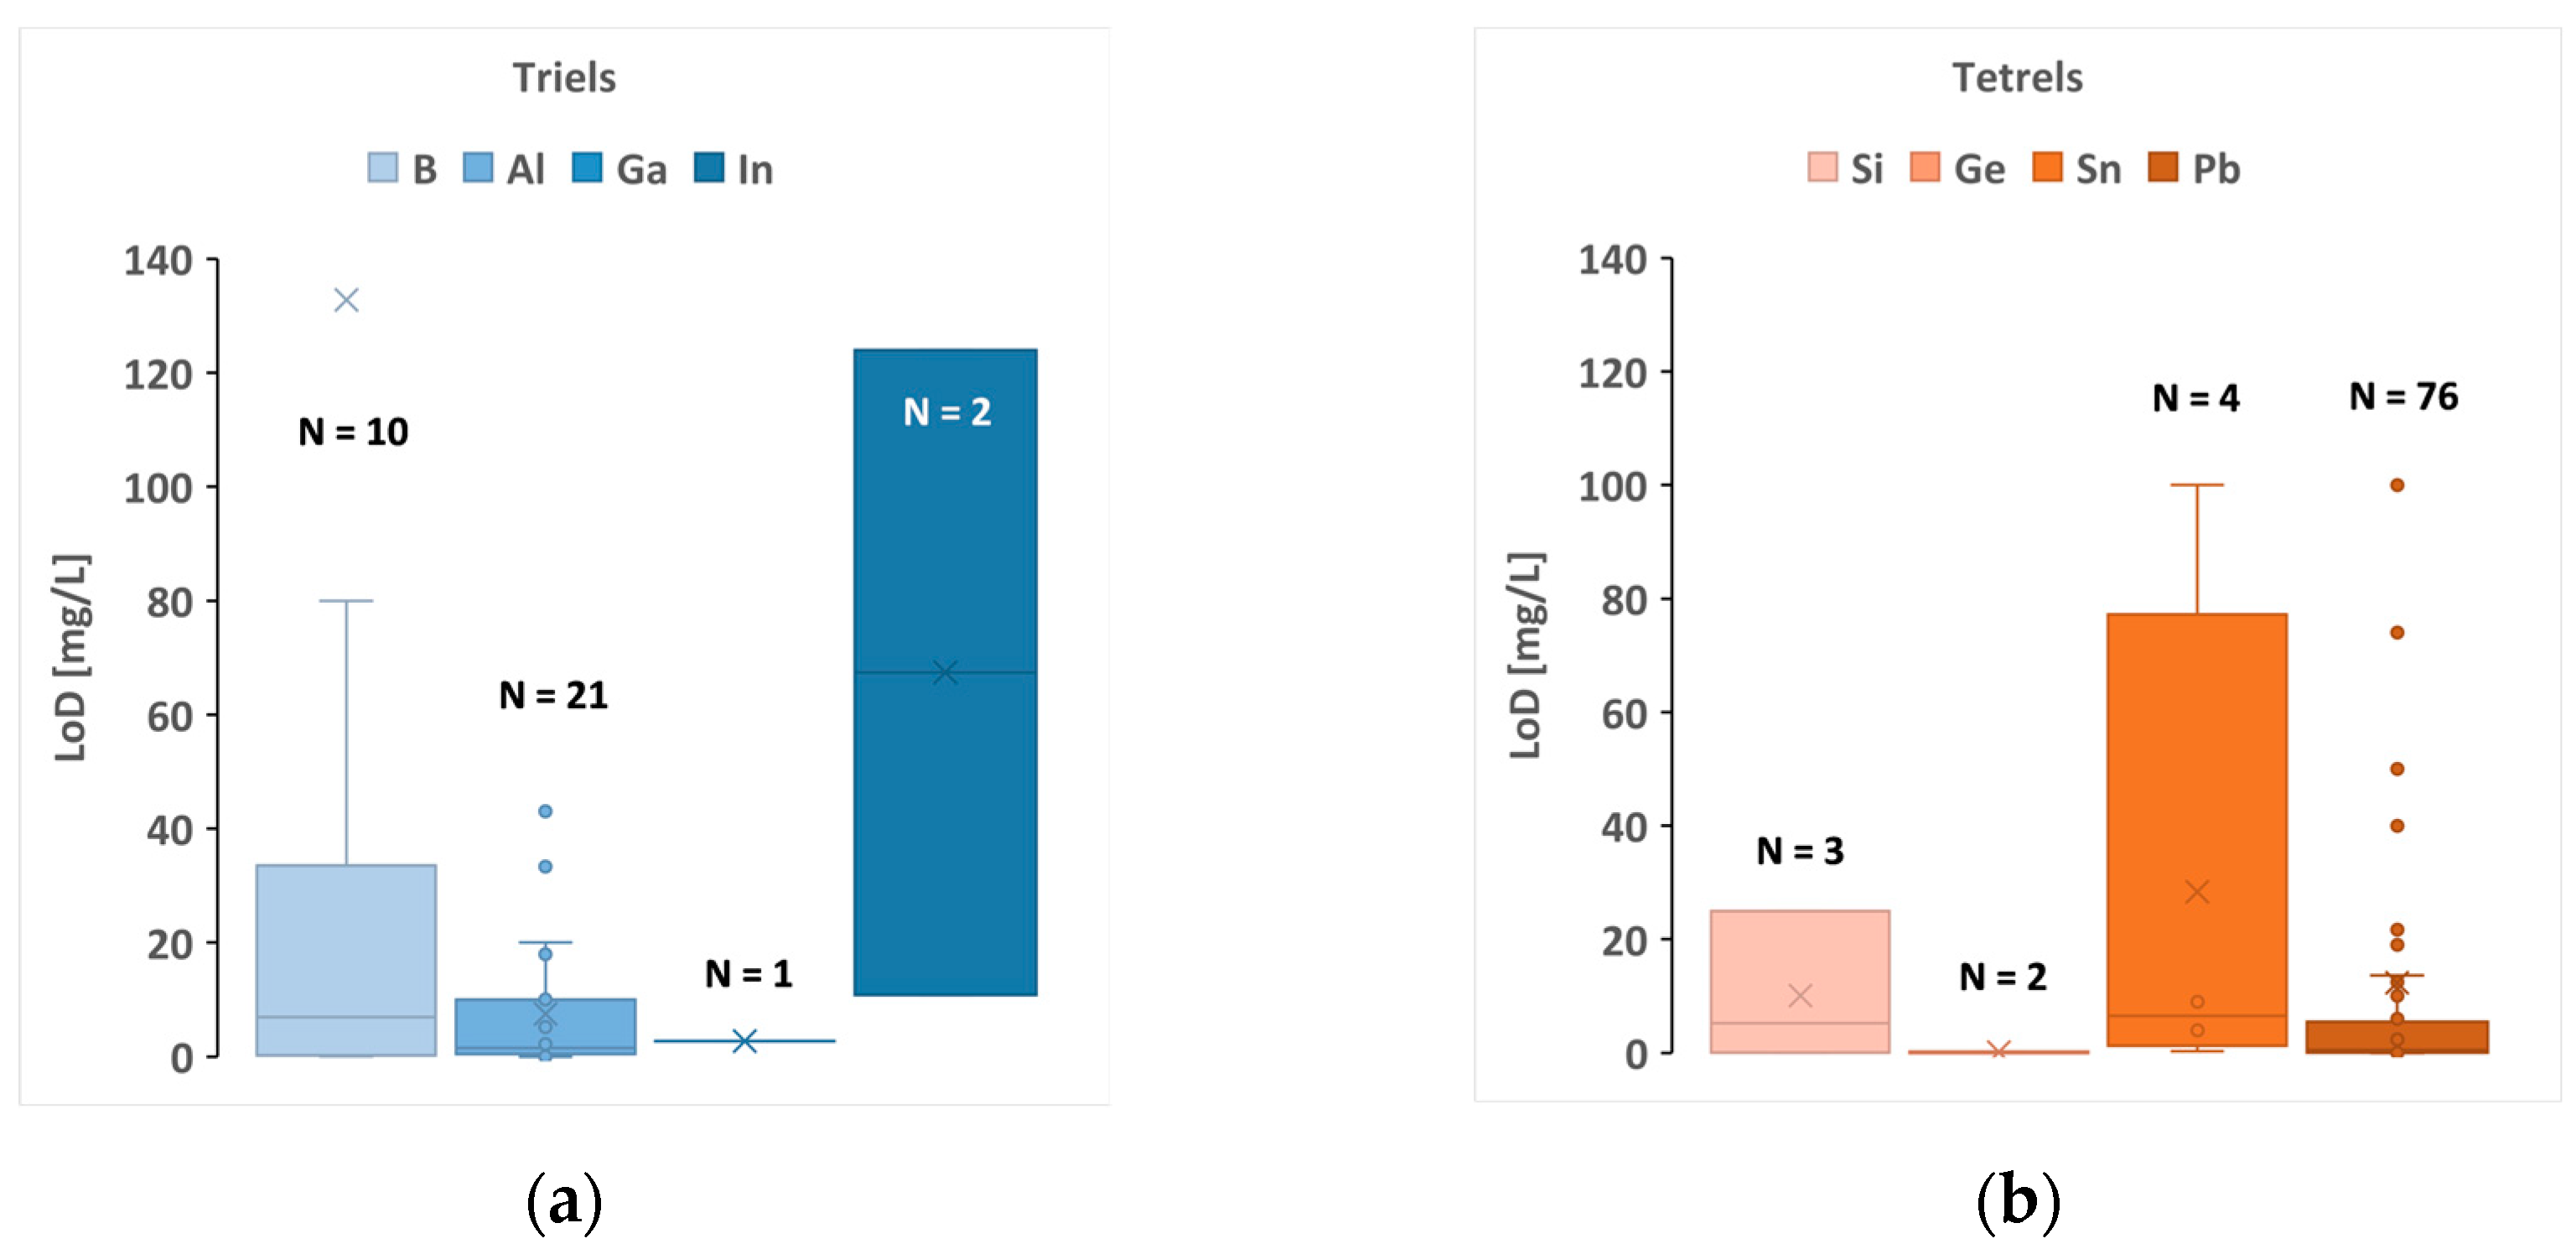
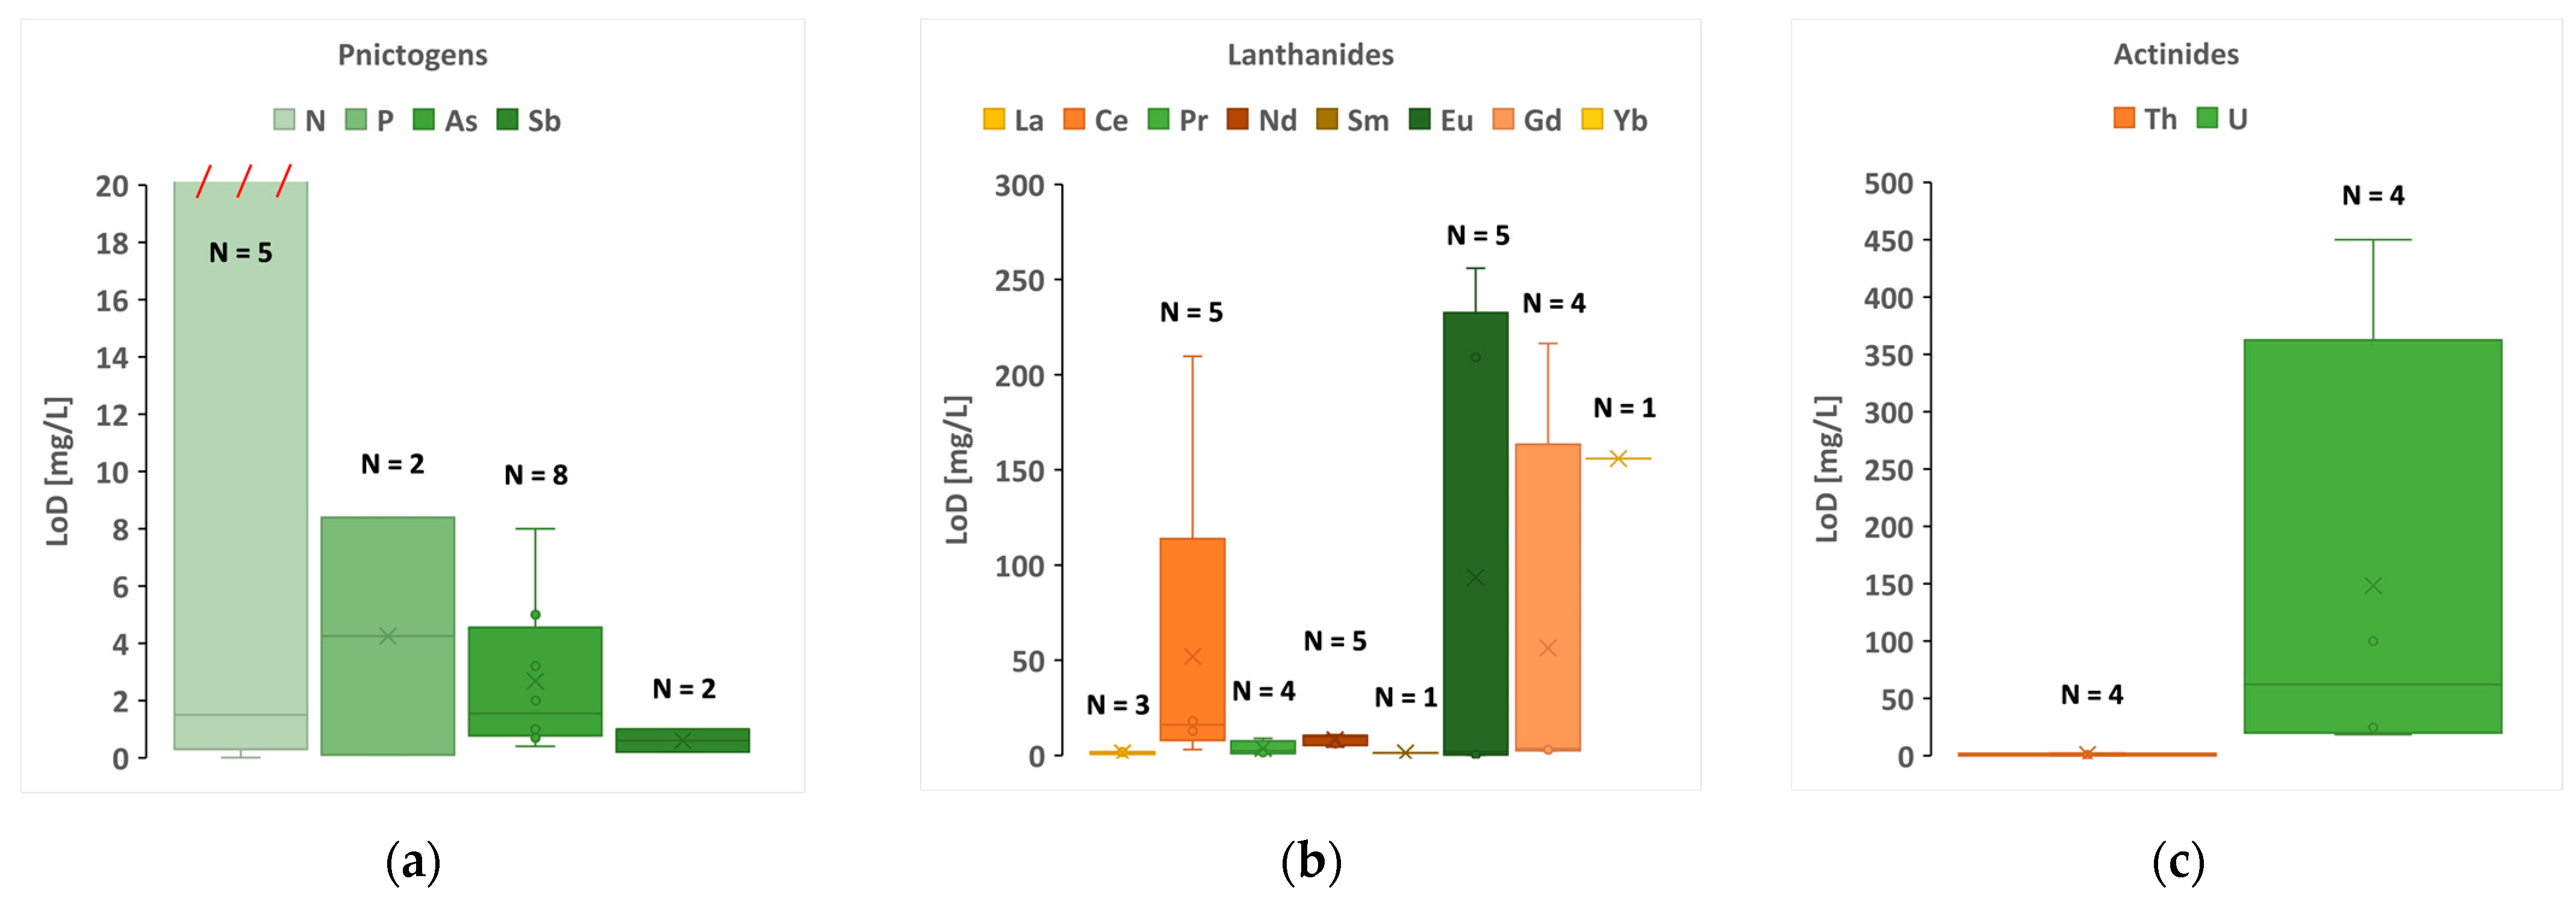
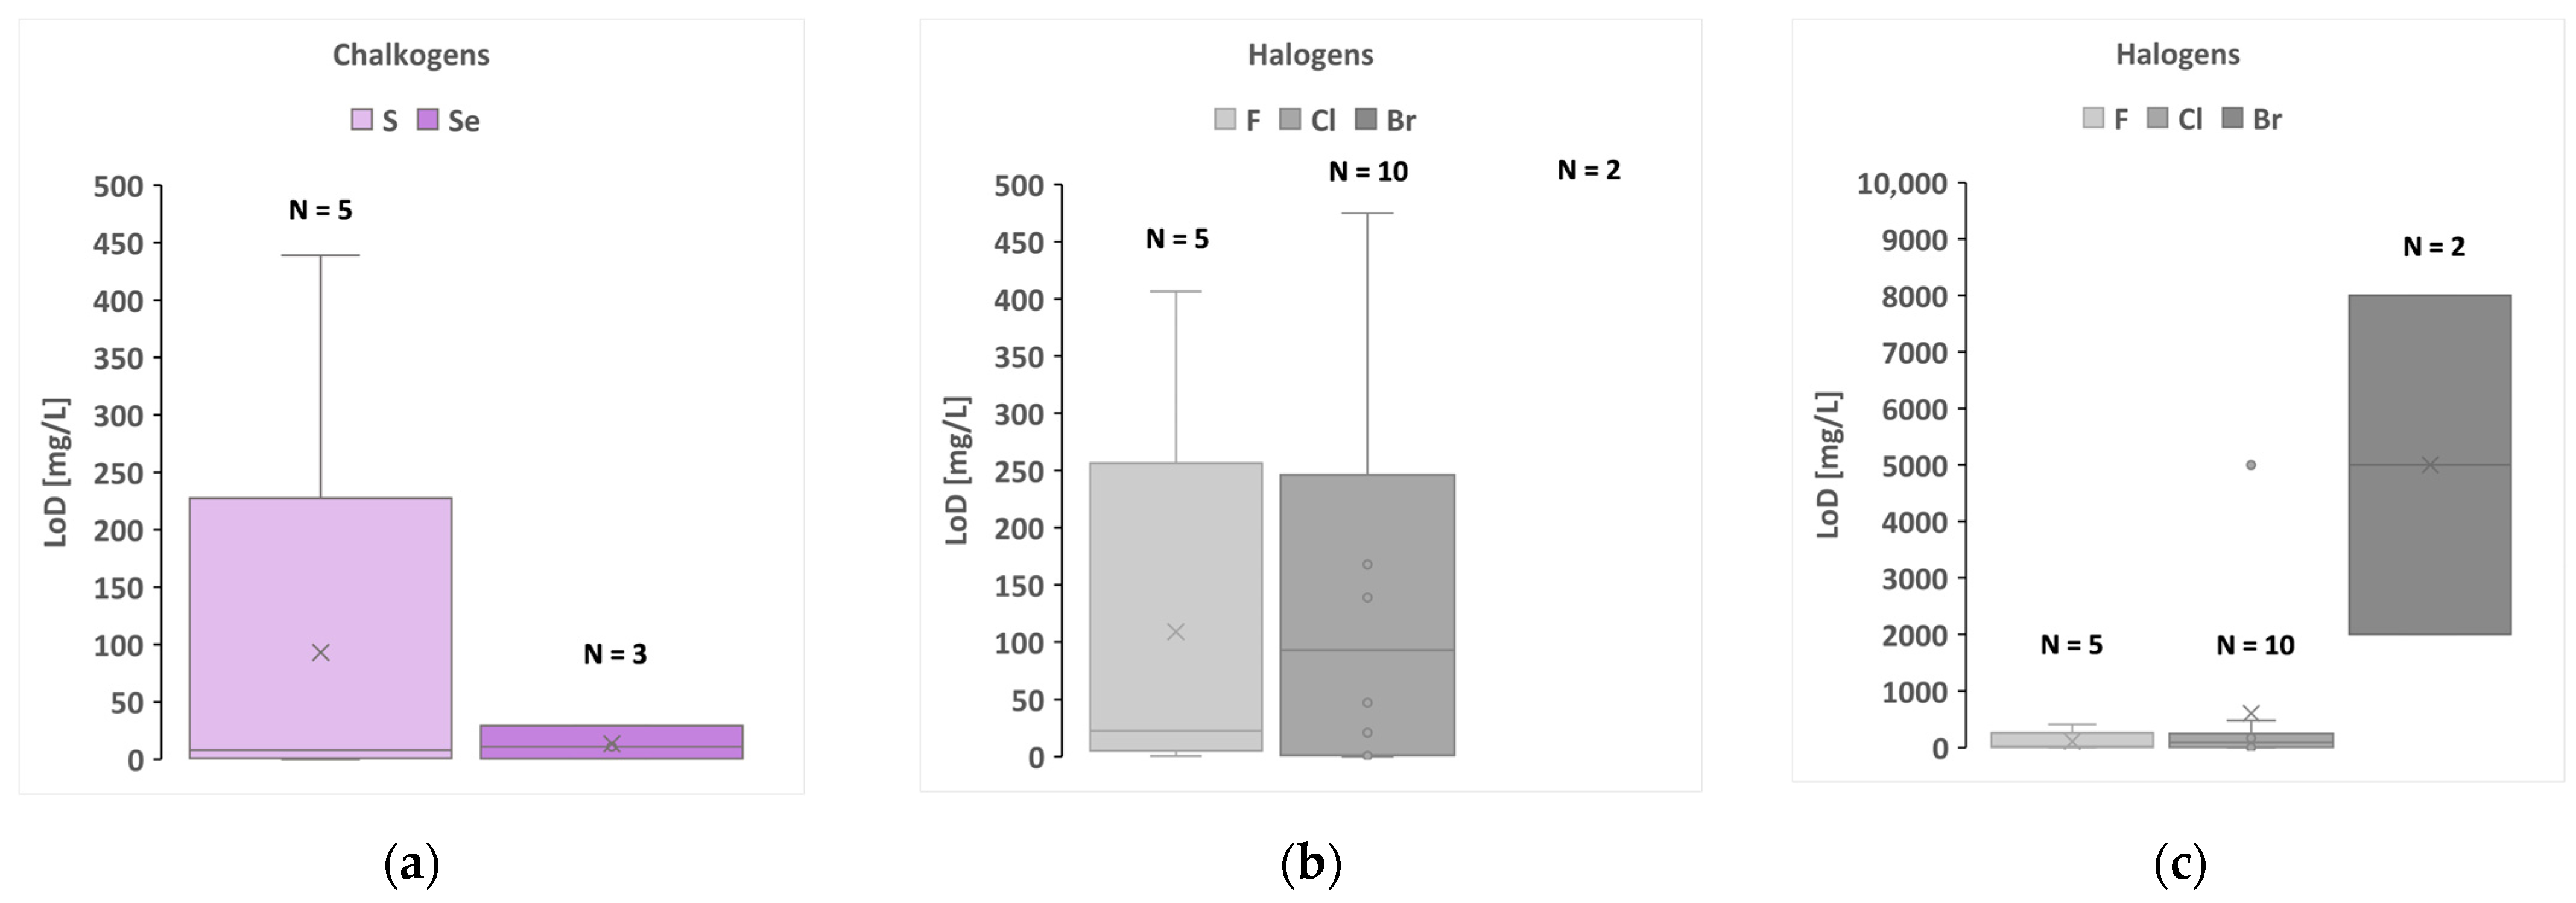
3.8. Detection Limits Achieved
4. Discussion
4.1. Sample Preparation Techniques
4.2. Instrument Types, Experimental Setups, and Acquisition Settings
4.3. Elements and Their Reported Detection Limits
4.4. Limitations of the Data Review
4.5. Future Directions
5. Conclusions
Supplementary Materials
Author Contributions
Funding
Institutional Review Board Statement
Informed Consent Statement
Data Availability Statement
Acknowledgments
Conflicts of Interest
References
- Hartzler, D.A.; Bhatt, C.R.; McIntyre, D.L. Design, Construction, and Validation of an in-Situ Groundwater Trace Element Analyzer with Applications in Carbon Storage. Sci. Rep. 2023, 13, 7516. [Google Scholar] [CrossRef] [PubMed]
- Zuber, A.; Bachhuka, A.; Tassios, S.; Tiddy, C.; Vasilev, K.; Ebendorff-Heidepriem, H. Field Deployable Method for Gold Detection Using Gold Pre-Concentration on Functionalized Surfaces. Sensors 2020, 20, 492. [Google Scholar] [CrossRef] [PubMed]
- Koch, S.; Court, R.; Garen, W.; Neu, W.; Reuter, R. Detection of Manganese in Solution in Cavitation Bubbles Using Laser Induced Breakdown Spectroscopy. Spectrochim. Acta Part B At. Spectrosc. 2005, 60, 1230–1235. [Google Scholar] [CrossRef]
- Wachter, J.R.; Cremers, D.A. Determination of Uranium in Solution Using Laser-Induced Breakdown Spectroscopy. Appl. Spectrosc. 1987, 41, 1042–1048. [Google Scholar] [CrossRef]
- Kuwako, A.; Uchida, Y.; Maeda, K. Supersensitive Detection of Sodium in Water with Use of Dual-Pulse Laser-Induced Breakdown Spectroscopy. Appl. Opt. 2003, 42, 6052. [Google Scholar] [CrossRef] [PubMed]
- He, Y.; Wang, X.; Guo, S.; Li, A.; Xu, X.; Wazir, N.; Ding, C.; Lu, T.; Xie, L.; Zhang, M.; et al. Lithium Ion Detection in Liquid with Low Detection Limit by Laser-Induced Breakdown Spectroscopy. Appl. Opt. 2019, 58, 422. [Google Scholar] [CrossRef] [PubMed]
- Nakanishi, R.; Ohba, H.; Saeki, M.; Wakaida, I.; Tanabe-Yamagishi, R.; Ito, Y. Highly Sensitive Detection of Sodium in Aqueous Solutions Using Laser-Induced Breakdown Spectroscopy with Liquid Sheet Jets. Opt. Express 2021, 29, 5205. [Google Scholar] [CrossRef]
- Bocková, J.; Marín Roldán, A.; Yu, J.; Veis, P. Potential Use of Surface-Assisted LIBS for Determination of Strontium in Wines. Appl. Opt. 2018, 57, 8272. [Google Scholar] [CrossRef]
- St-Onge, L.; Kwong, E.; Sabsabi, M.; Vadas, E.B. Rapid Analysis of Liquid Formulations Containing Sodium Chloride Using Laser-Induced Breakdown Spectroscopy. J. Pharm. Biomed. Anal. 2004, 36, 277–284. [Google Scholar] [CrossRef]
- Bhatt, C.R.; Goueguel, C.L.; Jain, J.C.; McIntyre, D.L.; Singh, J.P. LIBS Application to Liquid Samples. In Laser-Induced Breakdown Spectroscopy; Elsevier: Amsterdam, The Netherlands, 2020; pp. 231–246. ISBN 978-0-12-818829-3. [Google Scholar]
- Schlatter, N.; Lottermoser, B.G.; Illgner, S.; Schmidt, S. Utilising Portable Laser-Induced Breakdown Spectroscopy for Quantitative Inorganic Water Testing. Chemosensors 2023, 11, 479. [Google Scholar] [CrossRef]
- Baudelet, M.; Smith, B.W. The First Years of Laser-Induced Breakdown Spectroscopy. J. Anal. At. Spectrom. 2013, 28, 624. [Google Scholar] [CrossRef]
- Cremers, D.A.; Radziemski, L.J. Handbook of Laser-Induced Breakdown Spectroscopy, 2nd ed.; Wiley, A John Wiley & Sons, Ltd., Publication: Chichester, UK, 2013; ISBN 978-1-118-56736-4. [Google Scholar]
- Tang, Z.; Hao, Z.; Zhou, R.; Li, Q.; Liu, K.; Zhang, W.; Yan, J.; Wei, K.; Li, X. Sensitive Analysis of Fluorine and Chlorine Elements in Water Solution Using Laser-Induced Breakdown Spectroscopy Assisted with Molecular Synthesis. Talanta 2021, 224, 121784. [Google Scholar] [CrossRef] [PubMed]
- Harun, H.A.; Zainal, R. Laser-Induced Breakdown Spectroscopy Measurement for Liquids: Experimental Configurations and Sample Preparations. J. Nonlinear Optic. Phys. Mat. 2018, 27, 1850023. [Google Scholar] [CrossRef]
- Senesi, G.S.; Harmon, R.S.; Hark, R.R. Field-Portable and Handheld Laser-Induced Breakdown Spectroscopy: Historical Review, Current Status and Future Prospects. Spectrochim. Acta Part B At. Spectrosc. 2021, 175, 106013. [Google Scholar] [CrossRef]
- Harmon, R.S.; Senesi, G.S. Laser-Induced Breakdown Spectroscopy—A Geochemical Tool for the 21st Century. Appl. Geochem. 2021, 128, 104929. [Google Scholar] [CrossRef]
- Keerthi, K.; George, S.D.; Sebastian, J.G.; Warrier, A.K.; Chidangil, S.; Unnikrishnan, V.K. Optimization of Different Sampling Approaches in Liquid LIBS Analysis for Environmental Applications. J. Anal. At. Spectrom. 2022, 37, 2625–2636. [Google Scholar] [CrossRef]
- Cremers, D.A.; Radziemski, L.J.; Loree, T.R. Spectrochemical Analysis of Liquids Using the Laser Spark. Appl. Spectrosc. 1984, 38, 721–729. [Google Scholar] [CrossRef]
- Ma, S.; Tang, Y.; Ma, Y.; Chu, Y.; Chen, F.; Hu, Z.; Zhu, Z.; Guo, L.; Zeng, X.; Lu, Y. Determination of Trace Heavy Metal Elements in Aqueous Solution Using Surface-Enhanced Laser-Induced Breakdown Spectroscopy. Opt. Express 2019, 27, 15091. [Google Scholar] [CrossRef]
- Maity, U.K.; Manoravi, P.; Joseph, M.; Sivaraman, N. Laser-Induced Breakdown Spectroscopy for Simultaneous Determination of Lighter Lanthanides in Actinide Matrix in Aqueous Medium. Spectrochim. Acta Part B At. Spectrosc. 2022, 190, 106393. [Google Scholar] [CrossRef]
- Legnaioli, S.; Botto, A.; Campanella, B.; Poggialini, F.; Raneri, S.; Palleschi, V. Univariate Linear Methods. In Chemometrics and Numerical Methods in LIBS; Palleschi, V., Ed.; Wiley: Hoboken, NJ, USA, 2022; pp. 259–276. ISBN 978-1-119-75961-4. [Google Scholar]
- Poggialini, F.; Legnaioli, S.; Campanella, B.; Cocciaro, B.; Lorenzetti, G.; Raneri, S.; Palleschi, V. Calculating the Limits of Detection in Laser-Induced Breakdown Spectroscopy: Not as Easy as It Might Seem. Appl. Sci. 2023, 13, 3642. [Google Scholar] [CrossRef]
- Fabre, C. Advances in Laser-Induced Breakdown Spectroscopy Analysis for Geology: A Critical Review. Spectrochim. Acta Part B At. Spectrosc. 2020, 166, 105799. [Google Scholar] [CrossRef]
- National Center for Biotechnology Information. Periodic Table of Elements. Available online: https://pubchem.ncbi.nlm.nih.gov/periodic-table/ (accessed on 30 October 2023).
- Zhang, D.; Chen, A.; Chen, Y.; Wang, Q.; Li, S.; Jiang, Y.; Jin, M. Influence of Substrate Temperature on the Detection Sensitivity of Surface-Enhanced LIBS for Analysis of Heavy Metal Elements in Water. J. Anal. At. Spectrom. 2021, 36, 1280–1286. [Google Scholar] [CrossRef]
- Aras, N.; Yeşiller, S.Ü.; Ateş, D.A.; Yalçın, Ş. Ultrasonic Nebulization-Sample Introduction System for Quantitative Analysis of Liquid Samples by Laser-Induced Breakdown Spectroscopy. Spectrochim. Acta Part B At. Spectrosc. 2012, 74–75, 87–94. [Google Scholar] [CrossRef]
- Abu Kasim, A.F.; Wakil, M.A.; Grant, K.; Hearn, M.; Alwahabi, Z.T. Aqueous Ruthenium Detection by Microwave-Assisted Laser-Induced Breakdown Spectroscopy. Plasma Sci. Technol. 2022, 24, 084004. [Google Scholar] [CrossRef]
- Knopp, R.; Scherbaum, F.J.; Kim, J.I. Laser Induced Breakdown Spectroscopy (LIBS) as an Analytical Tool for the Detection of Metal Ions in Aqueous Solutions. Fresenius J. Anal. Chem. 1996, 355, 16–20. [Google Scholar] [CrossRef]
- Arca, G.; Ciucci, A.; Palleschi, V.; Rastelli, S.; Tognoni, E. Trace Element Analysis in Water by the Laser-Induced Breakdown Spectroscopy Technique. Appl. Spectrosc. 1997, 51, 1102–1105. [Google Scholar] [CrossRef]
- Fichet, P.; Toussaint, A.; Wagner, J.-F. Laser-Induced Breakdown Spectroscopy: A Tool for Analysis of Different Types of Liquids. Appl. Phys. A Mater. Sci. Process. 1999, 69, S591–S592. [Google Scholar] [CrossRef]
- Samek, O.; Beddows, D.C.S.; Kaiser, J.; Kukhlevsky, S.V.; Liska, M.; Telle, H.H.; Whitehouse, A.J. Application of Laser-Induced Breakdown Spectroscopy to In Situ Analysis of Liquid Samples. Opt. Eng. 2000, 39, 2248. [Google Scholar] [CrossRef]
- Lu, Y.; Li, Y.; Wu, J.; Zhong, S.; Zheng, R. Guided Conversion to Enhance Cation Detection in Water Using Laser-Induced Breakdown Spectroscopy. Appl. Opt. 2010, 49, C75. [Google Scholar] [CrossRef]
- Golik, S.S.; Ilyin, A.A.; Babiy, M.Y.; Biryukova, Y.S.; Lisitsa, V.V.; Bukin, O.A. Determination of Iron in Water Solution by Time-Resolved Femtosecond Laser-Induced Breakdown Spectroscopy. Plasma Sci. Technol. 2015, 17, 975–978. [Google Scholar] [CrossRef]
- Tolstonogova, Y.S.; Golik, S.S.; Mayor, A.Y.; Ilyin, A.A.; Proschenko, D.Y.; Bukin, O.A. Effect of Laser Pulse Repetition Rate on the Detection Limits of the Elemental Composition of Pollutants in Aqueous Solutions by Femtosecond Laser Induced Breakdown Spectroscopy. Atmos. Ocean. Opt. 2021, 34, 553–559. [Google Scholar] [CrossRef]
- Goueguel, C.; McIntyre, D.L.; Jain, J.; Karamalidis, A.K.; Carson, C. Matrix Effect of Sodium Compounds on the Determination of Metal Ions in Aqueous Solutions by Underwater Laser-Induced Breakdown Spectroscopy. Appl. Opt. 2015, 54, 6071. [Google Scholar] [CrossRef] [PubMed]
- Xiu, J.; Zhong, S.; Hou, H.; Lu, Y.; Zheng, R. Quantitative Determination of Manganese in Aqueous Solutions and Seawater by Laser-Induced Breakdown Spectroscopy (LIBS) Using Paper Substrates. Appl. Spectrosc. 2014, 68, 1039–1045. [Google Scholar] [CrossRef] [PubMed]
- Meneses-Nava, M.A.; Pichardo, J.; Rodriguez, M.; Rosas-Roman, I.; Maldonado, J.L. Detection Enhancement at Parts per Billion Level of Aluminum in Water Droplets by a Combination of Acoustic Levitation and Nanoparticle Enhanced Laser Induced Breakdown Spectroscopy. Spectrochim. Acta Part B At. Spectrosc. 2021, 184, 106280. [Google Scholar] [CrossRef]
- Cahoon, E.M.; Almirall, J.R. Quantitative Analysis of Liquids from Aerosols and Microdrops Using Laser Induced Breakdown Spectroscopy. Anal. Chem. 2012, 84, 2239–2244. [Google Scholar] [CrossRef] [PubMed]
- Zhang, D.C.; Hu, Z.Q.; Su, Y.B.; Hai, B.; Zhu, X.L.; Zhu, J.F.; Ma, X. Simple Method for Liquid Analysis by Laser-Induced Breakdown Spectroscopy (LIBS). Opt. Express 2018, 26, 18794. [Google Scholar] [CrossRef] [PubMed]
- Vander Wal, R.L.; Ticich, T.M.; West, J.R.; Householder, P.A. Trace Metal Detection by Laser-Induced Breakdown Spectroscopy. Appl. Spectrosc. 1999, 53, 1226–1236. [Google Scholar] [CrossRef]
- Sarkar, A.; Aggarwal, S.K.; Sasibhusan, K.; Alamelu, D. Determination of Sub—Ppm Levels of Boron in Ground Water Samples by Laser Induced Breakdown Spectroscopy. Microchim. Acta 2010, 168, 65–69. [Google Scholar] [CrossRef]
- Matsumoto, A.; Shimazu, Y.; Nakano, H.; Murakami, K.; Yae, S. Signal Stability of Surface-Enhanced Laser-Induced Breakdown Spectroscopy for Microdroplet Analysis Using a Porous Silicon Substrate. Spectrochim. Acta Part B At. Spectrosc. 2021, 178, 106143. [Google Scholar] [CrossRef]
- Schlatter, N.; Lottermoser, B.G. Quantitative Analysis of Li, Na, and K in Single Element Standard Solutions Using Portable Laser-Induced Breakdown Spectroscopy (pLIBS). GEEA 2023, 23, geochem2023-019. [Google Scholar] [CrossRef]
- Yang, X.; Yi, R.; Li, X.; Cui, Z.; Lu, Y.; Hao, Z.; Huang, J.; Zhou, Z.; Yao, G.; Huang, W. Spreading a Water Droplet through Filter Paper on the Metal Substrate for Surface-Enhanced Laser-Induced Breakdown Spectroscopy. Opt. Express 2018, 26, 30456. [Google Scholar] [CrossRef] [PubMed]
- Skrzeczanowski, W.; Długaszek, M. Application of Laser-Induced Breakdown Spectroscopy in the Quantitative Analysis of Elements—K, Na, Ca, and Mg in Liquid Solutions. Materials 2022, 15, 3736. [Google Scholar] [CrossRef] [PubMed]
- Kim, T.; Ricchia, M.L.; Lin, C.-T. Analysis of Copper in an Aqueous Solution by Ion-Exchange Concentrator and Laser-Induced Breakdown Spectroscopy. JNL Chin. Chem. Soc. 2010, 57, 829–835. [Google Scholar] [CrossRef]
- Schmidt, N.E.; Goode, S.R. Analysis of Aqueous Solutions by Laser-Induced Breakdown Spectroscopy of Ion Exchange Membranes. Appl. Spectrosc. 2002, 56, 370–374. [Google Scholar] [CrossRef]
- Chen, Z.; Godwal, Y.; Tsui, Y.Y.; Fedosejevs, R. Sensitive Detection of Metals in Water Using Laser-Induced Breakdown Spectroscopy on Wood Sample Substrates. Appl. Opt. 2010, 49, C87. [Google Scholar] [CrossRef]
- Ruiz, F.J.; Ripoll, L.; Hidalgo, M.; Canals, A. Dispersive Micro Solid-Phase Extraction (DµSPE) with Graphene Oxide as Adsorbent for Sensitive Elemental Analysis of Aqueous Samples by Laser Induced Breakdown Spectroscopy (LIBS). Talanta 2019, 191, 162–170. [Google Scholar] [CrossRef]
- Tian, H.; Jiao, L.; Dong, D. Rapid Determination of Trace Cadmium in Drinking Water Using Laser-Induced Breakdown Spectroscopy Coupled with Chelating Resin Enrichment. Sci. Rep. 2019, 9, 10443. [Google Scholar] [CrossRef]
- Zheng, P.; Ding, N.; Wang, J.; Zhao, H.; Liu, R.; Yang, Y. Separation and Determination of Cr and Cr in Aqueous Solution Using Laser-Induced Breakdown Spectroscopy Coupled with Resin Substrate Preconcentration. J. Anal. At. Spectrom. 2021, 36, 2631–2638. [Google Scholar] [CrossRef]
- Lin, Q.; Han, X.; Wang, J.; Wei, Z.; Liu, K.; Duan, Y. Ultra-Trace Metallic Element Detection in Liquid Samples Using Laser Induced Breakdown Spectroscopy Based on Matrix Conversion and Crosslinked PVA Polymer Membrane. J. Anal. At. Spectrom. 2016, 31, 1622–1630. [Google Scholar] [CrossRef]
- De Giacomo, A.; Koral, C.; Valenza, G.; Gaudiuso, R.; Dell’Aglio, M. Nanoparticle Enhanced Laser-Induced Breakdown Spectroscopy for Microdrop Analysis at Subppm Level. Anal. Chem. 2016, 88, 5251–5257. [Google Scholar] [CrossRef]
- Wu, M.; Wang, X.; Niu, G.; Zhao, Z.; Zheng, R.; Liu, Z.; Zhao, Z.; Duan, Y. Ultrasensitive and Simultaneous Detection of Multielements in Aqueous Samples Based on Biomimetic Array Combined with Laser-Induced Breakdown Spectroscopy. Anal. Chem. 2021, 93, 10196–10203. [Google Scholar] [CrossRef]
- Huang, J.-S.; Liu, H.-T.; Lin, K.-C. Laser-Induced Breakdown Spectroscopy in Analysis of Al3+ Liquid Droplets: On-Line Preconcentration by Use of Flow-Injection Manifold. Anal. Chim. Acta 2007, 581, 303–308. [Google Scholar] [CrossRef] [PubMed]
- Ripoll, L.; Hidalgo, M. Electrospray Deposition Followed by Laser-Induced Breakdown Spectroscopy (ESD-LIBS): A New Method for Trace Elemental Analysis of Aqueous Samples. J. Anal. At. Spectrom. 2019, 34, 2016–2026. [Google Scholar] [CrossRef]
- Chen, Z.; Li, H.; Zhao, F.; Li, R. Ultra-Sensitive Trace Metal Analysis of Water by Laser-Induced Breakdown Spectroscopy after Electrical-Deposition of the Analytes on an Aluminium Surface. J. Anal. At. Spectrom. 2008, 23, 871. [Google Scholar] [CrossRef]
- Kurniawan, K.H.; Pardede, M.; Hedwig, R.; Abdulmadjid, S.N.; Lahna, K.; Idris, N.; Jobiliong, E.; Suyanto, H.; Suliyanti, M.M.; Tjia, M.O.; et al. Practical and Highly Sensitive Elemental Analysis for Aqueous Samples Containing Metal Impurities Employing Electrodeposition on Indium-Tin Oxide Film Samples and Laser-Induced Shock Wave Plasma in Low-Pressure Helium Gas. Appl. Opt. 2015, 54, 7592. [Google Scholar] [CrossRef] [PubMed]
- Harun, H.A.; Zainal, R. Improvement of Laser Induced Breakdown Spectroscopy Signal for Sodium Chloride Solution. Mal. J. Fund. Appl. Sci. 2018, 14, 429–433. [Google Scholar] [CrossRef]
- Sobral, H.; Sanginés, R.; Trujillo-Vázquez, A. Detection of Trace Elements in Ice and Water by Laser-Induced Breakdown Spectroscopy. Spectrochim. Acta Part B At. Spectrosc. 2012, 78, 62–66. [Google Scholar] [CrossRef]
- Williams, A.N.; Phongikaroon, S. Elemental Detection of Cerium and Gadolinium in Aqueous Aerosol Using Laser-Induced Breakdown Spectroscopy. Appl. Spectrosc. 2016, 70, 1700–1708. [Google Scholar] [CrossRef]
- Ünal, S.; Yalçın, Ş. Development of a Continuous Flow Hydride Generation Laser-Induced Breakdown Spectroscopic System: Determination of Tin in Aqueous Environments. Spectrochim. Acta Part B At. Spectrosc. 2010, 65, 750–757. [Google Scholar] [CrossRef]
- Ezer, M.; Gondi, R.; Kennehan, E.; Simeonsson, J.B. Trace Determination of Germanium by Continuous Flow Hydride Generation Laser-Induced Fluorescence Spectrometry. Anal. Lett. 2019, 52, 1125–1137. [Google Scholar] [CrossRef]
- Bölek, D.; Ünal Yeşiller, S.; Yalçın, Ş. Determination of Arsenic by Hydride Generation—Laser-Induced Breakdown Spectroscopy: Characterization of Interelement Interferences. Anal. Lett. 2018, 51, 1605–1621. [Google Scholar] [CrossRef]
- Shao, Y.; Ma, S.; Zhao, X.; Tian, H.; Chen, S.; Dong, D.; Zhou, J. Determination of Phosphorus in Water Using Iron Hydroxide Assisted Laser-Induced Breakdown Spectroscopy. J. Anal. At. Spectrom. 2023, 38, 638–641. [Google Scholar] [CrossRef]
- Sui, M.; Fan, Y.; Jiang, L.; Xue, Y.; Zhou, J.; Zhong, S. Online Ultrasonic Nebulizer Assisted Laser Induced Breakdown Spectroscopy (OUN-LIBS): An Online Metal Elements Sensor for Marine Water Analysis. Spectrochim. Acta Part B At. Spectrosc. 2021, 180, 106201. [Google Scholar] [CrossRef]
- Rifai, K.; Laville, S.; Vidal, F.; Sabsabi, M.; Chaker, M. Quantitative Analysis of Metallic Traces in Water-Based Liquids by UV-IR Double-Pulse Laser-Induced Breakdown Spectroscopy. J. Anal. At. Spectrom. 2012, 27, 276–283. [Google Scholar] [CrossRef]
- Rifai, K.; Vidal, F.; Chaker, M.; Sabsabi, M. Resonant Laser-Induced Breakdown Spectroscopy (RLIBS) Analysis of Traces through Selective Excitation of Aluminum in Aluminum Alloys. J. Anal. At. Spectrom. 2013, 28, 388. [Google Scholar] [CrossRef]
- Kang, J.; Li, R.; Wang, Y.; Chen, Y.; Yang, Y. Ultrasensitive Detection of Trace Amounts of Lead in Water by LIBS-LIF Using a Wood-Slice Substrate as a Water Absorber. J. Anal. At. Spectrom. 2017, 32, 2292–2299. [Google Scholar] [CrossRef]
- Wang, Y.R.; Kang, J.; Chen, Y.Q.; Li, R.H. Sensitive Analysis of Copper in Water by LIBS–LIF Assisted by Simple Sample Pretreatment. J. Appl. Spectrosc. 2019, 86, 353–359. [Google Scholar] [CrossRef]
- Liu, K.; Tang, Z.; Zhou, R.; Zhang, W.; Li, Q.; Zhu, C.; He, C.; Liu, K.; Li, X. Determination of Lead in Aqueous Solutions Using Resonant Surface-Enhanced LIBS. J. Anal. At. Spectrom. 2021, 36, 2480–2484. [Google Scholar] [CrossRef]
- Singh, J.P.; Thakur, S.N. Laser-Induced Breakdown Spectroscopy; Elsevier: Amsterdam, The Netherlands, 2020; ISBN 978-0-12-818830-9. [Google Scholar]
- Musazzi, S.; Perini, U. Laser-Induced Breakdown Spectroscopy: Theory and Applications, 1st ed.; Springer Series in Optical Sciences; Springer: Berlin/Heidelberg, Germany, 2014; ISBN 978-3-642-45084-6. [Google Scholar]
- Scott, J.R.; Effenberger, A.J.; Hatch, J.J. Influence of Atmospheric Pressure and Composition on LIBS. In Laser-Induced Breakdown Spectroscopy; Musazzi, S., Perini, U., Eds.; Springer Series in Optical Sciences; Springer: Berlin/Heidelberg, Germany, 2014; pp. 91–116. ISBN 978-3-642-45084-6. [Google Scholar]
- Golik, S.S.; Bukin, O.A.; Il’in, A.A.; Sokolova, E.B.; Kolesnikov, A.V.; Babiy, M.Y.; Kul’chin, Y.N.; Gal’chenko, A.A. Determination of Detection Limits for Elements in Water by Femtosecond Laser-Induced Breakdown Spectroscopy. J. Appl. Spectrosc. 2012, 79, 471–476. [Google Scholar] [CrossRef]
- Andrade, D.F.; Sperança, M.A.; Pereira-Filho, E.R. Different Sample Preparation Methods for the Analysis of Suspension Fertilizers Combining LIBS and Liquid-to-Solid Matrix Conversion: Determination of Essential and Toxic Elements. Anal. Methods 2017, 9, 5156–5164. [Google Scholar] [CrossRef]
- Mermet, J.-M. Calibration in Atomic Spectrometry: A Tutorial Review Dealing with Quality Criteria, Weighting Procedures and Possible Curvatures. Spectrochim. Acta Part B At. Spectrosc. 2010, 65, 509–523. [Google Scholar] [CrossRef]
- Cong, Z.; Sun, L.; Xin, Y.; Li, Y.; Qi, L. Comparison of Calibration Curve Method and Partial Least Square Method in the Laser Induced Breakdown Spectroscopy Quantitative Analysis. JCC 2013, 1, 14–18. [Google Scholar] [CrossRef]
- Fu, H.; Jia, J.; Wang, H.; Ni, Z.; Dong, F. Calibration Methods of Laser-Induced Breakdown Spectroscopy. In Calibration and Validation of Analytical Methods—A Sampling of Current Approaches; Stauffer, M.T., Ed.; InTech: London, UK, 2018; ISBN 978-1-78923-084-0. [Google Scholar]
- Babos, D.V.; Virgilio, A.; Costa, V.C.; Donati, G.L.; Pereira-Filho, E.R. Multi-Energy Calibration (MEC) Applied to Laser-Induced Breakdown Spectroscopy (LIBS). J. Anal. At. Spectrom. 2018, 33, 1753–1762. [Google Scholar] [CrossRef]
- Donati, G.L.; Amais, R.S. Fundamentals and New Approaches to Calibration in Atomic Spectrometry. J. Anal. At. Spectrom. 2019, 34, 2353–2369. [Google Scholar] [CrossRef]
- Costa, V.; Babos, D.; Castro, J.; Andrade, D.; Gamela, R.; Machado, R.; Sperança, M.; Araújo, A.; Garcia, J.; Pereira-Filho, E. Calibration Strategies Applied to Laser-Induced Breakdown Spectroscopy: A Critical Review of Advances and Challenges. J. Braz. Chem. Soc. 2021, 31, 2439–2451. [Google Scholar] [CrossRef]
- Poggialini, F.; Campanella, B.; Cocciaro, B.; Lorenzetti, G.; Palleschi, V.; Legnaioli, S. Catching up on Calibration-Free LIBS. J. Anal. At. Spectrom. 2023, 38, 1751–1771. [Google Scholar] [CrossRef]
- Aberkane, S.M.; Melikechi, N.; Yahiaoui, K. LIBS Spectral Treatment. In Chemometrics and Numerical Methods in LIBS; Palleschi, V., Ed.; Wiley: Hoboken, NJ, USA, 2022; pp. 47–80. ISBN 978-1-119-75961-4. [Google Scholar]
- Palleschi, V. Chemometrics and Numerical Methods in LIBS, 1st ed.; Wiley: Hoboken, NJ, USA, 2022; ISBN 978-1-119-75961-4. [Google Scholar]
- Wang, Z.; Afgan, M.S.; Gu, W.; Song, Y.; Wang, Y.; Hou, Z.; Song, W.; Li, Z. Recent Advances in Laser-Induced Breakdown Spectroscopy Quantification: From Fundamental Understanding to Data Processing. TrAC Trends Anal. Chem. 2021, 143, 116385. [Google Scholar] [CrossRef]
- Yi, R.; Guo, L.; Li, C.; Yang, X.; Li, J.; Li, X.; Zeng, X.; Lu, Y. Investigation of the Self-Absorption Effect Using Spatially Resolved Laser-Induced Breakdown Spectroscopy. J. Anal. At. Spectrom. 2016, 31, 961–967. [Google Scholar] [CrossRef]
- de Oliveira Borges, F.; Ospina, J.U.; de Holanda Cavalcanti, G.; Farias, E.E.; Rocha, A.A.; Ferreira, P.I.L.B.; Gomes, G.C.; Mello, A. CF-LIBS Analysis of Frozen Aqueous Solution Samples by Using a Standard Internal Reference and Correcting the Self-Absorption Effect. J. Anal. At. Spectrom. 2018, 33, 629–641. [Google Scholar] [CrossRef]
- Tang, Y.; Ma, S.; Chu, Y.; Wu, T.; Ma, Y.; Hu, Z.; Guo, L.; Zeng, X.; Duan, J.; Lu, Y. Investigation of the Self-Absorption Effect Using Time-Resolved Laser-Induced Breakdown Spectroscopy. Opt. Express 2019, 27, 4261. [Google Scholar] [CrossRef]
- Hou, J.; Zhang, L.; Zhao, Y.; Wang, Z.; Zhang, Y.; Ma, W.; Dong, L.; Yin, W.; Xiao, L.; Jia, S. Mechanisms and Efficient Elimination Approaches of Self-Absorption in LIBS. Plasma Sci. Technol. 2019, 21, 034016. [Google Scholar] [CrossRef]
- Rezaei, F.; Cristoforetti, G.; Tognoni, E.; Legnaioli, S.; Palleschi, V.; Safi, A. A Review of the Current Analytical Approaches for Evaluating, Compensating and Exploiting Self-Absorption in Laser Induced Breakdown Spectroscopy. Spectrochim. Acta Part B At. Spectrosc. 2020, 169, 105878. [Google Scholar] [CrossRef]
- Contreras, V.; Valencia, R.; Peralta, J.; Sobral, H.; Meneses-Nava, M.A.; Martinez, H. Chemical Elemental Analysis of Single Acoustic-Levitated Water Droplets by Laser-Induced Breakdown Spectroscopy. Opt. Lett. 2018, 43, 2260. [Google Scholar] [CrossRef]
- Ma, S.; Tang, Y.; Ma, Y.; Chen, F.; Zhang, D.; Dong, D.; Wang, Z.; Guo, L. Stability and Accuracy Improvement of Elements in Water Using LIBS with Geometric Constraint Liquid-to-Solid Conversion. J. Anal. At. Spectrom. 2020, 35, 967–971. [Google Scholar] [CrossRef]
- Ahlawat, S.; Mukhopadhyay, P.K.; Singh, R.; Dixit, S.K.; Bindra, K.S. Laser Textured Superhydrophilic Silicon for Uniform Solidification and Sensitive Detection of Water Based Samples Using Laser Induced Breakdown Spectroscopy. J. Anal. At. Spectrom. 2023, 38, 883–892. [Google Scholar] [CrossRef]
- Cremers, D.A.; Chinni, R.C. Laser-Induced Breakdown Spectroscopy—Capabilities and Limitations. Appl. Spectrosc. Rev. 2009, 44, 457–506. [Google Scholar] [CrossRef]
- Wise, M.A.; Harmon, R.S.; Curry, A.; Jennings, M.; Grimac, Z.; Khashchevskaya, D. Handheld LIBS for Li Exploration: An Example from the Carolina Tin-Spodumene Belt, USA. Minerals 2022, 12, 77. [Google Scholar] [CrossRef]
- Pourret, O.; Hursthouse, A. It’s Time to Replace the Term “Heavy Metals” with “Potentially Toxic Elements” When Reporting Environmental Research. Int. J. Environ. Res. Public Health 2019, 16, 4446. [Google Scholar] [CrossRef] [PubMed]
- Rai, N.K.; Rai, A.K.; Kumar, A.; Thakur, S.N. Detection Sensitivity of Laser-Induced Breakdown Spectroscopy for Cr II in Liquid Samples. Appl. Opt. 2008, 47, G105. [Google Scholar] [CrossRef]
- Haider, A.F.M.Y.; Parvin, M.; Khan, Z.H.; Wahadoszamen, M. Highly Sensitive Detection of Lead in Aqueous Solution Using Laser-Induced Breakdown Spectroscopy Coupled with Adsorption Technique. J. Appl. Spectrosc. 2021, 87, 1163–1170. [Google Scholar] [CrossRef]
- Ma, S.; Tang, Y.; Zhang, S.; Ma, Y.; Sheng, Z.; Wang, Z.; Guo, L.; Yao, J.; Lu, Y. Chlorine and Sulfur Determination in Water Using Indirect Laser-Induced Breakdown Spectroscopy. Talanta 2020, 214, 120849. [Google Scholar] [CrossRef]
- Ma, S.; Guo, L.; Dong, D. A Molecular Laser-Induced Breakdown Spectroscopy Technique for the Detection of Nitrogen in Water. J. Anal. At. Spectrom. 2022, 37, 663–667. [Google Scholar] [CrossRef]
- Asimellis, G.; Hamilton, S.; Giannoudakos, A.; Kompitsas, M. Controlled Inert Gas Environment for Enhanced Chlorine and Fluorine Detection in the Visible and Near-Infrared by Laser-Induced Breakdown Spectroscopy. Spectrochim. Acta Part B At. Spectrosc. 2005, 60, 1132–1139. [Google Scholar] [CrossRef]
- Ramli, M.; Khumaeni, A.; Kurniawan, K.H.; Tjia, M.O.; Kagawa, K. Spectrochemical Analysis of Cs in Water and Soil Using Low Pressure Laser Induced Breakdown Spectroscopy. Spectrochim. Acta Part B At. Spectrosc. 2017, 132, 8–12. [Google Scholar] [CrossRef]
- Ruas, A.; Matsumoto, A.; Ohba, H.; Akaoka, K.; Wakaida, I. Application of Laser-Induced Breakdown Spectroscopy to Zirconium in Aqueous Solution. Spectrochim. Acta Part B At. Spectrosc. 2017, 131, 99–106. [Google Scholar] [CrossRef]
- Shimazu, Y.; Matsumoto, A.; Nakano, H.; Yae, S. Sensitive Quantitative Analysis of Strontium in Microdroplet by Surfaceenhanced Laser-Induced Breakdown Spectroscopy Using Porous Silicon 2021. Anal. Sci. 2021, 37, 1839–1841. [Google Scholar] [CrossRef]
- Wakil, M.A.; Alwahabi, Z.T. Quantitative Fluorine and Bromine Detection under Ambient Conditions via Molecular Emission. J. Anal. At. Spectrom. 2020, 35, 2620–2626. [Google Scholar] [CrossRef]
- Bol’shakov, A.A.; Pandey, S.J.; Mao, X.; Liu, C. Analysis of Liquid Petroleum Using a Laser-Induced Breakdown Spectroscopy Instrument. Spectrochim. Acta Part B At. Spectrosc. 2021, 179, 106094. [Google Scholar] [CrossRef]
- Pochon, A.; Desaulty, A.-M.; Bailly, L. Handheld Laser-Induced Breakdown Spectroscopy (LIBS) as a Fast and Easy Method to Trace Gold. J. Anal. At. Spectrom. 2020, 35, 254–264. [Google Scholar] [CrossRef]
- Lawley, C.J.M.; Somers, A.M.; Kjarsgaard, B.A. Rapid Geochemical Imaging of Rocks and Minerals with Handheld Laser Induced Breakdown Spectroscopy (LIBS). J. Geochem. Explor. 2021, 222, 106694. [Google Scholar] [CrossRef]
- Fabre, C.; Ourti, N.E.; Ballouard, C.; Mercadier, J.; Cauzid, J. Handheld LIBS Analysis for in Situ Quantification of Li and Detection of the Trace Elements (Be, Rb and Cs). J. Geochem. Explor. 2022, 236, 106979. [Google Scholar] [CrossRef]
- Aguirre, M.A.; Legnaioli, S.; Almodóvar, F.; Hidalgo, M.; Palleschi, V.; Canals, A. Elemental Analysis by Surface-Enhanced Laser-Induced Breakdown Spectroscopy Combined with Liquid–Liquid Microextraction. Spectrochim. Acta Part B At. Spectrosc. 2013, 79–80, 88–93. [Google Scholar] [CrossRef]
- Aguirre, M.A.; Nikolova, H.; Hidalgo, M.; Canals, A. Hyphenation of Single-Drop Microextraction with Laser-Induced Breakdown Spectrometry for Trace Analysis in Liquid Samples: A Viability Study. Anal. Methods 2015, 7, 877–883. [Google Scholar] [CrossRef]
- Alamelu, D.; Sarkar, A.; Aggarwal, S.K. Laser-Induced Breakdown Spectroscopy for Simultaneous Determination of Sm, Eu and Gd in Aqueous Solution. Talanta 2008, 77, 256–261. [Google Scholar] [CrossRef]
- Aras, N.; Yalçın, Ş. Development and Validation of a Laser-Induced Breakdown Spectroscopic Method for Ultra-Trace Determination of Cu, Mn, Cd and Pb Metals in Aqueous Droplets after Drying. Talanta 2016, 149, 53–61. [Google Scholar] [CrossRef]
- Archontaki, H.A.; Crouch, S.R. Evaluation of an Isolated Droplet Sample Introduction System for Laser-Induced Breakdown Spectroscopy. Appl. Spectrosc. 1988, 42, 741–746. [Google Scholar] [CrossRef]
- Bae, D.; Nam, S.-H.; Han, S.-H.; Yoo, J.; Lee, Y. Spreading a Water Droplet on the Laser-Patterned Silicon Wafer Substrate for Surface-Enhanced Laser-Induced Breakdown Spectroscopy. Spectrochim. Acta Part B At. Spectrosc. 2015, 113, 70–78. [Google Scholar] [CrossRef]
- Bhatt, C.R.; Jain, J.C.; Goueguel, C.L.; McIntyre, D.L.; Singh, J.P. Measurement of Eu and Yb in Aqueous Solutions by Underwater Laser Induced Breakdown Spectroscopy. Spectrochim. Acta Part B At. Spectrosc. 2017, 137, 8–12. [Google Scholar] [CrossRef]
- Bhatt, C.R.; Hartzler, D.; Jain, J.; McIntyre, D.L. Determination of As, Hg, S, and Se in Liquid Jets by Laser-Based Optical Diagnostic Technique. Appl. Phys. B 2021, 127, 8. [Google Scholar] [CrossRef]
- Bocková, J.; Tian, Y.; Yin, H.; Delepine-Gilon, N.; Chen, Y.; Veis, P.; Yu, J. Determination of Metal Elements in Wine Using Laser-Induced Breakdown Spectroscopy (LIBS). Appl. Spectrosc. 2017, 71, 1750–1759. [Google Scholar] [CrossRef]
- Bukhari, M.; Awan, M.A.; Qazi, I.A.; Baig, M.A. Development of a Method for the Determination of Chromium and Cadmium in Tannery Wastewater Using Laser-Induced Breakdown Spectroscopy. J. Anal. Methods Chem. 2012, 2012, 823016. [Google Scholar] [CrossRef] [PubMed]
- Cáceres, J.O.; Tornero López, J.; Telle, H.H.; González Ureña, A. Quantitative Analysis of Trace Metal Ions in Ice Using Laser-Induced Breakdown Spectroscopy. Spectrochim. Acta Part B At. Spectrosc. 2001, 56, 831–838. [Google Scholar] [CrossRef]
- Carvalho, A.A.C.; Silvestre, D.M.; Leme, F.O.; Naozuka, J.; Intima, D.P.; Nomura, C.S. Feasibility of Measuring Cr(III) and Cr(VI) in Water by Laser-Induced Breakdown Spectroscopy Using Ceramics as the Solid Support. Microchem. J. 2019, 144, 33–38. [Google Scholar] [CrossRef]
- Charfi, B.; Harith, M.A. Panoramic Laser-Induced Breakdown Spectrometry of Water. Spectrochim. Acta Part B At. Spectrosc. 2002, 57, 1141–1153. [Google Scholar] [CrossRef]
- Chen, C.; Niu, G.; Shi, Q.; Lin, Q.; Duan, Y. Laser-Induced Breakdown Spectroscopy Technique for Quantitative Analysis of Aqueous Solution Using Matrix Conversion Based on Plant Fiber Spunlaced Nonwovens. Appl. Opt. 2015, 54, 8318. [Google Scholar] [CrossRef] [PubMed]
- Cheri, M.S.; Tavassoli, S.H. Quantitative Analysis of Toxic Metals Lead and Cadmium in Water Jet by Laser-Induced Breakdown Spectroscopy. Appl. Opt. 2011, 50, 1227. [Google Scholar] [CrossRef]
- de Jesus, A.M.D.; Aguirre, M.Á.; Hidalgo, M.; Canals, A.; Pereira-Filho, E.R. The Determination of V and Mo by Dispersive Liquid–Liquid Microextraction (DLLME) Combined with Laser-Induced Breakdown Spectroscopy (LIBS). J. Anal. At. Spectrom. 2014, 29, 1813–1818. [Google Scholar] [CrossRef]
- Fang, X.; Ahmad, S.R. Detection of Mercury in Water by Laser-Induced Breakdown Spectroscopy with Sample Pre-Concentration. Appl. Phys. B 2012, 106, 453–456. [Google Scholar] [CrossRef]
- Fichet, P.; Mauchien, P.; Wagner, J.-F.; Moulin, C. Quantitative Elemental Determination in Water and Oil by Laser Induced Breakdown Spectroscopy. Anal. Chim. Acta 2001, 429, 269–278. [Google Scholar] [CrossRef]
- Fichet, P.; Tabarant, M.; Salle, B.; Gautier, C. Comparisons between LIBS and ICP/OES. Anal. Bioanal. Chem. 2006, 385, 338–344. [Google Scholar] [CrossRef]
- Gaubeur, I.; Aguirre, M.A.; Kovachev, N.; Hidalgo, M.; Canals, A. Dispersive Liquid–Liquid Microextraction Combined with Laser-Induced Breakdown Spectrometry and Inductively Coupled Plasma Optical Emission Spectrometry to Elemental Analysis. Microchem. J. 2015, 121, 219–226. [Google Scholar] [CrossRef]
- Gaubeur, I.; Aguirre, M.Á.; Kovachev, N.; Hidalgo, M.; Canals, A. Speciation of Chromium by Dispersive Liquid–Liquid Microextraction Followed by Laser-Induced Breakdown Spectrometry Detection (DLLME–LIBS). J. Anal. At. Spectrom. 2015, 30, 2541–2547. [Google Scholar] [CrossRef]
- Godwal, Y.; Kaigala, G.; Hoang, V.; Lui, S.-L.; Backhouse, C.; Tsui, Y.; Fedosejevs, R. Elemental Analysis Using Micro Laser-Induced Breakdown Spectroscopy (ΜLIBS) in a Microfluidic Platform. Opt. Express 2008, 16, 12435. [Google Scholar] [CrossRef]
- Goueguel, C.; Singh, J.P.; McIntyre, D.L.; Jain, J.; Karamalidis, A.K. Effect of Sodium Chloride Concentration on Elemental Analysis of Brines by Laser-Induced Breakdown Spectroscopy (LIBS). Appl. Spectrosc. 2014, 68, 213–221. [Google Scholar] [CrossRef] [PubMed]
- Groh, S.; Diwakar, P.K.; Garcia, C.C.; Murtazin, A.; Hahn, D.W.; Niemax, K. 100% Efficient Sub-Nanoliter Sample Introduction in Laser-Induced Breakdown Spectroscopy and Inductively Coupled Plasma Spectrometry: Implications for Ultralow Sample Volumes. Anal. Chem. 2010, 82, 2568–2573. [Google Scholar] [CrossRef] [PubMed]
- Haider, A.F.M.Y.; Hedayet Ullah, M.; Khan, Z.H.; Kabir, F.; Abedin, K.M. Detection of Trace Amount of Arsenic in Groundwater by Laser-Induced Breakdown Spectroscopy and Adsorption. Opt. Laser Technol. 2014, 56, 299–303. [Google Scholar] [CrossRef]
- Hartzler, D.A.; Jain, J.C.; McIntyre, D.L. Development of a Subsurface LIBS Sensor for in Situ Groundwater Quality Monitoring with Applications in CO2 Leak Sensing in Carbon Sequestration. Sci. Rep. 2019, 9, 4430. [Google Scholar] [CrossRef]
- Huang, J.-S.; Ke, C.-B.; Huang, L.-S.; Lin, K.-C. The Correlation between Ion Production and Emission Intensity in the Laser-Induced Breakdown Spectroscopy of Liquid Droplets. Spectrochim. Acta Part B At. Spectrosc. 2002, 57, 35–48. [Google Scholar] [CrossRef]
- Huang, J.-S.; Ke, C.-B.; Lin, K.-C. Matrix Effect on Emission/Current Correlated Analysis in Laser-Induced Breakdown Spectroscopy of Liquid Droplets. Spectrochim. Acta Part B At. Spectrosc. 2004, 59, 321–326. [Google Scholar] [CrossRef]
- Huang, J.-S.; Lin, K.-C. Laser-Induced Breakdown Spectroscopy of Liquid Droplets: Correlation Analysis with Plasma-Induced Current versus Continuum Background. J. Anal. At. Spectrom. 2005, 20, 53. [Google Scholar] [CrossRef]
- Huang, L.; Yao, M.; Xu, Y.; Liu, M. Determination of Cr in Water Solution by Laser-Induced Breakdown Spectroscopy with Different Univariate Calibration Models. Appl. Phys. B 2013, 111, 45–51. [Google Scholar] [CrossRef]
- Janzen, C.; Fleige, R.; Noll, R.; Schwenke, H.; Lahmann, W.; Knoth, J.; Beaven, P.; Jantzen, E.; Oest, A.; Koke, P. Analysis of Small Droplets with a New Detector for Liquid Chromatography Based on Laser-Induced Breakdown Spectroscopy. Spectrochim. Acta Part B At. Spectrosc. 2005, 60, 993–1001. [Google Scholar] [CrossRef]
- Järvinen, S.T.; Saarela, J.; Toivonen, J. Detection of Zinc and Lead in Water Using Evaporative Preconcentration and Single-Particle Laser-Induced Breakdown Spectroscopy. Spectrochim. Acta Part B At. Spectrosc. 2013, 86, 55–59. [Google Scholar] [CrossRef]
- Järvinen, S.T.; Saari, S.; Keskinen, J.; Toivonen, J. Detection of Ni, Pb and Zn in Water Using Electrodynamic Single-Particle Levitation and Laser-Induced Breakdown Spectroscopy. Spectrochim. Acta Part B At. Spectrosc. 2014, 99, 9–14. [Google Scholar] [CrossRef]
- Jiang, L.; Sui, M.; Fan, Y.; Su, H.; Xue, Y.; Zhong, S. Micro-Gas Column Assisted Laser Induced Breakdown Spectroscopy (MGC-LIBS): A Metal Elements Detection Method for Bulk Water in-Situ Analysis. Spectrochim. Acta Part B At. Spectrosc. 2021, 177, 106065. [Google Scholar] [CrossRef]
- Jijón, D.; Costa, C. Pencil Lead Scratches on Steel Surfaces as a Substrate for LIBS Analysis of Dissolved Salts in Liquids. J. Phys. Conf. Ser. 2011, 274, 012077. [Google Scholar] [CrossRef]
- Jijon, D. Laser-induced Breakdown Spectroscopy Analysis of Dried Liquids on Solid Surfaces. Opt. Pura Apl. 2012, 45, 475–484. [Google Scholar] [CrossRef]
- Kumar, A.; Yueh, F.Y.; Miller, T.; Singh, J.P. Detection of Trace Elements in Liquids by Laser-Induced Breakdown Spectroscopy with a Meinhard Nebulizer. Appl. Opt. 2003, 42, 6040. [Google Scholar] [CrossRef]
- Lee, D.-H.; Han, S.-C.; Kim, T.-H.; Yun, J.-I. Highly Sensitive Analysis of Boron and Lithium in Aqueous Solution Using Dual-Pulse Laser-Induced Breakdown Spectroscopy. Anal. Chem. 2011, 83, 9456–9461. [Google Scholar] [CrossRef]
- Lee, Y.; Oh, S.-W.; Han, S.-H. Laser-Induced Breakdown Spectroscopy (LIBS) of Heavy Metal Ions at the Sub-Parts per Million Level in Water. Appl. Spectrosc. 2012, 66, 1385–1396. [Google Scholar] [CrossRef]
- Lin, J.; Yang, J.; Gao, X.; Huang, Y.; Lin, X. The Effect of Solution Temperature on the Quantitative Analysis of Laser-Induced Breakdown Spectroscopy. Appl. Phys. B 2022, 128, 127. [Google Scholar] [CrossRef]
- Liu, X.; Lin, Q.; Tian, Y.; Liao, W.; Yang, T.; Qian, C.; Zhang, T.; Duan, Y. Metal-Chelate Induced Nanoparticle Aggregation Enhanced Laser-Induced Breakdown Spectroscopy for Ultra-Sensitive Detection of Trace Metal Ions in Liquid Samples. J. Anal. At. Spectrom. 2020, 35, 188–197. [Google Scholar] [CrossRef]
- Liu, Y.; Pan, J.; Hu, Z.; Chu, Y.; Khan, M.S.; Tang, K.; Guo, L.; Lau, C. Stability Improvement for Dried Droplet Pretreatment by Suppression of Coffee Ring Effect Using Electrochemical Anodized Nanoporous Tin Dioxide Substrate. Microchim. Acta 2020, 187, 664. [Google Scholar] [CrossRef] [PubMed]
- Loudyi, H.; Rifaï, K.; Laville, S.; Vidal, F.; Chaker, M.; Sabsabi, M. Improving Laser-Induced Breakdown Spectroscopy (LIBS) Performance for Iron and Lead Determination in Aqueous Solutions with Laser-Induced Fluorescence (LIF). J. Anal. At. Spectrom. 2009, 24, 1421. [Google Scholar] [CrossRef]
- Méndez-López, C.; Fernández-Menéndez, L.J.; González-Gago, C.; Pisonero, J.; Bordel, N. Nebulization Assisted Molecular LIBS for Sensitive and Fast Fluorine Determination in Aqueous Solutions. J. Anal. At. Spectrom. 2023, 38, 80–89. [Google Scholar] [CrossRef]
- Metzinger, A.; Kovács-Széles, É.; Almási, I.; Galbács, G. An Assessment of the Potential of Laser-Induced Breakdown Spectroscopy (LIBS) for the Analysis of Cesium in Liquid Samples of Biological Origin. Appl. Spectrosc. 2014, 68, 789–793. [Google Scholar] [CrossRef]
- Niu, S.; Zheng, L.; Qayyum Khan, A.; Zeng, H. Laser-Induced Breakdown Spectroscopic (LIBS) Analysis of Trace Heavy Metals Enriched by Al 2 O 3 Nanoparticles. Appl. Spectrosc. 2019, 73, 380–386. [Google Scholar] [CrossRef]
- Papai, R.; da Silva Mariano, C.; Pereira, C.V.; Ferreira da Costa, P.V.; de Oliveira Leme, F.; Nomura, C.S.; Gaubeur, I. Matte Photographic Paper as a Low-Cost Material for Metal Ion Retention and Elemental Measurements with Laser-Induced Breakdown Spectroscopy. Talanta 2019, 205, 120167. [Google Scholar] [CrossRef]
- Pearman, W.; Scaffidi, J.; Angel, S.M. Dual-Pulse Laser-Induced Breakdown Spectroscopy in Bulk Aqueous Solution with an Orthogonal Beam Geometry. Appl. Opt. 2003, 42, 6085. [Google Scholar] [CrossRef]
- Poggialini, F.; Campanella, B.; Palleschi, V.; Hidalgo, M.; Legnaioli, S. Graphene Thin Film Microextraction and Nanoparticle Enhancement for Fast LIBS Metal Trace Analysis in Liquids. Spectrochim. Acta Part B At. Spectrosc. 2022, 194, 106471. [Google Scholar] [CrossRef]
- Popov, A.M.; Drozdova, A.N.; Zaytsev, S.M.; Biryukova, D.I.; Zorov, N.B.; Labutin, T.A. Rapid, Direct Determination of Strontium in Natural Waters by Laser-Induced Breakdown Spectroscopy. J. Anal. At. Spectrom. 2016, 31, 1123–1130. [Google Scholar] [CrossRef]
- Raimundo, I.M.; Michael Angel, S.; Colón, A.M. Detection of Low Lithium Concentrations Using Laser-Induced Breakdown Spectroscopy (LIBS) in High-Pressure and High-Flow Conditions. Appl. Spectrosc. 2021, 75, 1374–1381. [Google Scholar] [CrossRef] [PubMed]
- Rezk, R.A.; Galmed, A.H.; Abdelkreem, M.; Ghany, N.A.A.; Harith, M.A. Quantitative Analysis of Cu and Co Adsorbed on Fish Bones via Laser-Induced Breakdown Spectroscopy. Opt. Laser Technol. 2016, 83, 131–139. [Google Scholar] [CrossRef]
- Sarkar, A.; Alamelu, D.; Aggarwal, S.K. Gallium Quantification in Solution by LIBS in the Presence of Bulk Uranium. Opt. Laser Technol. 2012, 44, 30–34. [Google Scholar] [CrossRef]
- Sarkar, A.; Alamelu, D.; Aggarwal, S.K. Determination of Thorium and Uranium in Solution by Laser-Induced Breakdown Spectrometry. Appl. Opt. 2008, 47, G58. [Google Scholar] [CrossRef]
- Sawaf, S.; Tawfik, W. Analysis of Heavy Elements in Water with High Sensitivity Using Laser Induced Breakdown Spectroscopy. Optoelectron. Adv. Mater.-Rapid Commun. 2014, 8, 414–417. [Google Scholar]
- Sheng, P.; Jiang, L.; Sui, M.; Zhong, S. Micro-Hole Array Sprayer-Assisted Laser-Induced Breakdown Spectroscopy Technology and Its Application in the Field of Sea Water Analysis. Spectrochim. Acta Part B At. Spectrosc. 2019, 154, 1–9. [Google Scholar] [CrossRef]
- Shi, Q.; Niu, G.; Lin, Q.; Wang, X.; Wang, J.; Bian, F.; Duan, Y. Exploration of a 3D Nano-Channel Porous Membrane Material Combined with Laser-Induced Breakdown Spectrometry for Fast and Sensitive Heavy Metal Detection of Solution Samples. J. Anal. At. Spectrom. 2014, 29, 2302–2308. [Google Scholar] [CrossRef]
- Simeonsson, J.B.; Williamson, L.J. Characterization of Laser Induced Breakdown Plasmas Used for Measurements of Arsenic, Antimony and Selenium Hydrides. Spectrochim. Acta Part B At. Spectrosc. 2011, 66, 754–760. [Google Scholar] [CrossRef]
- Singh, M.; Sarkar, A. Analytical Evaluation of Cesium Emission Lines Using Laser-Induced Breakdown Spectroscopy. Pramana-J. Phys. 2019, 93, 2. [Google Scholar] [CrossRef]
- Skrzeczanowski, W.; Długaszek, M. Al and Si Quantitative Analysis in Aqueous Solutions by LIBS Method. Talanta 2021, 225, 121916. [Google Scholar] [CrossRef] [PubMed]
- Tian, H.; Li, C.; Jiao, L.; Zhao, X.; Dong, D. Study on Rapid Detection Method of Water Heavy Metals by Laser-Induced Breakdown Spectroscopy Coupled with Liquid-Solid Conversion and Morphological Constraints. In Proceedings of the International Conference on Optoelectronic Materials and Devices (ICOMD 2021), Guangzhou, China, 16 February 2022; Lu, Y., Gu, Y., Chen, S., Eds.; SPIE: Bellingham, WA, USA, 2022; p. 44. [Google Scholar]
- Wakil, M.A.; Alwahabi, Z.T. Microwave-Assisted Laser Induced Breakdown Molecular Spectroscopy: Quantitative Chlorine Detection. J. Anal. At. Spectrom. 2019, 34, 1892–1899. [Google Scholar] [CrossRef]
- Wall, M.; Sun, Z.; Alwahabi, Z.T. Quantitative Detection of Metallic Traces in Water-Based Liquids by Microwave-Assisted Laser-Induced Breakdown Spectroscopy. Opt. Express 2016, 24, 1507. [Google Scholar] [CrossRef] [PubMed]
- Wang, X.; Shi, L.; Lin, Q.; Zhu, X.; Duan, Y. Simultaneous and Sensitive Analysis of Ag(i), Mn(ii), and Cr(iii) in Aqueous Solution by LIBS Combined with Dispersive Solid Phase Micro-Extraction Using Nano-Graphite as an Adsorbent. J. Anal. At. Spectrom. 2014, 29, 1098. [Google Scholar] [CrossRef]
- Wang, X.; Wei, Y.; Lin, Q.; Zhang, J.; Duan, Y. Simple, Fast Matrix Conversion and Membrane Separation Method for Ultrasensitive Metal Detection in Aqueous Samples by Laser-Induced Breakdown Spectroscopy. Anal. Chem. 2015, 87, 5577–5583. [Google Scholar] [CrossRef]
- Wang, Z.Z.; Yan, J.J.; Liu, J.P.; Deguchi, Y.; Katsumori, S.; Ikutomo, A. Sensitive Cesium Measurement in Liquid Sample Using Low-Pressure Laser-Induced Breakdown Spectroscopy. Spectrochim. Acta Part B At. Spectrosc. 2015, 114, 74–80. [Google Scholar] [CrossRef]
- Wang, Q.; Liu, Y.; Jiang, L.; Chen, A.; Han, J.; Jin, M. Metal Micro/Nanostructure Enhanced Laser-Induced Breakdown Spectroscopy. Anal. Chim. Acta 2023, 1241, 340802. [Google Scholar] [CrossRef]
- Wen, X.; Lin, Q.; Niu, G.; Shi, Q.; Duan, Y. Emission Enhancement of Laser-Induced Breakdown Spectroscopy for Aqueous Sample Analysis Based on Au Nanoparticles and Solid-Phase Substrate. Appl. Opt. 2016, 55, 6706. [Google Scholar] [CrossRef]
- Wen, X.; Hu, Z.; Nie, J.; Gao, Z.; Zhang, D.; Guo, L.; Ma, S.; Dong, D. Detection of Lead in Water at Ppt Levels Using Resin-Enrichment Combined with LIBS-LIF. J. Anal. At. Spectrom. 2023, 38, 1108–1115. [Google Scholar] [CrossRef]
- Wu, K.; Shen, J.; Cao, D.; Cheng, H.; Sun, S.; Hu, B. Coulombic Effect of Amphiphiles with Metal Nanoparticles on Laser-Induced Breakdown Spectroscopy Enhancement. J. Phys. Chem. C 2018, 122, 19133–19138. [Google Scholar] [CrossRef]
- Xing, P.; Dong, J.; Yu, P.; Zheng, H.; Liu, X.; Hu, S.; Zhu, Z. Quantitative Analysis of Lithium in Brine by Laser-Induced Breakdown Spectroscopy Based on Convolutional Neural Network. Anal. Chim. Acta 2021, 1178, 338799. [Google Scholar] [CrossRef] [PubMed]
- Yang, X.Y.; Hao, Z.Q.; Li, C.M.; Li, J.M.; Yi, R.X.; Shen, M.; Li, K.H.; Guo, L.B.; Li, X.Y.; Lu, Y.F.; et al. Sensitive Determinations of Cu, Pb, Cd, and Cr Elements in Aqueous Solutions Using Chemical Replacement Combined with Surface-Enhanced Laser-Induced Breakdown Spectroscopy. Opt. Express 2016, 24, 13410. [Google Scholar] [CrossRef] [PubMed]
- Yang, X.; Hao, Z.; Shen, M.; Yi, R.; Li, J.; Yu, H.; Guo, L.; Li, X.; Zeng, X.; Lu, Y. Simultaneous Determination of La, Ce, Pr, and Nd Elements in Aqueous Solution Using Surface-Enhanced Laser-Induced Breakdown Spectroscopy. Talanta 2017, 163, 127–131. [Google Scholar] [CrossRef] [PubMed]
- Yao, M.; Lin, J.; Liu, M.; Xu, Y. Detection of Chromium in Wastewater from Refuse Incineration Power Plant near Poyang Lake by Laser Induced Breakdown Spectroscopy. Appl. Opt. 2012, 51, 1552. [Google Scholar] [CrossRef] [PubMed]
- Ünal Yeşiller, S.; Yalçın, Ş. Optimization of Chemical and Instrumental Parameters in Hydride Generation Laser-Induced Breakdown Spectrometry for the Determination of Arsenic, Antimony, Lead and Germanium in Aqueous Samples. Anal. Chim. Acta 2013, 770, 7–17. [Google Scholar] [CrossRef]
- Yueh, F.-Y.; Sharma, R.C.; Singh, J.P.; Zhang, H.; Spencer, W.A. Evaluation of the Potential of Laser-Induced Breakdown Spectroscopy for Detection of Trace Element in Liquid. J. Air Waste Manag. Assoc. 2002, 52, 1307–1315. [Google Scholar] [CrossRef]
- Zhang, Z.; Jia, W.; Shan, Q.; Hei, D.; Wang, Z.; Wang, Y.; Ling, Y. Determining Metal Elements in Liquid Samples Using Laser-Induced Breakdown Spectroscopy and Phase Conversion Technology. Anal. Methods 2022, 14, 147–155. [Google Scholar] [CrossRef]
- Zhao, F.; Chen, Z.; Zhang, F.; Li, R.; Zhou, J. Ultra-Sensitive Detection of Heavy Metal Ions in Tap Water by Laser-Induced Breakdown Spectroscopy with the Assistance of Electrical-Deposition. Anal. Methods 2010, 2, 408. [Google Scholar] [CrossRef]
- Zhao, N.J.; Meng, D.S.; Jia, Y.; Ma, M.J.; Fang, L.; Liu, J.G.; Liu, W.Q. On-Line Quantitative Analysis of Heavy Metals in Water Based on Laser-Induced Breakdown Spectroscopy. Opt. Express 2019, 27, A495. [Google Scholar] [CrossRef]
- Zhong, S.-L.; Lu, Y.; Kong, W.-J.; Cheng, K.; Zheng, R. Quantitative Analysis of Lead in Aqueous Solutions by Ultrasonic Nebulizer Assisted Laser Induced Breakdown Spectroscopy. Front. Phys. 2016, 11, 114202. [Google Scholar] [CrossRef]
- Zhong, S.; Zheng, R.; Lu, Y.; Cheng, K.; Xiu, J. Ultrasonic Nebulizer Assisted LIBS: A Promising Metal Elements Detection Method for Aqueous Sample Analysis. Plasma Sci. Technol. 2015, 17, 979–984. [Google Scholar] [CrossRef]
- Zhu, Y.; Ma, S.; Yang, G.; Tian, H.; Dong, D. Rapid Automatic Detection of Water Ca, Mg Elements Using Laser-Induced Breakdown Spectroscopy. Front. Phys. 2023, 11, 1179574. [Google Scholar] [CrossRef]
- Zhu, D.; Wu, L.; Wang, B.; Chen, J.; Lu, J.; Ni, X. Determination of Ca and Mg in Aqueous Solution by Laser-Induced Breakdown Spectroscopy Using Absorbent Paper Substrates. Appl. Opt. 2011, 50, 5695. [Google Scholar] [CrossRef] [PubMed]
- Wang, Q.; Ge, T.; Liu, Y.; Jiang, L.; Chen, A.; Han, J.; Jin, M. Highly Sensitive Analysis of Trace Elements in Aqueous Solutions Using Surface-Enhanced and Discharge-Assisted Laser-Induced Breakdown Spectroscopy. J. Anal. At. Spectrom. 2022, 37, 233–239. [Google Scholar] [CrossRef]
- Ripoll, L.; Navarro-González, J.; Legnaioli, S.; Palleschi, V.; Hidalgo, M. Evaluation of Thin Film Microextraction for Trace Elemental Analysis of Liquid Samples Using LIBS Detection. Talanta 2021, 223, 121736. [Google Scholar] [CrossRef]


| Sample Type | Example | Elements Analysed |
|---|---|---|
| Stock solution (ss) | Prepared solutions | Li, Be, B, N, F, Na, Mg, Al, Si, P, S, Cl, K, Ca, Ti, V, Cr, Mn, Fe, Co, Ni, Cu, Zn, Ga, Ge, As, Se, Br, Rb, Sr, Y, Zr, Mo, Tc, Ru, Ag, Cd, In, Sn, Sb, Cs, Ba, La, Ce, Pr, Nd, Sm, Eu, Gd, Yb, Re, Au, Hg, Pb, Th, U |
| Artificial (art) | Industrial or waste waters | P, Cr, Ni, Cu, Zn, Ge, Cd, Au, Pb |
| Biological (biol) | Blood, urine, wine | Ti, Fe, Cu, Sr, Ag, Cs, Pb |
| Natural (nat) | River water, groundwater, rainwater | Li, B, N, Na, Mg, Al, P, S, Cl, K, Ca, Cr, Mn, Ni, Cu, Zn, As, Sr, Ag, Cd, Sn, Sb, Ba, Hg, Pb |
| Natural saline (nat sal) | Seawater, brine | Li, Na, Mg, K, Ca, Mn, Cu, Sr |
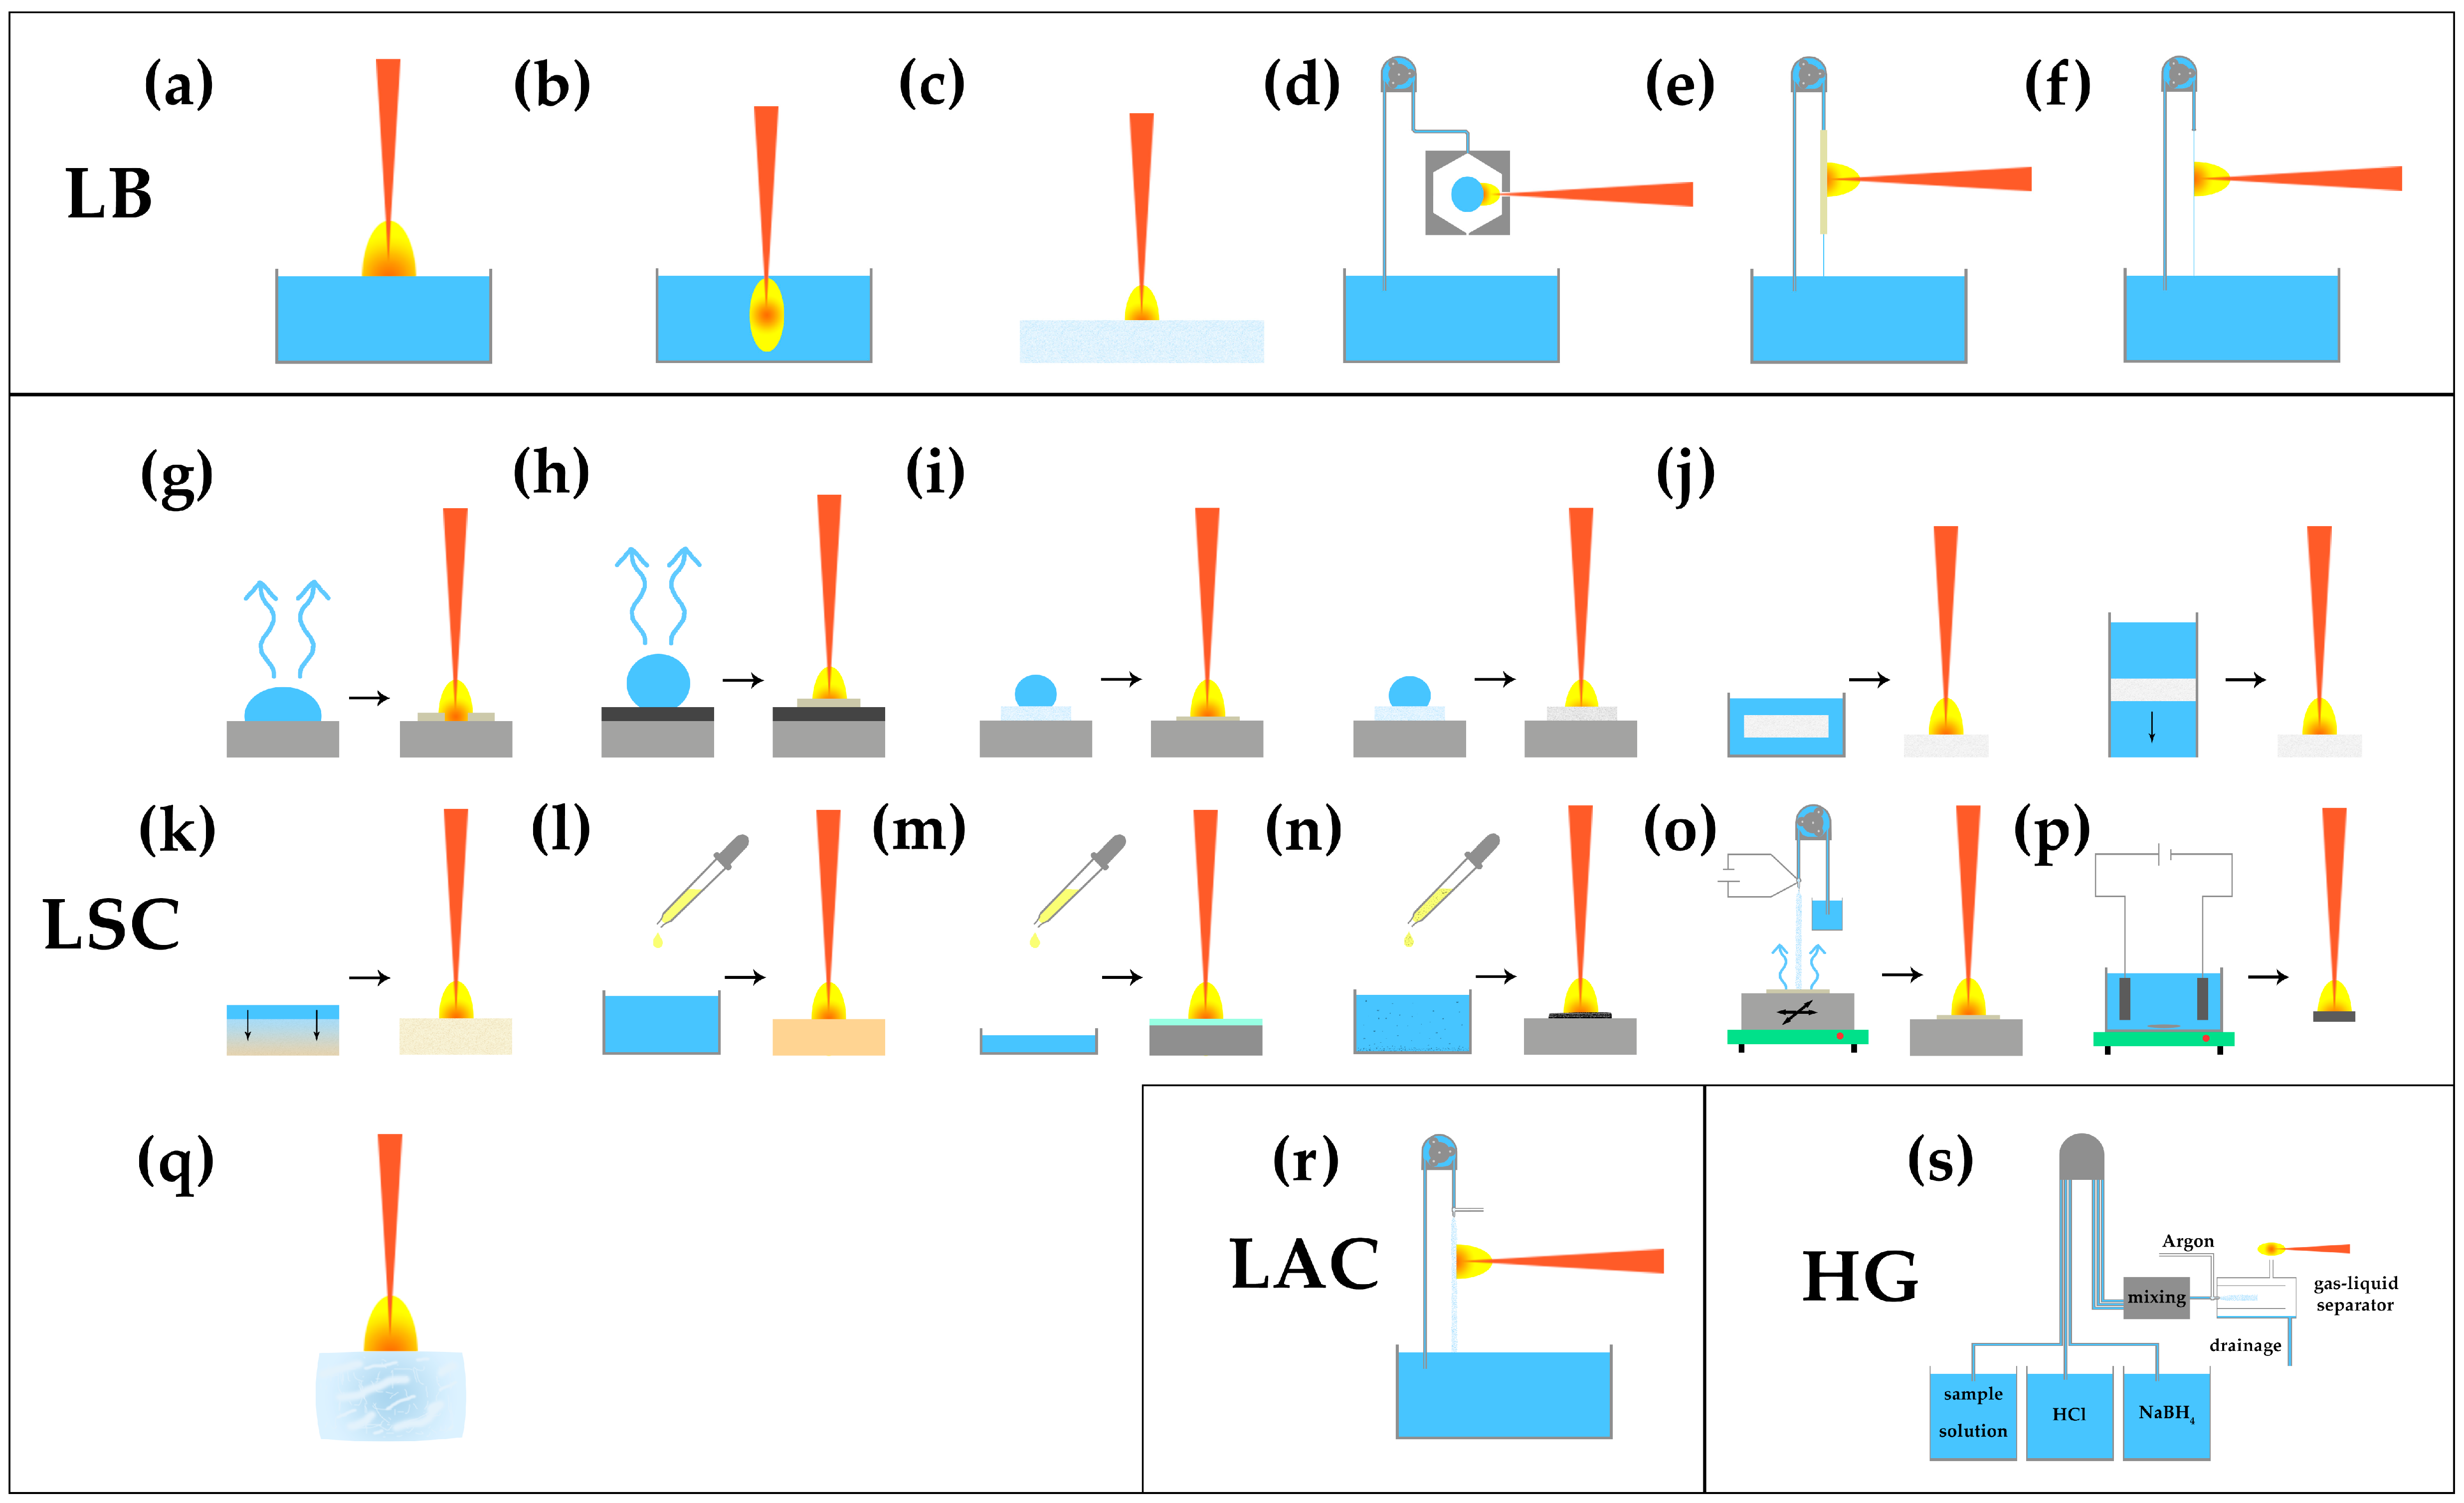
| Category | Sub-Category | Cf. | Exemplary Reference |
|---|---|---|---|
| Liquid bulk (LB) | Surface | a | [34,35] |
| Inside | b | [1,36] | |
| Soaked on filter paper | c | [37] | |
| Isolated droplet (ID) | d | [38,39] | |
| Liquid jet (LJ) capillary | e | [40] | |
| Liquid jet (LJ) | f | [7,28] | |
| Liquid-to-solid conversion (LSC) | Non-surface-enhanced (n-SE) | g | [41,42] |
| Surface-enhanced (SE) | h | [43,44] | |
| Filter-paper-supported | i | [45,46] | |
| Ion exchange (IE) | j | [47,48] | |
| Adsorption/absorption (Ad/Ab) | k | [49,50] | |
| Chelating/complexation (Che/Com) | l | [51,52] | |
| Membrane generation (MeGe) | m | [53] | |
| Nanoparticle enhanced (NP) | n | [54,55] | |
| Electrospray deposition (ESD) | o | [56,57] | |
| Electrical deposition (ED) | p | [58,59] | |
| Ice | q | [60,61] | |
| Liquid-to-aerosol conversion (LAC) | r | [27,62] | |
| Hydride generation (HG) | s | [63,64] | |
| Instrument Type | Description | Advantages | Disadvantages | References |
|---|---|---|---|---|
| Laboratory-based | Laboratory analysis | Sensitive, multi-element detection | Usually inflexible, trained staff needed, expensive | e.g., [66] |
| Online | Continuous online analysis | On-site, continuous, real-time, multi-element detection | Needs own power supply, large | e.g., [67] |
| Telescopic | Remote analysis by a telescopic system | Safe, remote, on-site, multi-element detection | Not useful/necessary for every application | e.g., [32] |
| Portable/handheld | In situ analysis possible | Low-cost, on-site, real-time, multi-element detection | Only low pulse energies, less sensitive | e.g., [44] |
| LIBS Setup | Description | Advantages | Disadvantages | References |
|---|---|---|---|---|
| Double-pulse (DP) instead of single-pulse (SP) | First pulse ablates and generates plasma; second pulse reheats the plume | Higher sensitivity, fast and easy sample preparation, remote and in situ utilisation possible, no tuning of the laser wavelength, simultaneous multi-element detection | Not as sensitive as LIBS-LIF or RE-LIBS | [68,69] |
| Laser-induced fluorescence (LIF) | First pulse ablates and generates plasma; second pulse is tuned to specific analytes | Higher sensitivity due to resonant excitation and background-free signal detection, no spectral interference | No simultaneous multi-element detection, tuneable laser and experienced staff needed | [70,71] |
| Resonance-enhanced (RE) | First pulse ablates and generates plasma; second pulse is resonant with the major species line | Higher sensitivity, simultaneous multi-element detection, low sample consumption | Tuneable laser and experienced staff needed | [69] |
| Resonant (R) | One laser source tuned to specific resonant transition | Simpler experimental setup compared to LIF and RE, higher sensitivity compared to SP, simultaneous multi-element detection | Tuneable laser and experienced staff needed | [69,72] |
| Microwave enhancement (MW) | Enhancement by extended plasma lifetime through mobilised free electrons and ions | Higher sensitivity for a specific element | Complicated setup, requires a microwave system, no simultaneous multi-element detection | [28] |
| Acquisition Settings | Unit | Short Description | Reference |
|---|---|---|---|
| Repetition rate | Hz | An increased repetition rate allows faster analysis and greater averaging for a better signal-to-noise ratio and influences the energy delivered | [13] |
| Pulse energy | mJ | Higher energy results in more and faster ablation | [73] |
| Pulse duration | ns | ns/ps/fs pulses possible; influences the results due to effects such as plasma shielding | [74] |
| Gate delay | ns | Gating can improve the results due to less continuum radiation and therefore better S/N with longer delays | [13] |
| Atmosphere | - | Influences results: Ar > air > He in terms of intensity, plasma temperature, and electron density; He is better than S/N | [75] |
| Wavelength | nm | More energy can be delivered at shorter wavelengths to break bonds and ionise | [73] |
Disclaimer/Publisher’s Note: The statements, opinions and data contained in all publications are solely those of the individual author(s) and contributor(s) and not of MDPI and/or the editor(s). MDPI and/or the editor(s) disclaim responsibility for any injury to people or property resulting from any ideas, methods, instructions or products referred to in the content. |
© 2024 by the authors. Licensee MDPI, Basel, Switzerland. This article is an open access article distributed under the terms and conditions of the Creative Commons Attribution (CC BY) license (https://creativecommons.org/licenses/by/4.0/).
Share and Cite
Schlatter, N.; Lottermoser, B.G. Laser-Induced Breakdown Spectroscopy Applied to Elemental Analysis of Aqueous Solutions—A Comprehensive Review. Spectrosc. J. 2024, 2, 1-32. https://doi.org/10.3390/spectroscj2010001
Schlatter N, Lottermoser BG. Laser-Induced Breakdown Spectroscopy Applied to Elemental Analysis of Aqueous Solutions—A Comprehensive Review. Spectroscopy Journal. 2024; 2(1):1-32. https://doi.org/10.3390/spectroscj2010001
Chicago/Turabian StyleSchlatter, Nils, and Bernd G. Lottermoser. 2024. "Laser-Induced Breakdown Spectroscopy Applied to Elemental Analysis of Aqueous Solutions—A Comprehensive Review" Spectroscopy Journal 2, no. 1: 1-32. https://doi.org/10.3390/spectroscj2010001
APA StyleSchlatter, N., & Lottermoser, B. G. (2024). Laser-Induced Breakdown Spectroscopy Applied to Elemental Analysis of Aqueous Solutions—A Comprehensive Review. Spectroscopy Journal, 2(1), 1-32. https://doi.org/10.3390/spectroscj2010001