Communication

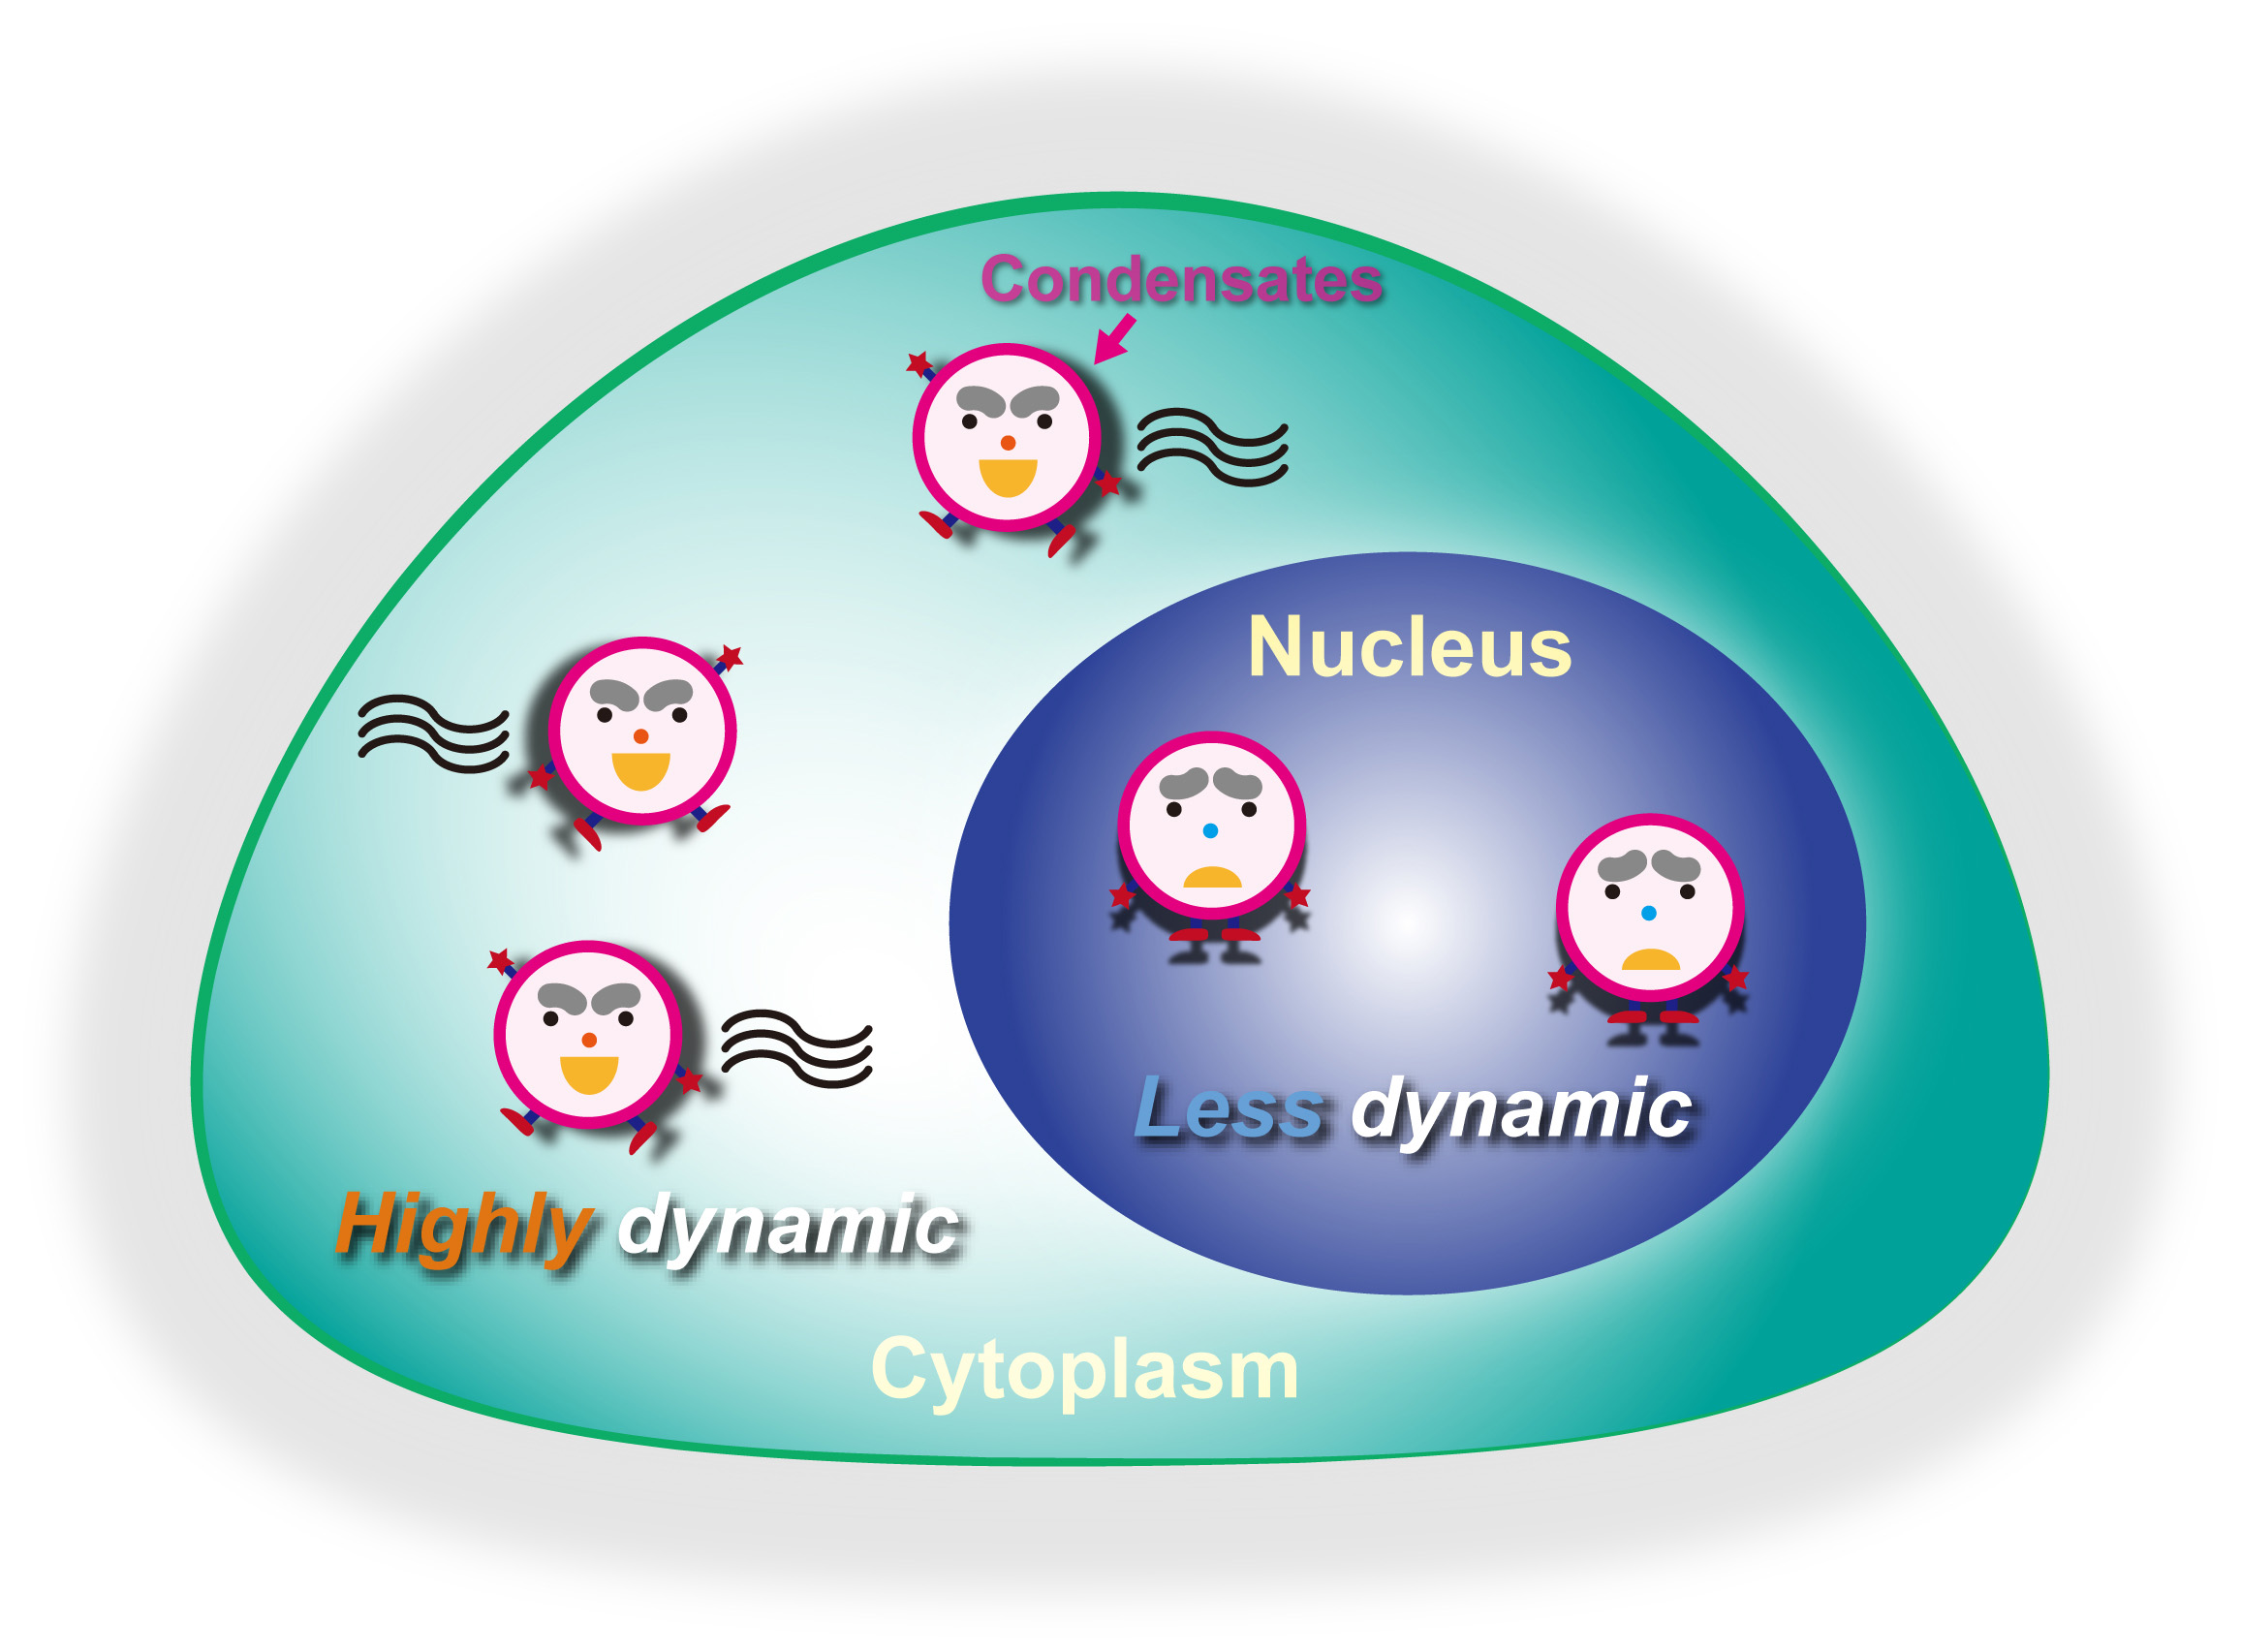
Light-Induced Condensates Show Accumulation-Prone and Less Dynamic Properties in the Nucleus Compared to the Cytoplasm

1
Laboratory of Molecular Cell Dynamics, Graduate School of Life Science, Hokkaido University, Sapporo 001-0021, Japan
2
Laboratory of Molecular Cell Dynamics, Faculty of Advanced Life Science, Hokkaido University, Sapporo 001-0021, Japan
3
PRIME, Japan Agency for Medical Research and Development, Tokyo 100-0004, Japan
*
Author to whom correspondence should be addressed.
Spectrosc. J. 2023, 1(2), 65-71; https://doi.org/10.3390/spectroscj1020006
Submission received: 8 June 2023 / Revised: 29 June 2023 / Accepted: 6 July 2023 / Published: 10 July 2023

Abstract

:
Biomolecular condensates, including membraneless organelles, are ubiquitously observed in subcellular compartments. However, the accumulation and dynamic properties of arbitrarily induced condensates remain elusive. Here, we show the size, amount, and dynamic properties of subcellular condensates using various fluorescence spectroscopic imaging analyses. Spatial image correlation spectroscopy showed that the size of blue-light-induced condensates of cryptochrome 2-derived oligomerization tag (CRY2olig) tagged with a red fluorescent protein in the nucleus was not different from that in the cytoplasm. Fluorescence intensity measurements showed that the condensates in the nucleus were more prone to accumulation than those in the cytoplasm. Single-particle tracking analysis showed that the condensates in the nucleus are predisposed to have stationary dynamics compared to those in the cytoplasm. Therefore, the subcellular compartment may, in part, affect the characteristics of self-recruitment of biomolecules in the condensates and their movement property.

Graphical Abstract

1. Introduction

Membraneless intracellular assemblies in subcellular compartments of cells are called biomolecular condensates [1]. Condensates are formed from the spontaneous partitioning of biomolecules into discrete compartments of higher concentration compared to the surrounding solution through liquid–liquid and liquid–solid phase separation (LLPS and LSPS, respectively) [2]. In eukaryotic cells, various condensates containing protein and RNA, such as nucleolus, nuclear bodies, and nuclear speckles in the nucleus and processing bodies (PBs) and stress granules (SGs) in the cytoplasm, play diverse roles in cellular function and regulation of biochemical reactions [3]. For example, the nucleolus, a large multiphase liquid condensate and a famous membraneless organelle in the nucleus, is the basis for ribosome biogenesis and acts as a quality control compartment that contributes to protein homeostasis (proteostasis) [4]. PBs and SGs are condensates containing protein and RNA in the cytoplasm, but their functions are completely different: PBs are involved in mRNA turnover, and SGs are translational repressors during stress [5]. These differences in the function of condensates are currently known to be defined by the biomolecule composition in the condensates [5,6]. The interaction of the constituent biomolecules in the condensates is a controlling factor for the penetration of other molecules into the condensates [7]. As a simple and pure question, why do PBs and SGs not form in the nucleus? Alternatively, why do nuclear bodies and nuclear speckles not form in the cytoplasm? These questions prompted us to investigate whether the accumulation and dynamics of artificially formed intracellular condensates derived from the same protein differ between the cytoplasm and nucleus. To investigate this issue, we focused on the property of an Arabidopsis thaliana photoreceptor cryptochrome 2 (CRY2)-derived light-induced oligomerization tag, CRY2olig, that can form arbitrary clusters/condensates in cells [8,9]. Although wild-type CRY2 also forms intracellular assemblies by irradiation in plant and animal cells [10], CRY2olig carries mutations that are efficiently and reversibly oligomerized by blue light irradiation [9]. CRY2olig was tagged with a red fluorescent protein (mCherry) (hereafter called CRY2R); then, we compared the size, fluorescence intensity, and dynamics of the CRY2R condensates between the cytoplasm and nucleus using spatial image correlation spectroscopy (SICS) [11,12], fluorescence intensity measurement, and single-particle tracking analysis [13] based on confocal fluorescence microscopy.

2. Materials and Methods

2.1. Cell Culture and Transfection

Neuro-2a murine neuroblastoma (N2a) cells were obtained from the American Type Culture Collection (ATCC; Manassas, VA, USA) and maintained in DMEM (08459-64, Nacalai Tesque, Kyoto, Japan) supplemented with 10% heat-inactivated fetal bovine serum (FBS) (12676029, Thermo Fisher Scientific, Waltham, MA, USA), 100 U/mL penicillin G (Sigma-Aldrich, St. Louis, MO, USA), and 0.1 mg/mL streptomycin (Sigma-Aldrich), as previously described [14]. One day before transfection, 2.0 × 10⁵ N2a cells were transferred to a glass bottom dish (3970-035, IWAKI-AGC Technoglass, Shizuoka, Japan). Plasmid DNA for expressing CRY2olig tagged with mCherry at its C-terminus was obtained from Addgene (#60032; Watertown, MA, USA). The plasmid (1.0 μg/dish) was transfected using Lipofectamine 2000 (Thermo Fisher Scientific) according to the manufacturer’s protocol. After incubation for 24 h, the medium was exchanged with normal growth medium before confocal observation.

2.2. Light-Induced Oligomerization Using a Confocal Microscope

Cell selection for observation, blue light irradiation, and image acquisition were performed using an inverted fluorescence microscope, Axioobserver Z1 (Carl Zeiss, Jena, Germany) combined with an LSM 510META (Carl Zeiss), a C-Apochromat 40×/1.2NA W Korr. UV-VIS-IR water immersion objective, and a heat incubator stage at 37 °C and with 5% CO2. Cells expressing CRY2R were selected by ocular observation using fluorescence filter sets for mCherry (#49008, Chroma, Bellows Falls, VT, USA) with a mercury lamp. mCherry was excited at 594 nm (3.0 μW). Excitation and emission lights were split using a beam splitter (NFT488/594). Fluorescence was collected through a 615 nm long-pass filter (LP615) and then through a 545 nm dichroic mirror (NFT545). The diameter of the pinhole was 150 μm. After observation of 1 frame, the whole area of the cells was irradiated at 488 nm (0.66 μW); 1 iteration. After 488 nm irradiation, CRY2R-expressing cells were observed at 4.0 s intervals. The fluorescence intensity in the cells was measured 184–244 s after 488 nm irradiation when the condensates formed the most efficiently in the cells.

2.3. Spatial Image Correlation Spectroscopy

Spatial image correlation spectroscopy (SICS) analysis was performed as previously reported [12] from the confocal fluorescence images of CRY2R in N2a cells. Nonlinear curve fitting analysis for the distribution of the spatial autocorrelation function was performed on Octave software, including the calculation of the spatial autocorrelation function and its region cropping. The cytoplasmic and nuclear regions were distinguished by manually setting masks.

2.4. Fluorescence Intensity Measurement

Fluorescence intensity in and out of the CRY2R condensate region was manually measured using Fiji-ImageJ (https://fiji.sc/, accessed on 7 July 2023). The mean intensities in CRY2R condensates in the cytoplasm and nucleus were normalized to those in the nucleoplasm or cytoplasmic region that did not include the condensates.

2.5. Single-Particle Tracking

CRY2R condensates were induced in the same procedure as other measurements described above, and time series of confocal fluorescence images of the condensate-containing cells were acquired. The image series were analyzed using Fiji-ImageJ and the TrackMate plug-in [13]. CRY2R condensate particles were tracked in the cytoplasm and nucleus, and the total distance and mean speed of each particle were obtained.

2.6. Statistics

The Student’s t-tests were calculated using Microsoft Excel.

3. Results

Accumulated clusters of CRY2R were induced by blue light irradiation in live N2a cells (Figure 1a); however, it is still ambiguous whether the formed clusters are just oligomers or higher-order assemblies (i.e., condensates). To clarify this, we determined the mean size of the cluster using SICS, which can simply determine the average diameter of the cytoplasmic clusters [12]. The average diameter of the clusters both in the cytoplasm and in the nucleus (0.67–0.72 μm; Figure 1b) was larger than the scale of the CRY2R oligomers. The diameter of the CRY2R clusters in the nucleus was not different from that in the cytoplasm (Figure 1b). This suggests that the clusters may include many CRY2R molecules and can be defined as condensates in both the nucleus and cytoplasm.
Next, to investigate the extent to which molecules accumulate inside the condensates after blue light irradiation, the fluorescence intensity of CRY2R was compared in the condensates between the cytoplasm and the nucleus. The internal fluorescence intensity of the CRY2R condensates normalized using the intensity of the region that did not form the condensates was higher in the nucleus than in the cytoplasm (Figure 2a,b). The fluorescence intensity of the outside region of the condensates in the nucleoplasm was lower than that in the cytoplasm (Figure 2c), likely because CRY2R rapidly accumulates in the condensates and the CRY2R concentration in the nucleoplasm decreases, but the CRY2R in the cytoplasm would not be immediately supplied to the nucleoplasm. These results suggest that CRY2R condensates in the nucleus may be more efficient in recruiting CRY2R outside the condensates than those in the cytoplasm.
Next, the dynamics (movement) of the CRY2R condensates in live N2a cells were compared between the cytoplasm and the nucleus (Supplementary Material, Videos S1 and S2). The mean speed of movement and the total distance traveled of the CRY2R condensates considering single particles during the observation period. The mean speed of movement and the total traveled distance of the CRY2R condensates were faster and longer in the cytoplasm than in the nucleus, respectively (Figure 3a,b). This indicates that CRY2R condensates in the cytoplasm tend to move around after formation, whereas those in the nucleus tend to stay where they are formed (i.e., stationary condensates). Furthermore, the mean speed of the cytoplasmic condensates varied, indicating that some of them were stationary, similar to those in the nucleus (Figure 3b).

4. Discussion

We compared the size, intensity, and dynamics of CRY2R condensates using confocal fluorescence microscopy and its application methods, such as SICS and single-particle tracking, in live cells. The size of CRY2R condensates determined using SICS (Figure 1b) corresponds to the previously reported size [9]. This reaffirms the advantage of SICS, which is not good at precisely classifying objects/structures with multicomponent sizes but still provides an average value that is of equal significance. Endogenous Arabidopsis CRY2, the original full-length protein of CRY2olig, forms tetramers after blue light irradiation (~12 nm in diameter) [15]. The size of the CRY2R condensates in the N2a cells was much larger than the determined oligomer structure; thus, they cannot be called ‘oligomers’, even considering the blur by optical diffraction. The fluorescence intensity ratio inside and outside of the condensates basically reflects the number of accumulated fluorescent molecules (Figure 2b); however, since the fluorescence lifetime of mCherry is shortened and quenched when it forms aggregates such as amyloids [16], this ratio may be less than the actual amounts of CRY2R in the condensates. Therefore, although oligomerization is probably an impetus for such condensates, these brightly accumulated structures in the cell could be called condensates, not just tetramers.
We showed that CRY2R formed stationary and highly accumulated condensates in the nucleus compared to those in the cytoplasm (Figure 2 and Figure 3). The lower concentration of CRY2R in the nucleoplasm than in the cytoplasm after the formation of the condensate suggests that the condensate in the nucleus likely appears to recruit CRY2R outside of the condensates (Figure 2c), although a precise kinetic challenge remains. Nuclear localization of endogenous cryptochromes is conserved in animals and plants [17], suggesting the photoreceptor function of cryptochromes in the nucleus. An important interaction partner of cryptochrome is phytochrome, which is also localized in the nucleus [10]. However, since phytochrome is not expressed in N2a cells, what proteins contribute to the interaction with CRY2R? Since serine/arginine-rich splicing factor SC35 is colocalized with the blue light-induced condensates of CRY2olig in the nuclear speckles [9], SC35 may be a possible candidate for the interaction that gives the stationary dynamics of CRY2R condensates. Viscosity and density in the subcellular compartment are assumed to be factors that make it prevention for the biomolecules to move. However, the microviscosity in the nucleoplasm does not change from that in the cytoplasm [18], and the density in the nucleoplasm is lower than that in the cytoplasm [19]; hence, neither density nor viscosity in the subcellular compartment would not be involved in the stationarity of the CRY2R condensates. Therefore, it is unquestionable that the interaction between CRY2R and endogenous proteins can contribute to the formation of stationary condensates in the nucleus. Furthermore, the stationary condensates would trap diffusing CRY2R in the condensate. In contrast, CRY2R condensates moved rapidly in the cytoplasm (Figure 3). A possible explanation for this phenomenon would be the absence of scaffolding proteins such as SC35 in the cytoplasm. The moving property of CRY2R condensates in the cytoplasm may increase its usefulness as a condensation-inducing tag because it may not necessarily require extra interactions should be considered. Since the cytoplasmic localization of a neurodegenerative disease-causative aggregate-prone protein is likely to exert cytotoxicity [14,20], this moving property would be more likely to be useful for the analysis of condensation in the cytoplasm. Furthermore, some slow and stationary condensates in the cytoplasm may attach to the cellular components. This heterogeneous property of the dynamics of the condensate in the cytoplasm may be involved in the “dirty” property in the cytoplasm (e.g., heterogenic membranous organelle and cytoskeleton).
Accordingly, the subcellular compartment may importantly affect the characteristics of self-recruitment of the biomolecules in the condensates and their moving property. Interactions of condensates with specific scaffolding molecules determine a portion of the properties of the condensates (e.g., stationarity). Moreover, SICS, fluorescence intensity measurement, and single-particle tracking analysis based on confocal fluorescence microscopy enable clarification of the properties of the condensates in live cells.

5. Conclusions

We compared the assembled states and dynamics of CRY2R condensates in live cells. The CRY2R condensates showed a different property in its dynamics depending on the subcellular compartments. Therefore, the environment of the subcellular compartment may, in part, affect the characteristics of self-recruitment of bio-molecules in the condensates and their movement property in the compartment. Our findings would help to compare the subcellular compartment-dependent different characteristics of the condensates in the future.

Supplementary Materials

The following supporting information can be downloaded at https://www.mdpi.com/article/10.3390/spectroscj1020006/s1. Video S1: Movement of CRY2R condensates in the cytoplasm; Video S2: Movement of CRY2R condensates in the nucleus.

Author Contributions

Conceptualization, A.K.; methodology, Y.H. and A.K.; validation, Y.H. and A.K.; formal analysis, Y.H. and A.K.; investigation, Y.H. and A.K.; resources, A.K.; data curation, Y.H. and A.K.; writing—original draft preparation, A.K.; writing—review and editing, Y.H. and A.K.; visualization, A.K.; supervision, A.K.; project administration, A.K.; funding acquisition, Y.H. and A.K. All authors have read and agreed to the published version of the manuscript.

Funding

This research was funded by the Japan Agency for Medical Research and Development (AMED), grant number JP23gm6410028 for A.K.; by the Japan Society for the Promotion of Science (JSPS), grant number 22H04826 for A.K.; by the Hoansha Foundation for A.K.; and by the establishment of universities fellowship toward the creation of science technology innovation (the Hokkaido University Ambitious Doctoral Fellowship) supported by the Japan Science and Technology Agency (JST), grant number JPMJFS2101 for Y.H.

Institutional Review Board Statement

Not applicable.

Informed Consent Statement

Not applicable.

Data Availability Statement

The data that support the findings of this study are openly available in The Open Science Framework at http://doi.org/10.17605/OSF.IO/4JZ6A.

Acknowledgments

We would like to thank Asuka Murata for her technical support. We would like to thank American Journal Experts (www.aje.com, accessed on 9 July 2023) for the English language editing.

Conflicts of Interest

The authors declare no conflict of interest.

References

  1. Alberti, S.; Hyman, A.A. Biomolecular condensates at the nexus of cellular stress, protein aggregation disease and ageing. Nat. Rev. Mol. Cell Biol. 2021, 22, 196–213. [Google Scholar] [CrossRef] [PubMed]
  2. Mittag, T.; Pappu, R.V. A conceptual framework for understanding phase separation and addressing open questions and challenges. Mol. Cell 2022, 82, 2201–2214. [Google Scholar] [CrossRef] [PubMed]
  3. Banani, S.F.; Lee, H.O.; Hyman, A.A.; Rosen, M.K. Biomolecular condensates: Organizers of cellular biochemistry. Nat. Rev. Mol. Cell Biol. 2017, 18, 285–298. [Google Scholar] [CrossRef] [PubMed]
  4. Lafontaine, D.L.J.; Riback, J.A.; Bascetin, R.; Brangwynne, C.P. The nucleolus as a multiphase liquid condensate. Nat. Rev. Mol. Cell Biol. 2021, 22, 165–182. [Google Scholar] [CrossRef] [PubMed]
  5. Wang, B.; Zhang, L.; Dai, T.; Qin, Z.; Lu, H.; Zhang, L.; Zhou, F. Liquid-liquid phase separation in human health and diseases. Signal Transduct. Target. Ther. 2021, 6, 290. [Google Scholar] [CrossRef] [PubMed]
  6. Laflamme, G.; Mekhail, K. Biomolecular condensates as arbiters of biochemical reactions inside the nucleus. Commun. Biol. 2020, 3, 773. [Google Scholar] [CrossRef] [PubMed]
  7. Mondal, S.; Narayan, K.; Botterbusch, S.; Powers, I.; Zheng, J.; James, H.P.; Jin, R.; Baumgart, T. Multivalent interactions between molecular components involved in fast endophilin mediated endocytosis drive protein phase separation. Nat. Commun. 2022, 13, 5017. [Google Scholar] [CrossRef] [PubMed]
  8. Taslimi, A.; Vrana, J.D.; Chen, D.; Borinskaya, S.; Mayer, B.J.; Kennedy, M.J.; Tucker, C.L. An optimized optogenetic clustering tool for probing protein interaction and function. Nat. Commun. 2014, 5, 4925. [Google Scholar] [CrossRef] [PubMed] [Green Version]
  9. Park, H.; Kim, N.Y.; Lee, S.; Kim, N.; Kim, J.; Heo, W.D. Optogenetic protein clustering through fluorescent protein tagging and extension of CRY2. Nat. Commun. 2017, 8, 30. [Google Scholar] [CrossRef] [PubMed] [Green Version]
  10. Mas, P.; Devlin, P.F.; Panda, S.; Kay, S.A. Functional interaction of phytochrome B and cryptochrome 2. Nature 2000, 408, 207–211. [Google Scholar] [CrossRef] [PubMed]
  11. Petersen, N.O.; Hoddelius, P.L.; Wiseman, P.W.; Seger, O.; Magnusson, K.E. Quantitation of membrane receptor distributions by image correlation spectroscopy: Concept and application. Biophys. J. 1993, 65, 1135–1146. [Google Scholar] [CrossRef] [PubMed] [Green Version]
  12. Kitamura, A.; Shimizu, H.; Kinjo, M. Determination of cytoplasmic optineurin foci sizes using image correlation spectroscopy. J. Biochem. 2018, 164, 223–229. [Google Scholar] [CrossRef] [PubMed]
  13. Ershov, D.; Phan, M.S.; Pylvanainen, J.W.; Rigaud, S.U.; Le Blanc, L.; Charles-Orszag, A.; Conway, J.R.W.; Laine, R.F.; Roy, N.H.; Bonazzi, D.; et al. TrackMate 7: Integrating state-of-the-art segmentation algorithms into tracking pipelines. Nat. Methods 2022, 19, 829–832. [Google Scholar] [CrossRef] [PubMed]
  14. Kitamura, A.; Nakayama, Y.; Shibasaki, A.; Taki, A.; Yuno, S.; Takeda, K.; Yahara, M.; Tanabe, N.; Kinjo, M. Interaction of RNA with a C-terminal fragment of the amyotrophic lateral sclerosis-associated TDP43 reduces cytotoxicity. Sci. Rep. 2016, 6, 19230. [Google Scholar] [CrossRef] [PubMed] [Green Version]
  15. Ma, L.; Guan, Z.; Wang, Q.; Yan, X.; Wang, J.; Wang, Z.; Cao, J.; Zhang, D.; Gong, X.; Yin, P. Structural insights into the photoactivation of Arabidopsis CRY2. Nat. Plants 2020, 6, 1432–1438. [Google Scholar] [CrossRef] [PubMed]
  16. Lu, M.; Williamson, N.; Mishra, A.; Michel, C.H.; Kaminski, C.F.; Tunnacliffe, A.; Kaminski Schierle, G.S. Structural progression of amyloid-beta Arctic mutant aggregation in cells revealed by multiparametric imaging. J. Biol. Chem. 2019, 294, 1478–1487. [Google Scholar] [CrossRef] [PubMed] [Green Version]
  17. Cashmore, A.R.; Jarillo, J.A.; Wu, Y.J.; Liu, D. Cryptochromes: Blue light receptors for plants and animals. Science 1999, 284, 760–765. [Google Scholar] [CrossRef] [PubMed]
  18. Pack, C.; Saito, K.; Tamura, M.; Kinjo, M. Microenvironment and effect of energy depletion in the nucleus analyzed by mobility of multiple oligomeric EGFPs. Biophys. J. 2006, 91, 3921–3936. [Google Scholar] [CrossRef] [PubMed] [Green Version]
  19. Kim, K.; Guck, J. The Relative Densities of Cytoplasm and Nuclear Compartments Are Robust against Strong Perturbation. Biophys. J. 2020, 119, 1946–1957. [Google Scholar] [CrossRef] [PubMed]
  20. Asakawa, K.; Handa, H.; Kawakami, K. Optogenetic modulation of TDP-43 oligomerization accelerates ALS-related pathologies in the spinal motor neurons. Nat. Commun. 2020, 11, 1004. [Google Scholar] [CrossRef] [PubMed] [Green Version]
Figure 1. Size determination of CRY2R condensates using spatial image correlation spectroscopy (SICS). (a) Confocal fluorescence and bright field images of a typical N2a cell expressing CRY2R before and after blue light irradiation. Bar = 2 μm. (b) Box-and-whisker plot of the average diameter of CRY2R condensates in a single cell using SICS. The numerical values above the bars indicate the mean ± SD (n = 4). The p-value was obtained from Student’s t-test (ns: not significant; p < 0.05).
Spectroscj 01 00006 g001
Figure 2. Comparison of the fluorescence intensity of CRY2R in condensates between the cytoplasm and the nucleus. (a) Confocal fluorescence image of CRY2R in live N2a cells. Typical condensates in the nucleus (N) and cytoplasm (C) are surrounded by white squares and enlarged (insets at the top). Bar = 1 μm. The images were interpolated using a bicubic interpolation algorithm. (b) The box-and-whisker plot of the relative intensity of the condensates to the outside region. The numerical values above the bars indicate the mean ± SD (40 condensates). (c) Bar plot of the fluorescence intensity of the outside region of the condensates used in (b). The numerical values above the bars indicate the mean ± SD (n = 3). The p-value was obtained from Student’s t-test.
Spectroscj 01 00006 g002
Figure 3. Single–particle tracking analysis of CRY2R condensates in live N2a cells. (a) Box-and-whisker plot of the mean speed (μm/s) of a single particle during image acquisition. (b) Box-and-whisker plot of the total traveled distance (μm) of single particles during image acquisition. The numerical values above the bars indicate the mean ± SD (17 particles). The p-value was obtained from Student’s t-tests.
Spectroscj 01 00006 g003
Disclaimer/Publisher’s Note: The statements, opinions and data contained in all publications are solely those of the individual author(s) and contributor(s) and not of MDPI and/or the editor(s). MDPI and/or the editor(s) disclaim responsibility for any injury to people or property resulting from any ideas, methods, instructions or products referred to in the content.

