Abstract
Diversity, equity, and inclusion, most commonly known as DEI, serves as a framework for practices that promote the fair treatment and full participation of all members of a community. Culturally responsive teaching and critical pedagogy are commonly associated with DEI as part of the larger strategy to validate and inspire learners while improving their self-efficacy and ability to challenge oppressive systems. While DEI is becoming increasingly better known in higher education, Historically Black Colleges or Universities (HBCUs) are heralded in the literature as a model for this work. Nevertheless, there is relatively limited empirical research exploring facets of DEI and culturally responsive teaching on HBCU and other minority-serving institutions’ campuses. This paper examines the campus of an HBCU located in the Mid-Atlantic United States, with an institutional commitment to diversity, equity, and inclusion, via a comprehensive DEI climate study that included separate surveys of students and faculty/staff. More specifically, the study explored whether all community members consider the campus inclusive, whether all community members experience a culture of belonging, whether adequate resources and supports exist for all campus members to succeed, whether faculty exhibit culturally responsive teaching practices, and whether the perceptions of faculty and staff differ from those of students. The purpose of the study was to help address the gap in the DEI literature exploring the practices of minority-serving institutions. According to the results, participants found the University to be an inclusive place, expressing strong satisfaction with the campus climate and experience. Further, when the presence of culturally responsive teaching practices was explored, strong evidence was indicated. Possible areas for improvement include greater supports and resources for LGBTQIA+, Indigenous, and disabled community members.
1. Introduction
The point of diversity, equity, and inclusion (DEI) initiatives is to create fairer and more inclusive workplaces and communities by actively addressing historical and systemic disadvantages faced by marginalized groups. Diversity refers to the representation of people from many communities, identities, races, ethnicities, backgrounds, abilities, cultures, lifestyles, and beliefs, including those who may be historically excluded or underrepresented [1]. Equity refers to fairness in treatment and the availability of, and access to, supports and opportunities [2], and for clarity, equity is not the same as equality. Whereas equality provides all people with the same treatment, equity recognizes that people face different barriers, thus requiring different supports and opportunities to reach the same goal. Finally, inclusion refers to the degree to which all members of a community are recognized and able to use their talents [3].
DEI is currently the subject of heated debate and tremendous vitriol in the United States, which has created unprecedented stress across higher education. Subsequently, a number of campus DEI offices have been shuttered and programs canceled, resulting in employees leading DEI efforts and providing resources to students experiencing layoffs or job reassignments. In January 2025, an executive order signed by U.S. President Trump declared that DEI policies and programs adopted by colleges, universities, and others can violate federal civil rights laws [4]. To date, over 50 U.S. universities are under investigation as part of the anti-DEI crackdown, with several seeing cuts in funding, with McGowan et al. [5] explaining that the current challenge lies not only in defending DEI efforts but also in reimagining them so as to maintain efficacy and resilience during these politically volatile times.
Despite the current controversy, DEI scholars advocate that institutions with a commitment to diversity, equity, and inclusion should evaluate their praxes recognizing that campuses should strive to be inclusive communities that celebrate diversity, and which provide fair and equitable access to opportunities to all community members [6]. Further, campuses should explore whether their teaching and learning experiences provide mirrors, windows, and doors, have cultural validity, afford multiple mechanisms for student success, are centered around the assets of students, build knowledge, extend perspectives, and foster empathy [7].
This paper discusses research conducted at a Mid-Atlantic minority-serving university with a commitment to DEI envisioned as one of the institutional goals. The institution is a Historically Black College or University (HBCU) located in a state system that also has a strategic plan that prioritizes diversity, equity, and inclusion with goals that include the conduct of research on DEI, promoting best practices to enhance inclusion and endorse equity, and nurturing culturally responsive teaching and DEI education that encourages students to be informed and engaged citizens [6]. More specifically, the study presented here explored whether all community members consider the campus inclusive, whether all community members experience a culture of belonging, whether adequate resources and supports exist for all campus members to succeed, whether faculty exhibit culturally responsive teaching practices, and whether the perceptions of faculty and staff differ from those of students.
The remainder of this paper is organized as follows: a Literature Review, Materials and Methods, Results, Discussion, Limitations, and Conclusions. The literature review discusses DEI in higher education, culturally responsive teaching, HBCUs and DEI, and influential theories. The goal of the authors is for this paper to contribute to the literature on DEI, especially on the role that minority-serving institutions can play, while also encouraging other institutions to engage in similar DEI climate studies.
2. Literature Review
2.1. DEI in Higher Education
The United States has a legacy of segregation in education, although they are not the only nation. For example, both South Africa’s apartheid system and the United States’ Jim Crow laws enforced racial segregation, impacting education, housing, and other aspects of life, with apartheid creating a legal system of racial separation and Jim Crow laws institutionalizing segregation through state and local laws [8]. Buzzetto-Hollywood and Quinn [6] discussed the history and evolution of DEI in America starting with the passage of the Second Morrill Act in 1890 (established land grant Historically Black, Colleges, and Universities (HBCUs) in the United States) and including Brown versus the Board of Education, the Civil Rights Act of 1964, passage of Title IX, and formation of the National Association of Diversity Officers in Higher Education. They further explained that in DEI, efforts grew exponentially after 2010, becoming a strategic imperative in 2020 when social and political movements such as #MeToo, #BlackLivesMatter, and #StopAAPIHate raised the public consciousness about the need for a greater commitment to social justice [9].
DEI in higher education has been explained in the literature to help engender solidarity between staff and students with mutually responsible citizenship values [10]; expand perspectives [11] and raise consciousness [12]; aid students in the development of an awareness of their responsibility to support DEI initiatives that they can take with them when they graduate [13]; create spaces, materials, and programs that are welcoming and facilitate wellness [14]; increase access to opportunities by students from historically marginalized groups [11]; and facilitate transformative interventions [15]. Further, these efforts are found to be particularly effective for historically marginalized students [13,16].
The Student Experience Project [17] engaged 295 faculty to utilize DEI practices in their classrooms in order to cultivate belonging and inclusion. The project collected feedback from 10,000 students each semester about their experiences, finding a 10.5% overall increase in students reporting positive experiences. Further, efforts were most strongly associated with improved experiences for Black, Latina, and Native American women, who reported an overall positive experience that increased by approximately 25% over the course of the project. Finally, the rate of students earning Ds, Fs, or withdrawing decreased by 26%.
According to Insight Into Academia [18], DEI initiatives account for less than one percent of institutional spending and yet result in outsized benefits for institutions in terms of student recruitment and retention, faculty hiring and retention, fostering a positive climate for learning and working, and workforce preparation for graduates. This sentiment has been echoed by the Institute for Higher Education Policy [19], which highlights the role of student experience and belonging in college student success.
The National Assessment of Collegiate Campus Climates (NACCC) is a peer-reviewed quantitative survey that has been purchased and administered at over 160 colleges since 2019. The survey is described as collecting data about students’ appraisals of institutional commitment to racial equity and diversity, where and what they learn about race and their feelings of readiness for citizenship in a racially diverse democracy, encounters with racial stress, cross racial engagement, and other important topics. Overall, the results have concluded that DEI efforts on American college campuses need to increase with significantly more, not fewer, DEI professionals needed to help fix racial problems at United States colleges and universities [20].
Despite the wealth of research asserting the benefits of DEI, it is not without its critics who claim that it is about putting unqualified people in jobs or classrooms or giving advantages to people because of gender, ethnicity, race, age, sexual preference, etc. It is about including individuals—because they are highly qualified—regardless of their gender, ethnicity, race, age, sexual preference, etc., which includes people from both majority and minority populations [21]. Attacks on DEI often ignore the empirical evidence supporting the benefits of DEI initiatives, such as improved employee engagement, innovation, and overall organizational performance [6].
2.2. Culturally Responsive Teaching
Culturally responsive teaching is also known as culturally compatible, culturally appropriate, culturally congruent, culturally relevant, and/or culturally responsive pedagogy [7]. Culturally responsive teaching is commonly associated with DEI as it is a strategy recognized for helping educational institutions work towards removing dominant cultural influences, indigeneity, and multiculturalism [22,23,24]. Gay [25] describes culturally responsive teaching as multidimensional, empowering, and transformative. She refers to culturally relevant pedagogy as the use of “… cultural knowledge, prior experiences, frame of reference, and performance styles of ethnically diverse students to make learning more relevant. It teaches to and through the strengths of the students. It is culturally validating and affirming” (p. 29). According to Lynch [26] culturally responsive instruction is a student-centered approach to instruction where the individual cultural assets of learners are identified and embraced in order to foster student achievement and self-efficacy.
Ladson-Billings [27] asserts that all learners, regardless of personal attributes or backgrounds, should be given opportunities to be academically successful, culturally competent, and critically conscious. They further identify the three central tenets of CRT as: 1. maintaining high expectations and learning standards while providing appropriate scaffolds and learner support; 2. building on students’ existing knowledge, experiences, and assets by implementing curriculum that incorporates their cultural knowledge and connections; and 3. supporting students’ ability to recognize and critique societal inequalities. These tenets are represented in Figure 1.
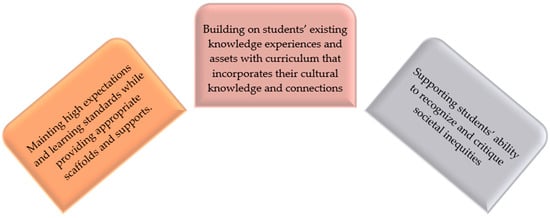
Figure 1.
3 Tenets of culturally relevant teaching based on Ladson-Billings.
Gay [28] explains there are four actions to culturally responsive teaching. These include (1) replacing the deficit perspectives of students and communities with a positive outlook; (2) accepting that there is often resistance to culturally responsive teaching from critics; (3) developing an understanding of how and why culture and difference are essential ideologies for culturally responsive teaching; and (4) making pedagogical connections within the teaching context. These actions are represented in Figure 2.
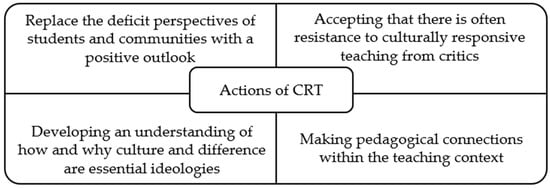
Figure 2.
Actions of CRT based on Gay [28].
Culturally responsive teaching seeks to validate and inspire learners, building their academic self-efficacy and initiative [25]. Self-efficacy is a concept that refers to the confidence that one has in their innate ability to achieve goals. Self-efficacy was introduced by Albert Bandura and lays at the center of his social cognitive theory, which posits that learning occurs in a social context that involves a dynamic and reciprocal interplay between the person, their environment, and their behaviors [7].
The literature on culturally responsive teaching spans thirty years and indicates a number of positive outcomes for learners and educational institutions. The benefits associated with culturally responsive teaching include: increased expectations [29,30,31]; the ability to better address the needs of learners [7]; increases in student motivation [32]; increased student engagement [27,33]; learner empowerment [34]; enhanced cultural competencies [33,34]; positive student performance [35,36,37,38,39]; improved learners’ self-efficacy or the positive perception students have in themselves as capable students [40,41]; remedying disparities and barriers in classrooms [6]; and learners encouraged to recognize, understand, and critique current and social inequalities [42,43].
2.3. HBCUs and DEI
Historically Black Colleges and Universities are American minority-serving institutions that were almost exclusively founded before the Civil Rights Act of 1964 to provide educational opportunities that might otherwise be denied to historically marginalized populations [44,45]. HBCUs are living and breathing examples of DEI and have been at the forefront of DEI and culturally responsive teaching since before these terms existed [6,7]. A research study that examined culturally responsive practices in higher education found that despite decades of underfunding, being perceived by others with a deficit mindset, and a legacy of marginalization, HBCUs are unmatched when it comes to implementing culturally sustaining practices in a comprehensive manner [46]. The report explains “HBCUs channeled the effects of that exclusion in constructive directions by focusing on inclusivity and by specializing in programs, such as STEM, in which white institutions struggle to retain Black students” (p. 32).
Justice, Equity, Diversity, and Inclusion (JEDI) is becoming increasingly better known in higher education and HBCUs are considered a model for this work. Herr-Perrin [47] explains that this is because “HBCUs have been JEDI masters existing in plain sight all along.” At the same time, Herr-Perrin also points out that despite being designed as “sanctuaries of inclusivity in the midst of an otherwise hostile society,” HBCUs are not flawless DEI models and are also impacted by such issues as discrimination towards LGBTQIA+ students and other threats to inclusion and belonging. Nevertheless, she also explains that HBCU graduates exhibited an unparalleled sense of belonging, which most institutions can learn from.
2.4. Theoretical Influences
Social Cognitive Theory, introduced by Albert Bandura, emphasizes the dynamic interplay between personal factors (beliefs, expectations, self-efficacy), behavior, and environmental influences [48]. Intersectional theory asserts that people are often disadvantaged by multiple sources of oppression, such as their race, class, gender identity, sexual orientation, religion, and other identity markers, “creating a complex convergence of oppression” that influences experiences, perceptions, and beliefs [49]. The term intersectionality was first coined in the late 1980s by Professor Kimberlé Crenshaw of Columbia University to describe how race, class, gender, and other individual characteristics “intersect” with one another and overlap [50]. Finally, psychological safety theory focuses on the importance of creating an environment where members of organizations feel safe expressing their opinions and taking risks without fear of punishment or humiliation in order to increase positive outcomes [51]. In the world of DEI, it is recognized that psychological safety is a foundation for open discussions about DEI issues.
Paulo Freire’s work, particularly his concept of “critical pedagogy” and “conscientização” or awareness, significantly informs research and practice in multicultural education, emphasizing the importance of dialogue, social justice, and empowering marginalized communities to critically examine and transform oppressive systems. According to Akkari and Mesquida [52], Freire’s legacy varies based on cultural context. In Europe, he is known for adult literacy education, whereas in the Americas, his concepts are used to address educational inequalities. Critical pedagogy posits that issues of social justice and democracy are not distinct from acts of teaching and learning and that education serves as a tool for social transformation, encouraging critical thinking and dialogue to challenge oppressive structures and empower individuals to become active agents of change [53].
3. Materials and Methods
A state university system, located in the Mid-Atlantic region of the United States, has a strategic plan that prioritizes diversity, equity, and inclusion with goals that include the conduct of research on DEI, promoting best practices to enhance inclusion and endorse equity, and nurturing DEI education that encourages students to be informed and engaged citizens. Among these system institutions is a minority-serving HBCU that has also committed to justice, equity, diversity, and inclusion (JEDI) with activities that include evaluating and assessing current programming and services; introducing a JEDI institutional learning goal and supporting general education requirement; using surveys to measure faculty, student, and staff perceptions; and exploring culturally responsive practices throughout teaching and learning. Accordingly, in 2024, a quality improvement project was proposed that involves the development, delivery, and reporting of a comprehensive JEDI needs assessment of the community using a mixed-methods approach.
A paper has been published [6] that discusses in detail the instrument design and validation process. In sum, a thirteen-step process was identified.
- Identification of goals
- Establishment of research questions
- Review of literature and existing tools
- Consultation with experts
- Identification of Methodology
- Preparation of draft instruments
- Check of readability and face validity
- Expert panel review
- Institutional Review Board review and approval
- Pilot study
- Distribution and data collection
- Analysis and reporting of findings
- Internal validity testing and use of results
A series of research questions were established around which the study was designed
- Do all community members consider the campus inclusive?
- Do all community members experience a culture of belonging?
- Are there adequate resources and supports for all campus members to succeed?
- Do faculty exhibit culturally responsive teaching practices?
- Do faculty and staff differ in their perceptions?
Two surveys were created in the Survey Monkey system, one for faculty and staff and the other for students. The faculty and staff surveys were purposed to explore the campus climate with respect to JEDI; participant demographics; engagement in JEDI activities; infusion of culturally responsive teaching strategies for teaching faculty; and recommendations and needs. The student survey was designed to explore the campus climate; participant demographics; engagement in campus JEDI activities, resources, and services; reflections on their courses; perspectives and experiences related to their work, study, and participation in the campus community; the identification of obstacles and barriers to inclusion; and recommendations and needs.
The surveys included a combination of dichotomous, Likert-scaled, multiple-response, ratio, short-answer, and contingency questions. A number of experts were consulted during the instrument design process and the draft instrument was reviewed by two separate carefully curated expert panels prior to IRB approval and conduction of the pilot. Question design was influenced by the literature and similar studies, the consideration of available instruments, recommendations by the National Association of Diversity Officers in Higher Education, and consultation with experts. The culturally responsive teaching questions were informed by the literature including the checklist published by Buzzetto-Hollywood [7].
Expert panelists were required to agree to an informed consent statement and were provided with instructions. They were asked to review questions grouped topically and were provided with prompts following each question group where they could provide feedback as they analyzed and assessed the quality of the questions and survey design, response options, structure, and overall methodology to ensure the instrument effectively captured the intended data and avoided biases. Expert panelists were also prompted to provide additional feedback and identify improvements needed.
The pilot was conducted in September 2024 with 24 individuals who completed the survey and then participated in focus groups where they reflected upon and provided feedback on the instruments. More specifically, participants were asked to analyze the questions and question flow, assess how well the survey will meet expectations, reflect upon the length of the questionnaire, consider instances where there may be confusion, etc. Response time was also examined and compared to what had been previously estimated by the Survey Monkey system. As a result of the pilot, some clarifying information was provided in the surveys, the estimated time for completion was adjusted, and the wording of a question was altered.
Prior to distribution, a sample size calculator was utilized with the confidence interval set to 95% and the margin of error set to 5%. Based on the calculation, the desired sample size for students was 342 and the recommended sample size for faculty and staff was 227.
The student survey was launched first and occurred over three weeks in late October and early November 2024. A one-time mass email was sent to all students at the university; however, the email only resulted in about 50 responses. As planned, flyers were placed across campus to increase awareness of the project and the researchers who had acquired hundreds of free promotional t-shirts strategically visited courses selected to ensure that the population would be representative of the student body. In total, 455 students completed the survey, representing a response rate of 15% and exceeding the 342-participant sample size recommended.
For the faculty and staff survey, human resources provided a list of all faculty and staff emails which were loaded into the Survey Monkey system, and the Email Invitation Collector was utilized. The list included approximately 700 emails; however, a significant number of those emails were duplicates, several were linked to deceased individuals or people who had departed from the university, and a number resulted in bounce backs. In total, 104 individuals responded to the email invitation, representing a response rate of 14% out of the 700, although in actuality the response rate was much larger (adjusted to 19%) as approximately 150 of the emails were either duplicates, individuals no longer affiliated with the institution, or unreachable email addresses. Nevertheless, the recommended participant sample of 227 was not reached.
After data collection was concluded, the data was imported to SPSS, version 30 where descriptive statistical analyses including the mean, standard deviation, frequency distribution, and confidence interval were calculated. Reliability testing was conducted using Cronbach’s alpha application. Chi-square tests, which are a common inferential statistical test used to examine the differences between categorical variables, were conducted. Chi-square tests aim to determine if a difference between observed data and expected data is due to chance or if it is due to a relationship between the variables. Finally, Spearman’s rank correlation coefficients were prepared to determine whether there is a monotonic component of association between continuous or ordinal variables. Monotonic relationships occur when one thing goes up or down with the other.
4. Results
Established in 1886, the University of Maryland Eastern Shore (UMES) is a Historically Black, 1890 land grant institution. It is a member of the University System of Maryland and primarily serves first-generation, low-income, and minority learners. The student population is approximately 3200 as of the fall of 2024, with an 88% minority student enrollment. The acceptance rate for applying students is approximately 61%, with the majority of students coming from the Mid-Atlantic region, more specifically, the Baltimore and Washington D.C. urban centers. UMES has a long history of providing academic programs and services for ethnically and culturally diverse students and, towards that end, offers programs and assistance that attract, serve, retain, and graduate many first-generation college students [6].
In total, 455 students completed the survey as well as 104 faculty and staff. The demographics are represented in Appendix A in Table A1 and Table A2. According to the analysis of the demographic responses, 88% of the student respondents were between the ages of 18–24, about 89% were non-white, 83% were born in the United States, 74% identified as straight or heterosexual, 92% identified as cisgender, 51.9% were female, and 41% were male, with the rest either preferring not to say or identifying as nonbinary or gender fluid. About 43.5% of respondents identified as a first-generation college student, which is a student whose parent(s) or guardian(s) did not complete a four-year bachelor’s degree. Approximately 54.7% identified as Christian, and another 10.2% as Catholic. A total of 12.6% preferred not to say, 12% responded “other,” 9% were atheist or agnostic, and the remaining 10.5% of respondents were split among the World’s remaining major religions. Seventy-nine percent of student respondents were first-time undergraduates, around 5% were graduate students, and approximately 15% were undergraduate adult learners. The student demographics were accurately reflective of the student body of the institution, although the percentage of graduate students was disproportionately low.
With respect to the faculty and staff demographics, 32% of respondents reported that they were white, 77% were United States citizens, 76% reported being straight or heterosexual, 99% identified as cisgender, 61.5% were female, and 32.7% were male, with the rest either preferring not to say or identifying as nonbinary or gender fluid. Approximately 16.3% were tenured faculty, 20.2% were non-tenured faculty, 5.8% were adjuncts, 43.3% were staff, and 13.5% were administrators. When it came to religion, 39.5% identified as Christian or Protestant, 12.5% as agnostic or atheist, 11.5% as Catholic, 11.5% as spiritual but not religious, 10.6% preferred not to say, 5.8% as Islamic, and the remaining 8.6% were split among the World’s remaining major religions.
Cronbach’s alpha, also known as tau-equivalent reliability or coefficient alpha, is a reliability coefficient and a measure of the internal consistency of tests and measures. Cronbach’s alpha is the correlation between the answers in a questionnaire and can take values between 0 and 1. The higher the average correlation between items, the greater the internal consistency of a test, as follows:
- Excellent: A Cronbach’s alpha of 0.9 or higher.
- Good: A Cronbach’s alpha between 0.8 and 0.9.
- Acceptable: A Cronbach’s alpha between 0.7 and 0.8.
- Questionable: A Cronbach’s alpha between 0.6 and 0.7.
- Poor: A Cronbach’s alpha between 0.5 and 0.6.
- Unacceptable: A Cronbach’s alpha below 0.5.
The standard Cronbach’s alpha, which calculates reliability based on the average shared variance between items, and the Cronbach’s alpha based on standardized items, which calculates reliability based on the average inter-item correlation, were conducted. The analyses found all question sets to be in either the acceptable, good, or excellent range, These results are depicted in Table 1 and Table 2.

Table 1.
Cronbach’s alpha for student questions.
Table 2.
Cronbach’s alpha for faculty and staff questions.
A series of Likert scaled agreement questions looked at student satisfaction with the campus experience via a series of statements where 1 equaled strongly disagree and 5 equaled strongly disagree. The overall mean for the student group was 3.72 with an SD= 1.01 and CI = 0.091. The overall mean for the faculty and staff group was 4.04 with an SD = 1.098 and CI = 0.196. Reflections on the campus experience are represented in Table 3 and Table 4.
Table 3.
Perception of the campus experience of students.
Table 4.
Perception of the campus experience of faculty and staff.
Students were asked about the campus climate with respect to their overall satisfaction via a series of questions utilizing a scale of 1 to 5 where 1 equaled extremely dissatisfied and five equaled extremely satisfied, μ = 3.53, SD = 1.01, and CI = 0.09; and whether the campus is free from strain related to individual or group differences, μ= 3.59, SD = 0.875, and CI = 0.08. Faculty and staff were also asked about their overall satisfaction with the campus climate with the same scale, where μ = 3.75, SD = 1.09, and CI = 0.209; and whether the campus is free from strain related to individual or group differences where μ = 3.60, SD = 0.88, and CI = 0.209. Results are shown in Table 5 and Table 6.
Table 5.
Student satisfaction with the campus climate.
Table 6.
Faculty and staff satisfaction with the campus climate.
Respondents were asked their perceptions of the representation of different cultural groups. Students responded that there was adequate representation of different cultures on campus, μ = 3.73, SD = 0.908, and CI = 0.083, including the Indigenous people that once lived on the land that is now the campus, μ = 3.28, SD = 0.960, and CI = 0.088. Faculty and staff reported similar perceptions of the representation of different cultural groups, μ = 3.53, SD = 1.08, and CI = 0.208, but were more negative when it came to the representation of the Indigenous people that once lived on the land that is now the campus, μ = 2.76, SD = 1.12, and CI = 0.216. Results are presented in Table 7 and Table 8.
Table 7.
Student perception of representation.
Table 8.
Faculty and staff perception of representation.
With the results represented in Table 9, students were asked to reflect on their experiences at UMES: whereas 11.5% have personally experienced discrimination at UMES, 21.4% have witnessed discrimination against someone else at UMES, 17.5% have personally experienced harassment at UMES, and 25% have witnessed harassment against someone else. When asked “If you have witnessed or heard someone, make an insensitive or disparaging remark about a person or people based on their age, race, ethnicity, gender identify, or disability status from where did it come?” the responses were faculty (15%), students (43.8%), staff (15.5%), administrator (8.3%), and local community member (11.5%). When it comes to the targets of bias, the most commonly cited were people based on LGBTQIA+ status (23.8%), gender identity or expression (15%), race (12%), gender (10.2%), foreign-born people (7.6%), ethnicity (7.2%), not being religious (7%), and religious affiliation (6.3%).
Table 9.
Student experiences with discrimination and harassment.
Faculty and staff participants were also asked to reflect on their experiences at UMES with the results presented in Table 10: whereas 29% have personally experienced discrimination at UMES, 41% have witnessed discrimination against someone else at UMES, 24% have personally experienced harassment at UMES, and 30% have witnessed harassment against someone else. When asked “If you have witnessed or heard someone, make an insensitive or disparaging remark about a person or people based on their age, race, ethnicity, gender identify, or disability status from where did it come?” the responses were faculty (29.8%), students (36.2%), staff (23.1%), administrator (12.5%), and local community member (13%). When it comes to the targets of bias, the most commonly cited were people based on race (25%), gender (21.2%), LGBTQIA+ status (17.3%), being foreign-born (17.3%), not being religious (14.4%), ethnicity (12.5%), and gender identity or expression (11.5%).
Table 10.
Faculty and staff experiences with discrimination and harassment.
- R1
- Do all community members consider the campus inclusive?
Student participants were asked to rank the UMES campus community for inclusivity on a sliding scale where 0 equaled extremely hostile and not inclusive and 100 equaled extremely inclusive. According to the analyses and with the results represented in Table 11, a mean of 65.1 was achieved with an SD of 21.74 and a CI of 1.97. Faculty and staff respondents were also asked to rank the UMES campus community for inclusivity on the same sliding scale. According to the analyses, and with 102 people responding, a mean of 71.85 was achieved with an SD of 21.51 and a CI of 4.05.
Table 11.
Inclusivity.
- R2
- Do all community members experience a culture of belonging?
Presented in Table 12 and Table 13, perceptions of belonging were measured. Student perceptions of belonging were explored through three agreement questions where 1 equaled strongly disagree and 5 equaled strongly disagree, μ = 3.51, SD = 0.969, and CI = 0.088. Meanwhile, faculty and staff perceptions of belonging were explored through two agreement questions where people were asked if all members of the UMES community experience a sense of belonging (μ = 3.11, SD = 1.13, and CI = 0.217) and if the campus frequently has events designed to promote belonging (μ = 3.29, SD = 1.15, and CI = 0.221).
Table 12.
Student perceptions of belonging.
Table 13.
Faculty and staff perceptions of belonging.
- R3
- Are there adequate resources and supports for all members of the campus to succeed?
Student perceptions of supports are presented in Table 14 and were explored through a nine agreement question series where μ = 3.49, SD = 0.954, and CI = 0.087. Faculty and staff perceptions of supports are presented in Table 15 and were explored through an eight agreement question series where μ = 3.13, SD = 1.12, and CI = 0.212.
Table 14.
Student perceptions of supports.
Table 15.
Faculty and staff perceptions of supports.
Students reflected upon the adequacy of a number of resources for supporting minoritized populations where μ = 3.51, SD = 0.868, and CI = 0.0794. These results are presented in Table 16.
Table 16.
Student perceptions of resources.
- R4
- Do faculty exhibit culturally responsive teaching practices?
Culturally responsive teaching practices are strategies in which the students’ unique cultural strengths are identified and nurtured to promote student achievement and a sense of well-being [7]. Eight Likert-scale agreement questions were used to measure the culturally responsive teaching experiences of students where μ = 4.00, SD = 1.08, and CI = 0.206. Results are presented in Table 17.
Table 17.
Culturally responsive teaching experiences of students.
Culturally responsive teaching is also known as culturally compatible, culturally appropriate, culturally congruent, and/or culturally relevant teaching [7]. Fifteen Likert-scale agreement questions were used to measure culturally responsive teaching of faculty respondents where μ = 4.00, SD = 1.08, and CI = 0.206. Only faculty were given these questions with the responses displayed in Table 18.
Table 18.
Culturally responsive teaching practices of faculty.
- R5
- Do faculty and staff differ in their perceptions?
Analyses were run to consider differences among faculty and staff and student responses with respect to respondent perceptions of inclusiveness and campus climate satisfaction. Spearman’s rank correlation coefficients also known as Spearman’s Rho were prepared to determine whether there is a monotonic component of association. Monotonic relationships occur when one thing goes up or down with the other. Chi-squares were also conducted. A chi-square is a common inferential statistical test used to examine the differences between categorical variables. This test aims to determine if a difference between observed data and expected data is due to chance or if it is due to a relationship between the variables. The Spearman’s rank-order correlations did not find a strong, positive correlation, rs = 0.128 and p = 0.003, and rs = 0.107 and p = 0.012. With respect to the chi-square, significance was also not found when it came to perceived inclusivity, p = 0.106, but significance was found when satisfaction with the campus climate was considered, p = 0.002. These findings are presented in Table 19.
Table 19.
Correlations.
5. Discussion
The purpose of this study was to explore DEI and culturally responsive teaching on the campus of a Historically Black College or University (HBCU) located in the Mid-Atlantic United States, via a comprehensive DEI climate study. The goal of the study was to help address the gap in the DEI literature with respect to the practices of minority-serving institutions. Two surveys were created, one for students and another for faculty and staff. Survey creation involved a comprehensive review of the literature and existing studies and instrumentation, and consultation with experts. Survey drafts went through two separate carefully curated expert panels prior to IRB approval and the conduction of pilot testing.
Prior to distribution, a sample size calculator was utilized with the confidence interval set to 95% and the margin of error set to 5%. Based on the calculation, the desired sample size for students was 342 and the recommended sample size for faculty and staff was 227. In total, 455 students completed the survey along with 104 faculty and staff. After data collection was concluded, descriptive statistical analyses including the mean, standard deviation, frequency distribution, and confidence interval were conducted. Reliability testing was also conducted using Cronbach’s alpha application, and chi-square tests and Spearman’s rank correlation coefficients were prepared.
Based on consideration of the means, standard deviations, and confidence intervals, student participants indicated that the University is inclusive with most students expressing that all community members experience a sense of belonging. Faculty and staff respondents were more strongly positive in their opinion that the university is inclusive and were also in agreement that all members of the community experience a sense of belonging. These findings are in agreement with what has been reported in the literature: that HBCUs are unparalleled as exemplars of DEI [7,54,55] that should serve as a model for institutions across the globe with a commitment to inclusivity [47]. These results are also explained with social cognitive theory and psychological safety theory where learning involves an interplay between our beliefs, expectations, environmental influences, self-efficacy, and relationships; and individuals thrive in environments where they feel safe to express themselves without fear [6,48,51].
Most students expressed that they have experienced adequate support and resources; however, faculty and staff were more tempered regarding the adequacy of supports and resources. More specifically, a negative perception was indicated when it came to support for disabled and transgender members of the campus community. Faculty also expressed dissatisfaction regarding the representation of Indigenous people on the UMES campus. These finds are consistent with what has been reported by Herr-Perrin [47] who points out that despite being designed as “sanctuaries of inclusivity in the midst of an otherwise hostile society, HBCUs are not flawless DEI models and are also impacted by such issues as discrimination towards LGBTQIA+ students and other threats to inclusion and belonging.” From a theoretical perspective, the negative perceptions expressed can be related to multiple minority stress and, more specifically, intersectional theory, which explains that people belonging to multiple minority groups often face compounding and intersecting stressors [50].
When culturally responsive teaching practices were explored, both students and faculty responded in strong agreement. In terms of culturally responsive teaching practices, these findings provide valuable confirmation of what is already expressed in the literature, which has reported that HBCUs have an unparalleled longstanding history of culturally responsive teaching practices that were in place decades before the term was formally introduced [6,7,47]. As Brock and Slater [46] explained, this is because HBCUs have cultivated “humanistic” environments for student learning where students recognize that they are valued, resulting in a strong sense of belonging being felt by students, meaningful relationships between faculty and students, and an overall commitment to equity. Further, these findings support the theory of critical pedagogy which posits that issues of social justice are not distinct from teaching and learning and that education can influence social transformation by encouraging learners to challenge oppressive structures and become agents of change [53].
When an effort was made to explore whether perceptions of faculty and staff differ significantly from those of students, Spearman’s rank-order correlations and chi-square significance tests were performed. The Spearman’s rank was not significant, and chi-square did not find significance when it comes to perceived inclusivity, but significance was found when satisfaction with the campus climate was considered. Overall, and due to the self-selection bias and the non-statistically significant population size of the faculty and staff respondents, this line of exploration is considered both inconclusive and unreliable.
To inform the institution and elicit recommendations, a short-answer qualitative question was added to each survey asking how the institution could better support DEI and cultivate a culture of belonging and inclusion. Semantic analysis was conducted using two methods. First, the semantic analysis AI tools in Survey Monkey were utilized, which include a thematic analysis tool that uses machine learning to automatically categorize text responses and generate themes. Second, the researchers engaged in a human controlled manual semantic recoding and categorization process. The results of both methods were compared for similarity and to finalize themes. When thematic analysis and semantic recoding were performed on students’ responses, the most common themes included hosting more community events or activities, more LGBTQIA+ supports, more awareness and commitment, conducting listening sessions or town halls, and offering more training or workshops. The themes generated from the student short-answer responses are represented in Table 20.
Table 20.
Sentiment analysis of student responses.
When thematic analysis and semantic recoding were performed on faculty and staff responses, the most common themes included more celebrations of diversity, workshops or professional development, more commitment to DEI, greater support for culturally responsive teaching and JEDI course content, less religion or emphasis on Christian values, and incentives for faculty. The themes generated from the faculty and staff short-answer responses are represented in Table 21.
Table 21.
Sentiment analysis of faculty and staff responses.
6. Limitations
The most notable limitation of this study is that it occurred at a singular minority-serving institution located in the Mid-Atlantic region of the United States even though the DEI climate studies in the literature were almost always conducted at single institutions. The limitation can easily be addressed by future research that expands the scope of this examination so as to include majority-serving institutions as well as additional institutions from more parts of the world. The second limitation of this study lies with the faculty and staff participants who self-selected their participation by responding to an email, which generally leads to self-selection bias.
7. Conclusions
The purpose of this study was to help address the gap in the DEI literature exploring the practices of HBCUs and other types of minority-serving institutions. According to the results, participants found the University to be an inclusive place, expressing strong satisfaction with the campus climate and experience. Further, when the presence of culturally responsive teaching practices was explored, strong evidence was indicated. Possible areas for improvement include greater supports and resources for LGBTQIA+, Indigenous, and disabled community members.
Thyden et al. [56] postulate that while Historically Black Colleges and Universities (HBCUs) were founded on antiracism, many predominantly White institutions (PWIs) were founded on exclusionary tactics that uphold white supremacy. They explain that, as a result, Black students at HBCUs experience less structural racism than Black students at PWIs with increased social supports [56,57] and more positive student mental health outcomes [58]. At the same time, some scholars point out that HBCUs may exist within a larger “white supremacist society” [56] as indicated by underfunding when it comes to state, federal, and private money, which impacts all aspects of the teaching, learning, and overall student experience [59,60]. Additionally, the success of HBCUs occurs despite Black students at HBCUs arriving on these venerated campuses with lower high-school grades, lower standardized test scores, and parents with less education and lower incomes compared with Black students at majority-serving institutions [61].
In order to dive deeper into a number of important topics and themes that emerged from this investigation, a series of focus groups and a town hall are currently being planned on the UMES campus. It is hoped that these listening and investigative sessions will engender meaningful critical discourse that results in tangible action items that can be implemented by the institution.
It is the goal of the authors for this paper to contribute to the body of literature on DEI in higher education. It is also hoped that this paper will inspire more institutions to engage in similar DEI climate studies. Instruments that have performed well when reliability testing was conducted have been introduced and are being made available by the authors for free usage provided proper attribution is given. More campuses need to engage in comprehensive climate studies in order to evaluate whether their campuses are inclusive communities where all members experience a sense of belonging, supports and resources promote equity, diversity is celebrated, and culturally responsive teaching is embraced.
Author Contributions
Conceptualization N.H. and K.Q.; methodology, N.H.; software, N.H.; validation, N.H.; formal analysis, N.H.; investigation, N.H.; resources, N.H. and K.Q.; data curation, K.Q.; writing—original draft preparation, N.H.; writing—review and editing, N.H.; visualization, N.H.; supervision, N.H.; project administration, N.H. and K.Q.; funding acquisition, K.Q. All authors have read and agreed to the published version of the manuscript.
Funding
This research received no external funding.
Institutional Review Board Statement
The study was conducted in accordance with the Declaration of Helsinki, and approved by the Institutional Review Board of the University of Maryland Eastern Shore IRB (approval number: #10-2024-001) on 1 June 2024.
Informed Consent Statement
Informed consent was obtained from all subjects involved in the study.
Data Availability Statement
The original contributions presented in this study are included in the article. Further inquiries can be directed to the corresponding author(s).
Conflicts of Interest
The authors declare no conflicts of interest.
Appendix A
Table A1.
Student demographics.
Table A1.
Student demographics.
| Age | % |
| 18–24 | 88.7 |
| 25–34 | 5.2 |
| 35–44 | 1.3 |
| 45–54 | 2.6 |
| 55–64 | 0.9 |
| Prefer not to say | 0.4 |
| Race/Ethnicity | |
| African (not African American) | 11.2 |
| Asian/Pacific Islander | 1.7 |
| Black or African American | 59 |
| Caribbean/West Indies | 2.6 |
| Hispanic or LatinX | 2.6 |
| Middle Eastern | 0.7 |
| Multiple Ethnicities/Two or More Races | 7.4 |
| Prefer not to say | 1.3 |
| Indigenous | 0.9 |
| White/Caucasian | 9.8 |
| Were you born in the United States? | |
| No | 14.2 |
| Prefer not to say | 0.9 |
| Yes | 83.7 |
| Military Service | |
| No, I have not | 96.9 |
| Prefer not to say | 0.9 |
| Yes, I have | 0.7 |
| Religion | |
| Prefer not to say | 12.6 |
| Protestantism | 1.7 |
| Catholicism | 10.2 |
| Christianity | 54.7 |
| Islam | 5.7 |
| Judaism | 0.9 |
| Buddhism | 1.3 |
| Hinduism | 0.4 |
| Inter/Nondenominational | 0.9 |
| Church of Jesus Christ and Later Day Saints | 0.2 |
| Spiritual but not religious | 7.2 |
| Agnostic | 4.8 |
| Atheist | 4.4 |
| Jehovah’s Witness | 0.7 |
| Sikh | 0.4 |
| Bahai | 0.6 |
| Other | 12 |
| Are you a person living with a disability? | |
| No | 78.9 |
| Prefer not to say | 6.3 |
| Yes | 13.3 |
| Do you currently have a physical or mental impairment that SIGNIFICANTLY limits one or more major life activities such as seeing, hearing, learning, interacting with others, walking, etc.? | |
| No | 81 |
| Prefer not to say | 3.7 |
| Yes | 13.3 |
| Sexual Orientation | |
| Prefer not to say | 4.1 |
| Straight or Heterosexual | 74.3 |
| Asexual or Demisexual | 2.2 |
| Bisexual | 9.4 |
| Gay | 2 |
| Lesbian | 2 |
| Pansexual | 5 |
| Questioning | 2.2 |
| Queer | 2.8 |
| Gender Identify | |
| Female | 51.9 |
| Male | 41.8 |
| Nonbinary/gender fluid | 4 |
| Prefer not to say | 1 |
| Other | 0.2 |
| Do you personally identify as a transgender or as a gender non-conforming person? | |
| No | 92 |
| Prefer not to say | 2.4 |
| Yes | 4.5 |
| Are you a first-generation college student? | |
| No | 55.3 |
| Yes | 43.5 |
| What describes your status? | |
| First Time Undergraduate | 79 |
| Graduate Student | 4.6 |
| Undergraduate Adult Learner | 15.3 |
| How long have you been a student? | |
| 1 year | 47.3 |
| 2 years | 20 |
| 3 years | 14.4 |
| 4 years | 12 |
| 5 or more years | 2.4 |
| I prefer not to say | 2.8 |
| In which school are you enrolled? | |
| Agriculture & Natural Sciences | 25 |
| Business & Technology | 46.8 |
| Education, Social Sciences, and the Arts | 11.5 |
| Graduate Studies | 2.8 |
| Pharmacy and Health Professions | 8.7 |
| Other | 3.9 |
Table A2.
Faculty and staff demographics.
Table A2.
Faculty and staff demographics.
| Age | % |
| 18–24 | 1.9 |
| 25–34 | 2.7 |
| 35–44 | 23.1 |
| 45–54 | 26.0 |
| 55–64 | 25.0 |
| 65–74 | 11.5 |
| Prefer not to say | 3.8 |
| Race/Ethnicity | % |
| African (not African American) | 4.8 |
| Asian/Pacific Islander | 5.8 |
| Black or African American | 31.7 |
| Caribbean/West Indies | 1.0 |
| Hispanic or LatinX | 2.9 |
| Middle Eastern | 1.9 |
| Multiple Ethnicities/Two or More Races | 5.8 |
| Prefer not to say | 11.5 |
| White/Caucasian | 32.7 |
| Citizenship | |
| No | 19 |
| Prefer not to say | 6 |
| Yes | 77 |
| Military Service | % |
| No, I have not | 93.3 |
| Prefer not to say | 1.9 |
| Yes, I have | 3.8 |
| Religion | % |
| Prefer not to say | 10.6 |
| Protestantism | 5.8 |
| Catholicism | 11.5 |
| Christianity | 33.7 |
| Islam | 5.8 |
| Buddhism | 1.9 |
| Hinduism | 2.9 |
| Inter/Nondenominational | 2.9 |
| Spiritual but not religious | 11.5 |
| Agnostic | 5.8 |
| Atheist | 6.7 |
| Jehovah’s Witness | 1.0 |
| Bahai | 1.0 |
| Seventh-Day Adventist | 1.0 |
| Universalist | 1.0 |
| Are you a person living with a disability | |
| No | 81.0 |
| Prefer not to say | 6.0 |
| Yes | 14% |
| Do you currently have a physical or mental impairment that SIGNIFICANTLY limits one or more major life activities such as seeing, hearing, learning, interacting with others, walking, etc.? | % |
| No | 86.5 |
| Prefer not to say | 7.7 |
| Yes | 3.8 |
| Sexual Orientation | % |
| Prefer not to say | 6.7 |
| Straight or Heterosexual | 76.0 |
| Asexual or Demisexual | 1.9 |
| Bisexual | 8.7 |
| Lesbian | 2.9 |
| Pansexual | 1.9 |
| Questioning | 1.9 |
| Queer | 1.0 |
| Gender Identify | % |
| Female | 61.5 |
| Male | 32.7 |
| Nonbinary/gender fluid | 1.9 |
| Prefer not to say | 1.9 |
| Do you personally identify as a transgender or as a gender non-conforming person | % |
| No | 99 |
| Prefer not to say | 2 |
| Yes | 2 |
| What most closely represents your primary role at UMES? | % |
| Adjunct | 5.8 |
| Administrator | 13.5 |
| Non-Tenured Faculty | 20.2 |
| Staff | 43.3 |
| Tenured Faculty | 16.3 |
| In which school or part of the university are you affiliated? | % |
| Agriculture & Natural Sciences | 13.5 |
| Business & Technology | 14.4 |
| Education, Social Sciences, and the Arts | 15.4 |
| Graduate Studies | 1.9 |
| Other | 5.8 |
| Pharmacy and Health Professions | 22.1 |
| Research & Outreach | 6.7 |
| Student Support | 17.3 |
References
- Arsel, Z.; Crockett, D.; Scott, M. Diversity, equity, and inclusion (DEI) in the Journal of Consumer Research: A curation and research agenda. J. Consum. Res. 2022, 48, 920–933. [Google Scholar] [CrossRef]
- McKinsey & Company. What Is Diversity, Equity, and Inclusion. 17 August 2022. Available online: https://www.mckinsey.com/featured-insights/mckinsey-explainers/what-is-diversity-equity-and-inclusion (accessed on 14 November 2024).
- U.S. Office of Personnel Management. Federal Employee Viewpoint Survey Results. 2023. Available online: https://www.opm.gov/fevs/reports/governmentwide-reports/governmentwide-reports/governmentwide-management-report/2023/2023-governmentwide-management-report.pdf (accessed on 14 November 2024).
- Trainor, C. Dear Colleague Letter SFFA v Harvard. U.S. Department of Education. 2025. Available online: https://www.ed.gov/media/document/dear-colleague-letter-sffa-v-harvard-109506.pdf (accessed on 17 February 2025).
- McGowan, B.L.; Hopson, R.; Epperson, L.; Leopold, M. Navigating the backlash and reimagining diversity, equity, and inclusion in a changing sociopolitical and legal landscape. J. Coll. Character 2024, 26, 1–11. [Google Scholar] [CrossRef]
- Buzzetto-Hollywood, N.; Quinn, K. Designing and validating a comprehensive institution wide DEI needs assessment. Issues Informing Sci. Inf. Technol. 2025, 22, 006. [Google Scholar] [CrossRef]
- Buzzetto-Hollywood, N. Decolonization and culturally responsive teaching practices and the role of Historically Black Colleges and Universities. J. Educ. Hum. Dev. 2023, 12, 1–15. [Google Scholar] [CrossRef]
- Ocampo, M. A Brief History of Educational Inequality from Apartheid to the Present. 2004. Available online: https://web.stanford.edu/~jbaugh/saw/Lizet_Education_Inequity.html (accessed on 12 April 2025).
- Go, A. Addressing Current Trends in Business and Education Management: The Diversity, Equity, and Inclusion (DEI) and “Woke” Landscape. 2024. Available online: https://www.linkedin.com/pulse/addressing-current-trends-business-education-management-alan-go-ichzc/ (accessed on 12 August 2025).
- Baker, T.L.; Hunt, T.G.; Andrews, M.C. Promoting ethical behavior and organizational citizenship behaviors: The influence of corporate ethical values. J. Bus. Res. 2006, 59, 849–857. [Google Scholar] [CrossRef]
- Kayyali, M. Equity, equality, diversity, and inclusion as key performance indicators in higher education. Int. J. Manag. Sci. Innov. Technol. 2022, 3, 1–2. [Google Scholar]
- Hooks, B. Feminism Is for Everybody: Passionate Politics; Pluto Press: London, UK, 2000. [Google Scholar]
- Keshtiban, A.; Gatto, M.; Callahan, J.L. Trojan horses: Creating a positive hidden (extra)curriculum through a Justice, Equality, Diversity and Inclusion (JEDI) initiative. Manag. Learn. 2023, 54, 338–358. [Google Scholar] [CrossRef]
- Lierman, A.; Rele, S.; Kennedy, S.; Naqvi, M.; Bogino, M.; Davidian, C.; An, S. An Equity Audit for DEI Data in an Academic Library. In Proceedings of the 2022 Library Assessment Conference, Virtual, 1–3 November 2022; Available online: https://www.libraryassessment.org/wp-content/uploads/2022/10/119-Lierman-An-Equity-Audit-for-DEI-Data.pdf (accessed on 14 November 2024).
- Tzanakou, C.; Pearce, R. Moderate feminism within or against the neoliberal university? The example of Athena SWAN. Gend. Work. Organ. 2019, 26, 1191–1211. [Google Scholar] [CrossRef]
- Bhopal, K. White Privilege: The Myth of a Post-Racial Society; Policy Press: Bristol, UK, 2019. [Google Scholar] [CrossRef]
- Student Experience Project. Increasing Equity in College Student Experience: Findings from a National Collaborative. 2022. Available online: https://studentexperienceproject.org/report/ (accessed on 14 November 2024).
- Insight Into Academia. An INSIGHT Investigation: Accounting for Just 0.5% of Higher Education’s Budgets, Even Minimal Diversity Funding Supports Their Bottom Line. 2019. Available online: https://insightintoacademia.com/an-insight-investigation-accounting-for-just-0-5-of-higher-educations-budgets-even-minimal-diversity-funding-supports-their-bottom-line/ (accessed on 14 November 2024).
- Institute for Higher Education Policy. How Student Experience and Belonging Interventions Can Support Strong Postsecondary Outcomes. Available online: https://www.ihep.org/publication/student-experience-and-belonging-strong-outcomes/ (accessed on 14 November 2024).
- Harper, S.; Chang, M.J.; Cole, E.R.; Davis, L.P.; Garces, L.M.; Gayles, J.G.; Jenkins, T.S.; Kimbrough, W.M.; Park, J.J.; Saenz, V.B.; et al. Truths About DEI on College Campuses: Evidence-Based Expert Responses to Politicized Misinformation; University of Southern California Race and Equity Center: Los Angeles, CA, USA, 2024; Available online: https://race.usc.edu/wp-content/uploads/2024/03/Harper-and-Associates-DEI-Truths-Report.pdf (accessed on 21 February 2025).
- Diversity.com. Debunking the Myth: DEI Doesn’t Mean Lowering Hiring Standards. Available online: https://diversity.com/post/dei-doesnt-lower-hiring-standards (accessed on 14 November 2024).
- Chetty, D. Culturally responsive pedagogy: Working towards decolonization, indigeneity and interculturalism. Educ. Rev. 2018, 70, 530–531. [Google Scholar] [CrossRef]
- King, J.E. (Ed.) Black Education: A Transformative Research and Action Agenda for the New Century; Routledge: Abingdon, UK, 2006. [Google Scholar]
- Owens, L.; Njoku, N. Culturally Relevant Practice: Implementation Among Historically Black Colleges and Universities. UNCF Frederick D. Patterson Research Institute. 2021. Available online: https://eric.ed.gov/?id=ED610999 (accessed on 14 November 2024).
- Gay, G. Culturally Responsive Teaching: Theory, Research, and Practice; Teachers College Press: New York, NY, USA, 2000. [Google Scholar]
- Lynch, M. What Is Culturally Responsive Pedagogy? Huffpost, 14 December 2011. Available online: http://www.huffingtonpost.com/matthew-lynch-edd/culturally-responsive-pedagogy_b_1147364.html (accessed on 5 February 2025).
- Ladson-Billings, G. Toward a theory of culturally relevant pedagogy. Am. Educ. Res. J. 1995, 32, 465–491. [Google Scholar] [CrossRef]
- Gay, G. Teaching to and through cultural diversity. Curric. Inq. 2013, 43, 48–70. [Google Scholar] [CrossRef]
- Hollins, E.R.; Oliver, E.I. Pathways to Success in School: Culturally Responsive Teaching; Routledge: Abingdon, UK, 1999. [Google Scholar] [CrossRef]
- Nieto, S. Language, Culture, and Teaching: Critical Perspectives, 2nd ed.; Taylor & Francis: Abingdon, UK, 2010. [Google Scholar]
- Stembridge, A. Culturally Responsive Education in the Classroom; Routledge: Abingdon, UK, 2019. [Google Scholar] [CrossRef]
- Bui, Y.N.; Fagan, Y.M. The effects of an integrated reading comprehension strategy: A culturally responsive teaching approach for fifth-grade students’ reading comprehension. Prev. Sch. Fail. Altern. Educ. Child. Youth 2013, 57, 59–69. [Google Scholar] [CrossRef]
- Au, K.H.; Kawakami, A.J. Cultural congruence in instruction. In Teaching Diverse Populations: Formulating a Knowledge Base; Hollins, E.R., King, J.E., Hayman, W.C., Eds.; State University of New York Press: Albany, NY, USA, 1994. [Google Scholar]
- Byrd, C.M. Does culturally relevant teaching work? An examination from student perspectives. SAGE Open 2016, 6, 1–10. [Google Scholar] [CrossRef]
- Banks, J.A.; Banks, C.A.M. Multicultural Education: Issues and Perspectives, 4th ed.; Wiley: Hoboken, NJ, USA, 2001. [Google Scholar]
- Martell, C.C. Race and histories: Examining culturally relevant teaching in the U.S. history classroom. Theory Res. Soc. Educ. 2013, 41, 65–88. [Google Scholar] [CrossRef]
- Cabrera, N.L.; Milem, J.F.; Jaquette, O.; Marx, R.W. Missing the (student achievement) forest for all the (political) trees: Empiricism and the Mexican American studies controversy in Tucson. Am. Educ. Res. J. 2014, 51, 1084–1118. [Google Scholar] [CrossRef]
- Christianakis, M. Hybrid texts fifth graders, rap music, and writing. Urban Educ. 2011, 46, 1131–1168. [Google Scholar] [CrossRef]
- Ensign, J. Including culturally relevant math in an urban school. Educ. Stud. 2003, 34, 414–423. [Google Scholar]
- Gutstein, E. Teaching and learning mathematics for social justice in an urban, Latino school. J. Res. Math. Educ. 2003, 34, 37–73. [Google Scholar] [CrossRef]
- Milner, H.R. Culturally relevant pedagogy in a diverse urban classroom. Urban Rev. 2011, 43, 66–89. [Google Scholar] [CrossRef]
- Christian, S. Culturally Responsive Teaching and Student Self-Efficacy in Alaskan Middle Schools. Ph.D. Thesis, University of Alaska Fairbanks, Fairbanks, AK, USA, 2017. Available online: https://core.ac.uk/download/pdf/162579412.pdf (accessed on 14 November 2024).
- Aronson, B.; Laughter, J. The theory and practice of culturally relevant education: A synthesis of research across content areas. Rev. Educ. Res. 2016, 86, 163–206. [Google Scholar] [CrossRef]
- Buzzetto-Hollywood, N.; Mitchell, B.C. Grit and persistence: Findings from a longitudinal study of student performance. Issues Informing Sci. Inf. Technol. 2019, 16, 377–391. [Google Scholar] [CrossRef] [PubMed]
- Schexnider, A. Governance and the Future of Black Colleges. Inside Higher Education, 20 December 2017. Inside Higher Education, 20 December 2017. Available online: https://www.insidehighered.com/views/2017/12/20/struggling-hbcus-must-consider-new-options-survival-opinion (accessed on 14 November 2024).
- Brock, T.; Slater, D. Strategies for Improving Postsecondary Credential Attainment Among Black, Hispanic, and Native American Adults. Community College Research Center. 2021. Available online: https://files.eric.ed.gov/fulltext/ED612689.pdf (accessed on 21 February 2025).
- Herr-Perrin, A. JEDI is Trending in Higher Education. But HBCUs Have Modeled It All Along. Diverse: Issues in Higher Education. 22 December 2021. Available online: https://www.diverseeducation.com/opinion/article/15286615/jedi-is-trending-in-higher-education-but-hbcus-have-modeled-it-all-along (accessed on 14 November 2024).
- Nickerson, C. Albert Bandura’s Social Cognitive Theory. Simply Psychology. Available online: https://www.simplypsychology.org/social-cognitive-theory.html (accessed on 14 November 2024).
- YW Boston. What Is Intersectionality, and What Does It Have to Do with Me? 2017. Available online: https://www.ywboston.org/what-is-intersectionality-and-what-does-it-have-to-do-with-me/ (accessed on 6 May 2022).
- Crenshaw, K. Demarginalizing the Intersection of Race and Sex: A Black Feminist Critique of Antidiscrimination Doctrine, Feminist Theory and Antiracist Politics. University of Chicago Legal Forum. 1989. Available online: https://chicagounbound.uchicago.edu/cgi/viewcontent.cgi?article=1052&context=uclf (accessed on 17 April 2021).
- Newman, A.; Donahue, R.; Nathan, E. Psychological safety: A systematic review of the literature. Hum. Resour. Manag. Rev. 2017, 27, 521–535. [Google Scholar] [CrossRef]
- Akkari, A.; Mesquida, P. Paulo Freire: Building a Multicultural Pedagogy for Silenced Voices. In Educational Theories and Practices from the Majority World; Dasen, P.R., Akkari, A., Eds.; SAGE Publications India Pvt Ltd.: New Delhi, India, 2008; pp. 329–345. [Google Scholar] [CrossRef]
- Giroux, H. Utopian thinking in dangerous times: Critical pedagogy and the project of educated hope. In Utopian Pedagogy: Radical Experiments Against Neoliberal Globalization; Cote, M., Day, R.J.F., de Peuter, G., Eds.; University of Toronto Press: Toronto, ON, Canada, 2007; pp. 25–42. [Google Scholar] [CrossRef]
- Hart, J.; Fellabaum, J. Analyzing campus climate studies: Seeking to define and understand. J. Divers. High. Educ. 2008, 1, 222–234. [Google Scholar] [CrossRef]
- Peterson, M.W.; Spencer, M.G. Understanding academic culture and climate. New Dir. Institutional Res. 1990, 1990, 3–18. [Google Scholar] [CrossRef]
- Thyden, N.H.; McGuire, C.; Slaughter-Acey, J.; Widome, R.; Warren, J.R.; Osypuk, T.L. Estimating the Long-Term Causal Effects of Attending Historically Black Colleges or Universities on Depressive Symptoms. Am. J. Epidemiol. 2023, 192, 356–366. [Google Scholar] [CrossRef] [PubMed]
- Watkins, D.C.; Green, B.L.; Goodson, P.; Guidry, J.J.; Stanley, C.A. Using focus groups to explore the stressful life events of Black college men. J. Coll. Stud. Dev. 2007, 48, 105–118. [Google Scholar] [CrossRef]
- Carter, R.T.; Lau, M.Y.; Johnson, V.; Kirkinis, K. Racial discrimination and health outcomes among racial/ethnic minorities: A meta-analytic review. J. Multicult. Couns. Dev. 2017, 45, 232–259. [Google Scholar] [CrossRef]
- Sav, G.T. Funding historically Black colleges and universities: Progress toward equality? J. Educ. Financ. 2010, 35, 295–307. [Google Scholar] [CrossRef]
- Outcalt, C.L.; Skewes-Cox, T.E. Involvement, interaction, and satisfaction: The human environment at HBCUs. Rev. High. Educ. 2002, 25, 331–347. [Google Scholar] [CrossRef]
- Kim, M.M. Historically Black vs. White institutions: Academic development among Black students. Rev. High. Educ. 2002, 25, 385–407. [Google Scholar] [CrossRef]
Disclaimer/Publisher’s Note: The statements, opinions and data contained in all publications are solely those of the individual author(s) and contributor(s) and not of MDPI and/or the editor(s). MDPI and/or the editor(s) disclaim responsibility for any injury to people or property resulting from any ideas, methods, instructions or products referred to in the content. |
© 2025 by the authors. Licensee MDPI, Basel, Switzerland. This article is an open access article distributed under the terms and conditions of the Creative Commons Attribution (CC BY) license (https://creativecommons.org/licenses/by/4.0/).