
Investigating Graduate Students’ Experiences through Structural Equation Modeling (SEM)


Abstract
:1. Introduction
1.1. Underrepresented Groups
1.1.1. First-Generation College Students
1.1.2. Underrepresented Minorities and Females
1.1.3. STEM Majors
1.2. Campus Climate
1.2.1. Sense of Belonging
1.2.2. Imposter Syndrome
1.2.3. Mentoring
1.2.4. Microaggressions and Microaffirmations
1.2.5. Summary
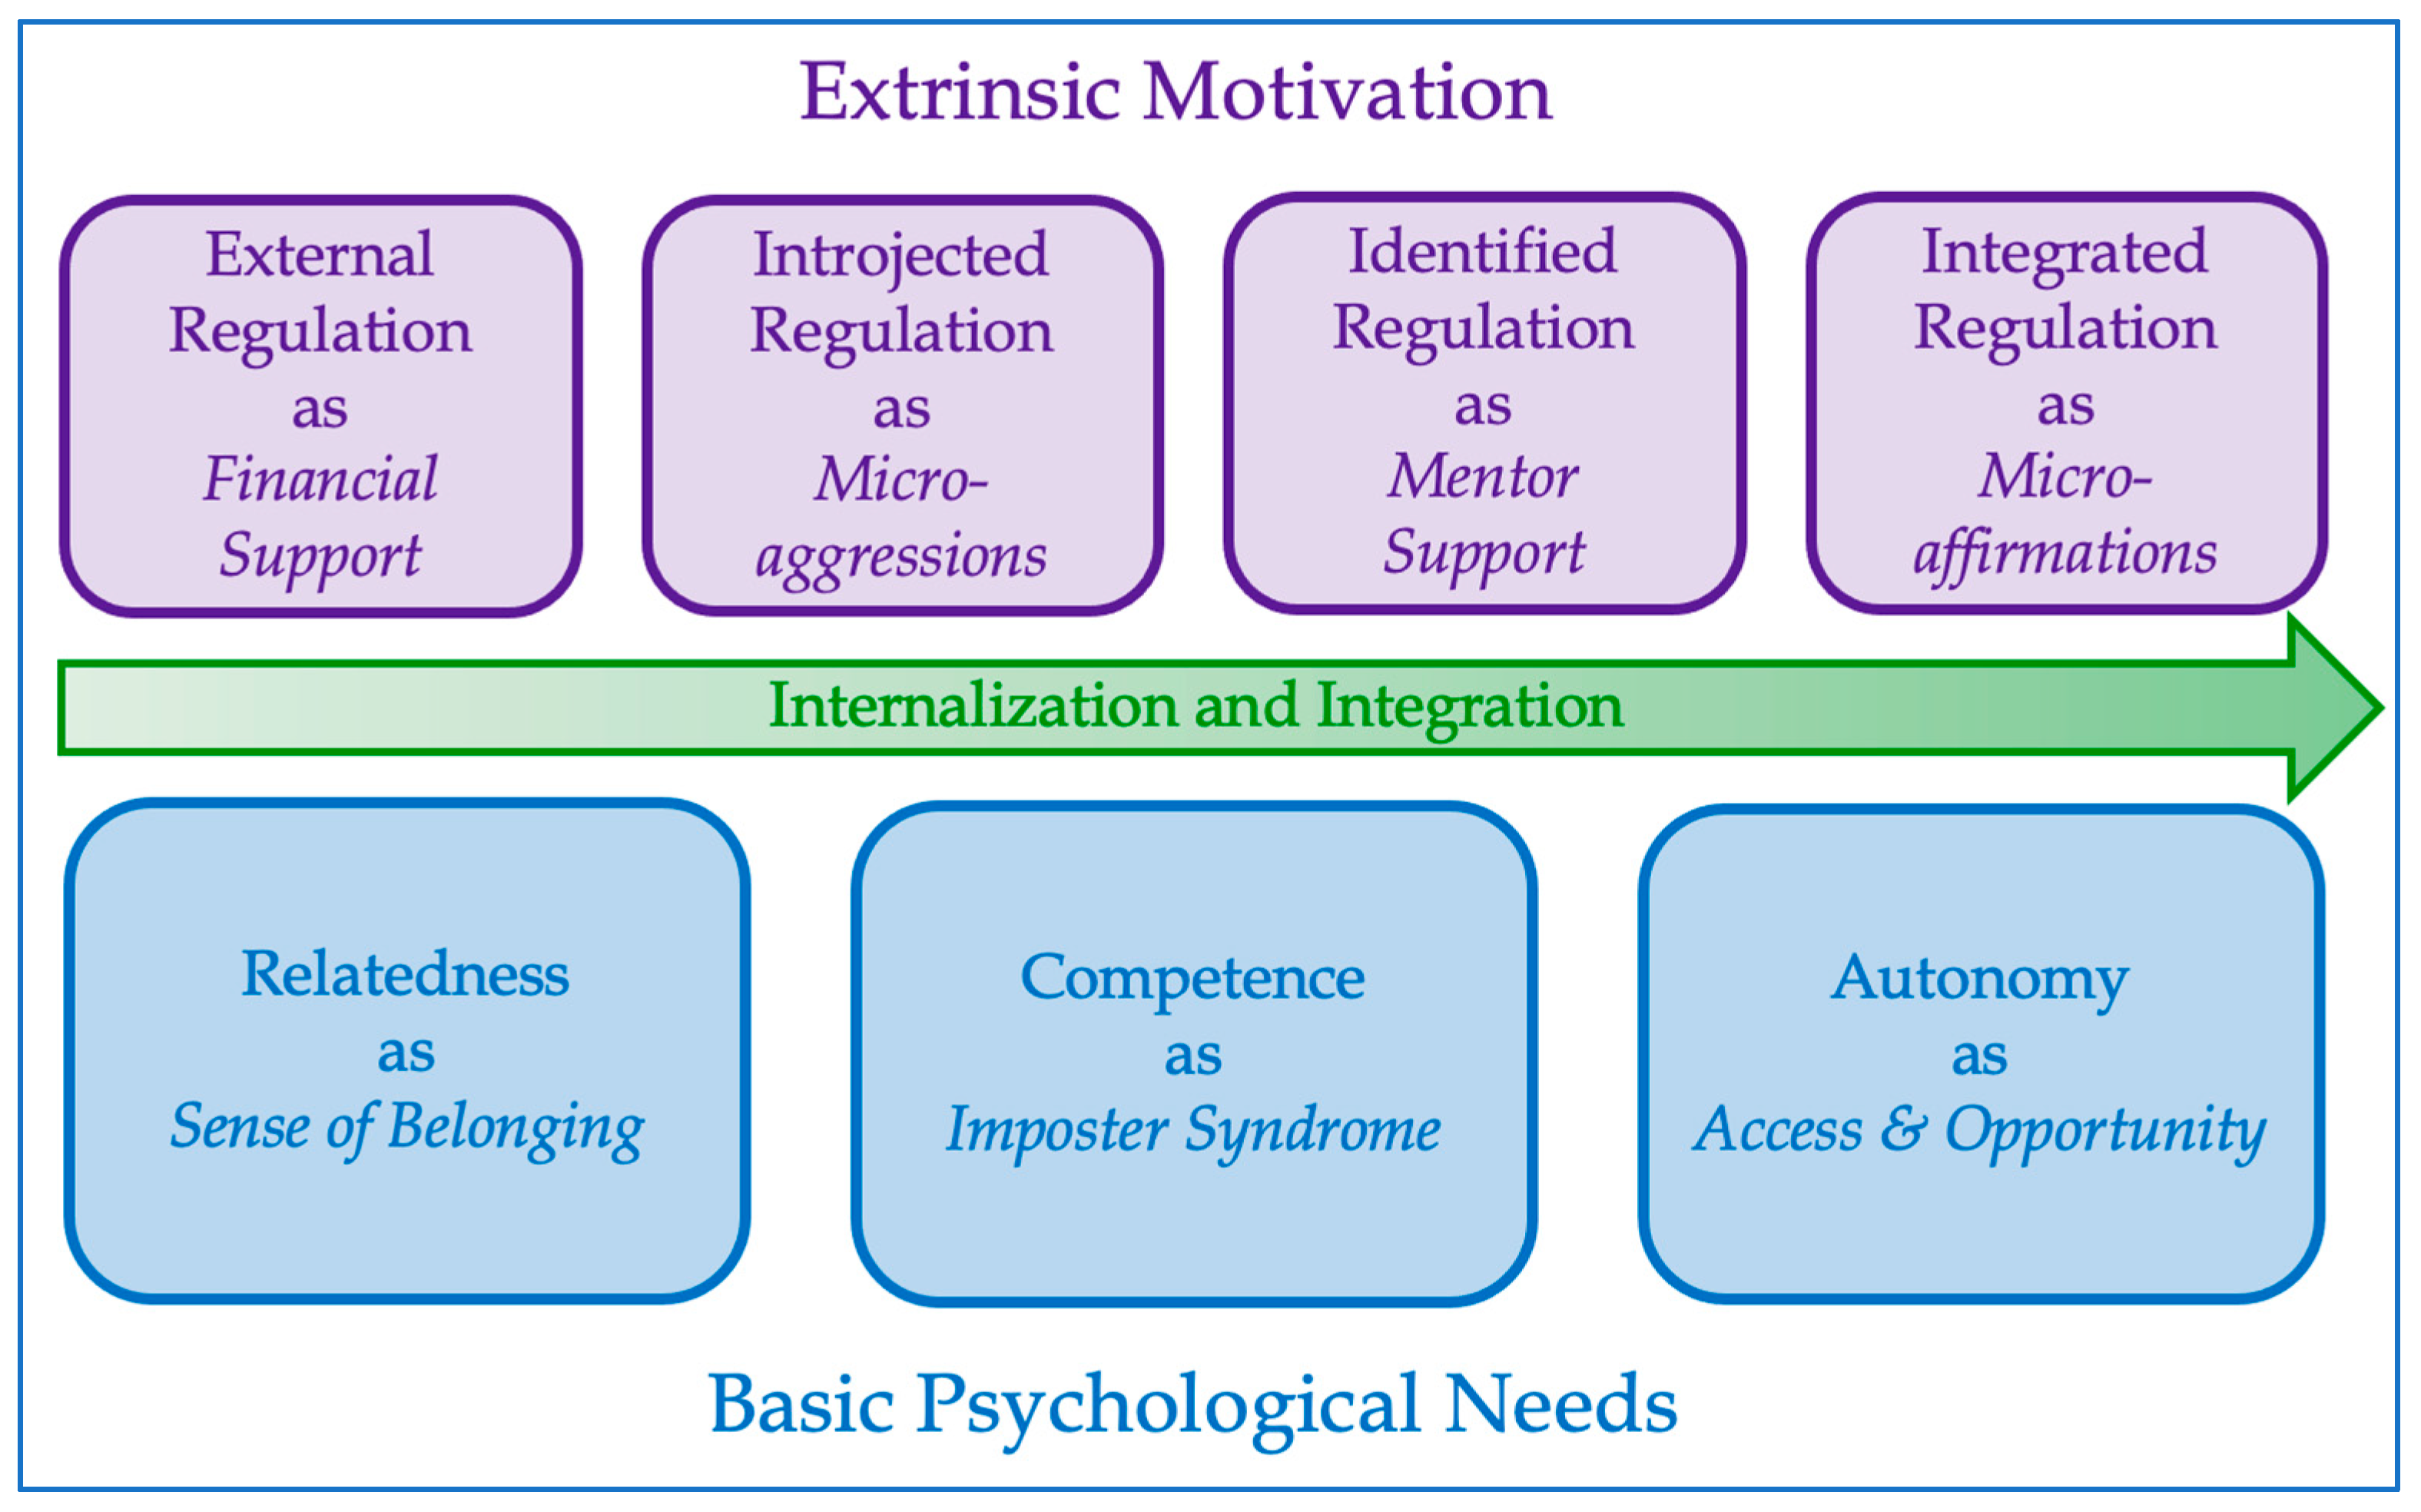
1.3. Theoretical Framework
1.3.1. Organismic Integration Theory
1.3.2. Basic Needs Theory
1.3.3. Summary
1.4. Existing Survey Measures
1.5. Graduate Student Success Survey
1.5.1. Linking the Latent Variables to Basic Needs Theory
1.5.2. Latent Variables Linked to Organismic Integration Theory
1.5.3. Summary
1.6. Research Design
1.6.1. Research Questions
- What predictive SEM model can be developed to explain the relationship between sense of belonging, imposter syndrome, mentor support, microaggressions, microaffirmations, financial support, and access to academic experiences with the control variables?
- Are there differences between graduate students’ experiences with the measured support and success factors based on demographic characteristics?
- Are there differences between graduate students’ experiences with the measured support and success factors based on their enrollment in STEM or non-STEM degree programs?
1.6.2. Hypotheses
2. Materials and Methods
2.1. Survey Development
2.2. Survey Distribution
2.3. Survey Validation and Reliability
2.4. Structural Equation Modeling Analysis
3. Results
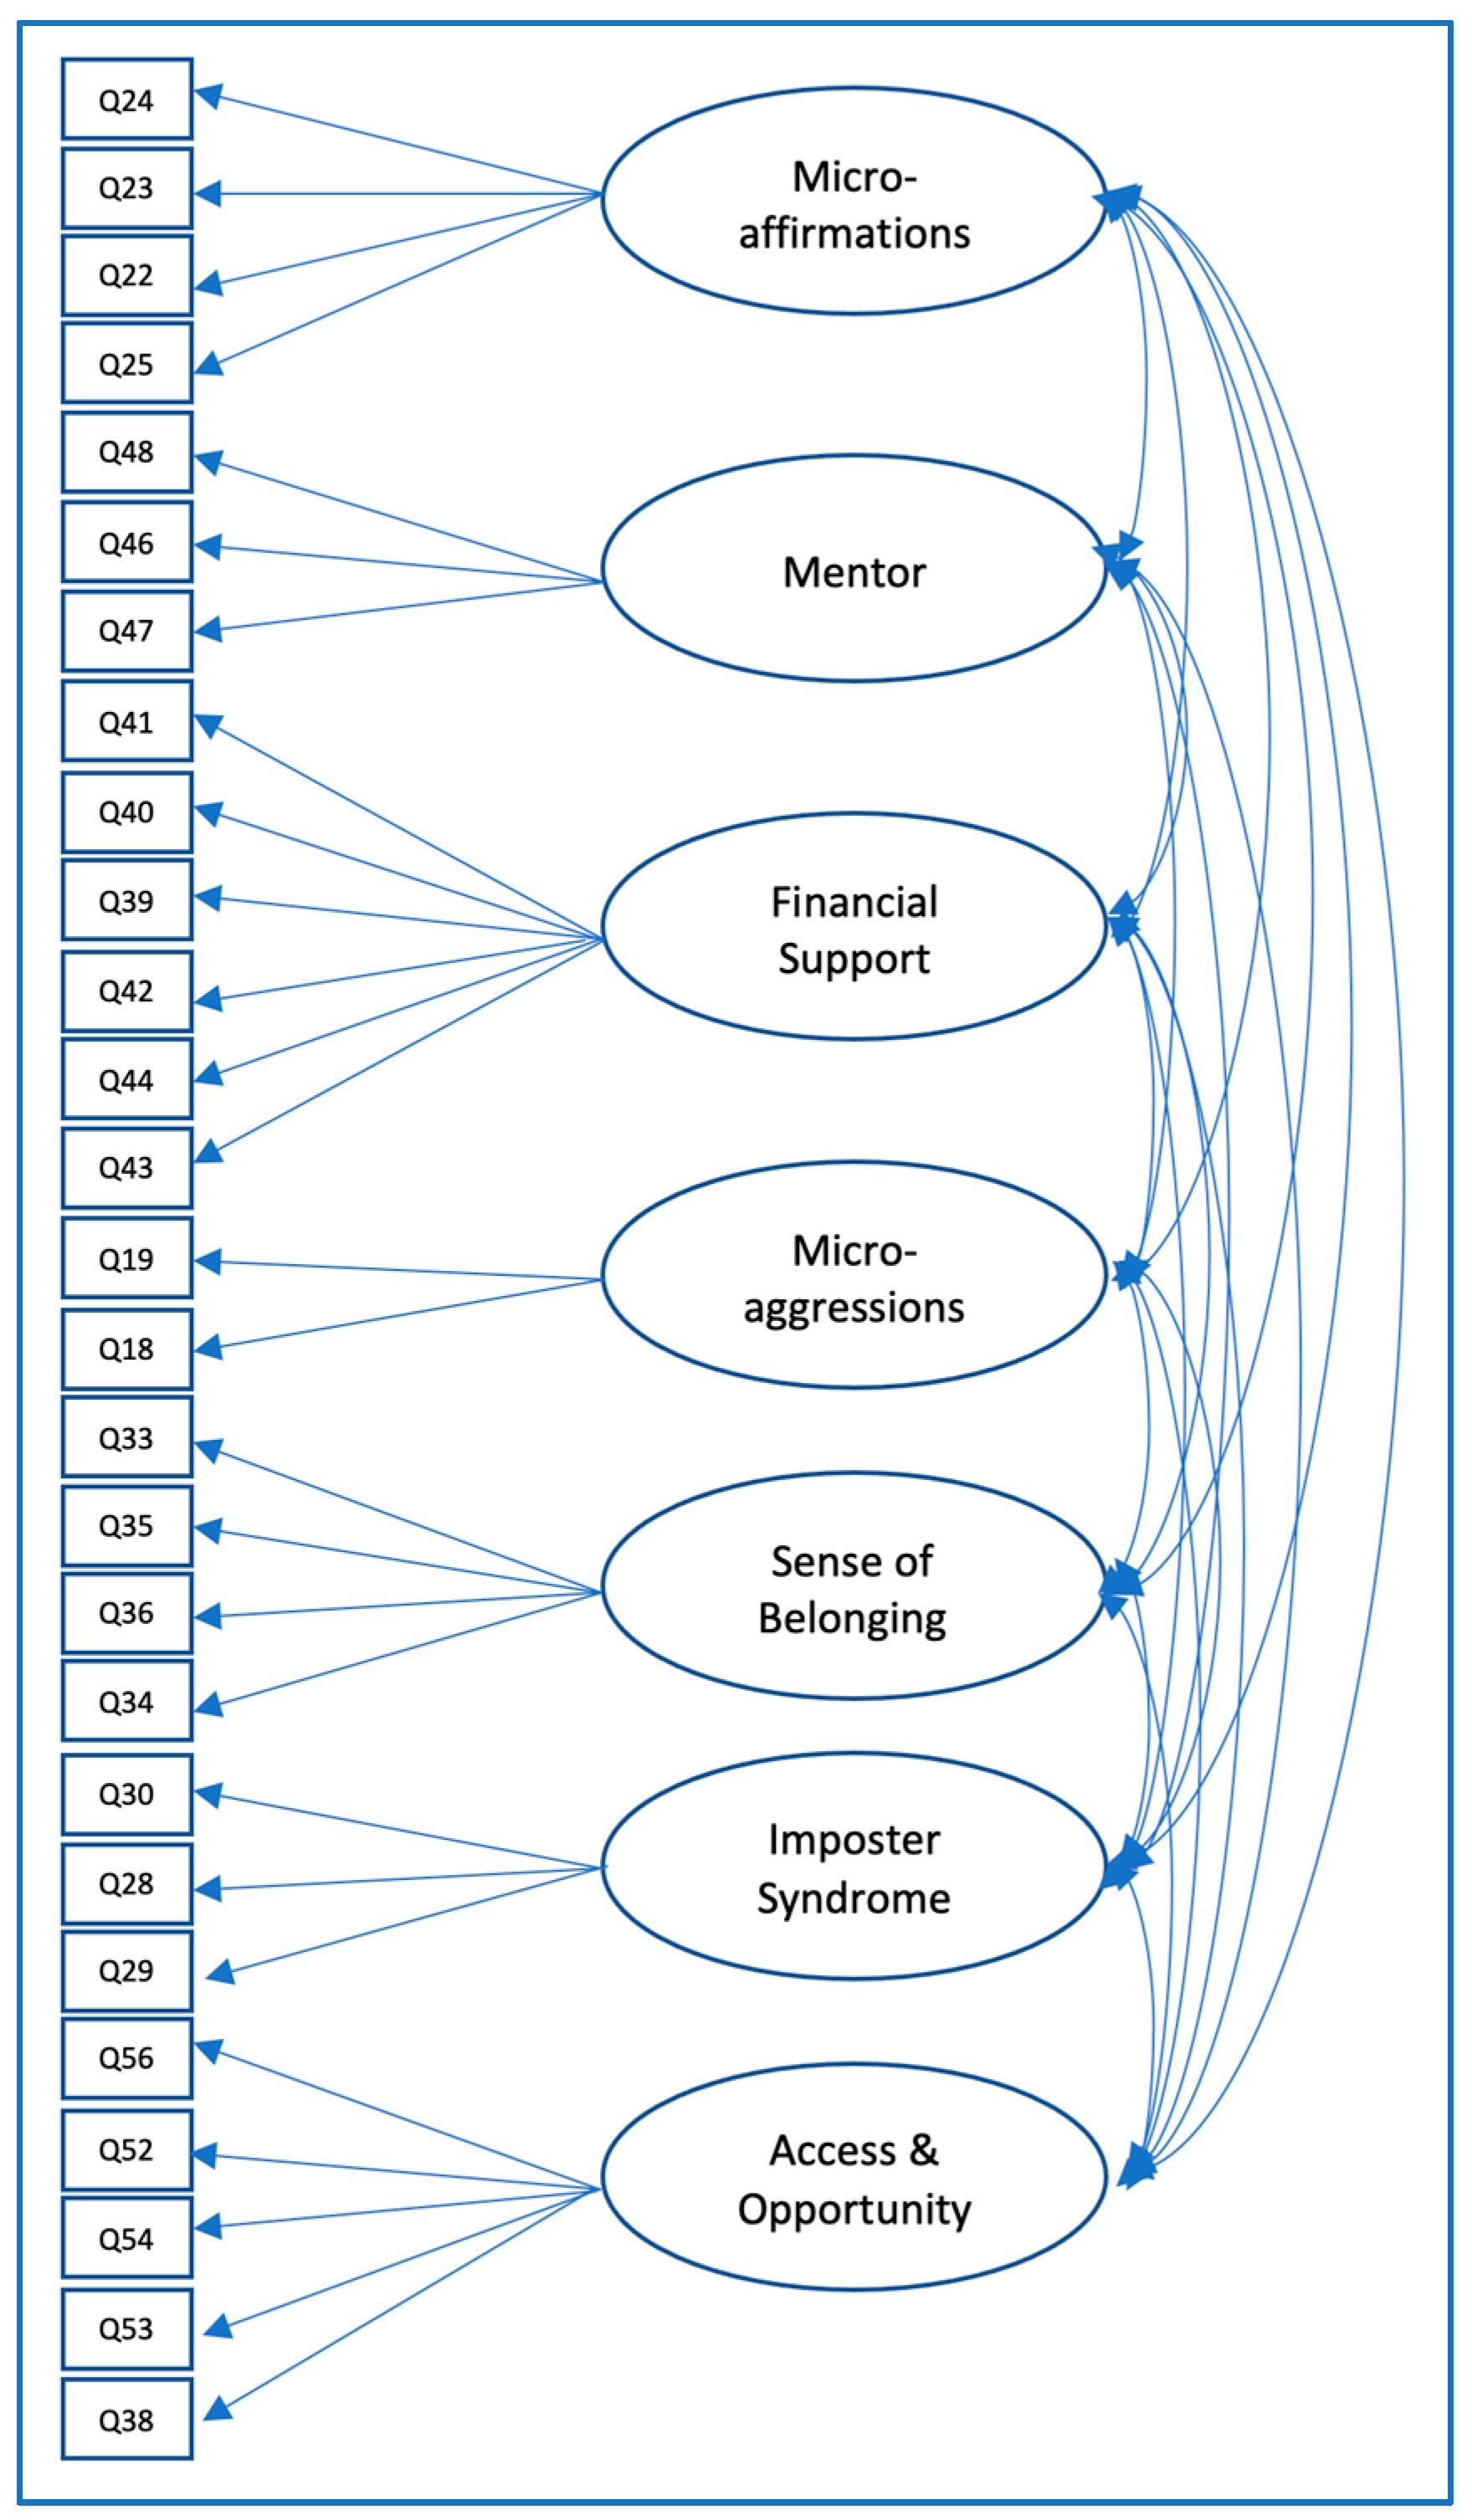
3.1. SEM Model
3.1.1. Determination of Paths between Exogenous and Endogenous Variables
3.1.2. Addition of Covariances to Improve Model Fit
3.1.3. Satorra-Bentler χ2 Test for Model Fit
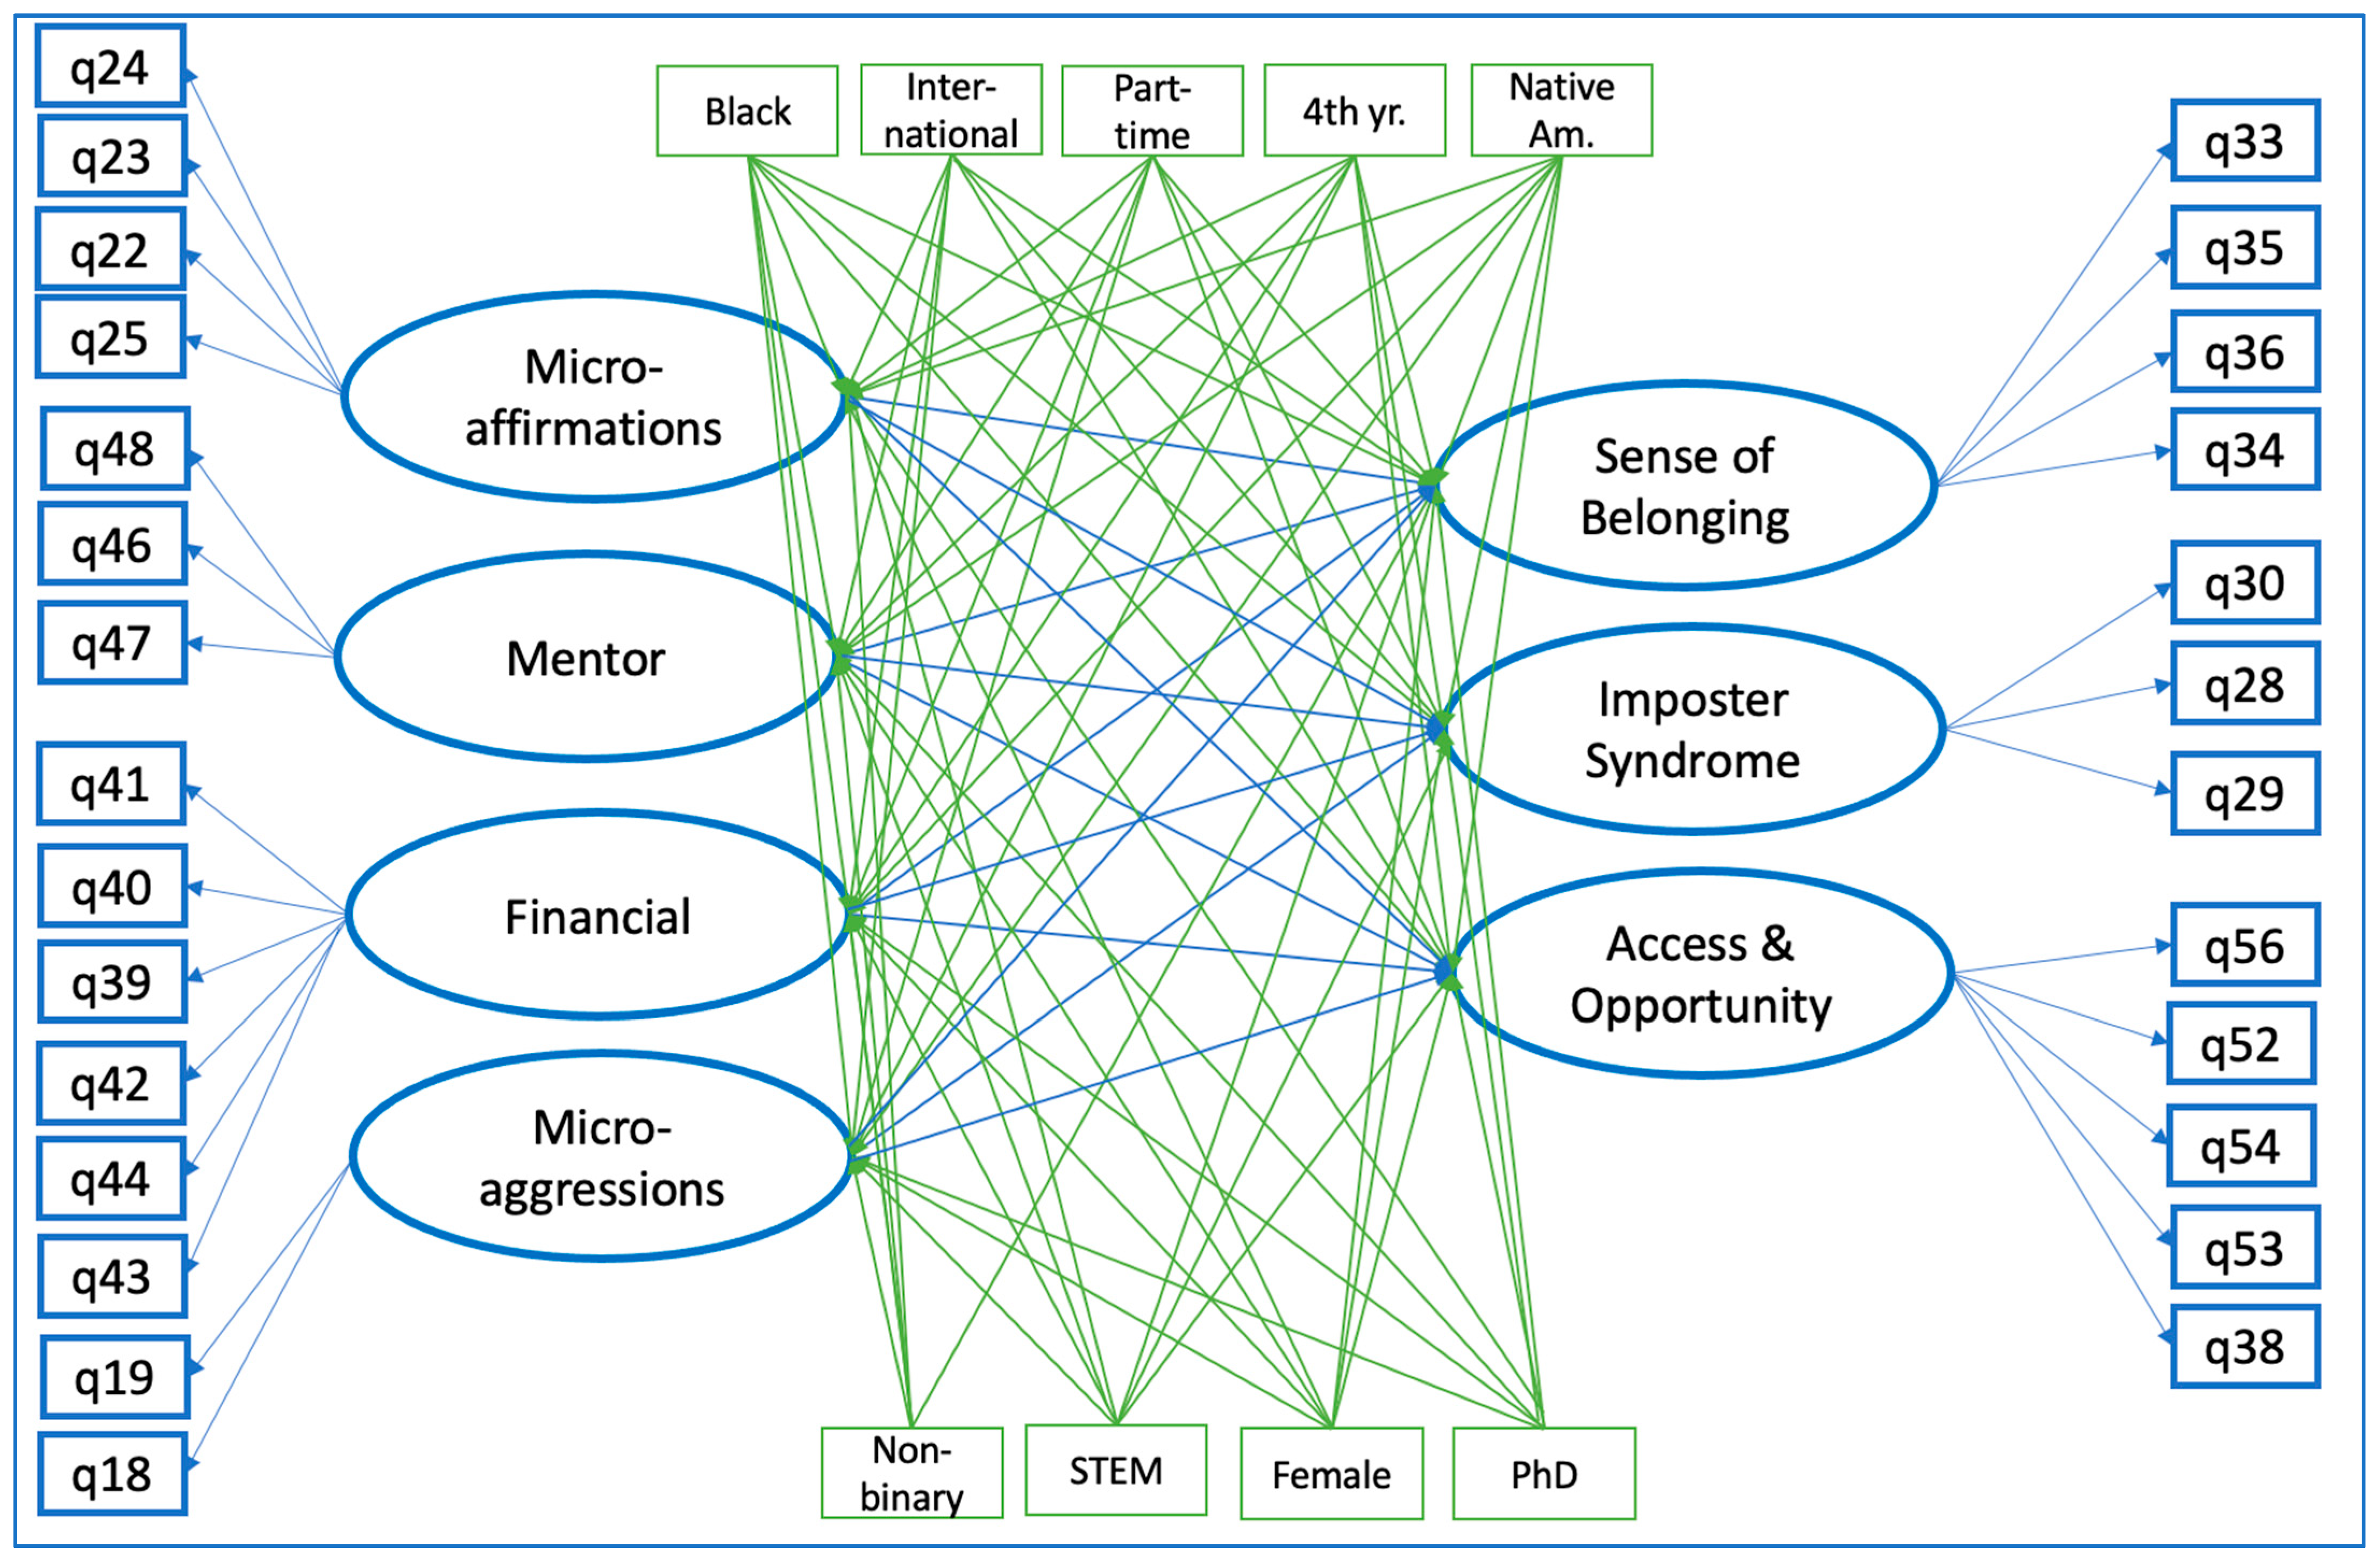
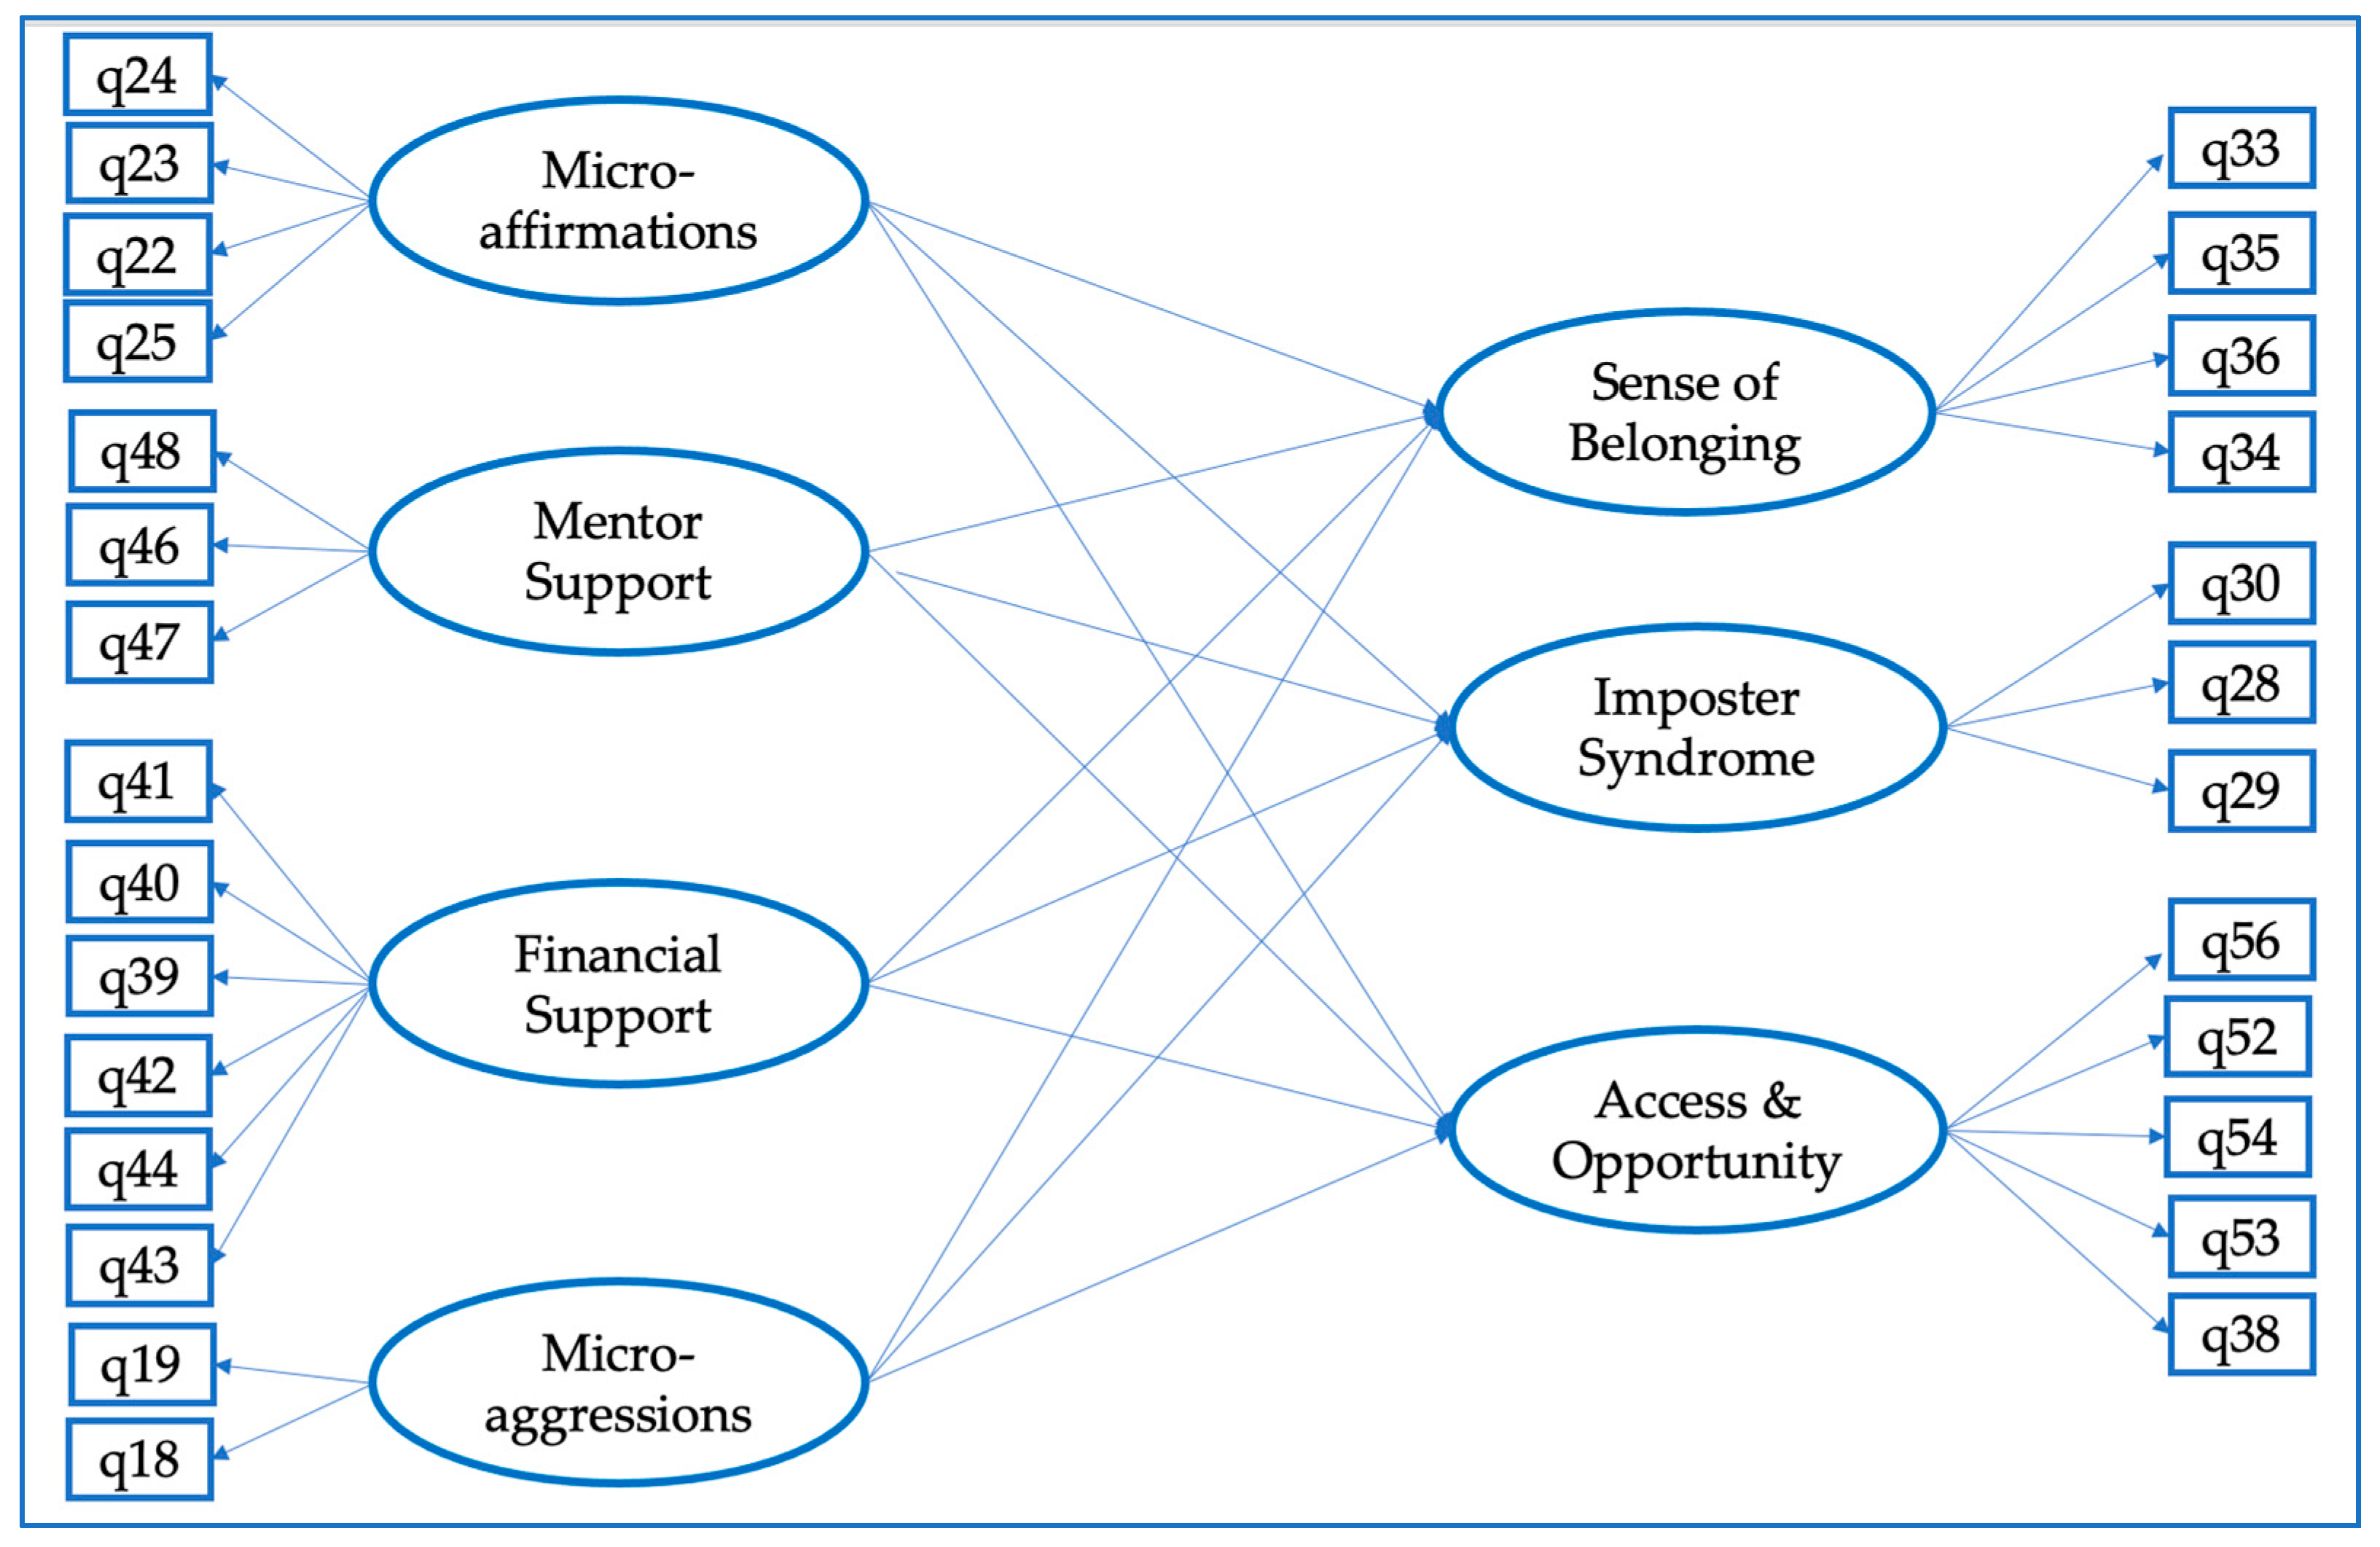
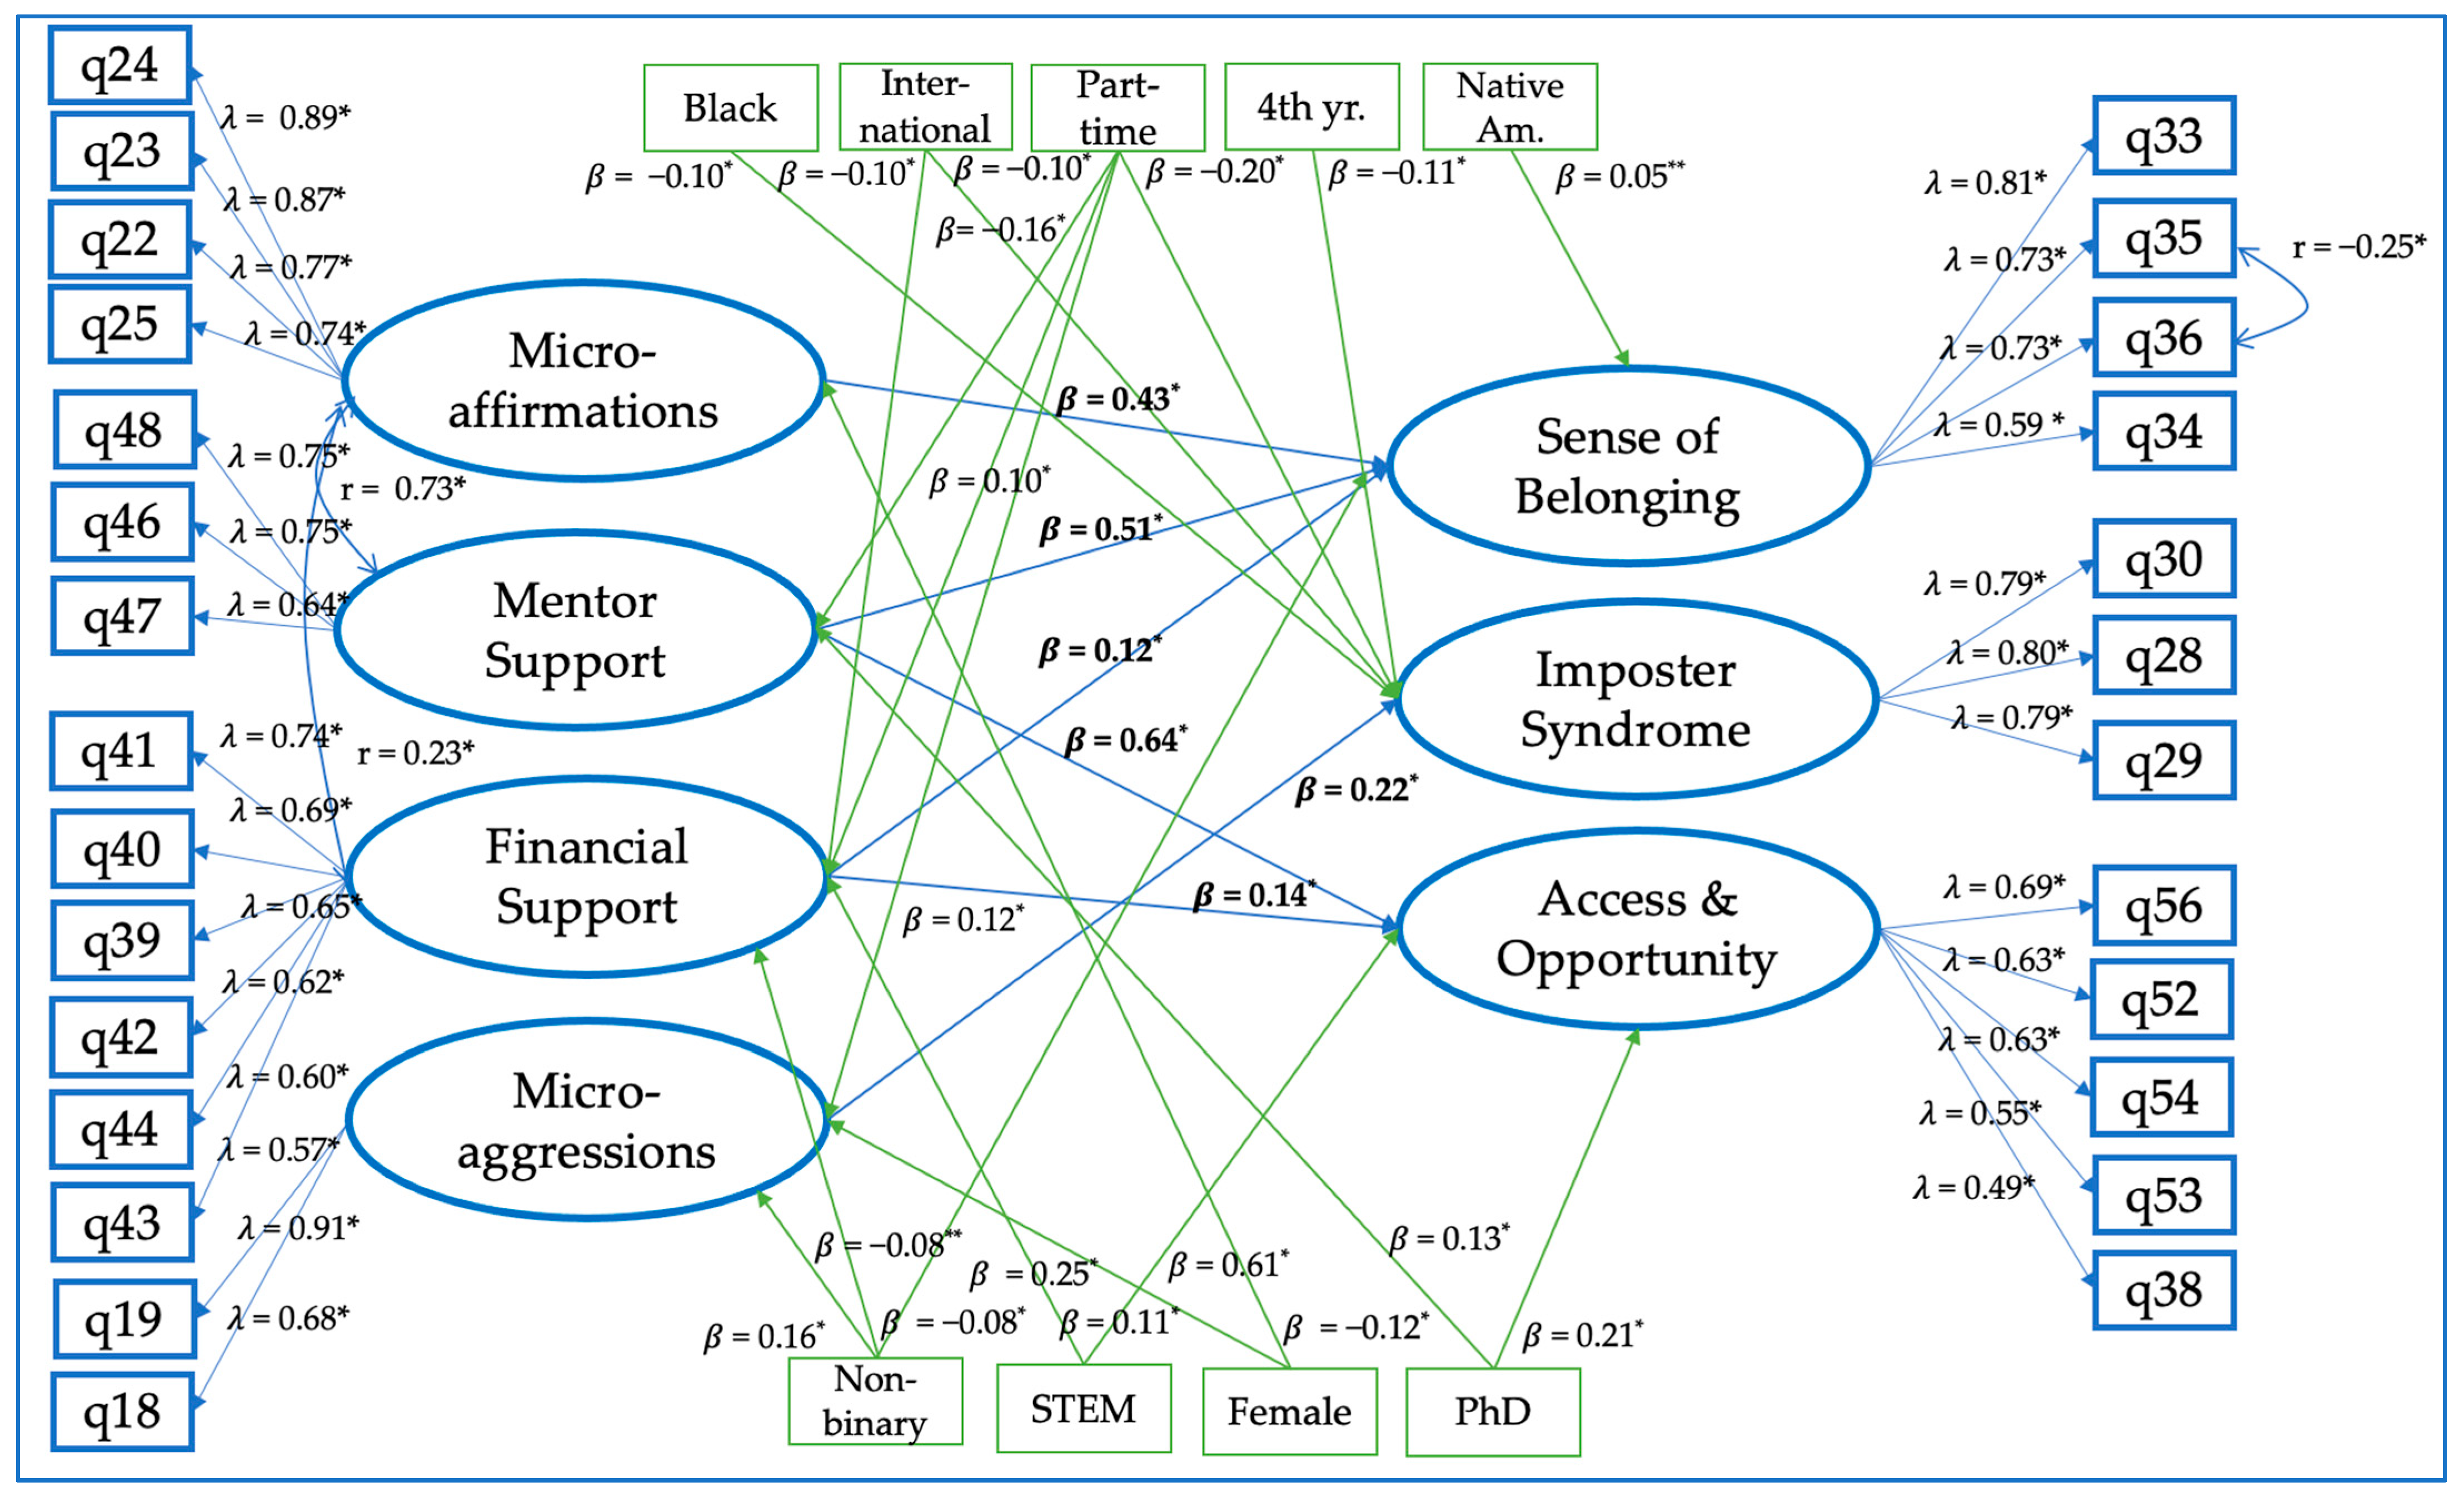
3.1.4. Final SEM Model
3.2. Regression Coefficients for Direct Paths in SEM Model
Effect of Measured Support and Success Factors for Underrepresented Groups
3.3. Effect on Success Factors for STEM Students
Supports for STEM-Interaction Terms
3.4. Limitations
4. Discussion
4.1. Connecting the Findings to Self-Determination Theory Constructs
4.1.1. Relatedness
4.1.2. Competence
4.1.3. Autonomy
4.1.4. Summary
4.2. Variance between Subgroups
4.2.1. Gender, Race, and Ethnicity
4.2.2. International Students
4.2.3. Ph.D. and Master’s Students
4.2.4. Part-Time Students
4.2.5. STEM Majors
4.2.6. First-Generation College Students
4.3. Future Research
5. Conclusions
5.1. Recommendations for University Programs
5.2. Recommendations for Future Research
Author Contributions
Funding
Institutional Review Board Statement
Informed Consent Statement
Data Availability Statement
Acknowledgments
Conflicts of Interest
Appendix A

| Micro- affirmations | Q24: My work is valued in my program. Q23: People in my program value my ideas. Q22: I am treated with respect in my program. Q25: I am encouraged to complete my degree. |
| Sense of Belonging | Q33: I feel a sense of belonging in my program. Q35: I have received academic support from faculty members in my program. Q36R: I feel isolated in my program [83]. Q34: I have received academic support from graduate students in my program. Q32: I feel my advisor cares about my well-being. |
| Mentor Relationships | Q48: I receive helpful feedback on my research from the faculty in my program. Q46: I have relationships with the faculty in my program that support my academic progress. Q47: My own goals and research interests are incorporated into my master’s/doctoral research. |
| Financial Support | Q41: Insufficient financial support from the Graduate Student Support Plan (GSSP) has slowed my progress toward a degree. Q40R: I worry about having financial support during the summer months. Q39: I receive enough financial support from the Graduate Student Support Plan (GSSP) to maintain an acceptable standard of living. Q42R: I am concerned about the amount of debt I have taken on for graduate studies. Q44R: I am concerned about affording the technology I need to support my graduate work. Q43: I am unsure of whether I will have financial support next year. |
| Access & Opportunity | Q56: I have opportunities to write academic papers for publication. Q52: I have opportunities to participate in conferences. Q54: I have opportunities to help write grant proposals. Q53: I have opportunities to engage in extension activities beyond my program. Q38: I have had opportunities to receive assistantships for research. |
| Imposter Syndrome | Q30: I often compare myself to those around me and think they may be more intelligent than I am. Q28: I am afraid people may find out that I am not as capable as they think I am. Q29: I am often afraid that I may fail at a new assignment or undertaking even though I generally do well at what I attempt [84]. |
| Micro- aggressions | Q19: My opinions are overlooked in group discussions because of my gender. Q18: Other people make assumptions about my abilities because of my gender. |
| q24 | q23 | q25 | q33 | q35 | q36 | q34 | q48 | q46 | q47 | q41 | q40 | |||
| q24 | 1 | |||||||||||||
| q23 | 0.801 | 1 | ||||||||||||
| q22 | 0.665 | 0.703 | ||||||||||||
| q25 | 0.672 | 0.618 | 1 | |||||||||||
| q33 | 0.643 | 0.607 | 0.540 | 1 | ||||||||||
| q35 | 0.548 | 0.534 | 0.519 | 0.518 | 1 | |||||||||
| q36 | 0.518 | 0.490 | 0.423 | 0.656 | 0.425 | 1 | ||||||||
| q34 | 0.397 | 0.386 | 0.326 | 0.493 | 0.499 | 0.451 | 1 | |||||||
| q48 | 0.502 | 0.442 | 0.463 | 0.468 | 0.517 | 0.375 | 0.279 | 1 | ||||||
| q46 | 0.515 | 0.501 | 0.471 | 0.551 | 0.584 | 0.441 | 0.357 | 0.557 | 1 | |||||
| q47 | 0.395 | 0.394 | 0.372 | 0.401 | 0.403 | 0.328 | 0.268 | 0.542 | 0.435 | 1 | ||||
| q41 | 0.270 | 0.229 | 0.244 | 0.242 | 0.206 | 0.266 | 0.249 | 0.112 | 0.101 | 0.084 | 1 | |||
| q40 | 0.215 | 0.162 | 0.168 | 0.106 | 0.132 | 0.141 | 0.119 | 0.060 | 0.066 | 0.063 | 0.475 | 1 | ||
| q39 | 0.194 | 0.176 | 0.145 | 0.188 | 0.143 | 0.155 | 0.111 | 0.070 | 0.047 | 0.053 | 0.546 | 0.457 | ||
| q42 | 0.124 | 0.132 | 0.113 | 0.113 | 0.120 | 0.111 | 0.141 | 0.051 | 0.031 | 0.070 | 0.451 | 0.407 | ||
| q44 | 0.157 | 0.170 | 0.136 | 0.132 | 0.178 | 0.133 | 0.159 | 0.118 | 0.089 | 0.127 | 0.470 | 0.383 | ||
| q43 | 0.281 | 0.230 | 0.307 | 0.232 | 0.236 | 0.201 | 0.204 | 0.177 | 0.218 | 0.162 | 0.377 | 0.506 | ||
| q56 | 0.308 | 0.292 | 0.345 | 0.314 | 0.326 | 0.276 | 0.234 | 0.429 | 0.309 | 0.314 | 0.055 | 0.069 | ||
| q52 | 0.235 | 0.234 | 0.304 | 0.307 | 0.219 | 0.226 | 0.207 | 0.301 | 0.271 | 0.317 | 0.051 | 0.094 | ||
| q54 | 0.249 | 0.251 | 0.301 | 0.315 | 0.288 | 0.272 | 0.147 | 0.296 | 0.271 | 0.273 | 0.087 | 0.163 | ||
| q53 | 0.247 | 0.235 | 0.295 | 0.346 | 0.288 | 0.313 | 0.259 | 0.260 | 0.303 | 0.276 | 0.171 | 0.134 | ||
| q38 | 0.217 | 0.192 | 0.191 | 0.181 | 0.215 | 0.220 | 0.132 | 0.256 | 0.201 | 0.204 | 0.081 | 0.157 | ||
| q30 | 0.058 | 0.107 | −0.005 | 0.055 | −0.021 | 0.156 | 0.023 | 0.010 | 0.072 | 0.048 | 0.030 | 0.085 | ||
| q28 | 0.036 | 0.010 | −0.003 | 0.026 | −0.062 | 0.108 | −0.060 | −0.016 | 0.041 | 0.015 | −0.035 | 0.012 | ||
| q29 | 0.089 | 0.075 | 0.078 | 0.077 | 0.015 | 0.172 | 0.056 | 0.058 | 0.063 | 0.032 | 0.109 | 0.064 | ||
| q19 | 0.230 | 0.277 | 0.192 | 0.131 | 0.177 | 0.223 | 0.077 | 0.161 | 0.082 | 0.077 | 0.172 | 0.111 | ||
| q18 | 0.135 | 0.156 | 0.113 | 0.088 | 0.130 | 0.176 | 0.072 | 0.075 | −0.011 | 0.056 | 0.116 | 0.094 | ||
| q39 | q42 | q44 | q43 | q56 | q52 | q54 | q53 | q38 | q30 | q28 | q29 | q19 | q18 | |
| q39 | 1 | |||||||||||||
| q42 | 0.431 | 1 | ||||||||||||
| q44 | 0.364 | 0.428 | 1 | |||||||||||
| q43 | 0.265 | 0.356 | 0.392 | 1 | ||||||||||
| q56 | 0.085 | 0.110 | 0.081 | 0.152 | 1 | |||||||||
| q52 | 0.066 | 0.067 | 0.081 | 0.173 | 0.451 | 1 | ||||||||
| q54 | 0.125 | 0.102 | 0.049 | 0.210 | 0.441 | 0.349 | 1 | |||||||
| q53 | 0.088 | 0.091 | 0.140 | 0.194 | 0.305 | 0.412 | 0.422 | 1 | ||||||
| q38 | 0.251 | 0.115 | 0.050 | 0.171 | 0.354 | 0.319 | 0.311 | 0.208 | 1 | |||||
| q30 | −0.020 | −0.015 | 0.069 | 0.009 | 0.026 | −0.001 | −0.048 | −0.020 | −0.047 | 1 | ||||
| q28 | −0.052 | −0.049 | 0.012 | −0.007 | −0.069 | 0.016 | −0.043 | −0.017 | −0.119 | 0.630 | 1 | |||
| q29 | −0.001 | 0.026 | 0.111 | 0.096 | 0.060 | 0.066 | 0.033 | 0.018 | −0.048 | 0.624 | 0.631 | 1 | ||
| q19 | 0.182 | 0.165 | 0.191 | 0.049 | 0.181 | 0.071 | 0.017 | 0.037 | 0.063 | 0.140 | 0.150 | 0.194 | 1 | |
| q18 | 0.118 | 0.111 | 0.147 | 0.015 | 0.122 | 0.031 | 0.020 | 0.053 | 0.015 | 0.144 | 0.130 | 0.139 | 0.620 | 1 |
References
- Mannix, E.; Neale, M.A. What Differences Make a Difference? The Promise and Reality of Diverse Teams in Organizations. Psychol. Sci. Public Interest 2005, 6, 31–55. [Google Scholar] [CrossRef] [PubMed]
- Allen, J.M.; Muragishi, G.A.; Smith, J.L.; Thoman, D.B.; Brown, E.R. To Grab and to Hold: Cultivating Communal Goals to Overcome Cultural and Structural Barriers in First-Generation College Students’ Science Interest. Transl. Issues Psychol. Sci. 2015, 1, 331–341. [Google Scholar] [CrossRef] [PubMed]
- Miller, J.A.; Joseph, A.; Langford, G.M.; Fedoroff, N.V.; Natalico, D.S.; Savitz, M.; Simberloff, D. The Science and Engineering Workforce: Realizing Americas Potential; National Science Board, National Science Foundation: Alexandria, VA, USA, 2003; pp. 3–69. [Google Scholar]
- Dika, S.L.; D’Amico, M.M. Early Experiences and Integration in the Persistence of First-Generation College Students in STEM and Non-STEM Majors. J. Res. Sci. Teach. 2016, 53, 368–383. [Google Scholar] [CrossRef]
- Dewsbury, B.M. On Faculty Development of STEM Inclusive Teaching Practices. FEMS Microbiol. Lett. 2017, 364, fnx179. [Google Scholar] [CrossRef] [PubMed]
- First-Generation Students—Factsheet; Postsecondary National Policy Institute (PNPI): Washington, DC, USA, 2021.
- QuickFacts: United States 2019; U.S. Census Bureau: Washington, DC, USA, 2019.
- Educational Attainment; U.S. Census Bureau: Washington, DC, USA, 2020.
- Collier, K.M.; Blanchard, M.R. Toward a Holistic Understanding of Factors That Support or Inhibit Graduate Student Success. Trends High. Educ. 2023, 2, 389–408. [Google Scholar] [CrossRef]
- Deci, E.L.; Ryan, R.M. A Motivational Approach to Self: Integration in Personality. In Perspectives on Motivation; University of Nebraska Press: Lincoln, NE, USA, 1991; Volume 38, pp. 237–288. [Google Scholar]
- Cole, D. Debunking Anti-Intellectualism: An Examination of African American College Students’ Intellectual Self-Concepts. Rev. High. Educ. 2011, 34, 259–282. [Google Scholar] [CrossRef]
- DeAngelo, L. Programs and Practices That Retain Students from the First to Second Year: Results from a National Study. New Dir. Institutional Res. 2014, 2013, 53–75. [Google Scholar] [CrossRef]
- Gayles, J.G.; Ampaw, F. The Impact of College Experiences on Degree Completion in STEM Fields at Four-Year Institutions: Does Gender Matter? J. High. Educ. 2014, 85, 439–468. [Google Scholar] [CrossRef]
- Jones, M.T.; Barlow, A.E.L.; Villarejo, M. Importance of Undergraduate Research for Minority Persistence and Achievement in Biology. J. High. Educ. 2010, 81, 82–115. [Google Scholar] [CrossRef]
- Byars-Winston, A.; Dahlberg, M.L. The Science of Effective Mentorship in STEMM. Consensus Study Report; National Academies Press: Washington, DC, USA, 2019; ISBN 978-0-309-49729-9. [Google Scholar]
- Price, J. The Effect of Instructor Race and Gender on Student Persistence in STEM Fields. Econ. Educ. Rev. 2010, 29, 901–910. [Google Scholar] [CrossRef]
- Wilson, Z.S.; Holmes, L.; Degravelles, K.; Sylvain, M.R.; Batiste, L.; Johnson, M.; McGuire, S.Y.; Pang, S.S.; Warner, I.M. Hierarchical Mentoring: A Transformative Strategy for Improving Diversity and Retention in Undergraduate STEM Disciplines. J. Sci. Educ. Technol. 2012, 21, 148–156. [Google Scholar] [CrossRef]
- Doctorate Recipients from, U.S. Universities: 2020; National Science Foundation, National Center for Science and Engineering Statistics: Alexandria, VA, USA, 2021. [Google Scholar]
- Cole, D.; Griffin, K.A. Advancing the Study of Student-Faculty Interaction: A Focus on Diverse Students and Faculty. In Higher Education: Handbook of Theory and Research; Springer: Dordrecht, The Netherlands, 2013; Volume 28, pp. 561–611. ISBN 978-94-007-5835-3. [Google Scholar]
- Tao, K.W.; Gloria, A.M. Should I Stay or Should I Go? The Role of Impostorism in STEM Persistence. Psychol. Women Q. 2019, 43, 151–164. [Google Scholar] [CrossRef]
- Stachl, C.N.; Baranger, A.M. Sense of Belonging within the Graduate Community of a Research-Focused STEM Department: Quantitative Assessment Using a Visual Narrative and Item Response Theory. PLoS ONE 2020, 15, e0233431. [Google Scholar] [CrossRef] [PubMed]
- Katrevich, A.V.; Aruguete, M.S. Recognizing Challenges and Predicting Success in First-Generation University Students. J. STEM Educ. Innov. Res. 2017, 18, 40–44. [Google Scholar]
- Hoffer, T.B.; Dugoni, B.L.; Sanderson, A.R.; Sederstrom, S.; Ghadialy, R.; Rocque, P. Doctorate Recipients from United States Universities: Summary Report 2000; Survey of Earned Doctorates: Alexandria, VA, USA, 2001. [Google Scholar]
- Gardner, S.K. The Challenges of First-Generation Doctoral Students. New Dir. High. Educ. 2013, 2013, 43–54. [Google Scholar] [CrossRef]
- Lovitts, B.E. Leaving the Ivory Tower: The Causes and Consequences of Departure from Doctoral Study; Rowman & Littlefield Publishers: New York, NY, USA, 2002; ISBN 978-0-7425-0941-2. [Google Scholar]
- Redford, J.; Mulvaney Hoyer, K. First Generation and Continuing-Generation College Students: A Comparison of High School and Postsecondary Experiences; Institute for Educational Sciences, U.S. Department of Education: Washington, DC, USA, 2017. [Google Scholar]
- Survey of Earned Doctorates; National Science Foundation, National Center for Science and Engineering Statistics: Alexandria, VA, USA, 2020.
- Lee, J.D. More Than Ability: Gender and Personal Relationships Influence Science and Technology Involvement. Sociol. Educ. 2002, 75, 349–373. [Google Scholar] [CrossRef]
- Seymour, E. The Loss of Women from Science, Mathematics, and Engineering Undergraduate Majors: An Explanatory Account. Sci. Educ. 1995, 79, 437–473. [Google Scholar] [CrossRef]
- Chang, M.J.; Eagan, M.K.; Lin, M.H.; Hurtado, S. Considering the Impact of Racial Stigmas and Science Identity: Persistence among Biomedical and Behavioral Science Aspirants. J. High. Educ. 2011, 82, 564–596. [Google Scholar] [CrossRef]
- Hurtado, S.; Cabrera, N.L.; Lin, M.H.; Arellano, L.; Espinosa, L.L. Diversifying Science: Underrepresented Student Experiences in Structured Research Programs. Res. High. Educ. 2009, 50, 189–214. [Google Scholar] [CrossRef]
- Carlone, H.B.; Johnson, A. Understanding the Science Experiences of Successful Women of Color: Science Identity as an Analytic Lens. J. Res. Sci. Teach. 2007, 44, 1187–1218. [Google Scholar] [CrossRef]
- Chang, M.J.; Sharkness, J.; Hurtado, S.; Newman, C.B. What Matters in College for Retaining Aspiring Scientists and Engineers from Underrepresented Racial Groups. J. Res. Sci. Teach. 2014, 51, 555–580. [Google Scholar] [CrossRef]
- Wang, X. Why Students Choose STEM Majors: Motivation, High School Learning, and Postsecondary Context of Support. Am. Educ. Res. J. 2013, 50, 1081–1121. [Google Scholar] [CrossRef]
- Choenarom, C.; Williams, R.A.; Hagerty, B.M. The Role of Sense of Belonging and Social Support on Stress and Depression in Individuals with Depression. Arch. Psychiatr. Nurs. 2005, 19, 18–29. [Google Scholar] [CrossRef]
- Baumeister, R.F.; Leary, M.R. The Need to Belong: Desire for Interpersonal Attachments as a Fundamental Human Motivation. Psychol. Bull. 1995, 117, 497–529. [Google Scholar] [CrossRef] [PubMed]
- Baumeister, R.F.; Tice, D.M. Point-Counterpoints: Anxiety and Social Exclusion. J. Soc. Clin. Psychol. 1990, 9, 165–195. [Google Scholar] [CrossRef]
- Curtin, N.; Stewart, A.J.; Ostrove, J.M. Fostering Academic Self-Concept: Advisor Support and Sense of Belonging among International and Domestic Graduate Students. Am. Educ. Res. J. 2013, 50, 108–137. [Google Scholar] [CrossRef]
- Griffin, K.; Baker, V.; O’Meara, K.; Nyunt, G.; Robinson, T.; Staples, C.L. Supporting Scientists from Underrepresented Minority Backgrounds: Mapping Developmental Networks. Stud. Grad. Postdr. Educ. 2018, 9, 19–37. [Google Scholar] [CrossRef]
- Kendricks, K.; Nedunuri, K.V.; Arment, A.R. Minority Student Perceptions of the Impact of Mentoring to Enhance Academic Performance in STEM Disciplines. J. STEM Educ. Innov. Res. 2013, 14, 38–46. [Google Scholar]
- Kamarzarrin, H.; Khaledian, M.; Shooshtari, M.; Yousefi, E.; Ahrami, R. A Study of the Relationship between Self-Esteem and the Imposter Phenomenon in the Physicians of Rasht City. Eur. J. Exp. Biol. 2013, 3, 363–366. [Google Scholar]
- Vaughn, A.R.; Taasoobshirazi, G.; Johnson, M.L. Impostor Phenomenon and Motivation: Women in Higher Education. Stud. High. Educ. 2020, 45, 780–795. [Google Scholar] [CrossRef]
- Chakraverty, D. Impostor Phenomenon in STEM: Occurrence, Attribution, and Identity. Stud. Grad. Postdr. Educ. 2019, 10, 2–20. [Google Scholar] [CrossRef]
- Lige, Q.M.; Peteet, B.J.; Brown, C.M. Racial Identity, Self-Esteem, and the Impostor Phenomenon among African American College Students. J. Black Psychol. 2017, 43, 345–357. [Google Scholar] [CrossRef]
- Rowley, S.J.; Sellers, R.M.; Chavous, T.M.; Smith, M.A. The Relationship between Racial Identity and Self-Esteem in African American College and High School Students. J. Pers. Soc. Psychol. 1998, 74, 715. [Google Scholar] [CrossRef]
- Golde, C.M. The Role of the Department and Discipline in Doctoral Student Attrition: Lessons from Four Departments. J. High. Educ. 2005, 76, 669–700. [Google Scholar] [CrossRef]
- Collier, K.M.; Blanchard, M.R. Illuminating the Graduate Student Experience: A Narrative Analysis. 2023; Manuscript In Review. [Google Scholar]
- Cole, D.; Espinoza, A. Examining the Academic Success of Latino Students in Science Technology Engineering and Mathematics (STEM) Majors. J. Coll. Stud. Dev. 2008, 49, 285–300. [Google Scholar] [CrossRef]
- Ong, M.; Wright, C.; Espinosa, L.; Orfield, G. Inside the Double Bind: A Synthesis of Empirical Research on Undergraduate and Graduate Women of Color in Science, Technology, Engineering, and Mathematics. Harv. Educ. Rev. 2011, 81, 172–209. [Google Scholar] [CrossRef]
- Rolón-Dow, R.; Davison, A. Racial Microaffirmations: Learning from Student Stories of Moments That Matter. Divers. Discourse Newark 2018, 1, 1–9. [Google Scholar]
- Rolón-Dow, R.; Davison, A. Theorizing Racial Microaffirmations: A Critical Race/Latcrit Approach. Race Ethn. Educ. 2021, 24, 245–261. [Google Scholar] [CrossRef]
- Pierce, C. Psychiatric Problems of the Black Minority. In American Handbook of Psychiatry; Basic Books: New York City, NY, USA, 1974; Volume 2. [Google Scholar]
- Sue, D.W.; Capodilupo, C.M.; Torino, G.C.; Bucceri, J.M.; Holder, A.; Nadal, K.L.; Esquilin, M. Racial Microaggressions in Everyday Life: Implications for Clinical Practice. Am. Psychol. 2007, 62, 271. [Google Scholar] [CrossRef]
- Alfred, M.V.; Ray, S.M.; Johnson, M.A. Advancing Women of Color in STEM: An Imperative for US Global Competitiveness. Adv. Dev. Hum. Resour. 2019, 21, 114–132. [Google Scholar] [CrossRef]
- Miller, A.N.; Orsillo, S.M. Values, Acceptance, and Belongingess in Graduate School: Perspectives from Underrepresented Minority Students. J. Context. Behav. Sci. 2020, 15, 197–206. [Google Scholar] [CrossRef]
- Chisholm, L.P.; Jackson, K.R.; Davidson, H.A.; Churchwell, A.L.; Fleming, A.E.; Drolet, B.C. Evaluation of Racial Microaggressions Experienced During Medical School Training and the Effect on Medical Student Education and Burnout: A Validation Study. J. Natl. Med. Assoc. 2021, 113, 310–314. [Google Scholar] [CrossRef] [PubMed]
- Nadal, K.L.; Davidoff, K.C.; Davis, L.S.; Wong, Y.; Marshall, D.; McKenzie, V. A Qualitative Approach to Intersectional Microaggressions: Understanding Influences of Race, Ethnicity, Gender, Sexuality, and Religion. Qual. Psychol. 2015, 2, 147. [Google Scholar] [CrossRef]
- Deci, E.L.; Ryan, R.M. Self-Determination Theory. In International Encyclopedia of the Social & Behavioral Sciences, 2nd ed.; Wright, J.D., Ed.; Elsevier: Oxford, UK, 2015; pp. 486–491. ISBN 978-0-08-097087-5. [Google Scholar]
- Ryan, R.M.; Deci, E.L. Self-Determination Theory and the Facilitation of Intrinsic Motivation, Social Development, and Well-Being. Am. Psychol. 2000, 55, 68–78. [Google Scholar] [CrossRef] [PubMed]
- Ryan, R.M.; Deci, E.L. Overview of Self-Determination Theory: An Organismic Dialectical Perspective. Handbook of Self-Determination Research; The University of Rochester Press: Rochester, NY, USA, 2002; Volume 2, pp. 3–33. [Google Scholar]
- Standage, M.; Duda, J.L.; Ntoumanis, N. A Test of Self-Determination Theory in School Physical Education. Br. J. Educ. Psychol. 2005, 75, 411–433. [Google Scholar] [CrossRef] [PubMed]
- Diefendorff, J.M.; Seaton, G.A. Work Motivation. In International Encyclopedia of the Social & Behavioral Sciences, 2nd ed.; Wright, J.D., Ed.; Elsevier: Oxford, UK, 2015; pp. 680–686. ISBN 978-0-08-097087-5. [Google Scholar]
- Deci, E.L.; Ryan, R.M. Self-Determination Theory: A Macrotheory of Human Motivation, Development, and Health. Can. Psychol. Can. 2008, 49, 182. [Google Scholar] [CrossRef]
- Legault, L. Self-Determination Theory. In Encyclopedia of Personality and Individual Differences; Zeigler-Hill, V., Shackelford, T.K., Eds.; Springer International Publishing: Cham, Switzerland, 2017; pp. 1–9. ISBN 978-3-319-28099-8. [Google Scholar]
- Simon, R.A.; Aulls, M.W.; Dedic, H.; Hubbard, K.; Hall, N.C. Exploring Student Persistence in STEM Programs: A Motivational Model. Can. J. Educ. Rev. Can. Léducation 2015, 38, 1–27. [Google Scholar]
- Bandura, A. Guide for Constructing Self-Efficacy Scales. Self-Effic. Beliefs Adolesc. 2006, 5, 307–337. [Google Scholar]
- Reeve, J. A Self-Determination Theory Perspective on Student Engagement. In Handbook of Research on Student Engagement; Springer: Berlin/Heidelberg, Germany, 2012; pp. 149–172. [Google Scholar]
- Furrer, C.; Skinner, E. Sense of Relatedness as a Factor in Children’s Academic Engagement and Performance. J. Educ. Psychol. 2003, 95, 148–162. [Google Scholar] [CrossRef]
- Hilts, A.; Part, R.; Bernacki, M.L. The Roles of Social Influences on Student Competence, Relatedness, Achievement, and Retention in STEM. Sci. Educ. 2018, 102, 744–770. [Google Scholar] [CrossRef]
- Tinto, V. Dropout from Higher Education: A Theoretical Synthesis of Recent Research. Rev. Educ. Res. 1975, 45, 89–125. [Google Scholar] [CrossRef]
- Spady, W.G. Dropouts from Higher Education: Toward an Empirical Model. Interchange 1971, 2, 38–62. [Google Scholar] [CrossRef]
- Malaney, G.D. An Analysis of Financial Aid in the Recruitment of Graduate Students at the Ohio State University. J. Stud. Financ. Aid 1984, 14, 11–19. [Google Scholar] [CrossRef]
- Girves, J.E.; Wemmerus, V. Developing Models of Graduate Student Degree Progress. J. High. Educ. 1988, 59, 163–189. [Google Scholar] [CrossRef]
- Estrada, M.; Young, G.R.; Nagy, J.; Goldstein, E.J.; Ben-Zeev, A.; Márquez-Magaña, L.; Eroy-Reveles, A. The Influence of Microaffirmations on Undergraduate Persistence in Science Career Pathways. CBE—Life Sci. Educ. 2019, 18, ar40. [Google Scholar] [CrossRef] [PubMed]
- Fisher, A.J.; Mendoza-Denton, R.; Patt, C.; Young, I.; Eppig, A.; Garrell, R.L.; Rees, D.C.; Nelson, T.W.; Richards, M.A. Structure and Belonging: Pathways to Success for Underrepresented Minority and Women PhD Students in STEM Fields. PLoS ONE 2019, 14, e0209279. [Google Scholar] [CrossRef] [PubMed]
- Nadal, K.L. The Racial and Ethnic Microaggressions Scale (REMS): Construction, Reliability, and Validity. J. Couns. Psychol. 2011, 58, 470–480. [Google Scholar] [CrossRef]
- Good, C.; Rattan, A.; Dweck, C.S. Why Do Women Opt out? Sense of Belonging and Women’s Representation in Mathematics. J. Pers. Soc. Psychol. 2012, 102, 700–717. [Google Scholar] [CrossRef]
- Niemiec, C.P.; Ryan, R.M. Autonomy, Competence, and Relatedness in the Classroom: Applying Self-Determination Theory to Educational Practice. Theory Res. Educ. 2009, 7, 133–144. [Google Scholar] [CrossRef]
- Kumar, S.; Jagacinski, C.M. Imposters Have Goals Too: The Imposter Phenomenon and Its Relationship to Achievement Goal Theory. Personal. Individ. Differ. 2006, 40, 147–157. [Google Scholar] [CrossRef]
- Cook, D.A.; Artino, A.R., Jr. Motivation to Learn: An Overview of Contemporary Theories. Med. Educ. 2016, 50, 997–1014. [Google Scholar] [CrossRef] [PubMed]
- Collier, K.M. Exploring and Measuring Influential Factors for Graduate Student Success. Ph.D. Dissertation, North Carolina State University, Raleigh, NC, USA, 2023. [Google Scholar]
- O’Meara, K.; Griffin, K.A.; Kuvaeva, A.; Nyunt, G.; Robinson, T.N. Sense of Belonging and Its Contributing Factors in Graduate Education. Int. J. Dr. Stud. 2017, 12, 251–279. [Google Scholar] [CrossRef] [PubMed]
- Barnes, B.J.; Randall, J. Doctoral Student Satisfaction: An Examination of Disciplinary, Enrollment, and Institutional Differences. Res. High. Educ. 2012, 53, 47–75. [Google Scholar] [CrossRef]
- Clance, P.R. The Impostor Phenomenon: When Success Makes You Feel Like a Fake; Bantam Books: Toronto, ON, USA, 1986; ISBN 10-0553257307. [Google Scholar]
- Torres-Harding, S.R.; Andrade, A.L., Jr.; Romero Diaz, C.E. The Racial Microaggressions Scale (RMAS): A New Scale to Measure Experiences of Racial Microaggressions in People of Color. Cultur. Divers. Ethnic Minor. Psychol. 2012, 18, 153. [Google Scholar] [CrossRef] [PubMed]
- Sowell, R.; Allum, J.; Okahana, H. Doctoral Initiative on Minority Attrition and Completion; Council of Graduate Schools: Washington, DC, USA, 2015. [Google Scholar]
- Kline, R.B. Principles and Practice of Structural Equation Modeling, 4th ed.; Little, T.D., Ed.; The Guilford Press: New York, NY, USA; London, UK, 2016. [Google Scholar]
- Brown, T.A. Confirmatory Factor Analysis for Applied Research, 2nd ed.; Guilford Publications: New York, NY, USA, 2015; ISBN 10-1462515363. [Google Scholar]
- McAlexander, S.L.; McCance, K.; Blanchard, M.R.; Venditti, R.A. Investigating the Experiences, Beliefs, and Career Intentions of Historically Underrepresented Science and Engineering Undergraduates Engaged in an Academic and Internship Program. Sustainability 2022, 14, 1486. [Google Scholar] [CrossRef]
- Hu, L.; Bentler, P.M. Cutoff Criteria for Fit Indexes in Covariance Structure Analysis: Conventional Criteria versus New Alternatives. Struct. Equ. Model. Multidiscip. J. 1999, 6, 1–55. [Google Scholar] [CrossRef]
- Stockard, J.; Rohlfing, C.M.; Richmond, G.L. Equity for Women and Underrepresented Minorities in STEM: Graduate Experiences and Career Plans in Chemistry. Proc. Natl. Acad. Sci. USA 2021, 118, e08118. [Google Scholar] [CrossRef]
- Hughes, G.D. The Impact of Incorrect Responses to Reverse-Coded Survey Items. Res. Sch. 2009, 16, 76–88. [Google Scholar]
- Bardeen, J.R.; Fergus, T.A.; Hannan, S.M.; Orcutt, H.K. Addressing Psychometric Limitations of the Difficulties in Emotion Regulation Scale Through Item Modification. J. Pers. Assess. 2016, 98, 298–309. [Google Scholar] [CrossRef]
- Schober, P.; Boer, C.; Schwarte, L.A. Correlation Coefficients: Appropriate Use and Interpretation. Anesth. Analg. 2018, 126, 1763–1768. [Google Scholar] [CrossRef] [PubMed]
- Curran, P.J.; West, S.G.; Finch, J.F. The Robustness of Test Statistics to Nonnormality and Specification Error in Confirmatory Factor Analysis. Psychol. Methods 1996, 1, 16–29. [Google Scholar] [CrossRef]
- Nunnally, J.C. Psychometric Theory, 2nd ed.; McGraw-Hill: New York, NY, USA, 1978. [Google Scholar]
- Cohen, J. Set Correlation and Contingency Tables. Appl. Psychol. Meas. 1988, 12, 425–434. [Google Scholar] [CrossRef]
- Bentler, P.M.; Bonett, D.G. Significance Tests and Goodness-of-Fit in Analysis of Covariance Structures Significance Tests and Goodness of Fit in the Analysis of Covariance Structures. August. Psychol. Bull. 1980, 88, 588–606. [Google Scholar] [CrossRef]
- Bentler, P.M. Comparative Fit Indexes in Structural Models. Psychol. Bull. 1990, 107, 238. [Google Scholar] [CrossRef] [PubMed]
- Steiger, J.H. Statistically Based Tests for the Number of Common Factors. In Proceedings of the Annual Meeting of the Psychometric Society, Iowa City, IA, USA, 28 May 1980. [Google Scholar]
- Xia, Y.; Yang, Y. RMSEA, CFI, and TLI in Structural Equation Modeling with Ordered Categorical Data: The Story They Tell Depends on the Estimation Methods. Behav. Res. Methods 2019, 51, 409–428. [Google Scholar] [CrossRef] [PubMed]
- Maher, M.A.; Ford, M.E.; Thompson, C.M. Degree Progress of Women Doctoral Students: Factors That Constrain, Facilitate, and Differentiate. Rev. High. Educ. 2004, 27, 385–408. [Google Scholar] [CrossRef]
- Brown Ii, M.C.; Davis, G.L.; McClendon, S.A. Mentoring Graduate Students of Color: Myths, Models, and Modes. Peabody J. Educ. 1999, 74, 105–118. [Google Scholar] [CrossRef]
- Holley, K.A.; Caldwell, M.L. The Challenges of Designing and Implementing a Doctoral Student Mentoring Program. Innov. High. Educ. 2012, 37, 243–253. [Google Scholar] [CrossRef]
- Flynn, D. Baccalaureate Attainment of College Students at 4-Year Institutions as a Function of Student Engagement Behaviors: Social and Academic Student Engagement Behaviors Matter. Res. High. Educ. 2014, 55, 467–493. [Google Scholar] [CrossRef]
- Buzzanell, P.M.; Long, Z.; Anderson, L.B.; Kokini, K.; Batra, J.C. Mentoring in Academe: A Feminist Poststructural Lens on Stories of Women Engineering Faculty of Color. Manag. Commun. Q. 2015, 29, 440–457. [Google Scholar] [CrossRef]
- Alston, G.D.; Guy, B.S.; Campbell, C.D. Ready for the Professoriate? The Influence of Mentoring on Career Development for Black Male Graduate Students in STEM. J. Afr. Am. Males Educ. JAAME 2017, 8, 45–66. [Google Scholar]
- Nadal, K.L.; Wong, Y.; Griffin, K.E.; Davidoff, K.; Sriken, J. The Adverse Impact of Racial Microaggressions on College Students’ Self-Esteem. J. Coll. Stud. Dev. 2014, 55, 461–474. [Google Scholar] [CrossRef]
- Lent, R.W.; Brown, S.D.; Sheu, H.-B.; Schmidt, J.; Brenner, B.R.; Gloster, C.S.; Wilkins, G.; Schmidt, L.C.; Lyons, H.; Treistman, D. Social Cognitive Predictors of Academic Interests and Goals in Engineering: Utility for Women and Students at Historically Black Universities. J. Couns. Psychol. 2005, 52, 84–92. [Google Scholar] [CrossRef]
- Hébert, T.P. An Examination of High-Achieving First-Generation College Students From Low-Income Backgrounds. Gift. Child Q. 2018, 62, 96–110. [Google Scholar] [CrossRef]
- Pascarella, E.T.; Pierson, C.T.; Wolniak, G.C.; Terenzini, P.T. First-Generation College Students: Additional Evidence on College Experiences and Outcomes. J. High. Educ. 2004, 75, 249–284. [Google Scholar] [CrossRef]
- Próspero, M.; Vohra-Gupta, S. First Generation College Students: Motivation, Integration, and Academic Achievement. Community Coll. J. Res. Pract. 2007, 31, 963–975. [Google Scholar] [CrossRef]
- Kuh, G.D. Excerpt from High-Impact Educational Practices: What They Are, Who Has Access to Them, and Why They Matter. Assoc. Am. Coll. Univ. 2008, 14, 28–29. [Google Scholar]
- Barthelemy, R.S.; McCormick, M.; Henderson, C. Gender Discrimination in Physics and Astronomy: Graduate Student Experiences of Sexism and Gender Microaggressions. Phys. Rev. Phys. Educ. Res. 2016, 12, 020119. [Google Scholar] [CrossRef]
- Bettencourt, G.M.; Mansour, K.E.; Hedayet, M.; Feraud-King, P.T.; Stephens, K.J.; Tejada, M.M.; Kimball, E. Is First-Gen an Identity? How First-Generation College Students Make Meaning of Institutional and Familial Constructions of Self. J. Coll. Stud. Retent. Res. Theory Pract. 2022, 24, 271–289. [Google Scholar] [CrossRef]
- Havlik, S.; Pulliam, N.; Malott, K.; Steen, S. Strengths and Struggles: First-Generation College-Goers Persisting at One Predominantly White Institution. J. Coll. Stud. Retent. Res. Theory Pract. 2020, 22, 118–140. [Google Scholar] [CrossRef]
- Nguyen, H.M. Faculty Advisors’ Experiences with International Graduate Students. J. Int. Stud. 2013, 3, 102–116. [Google Scholar] [CrossRef]
- Ren, J.; Hagedorn, L.S. International Graduate Students’ Academic Performance: What Are the Influencing Factors? J. Int. Stud. 2012, 2, 135–143. [Google Scholar] [CrossRef]
- Oswalt, S.B.; Riddock, C.C. What to Do about Being Overwhelmed: Graduate Students, Stress and University Services. Coll. Stud. Aff. J. 2007, 27, 24–44. [Google Scholar]
- Yusuf, J.-E.; Saitgalina, M.; Chapman, D.W. Work-Life Balance and Well-Being of Graduate Students. J. Public Aff. Educ. 2020, 26, 458–483. [Google Scholar] [CrossRef]
- Museus, S.D.; Chang, T.-H. The Impact of Campus Environments on Sense of Belonging for First-Generation College Students. J. Coll. Stud. Dev. 2021, 62, 367–372. [Google Scholar] [CrossRef]
- Walton, G.M.; Logel, C.; Peach, J.M.; Spencer, S.J.; Zanna, M.P. Two Brief Interventions to Mitigate a “Chilly Climate” Transform Women’s Experience, Relationships, and Achievement in Engineering. J. Educ. Psychol. 2015, 107, 468. [Google Scholar] [CrossRef]
- Phelan, J.C.; Link, B.G.; Tehranifar, P. Social Conditions as Fundamental Causes of Health Inequalities: Theory, Evidence, and Policy Implications. J. Health Soc. Behav. 2010, 51, S28–S40. [Google Scholar] [CrossRef]
- Xu, Y.J. Career Outcomes of STEM and Non-STEM College Graduates: Persistence in Majored-Field and Influential Factors in Career Choices. Res. High. Educ. 2013, 54, 349–382. [Google Scholar] [CrossRef]
- Gardner, S.K.; Holley, K.A. “Those Invisible Barriers Are Real”: The Progression of First-Generation Students through Doctoral Education. Equity Excell. Educ. 2011, 44, 77–92. [Google Scholar] [CrossRef]
- Roksa, J.; Feldon, D.F.; Maher, M. First-Generation Students in Pursuit of the PhD: Comparing Socialization Experiences and Outcomes to Continuing-Generation Peers. J. High. Educ. 2018, 89, 728–752. [Google Scholar] [CrossRef]
- Ellis, J.M.; Powell, C.S.; Demetriou, C.P.; Huerta-Bapat, C.; Panter, A.T. Examining First-Generation College Student Lived Experiences with Microaggressions and Microaffirmations at a Predominately White Public Research University. Cultur. Divers. Ethnic Minor. Psychol. 2019, 25, 266. [Google Scholar] [CrossRef]
| GSSS Participant | University Graduate Population | |
|---|---|---|
| URM | 15.5% | 24% |
| Female | 56.4% | 48% |
| International | 22% | 31% |
| Part-time | 7.4% | 37% |
| Ph.D. | 79.7% | 36% |
| Variable | Micro- Affirmations | Sense of Belonging | Mentor | Financial | Access & Opportunity | Imposter Syndrome | Micro- Aggressions |
|---|---|---|---|---|---|---|---|
| Microaffirmations | 1 | ||||||
| Sense of Belonging | 0.840 * | 1 | |||||
| Mentor Support | 0.741 * | 0.827 * | 1 | ||||
| Financial Support | 0.349 * | 0.350 * | 0.190 * | 1 | |||
| Access & Opportunity | 0.485 * | 0.599 * | 0.663 * | 0.266 * | 1 | ||
| Imposter Syndrome | 0.069 | 0.085 | 0.064 | 0.047 | −0.157 | 1 | |
| Microaggression | 0.310 * | 0.219 * | 0.154 * | 0.238 * | 0.137 * | 0.212 * | 1 |
| Item | N | Mean | SD | Skewness | Kurtosis | r2 | Alpha | |
|---|---|---|---|---|---|---|---|---|
| Microaffirmations | Scale | — | — | — | — | — | — | 0.890 |
| q24 | 537 | 3.89 | 0.825 | 0.000 | 0.000 | 0.80 | — | |
| q23 | 537 | 3.92 | 0.784 | 0.000 | 0.000 | 0.77 | — | |
| q22 | 537 | 4.10 | 0.862 | 0.000 | 0.000 | 0.61 | — | |
| q25 | 537 | 4.22 | 0.855 | 0.000 | 0.000 | 0.55 | — | |
| Sense of Belonging | Scale | — | — | — | — | — | — | 0.803 |
| q33 | 537 | 3.45 | 1.105 | 0.000 | 0.016 | 0.69 | — | |
| q35 | 537 | 3.93 | 0.956 | 0.000 | 0.000 | 0.50 | — | |
| q36 | 537 | 3.11 | 1.172 | 0.150 | 0.000 | 0.51 | — | |
| q34 | 537 | 3.88 | 0.946 | 0.000 | 0.004 | 0.35 | — | |
| Mentor Support | Scale | — | — | — | — | — | — | 0.756 |
| q48 | 537 | 3.69 | 0.983 | 0.000 | 0.134 | 0.56 | — | |
| q46 | 537 | 3.54 | 1.080 | 0.000 | 0.189 | 0.57 | — | |
| q47 | 536 | 3.91 | 0.949 | 0.000 | 0.002 | 0.40 | — | |
| Financial Support | Scale | — | — | — | — | — | — | 0.810 |
| q41 | 535 | 3.44 | 1.115 | 0.000 | 0.205 | 0.55 | — | |
| q40 | 537 | 2.69 | 1.371 | 0.096 | 0.000 | 0.46 | — | |
| q39 | 535 | 2.83 | 1.274 | 0.546 | 0.000 | 0.43 | — | |
| q42 | 537 | 3.33 | 1.408 | 0.000 | 0.000 | 0.39 | — | |
| q44 | 537 | 3.22 | 1.242 | 0.024 | 0.000 | 0.38 | — | |
| q43 | 537 | 3.18 | 1.318 | 0.089 | 0.000 | 0.33 | — | |
| Access & Opportunity | Scale | — | — | — | — | — | — | 0.729 |
| q56 | 536 | 4.01 | 0.974 | 0.000 | 0.000 | 0.46 | — | |
| q52 | 537 | 3.77 | 1.000 | 0.000 | 0.194 | 0.40 | — | |
| q54 | 537 | 3.08 | 1.134 | 0.093 | 0.000 | 0.40 | — | |
| q53 | 537 | 3.28 | 1.009 | 0.000 | 0.016 | 0.33 | — | |
| q38 | 537 | 3.74 | 1.197 | 0.000 | 0.364 | 0.23 | — | |
| Imposter Syndrome | Scale | — | — | — | — | — | — | 0.834 |
| q30 | 537 | 2.23 | 1.148 | 0.000 | 0.251 | 0.62 | — | |
| q28 | 537 | 2.52 | 1.275 | 0.000 | 0.000 | 0.64 | — | |
| q39 | 537 | 2.34 | 1.155 | 0.000 | 0.185 | 0.63 | — | |
| Microaggressions | Scale | — | — | — | — | — | — | 0.768 |
| q19 | 537 | 3.36 | 1.172 | .029 | 0.000 | 0.91 | — | |
| q18 | 537 | 2.73 | 1.150 | 0.000 | 0.000 | 0.42 | — |
| Sample | Model | χ2 | CFI | RMSE | SRMR |
|---|---|---|---|---|---|
| CFA | 7-factor, 29 items | (df = 356, N = 271) = 701.954, p < 0.005 | 0.894 | 0.060 * | 0.0639 * |
| CFA | 7-factor, 28 items | (df = 329, N = 271) = 620.919, p < 0.005 | 0.907 * | 0.057 * | 0.0583 * |
| EFA | 7-factor, 28 items | (df = 329, N = 271) = 620.081, p < 0.005 | 0.911 * | 0.058 * | N/A |
| # | Model | χ2 | CFI | RMSEA | SRMR |
|---|---|---|---|---|---|
| 1 | CFA | (df = 303, N = 534) = 735.767, p < 0.005 | 0.928 * | 0.052 * | 0.047 * |
| 2 | SEM with all paths | (df = 306, N = 534) = 740.23, p < 0.005 | 0.928 * | 0.052 * | 0.047 * |
| 3 | SEM with sig. paths | (df = 312, N = 534) = 742.52, p < 0.005 | 0.929 * | 0.051 * | 0.047 * |
| 4 | SEM all paths and all control variables | (df = 652, N = 534) = 1692.80, p < 0.005 | 0.843 | 0.055 * | 0.086 * |
| 5 | SEM with all paths and sig. control variables | (df = 664, N = 534) = 1706.74, p < 0.005 | 0.843 | 0.054 * | 0.097 * |
| 6 | SEM with sig. paths and sig. control variables | (df = 669, N = 534) = 1707.43, p < 0.005 | 0.844 | 0.054 * | 0.097 |
| 7 | SEM with sig. paths, sig. control variables, and cov. | (df = 540, N = 534) = 1189.38, p < 0.005 | 0.901 * | 0.047 * | 0.062 * |
| Model | Baseline Model | Constrained Model | Satorra-Bentler Scaled χ2 | df | p-Value |
|---|---|---|---|---|---|
| 1 | SEM—all paths | SEM—sig. paths | 2.29 | 6 | 0.891 |
| 2 | SEM—all paths & all control variables | SEM—all paths & sig. control variables | 13.94 | 12 | 0.305 |
| 3 | SEM—all paths & all control variables | SEM—sig. paths & sig. control variables | 14.63 | 17 | 0.662 |
| 4 | SEM—all paths & all control variables | SEM—sig. paths, sig. control variables, and cov. | 503.41 * | 112 | <0.005 |
| Exogenous Variable | Endogenous Variable | Regression Coefficient | SD | p-Value |
|---|---|---|---|---|
| Microaffirmations | Sense of Belonging | 0.425 * | 0.057 | 0.000 |
| Mentor Support | Sense of Belonging | 0.514 * | 0.057 | 0.000 |
| Financial Support | Sense of Belonging | 0.117 * | 0.037 | 0.001 |
| Mentor Support | Access and Opportunity | 0.637 * | 0.038 | 0.000 |
| Financial Support | Access and Opportunity | 0.139 * | 0.049 | 0.004 |
| Microaggressions | Imposter Syndrome | 0.222 * | 0.049 | 0.000 |
| Regression Coefficient | SD | p-Value | ||
|---|---|---|---|---|
| Microaffirmations | Female | −0.114 * | 0.034 | 0.000 |
| Sense of Belonging | Native American | 0.053 ** | 0.029 | 0.070 |
| Sense of Belonging | Nonbinary | −0.097 * | 0.030 | 0.001 |
| Mentor Support | Part-time | −0.090 * | 0.038 | 0.017 |
| Mentor Support | Ph.D. Student | 0.129 * | 0.037 | 0.001 |
| Financial Support | STEM Major | 0.246 * | 0.045 | 0.000 |
| Financial Support | International student | −0.095 * | 0.045 | 0.036 |
| Financial Support | Nonbinary | −0.076 ** | 0.045 | 0.090 |
| Financial Support | Part-time Student | 0.098 * | 0.046 | 0.034 |
| Access and Opportunity | STEM Major | 0.107 * | 0.043 | 0.013 |
| Access and Opportunity | Ph.D. Student | 0.210 * | 0.041 | 0.000 |
| Imposter Syndrome | Black | −0.100 * | 0.049 | 0.027 |
| Imposter Syndrome | International student | −0.162 * | 0.046 | 0.000 |
| Imposter Syndrome | Part-time student | −0.200 * | 0.045 | 0.000 |
| Imposter Syndrome | 4th-year student | −0.113 * | 0.045 | 0.012 |
| Microaggressions | Nonbinary | 0.117 * | 0.038 | 0.002 |
| Microaggressions | Female | 0.614 * | 0.033 | 0.000 |
| Microaggressions | Part-time Student | 0.117 * | 0.038 | 0.002 |
| Regression Coefficient | SD | p-Value | ||
|---|---|---|---|---|
| Sense of Belonging | STEM-URM | 0.053 ** | 0.029 | 0.069 |
| STEM-1st Gen. Grad. | 0.061 * | 0.032 | 0.030 | |
| STEM-Nonbinary | −0.137 * | 0.035 | 0.085 | |
| Financial Support | STEM-Female | 0.127 * | 0.049 | 0.008 |
| STEM-1st Gen. Grad. | 0.100 * | 0.049 | 0.040 | |
| Access & Opportunity | STEM-URM | 0.103 * | 0.042 | 0.015 |
| Imposter Syndrome | STEM-Female | 0.123 * | 0.052 | 0.019 |
| STEM-Nonbinary | 0.114 * | 0.046 | 0.013 | |
| Microaggressions | STEM-Female | 0.496 * | 0.040 | 0.000 |
| STEM-Nonbinary | 0.087 * | 0.044 | 0.045 | |
| STEM-1st Gen. Grad. | −0.205 * | 0.044 | 0.000 |
Disclaimer/Publisher’s Note: The statements, opinions and data contained in all publications are solely those of the individual author(s) and contributor(s) and not of MDPI and/or the editor(s). MDPI and/or the editor(s) disclaim responsibility for any injury to people or property resulting from any ideas, methods, instructions or products referred to in the content. |
© 2023 by the authors. Licensee MDPI, Basel, Switzerland. This article is an open access article distributed under the terms and conditions of the Creative Commons Attribution (CC BY) license (https://creativecommons.org/licenses/by/4.0/).
Share and Cite
Collier, K.M.; Blanchard, M.R. Investigating Graduate Students’ Experiences through Structural Equation Modeling (SEM). Trends High. Educ. 2023, 2, 718-746. https://doi.org/10.3390/higheredu2040042
Collier KM, Blanchard MR. Investigating Graduate Students’ Experiences through Structural Equation Modeling (SEM). Trends in Higher Education. 2023; 2(4):718-746. https://doi.org/10.3390/higheredu2040042
Chicago/Turabian StyleCollier, Karen M., and Margaret R. Blanchard. 2023. "Investigating Graduate Students’ Experiences through Structural Equation Modeling (SEM)" Trends in Higher Education 2, no. 4: 718-746. https://doi.org/10.3390/higheredu2040042
APA StyleCollier, K. M., & Blanchard, M. R. (2023). Investigating Graduate Students’ Experiences through Structural Equation Modeling (SEM). Trends in Higher Education, 2(4), 718-746. https://doi.org/10.3390/higheredu2040042