Abstract
Despite remarkable quantitative growth in Application Programming Interface (API) call volume, Korea’s Open Banking Platform faces a critical qualitative imbalance. This paper investigates this hidden challenge, revealing a significant divergence between quantitative metrics and qualitative indicators. Through time-series analysis of registered accounts and user data, alongside examining financial institution and FinTech dynamics, I identify decelerating platform growth and constrained user base expansion. While API calls exploded, registered account and user growth lagged substantially. Platform growth exhibits player bias, and user base expansion has stagnated despite increased accounts-per-user ratios. These findings indicate that Korea’s Open Banking Platform’s sustainability is threatened by qualitative imbalances masked by quantitative success. I advocate for a shift to data-driven governance, moving beyond API call volume-centric metrics to qualitative indicators focused on user and account base assessment. I call for data-driven policy innovation to foster a more balanced and sustainable platform ecosystem, addressing growth slowdown and user base limitations.
1. Introduction
1.1. Open Banking in the Platform Economy: A Catalyst for Financial Innovation
Digital transformation, propelled by the expansion of platform economies, is fundamentally reshaping industries worldwide. Platforms act as central engines of this transformation, driving new value creation, dissolving traditional industry boundaries, fostering innovative business models, and accelerating economic growth [1,2]. By directly connecting producers and consumers and leveraging data and technology for personalized services, platforms are facilitating a shift from supplier-centric to consumer-centric economies.
The financial industry is at the forefront of this digital revolution, with platform-based financial service innovation advancing rapidly alongside the rise of FinTech. Open Banking platforms, in particular, have emerged as critical infrastructure, poised to revolutionize the financial industry paradigm [3,4]. Open Banking aims to enhance consumer benefits by enabling secure third-party access to financial data and functionalities held by banks. This supports FinTechs in developing innovative financial services and fosters competition within financial markets. Major economies, including the European Union (EU) with its Payment Services Directive 2 (PSD2) [5] and the United Kingdom with its Open Banking Initiative [6], have proactively adopted Open Banking policies to drive financial innovation, establishing it as a new global standard.
1.2. Korea’s Open Banking: Quantitative Achievements and Qualitative Concerns
Since its inception in 2019, Korea’s Open Banking platform has been lauded as a success story, primarily based on its rapid quantitative expansion [7,8,9,10]. API call volume has experienced exponential growth, escalating from 83.97 million in December 2019 to 14.04 billion by January 2025—an extraordinary 1571.68% increase, signaling external success. With participation from 67 financial institutions and over 140 FinTechs, 190 million registered accounts, and cumulative transactions exceeding 83 trillion Korean won [11], quantitative metrics suggest that Korea’s Open Banking has effectively spurred financial innovation.
However, solely focusing on API call volume, which surged by 1571.68%, can be misleading. This quantitative success may mask a critical ‘qualitative imbalance’. While API calls exploded, growth in registered accounts and users has lagged significantly. This study investigates this divergence, focusing on growth deceleration and constrained user base expansion, contrasting these qualitative aspects with the purely quantitative metric of API call volume.
1.3. The Imperative of Data-Driven Governance Innovation
This study underscores the critical need to balance quantitative growth with qualitative equilibrium to ensure the sustainable development of Korea’s Open Banking platform. I argue for the urgent adoption of data-driven governance innovation to achieve this balance. Adopting an analytical framework that juxtaposes ‘quantitative growth’ against ‘qualitative imbalance,’ I offer a more nuanced perspective that incorporates qualitative indicators such as registered accounts and user numbers, moving beyond a performance evaluation solely centered on API call volume. my objective is to propose directions for data-driven governance innovation that fosters a robust and sustainable platform ecosystem.
To this end, I analyze monthly time series data on registered accounts and users within Korea’s Open Banking platform to address the following research questions:
- 1.
- Research Question 1: What factors contribute to the divergence between the quantitative growth in API call volume and the deceleration of qualitative growth in registered accounts and users in Korea’s Open Banking platform?
- 2.
- Research Question 2: What factors constrain new user inflow and user base expansion?
- 3.
- Research Question 3: How can data-driven governance foster innovation and address these imbalances?
The remainder of this paper is structured as follows: Section 2 provides the theoretical background, exploring platform ecosystem volatility, sustainable growth, limitations of platform growth metrics, and the necessity of qualitative indicators. Section 3 details the research design and methodology, including data sources, time series analysis techniques, volatility measurement indicators, and policy change impact analysis methods. Section 4 presents the research results, encompassing descriptive statistics, time series modeling, prediction performance comparisons, volatility analysis, policy change impact assessment, and future predictions. Finally, Section 5 discusses the key findings, derives academic and policy implications, and concludes with limitations and directions for future research.
2. Theoretical Background
2.1. Platform Ecosystem Volatility and Sustainable Growth
Platform ecosystems are complex systems characterized by interactions among diverse stakeholders to create value. These ecosystems exhibit network effects, two-sided market dynamics, and modularity, which drive growth and innovation but also introduce inherent volatility [12,13]. Platform ecosystem volatility arises from technological disruptions, regulatory shifts, intensifying competition, and evolving consumer behaviors, rendering growth trajectories unpredictable and complicating platform governance [14,15].
Key characteristics of platform ecosystem volatility include:
- Nonlinearity: Small changes can trigger disproportionately large and unpredictable outcomes. Minor initial variations can amplify over time, exhibiting properties akin to chaos theory.
- Self-organization: Platform ecosystems develop order through decentralized interactions among participants, lacking central control. This reduces predictability and generates volatility that resists top-down management.
- Complexity: Platform ecosystems comprise intricate webs of stakeholders, technologies, services, rules, and policies. This complexity makes system behavior prediction challenging and partial changes can create unforeseen ripple effects.
- Unpredictability: Platform ecosystems are highly sensitive to external environmental changes and involve numerous interacting uncertain variables. This makes even short-term predictions difficult, with long-term forecasts becoming increasingly uncertain.
Platform ecosystem volatility presents a paradox for sustainable growth. While volatility can create opportunities and stimulate innovation, it also threatens ecosystem stability and amplifies uncertainty for participants, potentially inhibiting investment and innovation [16,17]. Heightened unpredictability can make participants hesitant to engage in long-term investments due to increased future uncertainty, potentially leading to growth deceleration and diminished competitiveness.
Therefore, data-driven governance innovation is crucial for effectively managing volatility and transforming it into a catalyst for sustainable platform ecosystem growth. Data-driven governance involves the real-time collection, analysis, and utilization of platform operational data to detect ecosystem volatility, predict future trends, and proactively manage risks [18,19]. This governance approach can enhance transparency and efficiency in policy decisions, ensuring platform stability and sustainability amidst uncertainty.
Understanding the global context of Open Banking platform development is essential for addressing qualitative imbalance issues in Korea’s context. Leading economies like the UK and EU have implemented diverse approaches to manage platform qualitative growth while fostering financial innovation through Open Banking policies. The UK’s Open Banking Standard focuses on API technical stability and service quality through phased implementation and quality certification frameworks [6]. The EU, via PSD2, has established standardized API frameworks and security certification systems [5,20]. These international examples offer valuable benchmarks for addressing qualitative imbalances. For instance, experiences from these pioneering markets suggest that while regulatory frameworks can catalyze initial platform development and participation, achieving sustained qualitative growth—such as fostering a vibrant ecosystem of innovative third-party services and ensuring broad consumer adoption beyond basic functionalities—often presents ongoing challenges [4]. Understanding these international precedents, including the difficulties in translating initial quantitative uptake into deeper qualitative engagement, provides a useful backdrop for analyzing the Korean case. While acknowledging this global context, this study focuses its empirical analysis on the specific dynamics of Korea’s platform through time-series data.
2.2. Rethinking Platform Growth Metrics: From ‘Quantitative’ to ‘Qualitative’ Indicators
Measuring and evaluating platform performance is a critical function of platform governance. Traditionally, platform performance metrics have emphasized quantitative indicators, particularly those reflecting external growth scale, such as API call volume, transaction amount, subscriber numbers, and Monthly Active Users (MAU) [19,21]. API call volume is useful for gauging platform openness and utilization, transaction amount provides an intuitive measure of economic scale, and subscriber counts and MAU reflect user base size. These quantitative indicators can be effective for evaluating early-stage platform growth and highlighting initial successes.
However, relying solely on quantitative indicators like API call volume and transaction amount presents significant limitations. These metrics, while superficially impressive, fail to capture the sustainable platform growth and crucial qualitative ecosystem changes. First, they may overlook the substantive value generated on the platform.API call volume alone tells me little about the quality of services or their actual value to users. Second, there is a risk of prioritizing superficial quantitative growth. Inflated API calls from automated systems or simple integrations can be misleading, overvaluing growth unrelated to genuine platform value. Third, metric bias is inherent. API call volume, being an API provider-centric metric, fails to capture broader platform values, such as FinTech innovation, consumer benefits, and overall ecosystem balance.
To overcome these limitations and promote sustainable platform ecosystem growth, it is essential to actively utilize qualitative indicators that measure intrinsic platform value, substantive user expansion, ecosystem vitalization, innovative service creation, and social value contribution. Qualitative indicators offer a more direct assessment of long-term platform viability and value enhancement for all participants. This study emphasizes the importance of platform qualitative growth indicators, often overlooked in existing research, and proposes three core indicators for diagnosing qualitative growth in Korea’s Open Banking platform: (1) registered account numbers, (2) user numbers, and (3) the user-to-account ratio.
2.2.1. Number of Registered Accounts
Registered account numbers represent the total accounts registered on the Open Banking platform, serving as a key qualitative indicator of platform scalability and growth potential. This metric reflects the breadth and diversity of participating financial institutions (FIs) and FinTechs, illustrating the platform’s encompassing financial assets. An increase in registered accounts signifies an expanding foundation for users to manage finances and utilize innovative services through the platform. Consequently, registered account numbers are a crucial measure of the platform’s potential for value creation and future growth. However, registered account numbers alone do not fully capture qualitative growth, necessitating consideration of new versus existing accounts, personal versus corporate accounts, and changes in active account proportions.
2.2.2. Number of Users
User numbers signify the actual individuals utilizing financial services through the Open Banking platform, representing a critical qualitative indicator of platform adoption and user base size. This metric directly reflects the platform’s reach and the value it delivers to individuals. Increasing user numbers indicate growing market penetration and wider consumer access to innovative financial services. Active User trends are particularly important for understanding platform engagement and user loyalty. User growth forms the basis for sustained platform expansion and revenue generation, making it a key indicator of ecosystem viability. However, user numbers can also be quantitatively focused. Distinguishing between new and returning users, individual and corporate users, and analyzing user activity patterns (transaction frequency, service usage) provides a more nuanced understanding of qualitative growth.
2.2.3. User-to-Account Ratio
The user-to-account ratio, calculated as the ratio of registered account numbers to user numbers, is a qualitative indicator reflecting platform efficiency and user engagement. This metric represents the average number of registered accounts per user, indicating how intensively users utilize the platform and integrate it into their financial lives. A high user-to-account ratio suggests users are not merely experimenting with the platform but adopting it as a primary financial management tool, indicating strong platform loyalty. Conversely, a low ratio might suggest one-time or limited service-specific usage. Analyzing trends in this ratio offers insights into platform efficiency, user base expansion strategies, account duplication issues, and evolving user utilization patterns. Therefore, the user-to-account ratio is a valuable qualitative indicator for evaluating substantive platform growth and sustainability. However, it should be analyzed in conjunction with other qualitative indicators (user activity, service satisfaction) for a comprehensive understanding of qualitative growth.
2.2.4. Additional Qualitative Indicators
Beyond registered accounts, user numbers, and the user-to-account ratio, several additional qualitative indicators can enrich the assessment of platform qualitative growth. Service satisfaction, measured through surveys, user reviews, and ratings, provides insights into whether platform services meet user expectations and deliver positive user experiences (UX). User experience can be evaluated through usability testing, A/B testing, and user journey analysis, identifying areas for platform improvement by understanding user interface intuitiveness and user challenges. Innovation service creation performance assesses newly launched platform-based innovative financial services, their adoption rates, and market response, measuring the platform’s contribution to financial innovation. Digital inclusivity evaluates the platform’s impact on improving financial accessibility for marginalized groups, considering service adoption among elderly, low-income, and disabled populations. Beyond these, indicators such as platform social value contribution, ecosystem participant satisfaction, and platform governance transparency can be incorporated, depending on platform characteristics and goals, to provide a multidimensional evaluation of qualitative growth.
In summary, Section 2 has theoretically examined the relationship between platform ecosystem volatility and sustainable growth, critically reviewed quantitative metric-centric platform performance measures, and introduced a new platform growth evaluation framework centered on qualitative indicators. Registered account numbers, user numbers, and the user-to-account ratio will serve as core analytical tools for diagnosing qualitative growth in Korea’s Open Banking platform and guiding data-driven governance innovation.
3. Research Design and Methodology
This study employs the following research design and methodology to empirically analyze the divergence between quantitative growth and qualitative imbalance in Korea’s Open Banking platform using time series data, and to propose data-driven governance innovation strategies.
3.1. Research Data
The data for this study comprises monthly time series for key qualitative indicators—specifically, registered accounts and subscribers for financial institutions (FIs) and FinTechs. The final dataset used for the analysis spans from December 2019 to January 2025, covering a total of 62 consecutive months. This dataset was primarily sourced from the ‘Open Banking Service Statistics’ publicly disseminated by the Korea Financial Telecommunications & Clearings Institute (KFTC). Contextual information, such as aggregate API call volume estimates and policy implementation dates, was obtained from press releases issued by the Financial Services Commission (FSC).
It should be noted that an initial version of the dataset for the period October 2019 to January 2025 had some missing observations for the initial months (October and November 2019 for certain indicators). While the manuscript in its earlier draft mentioned the use of linear interpolation as a general data processing step, the final dataset subsequently compiled for the analysis presented herein, covering December 2019 to January 2025, was complete for the core time series of registered accounts and subscribers. Therefore, missing value imputation techniques such as linear interpolation were ultimately not applied to the primary analytical variables used in the econometric modeling (ARIMA, Prophet) for this 62-month period, as there were no missing values to address. Outliers in these series were initially identified using the Z-score method (e.g., values exceeding ±3 standard deviations from the mean). However, upon inspection, these extreme values were often found to coincide with identifiable events (e.g., initial platform launch effects, specific campaign periods, or immediate post-policy adjustments) and were retained in the analysis to reflect real-world dynamics, as the models employed (particularly Prophet with its changepoint detection) are designed to accommodate such shifts.
Data were collected and analyzed separately for FIs (all 67 participating institutions) and FinTechs (approximately 140 participating entities) to examine dynamics across different player types within the Open Banking ecosystem. All data processing and time series analyses were conducted using Python (version 3.9), with principal libraries including ‘pandas’ for data manipulation, ‘statsmodels’ for ARIMA modeling, and ‘prophet’ for the Prophet forecasting model.
The primary indicators for analysis are:
- Registered accounts (FI): Number of accounts registered by financial institutions on the Open Banking platform.
- Subscribers (FI): Number of users who subscribed to Open Banking services through financial institutions.
- Registered accounts (FinTech): Number of accounts registered by FinTechs on the Open Banking platform.
- Subscribers (FinTech): Number of users who subscribed to Open Banking services through FinTechs.
Collecting registered account and subscriber data separately for FIs and FinTechs allows for analysis of concentration trends within the platform ecosystem and assessment of growth balance. Furthermore, analyzing registered account and subscriber data together enables the calculation of the user-to-account ratio, providing insights into user base expansion and platform utilization efficiency.
3.2. Utilization of API Call Count Data
In this study, API call count data serves as a descriptive comparative indicator to illustrate the platform’s quantitative growth trajectory. Due to the unavailability of publicly accessible, granular actual API call data from the platform operator for the research period, I generated virtual API call count data. This virtual data was constructed to reflect the overall exponential growth trend reported by the Financial Services Commission (FSC) and other public sources, escalating from approximately 83.97 million in December 2019 to 14.04 billion by January 2025 (see Section 1.2). The generation process assumed an exponential growth curve between these two reported points and incorporated a degree of random volatility to mimic plausible real-world fluctuations. The specific methodology for generating this virtual data is available from the author upon request.
It is crucial to acknowledge that this virtual data, while serving its illustrative purpose, may not precisely mirror the actual month-to-month API call dynamics, the distribution of calls across different service types (e.g., inquiry vs. transfer APIs), or the proportion of system-driven versus user-initiated calls. Consequently, while this virtual data allows me to juxtapose an indicative quantitative growth trajectory with the empirically observed qualitative growth in registered accounts and users, direct causal inferences or precise comparative magnitudes drawn from this specific API call trend should be approached with caution. The core empirical analysis of this study focuses on the time series data of Registered Accounts and Users using ARIMA and Prophet models, for which actual data was available. The API call count data is not used as an input variable or an object of econometric analysis within these models but rather as a supplementary metric to contextualize and highlight the divergence between the platform’s widely reported quantitative expansion and its qualitative development, thereby enriching the discussion on potential imbalances.
3.3. Time Series Analysis Methodology
This study employs various time series analysis methodologies to analyze trends, seasonality, and volatility patterns in registered account and user data from Korea’s Open Banking platform, and to forecast future trends. The main methodologies are detailed below:
3.3.1. Descriptive Statistics Analysis
Descriptive statistical analysis was performed to understand the fundamental statistical properties of the time series data. For monthly registered account numbers and subscriber numbers, I calculated the mean, standard deviation, maximum value, minimum value, and coefficient of variation (CV) to characterize data distribution and volatility. The CV was particularly utilized as a valuable metric for comparing relative volatility across different time series datasets and assessing platform growth indicator stability.
3.3.2. Time Series Decomposition
Time series decomposition was applied to dissect the time series data into its constituent components: trend, seasonality, cyclical variation, and irregular variation. This allowed me to understand the direction and rate of platform growth trends, monthly or annual seasonal patterns, the magnitude of unpredictable irregular variations, and the underlying structural characteristics of the time series data. I employed both additive and multiplicative models for time series decomposition, selecting the model best suited to the data characteristics for presenting the analysis results.
3.3.3. ARIMA Model
I utilized the Autoregressive Integrated Moving Average (ARIMA) model, which predicts future values based on the autocorrelation inherent in time series data. The ARIMA model addresses non-stationarity through differencing, transforming the data into a stationary time series, and then constructs a predictive model by combining autoregressive (AR) and moving average (MA) components. In this study, I identified the optimal ARIMA (p,d,q) model using information criteria such as the Akaike Information Criterion (AIC) and the Bayesian Information Criterion (BIC). Model parameters were estimated using maximum likelihood estimation. Model fitness and prediction reliability were assessed through residual analysis and the Ljung-Box test. Seasonal ARIMA (SARIMA) models were also considered to account for seasonality, enhancing the robustness of the analysis. Prior to ARIMA modeling, all time series were tested for stationarity using the Augmented Dickey-Fuller (ADF) and Kwiatkowski-Phillips-Schmidt-Shin (KPSS) tests. The results, presented in Appendix B (Table A2), indicated that all series were non-stationary in their original levels but became stationary after first differencing. Consequently, the differencing order (d) was set to 1 for all subsequent ARIMA models. I then explored ARIMA (p,1,q) models with p and q parameters ranging from 0 to 2. The optimal model was selected based on minimizing AIC and BIC, and ensuring residual autocorrelation was not present based on the Ljung-Box test.
3.3.4. Prophet Model
The Prophet model, developed by Facebook, is specifically designed for time series forecasting that exhibits irregular volatility and seasonality, such as social media data and web traffic [22]. Prophet constructs predictive models by decomposing time series into trend, seasonality, and holiday effects as independent components. It offers advantages such as ease of use for non-experts and automatic changepoint detection. In this study, I used the Prophet model to analyze long-term trends and monthly seasonality in Korea’s Open Banking platform data and to predict future growth prospects. The Prophet model’s changepoint detection feature was particularly utilized to identify points where growth patterns shift in the data, and to analyze the impact of factors such as policy changes or external shocks on platform growth. Major policy change points, including MyData policy implementation (January 2022) [23] and the introduction of financial fraud prevention regulations (March 2023) [24], were included as external regressors in the Prophet model. This allowed me to analyze the causal impact of these policy changes on platform growth and improve the accuracy of future growth predictions.
The Prophet model is implemented in Python using the ‘prophet’ library. Most hyperparameters were set to their default values, which are generally robust. However, two key parameters were explicitly set: ‘changepoint-prior-scale’ was set to 0.05, and ‘seasonality-prior-scale’ was set to 10.0. The ‘changepoint-prior-scale’ controls the flexibility of the trend, determining how readily the model incorporates changepoints. The default value of 0.05 typically provides a good balance between fitting the data and avoiding overfitting, which was deemed appropriate for our dataset considering the observed shifts around policy implementation dates. A higher value might lead to overfitting to noise, while a much lower value might miss significant structural breaks. The ‘seasonality-prior-scale’ controls the strength of the seasonality model. The default value of 10.0 allows for reasonably flexible seasonal patterns, which is suitable for capturing the yearly seasonality evident in the monthly financial platform data. While an exhaustive hyperparameter optimization or sensitivity analysis was not the primary focus of this study—which aimed more at comparing the general utility of ARIMA and Prophet for these specific qualitative indicators and detecting policy impacts—these standard values were chosen to ensure a reasonable and common baseline for Prophet’s performance. Future research could delve into a more detailed sensitivity analysis of these parameters or employ cross-validation techniques for optimal hyperparameter tuning if forecasting accuracy is the paramount objective.
3.4. Volatility Measurement Indicators
In this study, various volatility measurement indicators were employed to quantitatively assess the volatility level of Korea’s Open Banking platform data and to analyze the impact of volatility on platform growth in conjunction with time series analysis results. The primary volatility measurement indicators are:
3.4.1. Coefficient of Variation (CV)
The coefficient of variation (CV), representing relative volatility, is calculated by dividing the standard deviation by the mean. The CV is useful for comparing the volatility of datasets with different scales or for analyzing changes in the volatility of the same dataset over time. In this study, I calculated the CV for monthly registered account and subscriber data to compare relative volatility levels across indicators and to evaluate platform growth indicator stability. A higher CV indicates greater relative volatility, while a lower CV suggests more stable data.
3.4.2. Standard Deviation (SD)
Standard deviation (SD) is an absolute volatility indicator representing the degree of data dispersion around the mean. SD is expressed in the same units as the data, making it easier to intuitively understand the actual magnitude of data variation. I calculated the SD for monthly registered account and subscriber data to compare the absolute magnitude of variation for each indicator and understand the variation range of platform growth indicators. A larger SD indicates a wider data variation range, while a smaller SD suggests a narrower range.
3.5. Policy Change Impact Analysis
This study sought to analyze the impact of major policy changes—MyData policy implementation (January 2022) and financial fraud prevention regulation introduction (March 2023)—on the growth of Korea’s Open Banking platform. The following methodologies were applied for policy change impact analysis:
3.5.1. Changepoint Analysis
Using the changepoint detection functionality of the Prophet model, I analyzed whether shifts in growth patterns and volatility occurred in Korea’s Open Banking platform data before and after the implementation of the MyData policy and the introduction of financial fraud prevention regulations. Changepoint analysis aimed to empirically determine if policy changes caused structural shifts in platform growth, contributed to growth acceleration or deceleration, and influenced platform volatility. The Prophet model automatically detects changepoints and estimates their location and magnitude, visually representing the impacts of policy changes.
3.5.2. Policy Effect Analysis
I segmented the time series data into periods before and after policy implementation, based on the MyData policy and financial fraud prevention regulation implementation dates. Descriptive statistics (mean, standard deviation, CV, etc.) and time series model (ARIMA, Prophet) analysis results were compared across these segments. Policy effect analysis aimed to verify whether policy implementation resulted in statistically significant changes in platform growth rate, volatility, and prediction patterns. I also sought to quantitatively analyze the short-term and long-term effects of policy changes. In particular, I conducted an in-depth analysis of the impact of policy changes on future growth prospects by comparing Prophet model predictions before and after policy implementation.
In summary, Section 3, Research Design and Methodology, has detailed the data sources, time series analysis methodologies, volatility measurement indicators, and policy change impact analysis methods employed in this study. By applying descriptive statistical analysis, time series decomposition, ARIMA models, and Prophet models, I aim to analyze trends, seasonality, and volatility patterns in Korea’s Open Banking platform data, predict future trends, and quantitatively assess platform growth indicator volatility levels. Changepoint analysis and policy effect analysis will allow for in-depth examination of the impact of policy changes, such as the MyData policy and financial fraud prevention regulations, on platform growth. Through this systematic research design and methodology, I expect to empirically analyze the qualitative growth imbalance issue in Korea’s Open Banking platform and propose data-driven governance innovation strategies.
4. Research Results
4.1. Descriptive Statistics Analysis Results
The descriptive statistics analysis results for monthly registered account and subscriber data from Korea’s Open Banking platform are presented in Table 1.

Table 1.
Descriptive statistics analysis results.
Table 1 presents the descriptive statistics for registered accounts and subscribers across financial institutions (FIs) and FinTechs. The results indicate substantial monthly registrations and subscriptions, averaging in the millions across all indicators. Specifically, the mean registered accounts for FIs are approximately 4.74 million, with subscribers averaging 1.62 million. FinTechs show slightly higher mean registered accounts at 5.40 million and subscribers at 2.44 million. However, the high standard deviations also reveal considerable volatility across all indicators. Comparing the coefficient of variation (CV), I observe the highest volatility for subscribers (FinTech) (0.40), followed by registered accounts (FinTech) (0.35), and then subscribers (FI) and registered accounts (FI), which share the same CV (0.31). This suggests that user and registered account numbers through FinTechs exhibit relatively greater instability and volatility compared to those associated with financial institutions.
The higher CV for subscribers (FinTech) suggests that FinTechs’ user bases are still in a nascent growth phase compared to established financial institutions. This implies a greater sensitivity to external environmental changes and competitive pressures for FinTech user acquisition. Conversely, the lower CV for registered accounts (FI) may indicate a more stable account base within financial institutions, with consistent account registration on the Open Banking platform contributing to steady growth. However, with CV values exceeding 0.3 for all indicators, it is more accurate to characterize the overall growth of Korea’s Open Banking platform as occurring within a volatile environment rather than exhibiting stability.
Furthermore, a visual inspection of the growth trajectories (Figure 1, Figure 2, Figure 3 and Figure 4) alongside the publicly reported exponential increase in API call volume (1571.68% from December 2019 to January 2025) suggests a significant divergence. While API calls exploded, the trends for registered accounts and subscribers indicate a more decelerated pattern of growth over time. This apparent contrast points towards a potential qualitative imbalance, where quantitative platform activity may not be fully matched by qualitative user and account base expansion. A more detailed quantitative comparison of these growth rates, particularly in relation to policy periods, will be presented later (Section 4.3). The mechanisms underlying this divergence are explored in Section 5.1. This stark contrast highlights a potential qualitative imbalance, where quantitative platform activity, as measured by API calls, does not proportionally translate into qualitative user and account base expansion. The mechanisms underlying this divergence between quantitative and qualitative growth indicators will be explored in detail in Section 5.1.

Figure 1.
Time series decomposition of registered accounts (financial institutions).
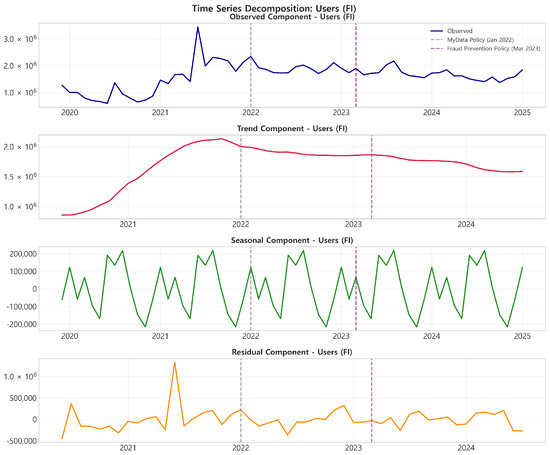
Figure 2.
Time series decomposition of subscribers (financial institutions).
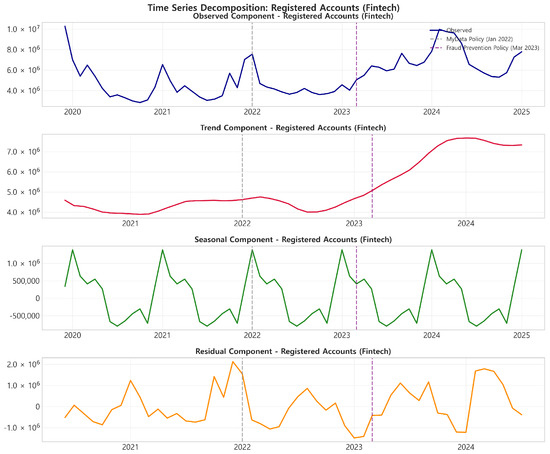
Figure 3.
Time series decomposition of registered accounts (FinTechs).
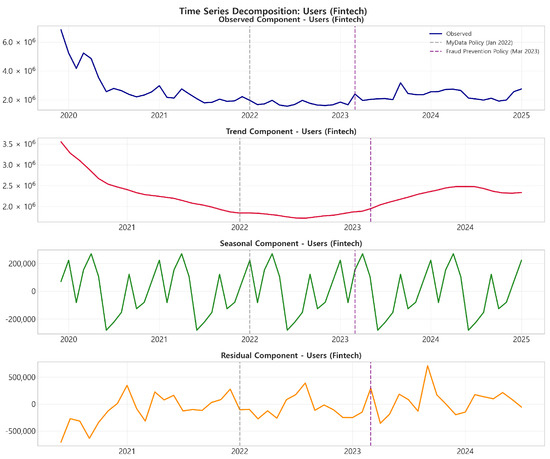
Figure 4.
Time series decomposition of subscribers (FinTechs).
4.2. Time Series Analysis Results
4.2.1. Time Series Decomposition Results
The time series decomposition results for monthly registered account and subscriber data from Korea’s Open Banking platform are visualized in Figure 1, Figure 2, Figure 3 and Figure 4. Figure 1 displays the decomposition for registered accounts (FI), Figure 2 for subscribers (FI), Figure 3 for registered accounts (FinTech), and Figure 4 for subscribers (FinTech). Each figure presents the original time series (Observed), the trend component (Trend), the seasonal component (Seasonal), and the residual component (Residual).
The time series decomposition results, depicted in Figure 1, Figure 2, Figure 3 and Figure 4, confirm the presence of distinct trend and seasonal components across all indicators: registered accounts (FI), subscribers (FI), registered accounts (FinTech), and subscribers (FinTech). All original time series plots (Observed) show an overall upward trend with noticeable fluctuations. The trend component (Trend) reveals a consistent upward trajectory for all indicators, indicating the ongoing growth trend of Korea’s Open Banking platform. However, the gradually decreasing slope of the trend lines suggests a deceleration in growth rate compared to the initial period, particularly evident after the MyData policy implementation point (January 2022, red dashed line) and further flattening after the Fraud Prevention policy (March 2023, green dashed line). The seasonal component (Seasonal) shows a recurring pattern of increased subscriber and registered account numbers at the beginning of each year (January, February) across all indicators. This seasonal pattern likely reflects increased financial service utilization at the start of the year influencing platform growth. The residual component (Residual), representing irregular variations not captured by the model, exhibits a relatively large variation range across all indicators. This suggests that the growth of Korea’s Open Banking platform is subject to unpredictable external factors that can introduce instability, with noticeable spikes and drops throughout the observed period.
4.2.2. ARIMA Modeling Results
Table 2 summarizes the optimal Autoregressive Integrated Moving Average (ARIMA) model specifications, Akaike Information Criterion (AIC), Bayesian Information Criterion (BIC), and Ljung-Box test p-values for the residuals of each indicator. The differencing order (d) was set to 1 for all models based on stationarity tests (detailed results of these tests are presented in Appendix B, Table A2).
Table 2.
ARIMA modeling results.
The optimal ARIMA model for Registered Accounts (FI) and Subscribers (FI) was identified as ARIMA (0,1,1). For the more volatile Registered Accounts (FinTech) and Subscribers (FinTech) series, a more complex ARIMA (2,1,2) model was selected. Detailed parameter estimates for these models, including the coefficients for autoregressive (AR) and moving average (MA) terms, their standard errors, and p-values, are provided in Appendix A, Table A1. For instance, the MA(1) term for Registered Accounts (FI) was found to be statistically significant (coefficient = −0.4201, SE = 0.1110, p = 0.000). Similarly, for Subscribers (FI), the MA(1) term was significant (coefficient = −0.5240, SE = 0.1120, p = 0.000). In the case of Registered Accounts (FinTech) using an ARIMA (2,1,2) model, the AR(2) term (coefficient = 0.5051, SE = 0.2710, p = 0.062) and the MA(2) term (coefficient = −0.7837, SE = 0.2370, p = 0.001) were notable, while the AR(1) and MA(1) terms were not statistically significant at the conventional 5% level (p = 0.337 and p = 0.995, respectively). For Users (FinTech), also an ARIMA (2,1,2) model, all AR and MA terms (AR(1): p = 0.044; AR(2): p = 0.000; MA(1): p = 0.000; MA(2): p = 0.000) demonstrated statistical significance.
The AIC and BIC values, used for model selection, are presented in Table 2. Model diagnostic results, indicated by Ljung-Box test p-values for the residuals (all > 0.05, ranging from 0.581 for Subscribers (FI) to 0.995 for Users (FinTech), as shown in Table A1 and summarized in Table 2), strongly support the null hypothesis of no autocorrelation. This suggests that the selected ARIMA models adequately fit the data and that the residuals do not exhibit significant autocorrelation, validating the model assumptions.
4.2.3. Prophet Modeling Results
Figure 5, Figure 6, Figure 7 and Figure 8 illustrate the Prophet modeling results for monthly registered account and subscriber data from Korea’s Open Banking platform. Figure 5 shows results for registered accounts (FI), Figure 6 for subscribers (FI), Figure 7 for registered accounts (FinTech), and Figure 8 for subscribers (FinTech). Each figure displays actual values (black dots), predicted values (blue line), prediction intervals (light blue shaded area), and changepoints (vertical red lines), along with vertical dashed lines indicating the MyData Policy (Green) and Fraud Prevention Policy (Orange) implementation dates.
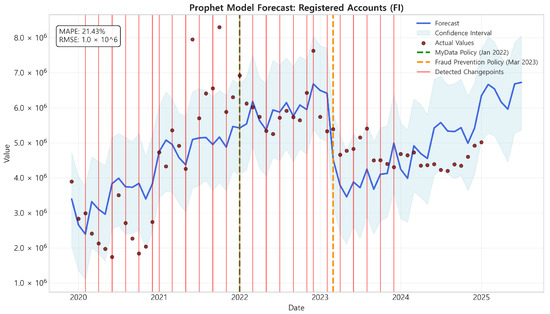
Figure 5.
Prophet modeling results for registered accounts (financial institutions).
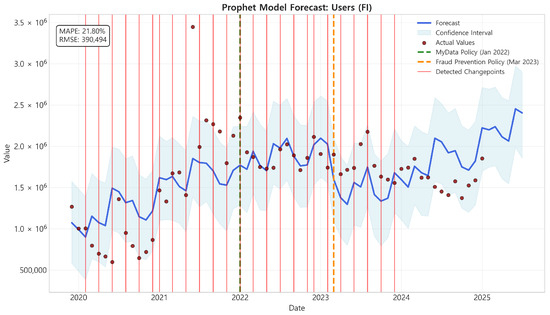
Figure 6.
Prophet modeling results for subscribers (financial institutions).
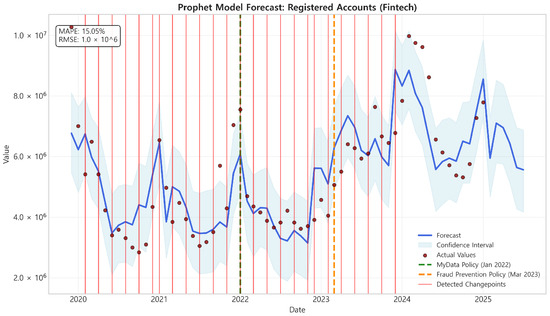
Figure 7.
Prophet modeling results for registered accounts (FinTechs).
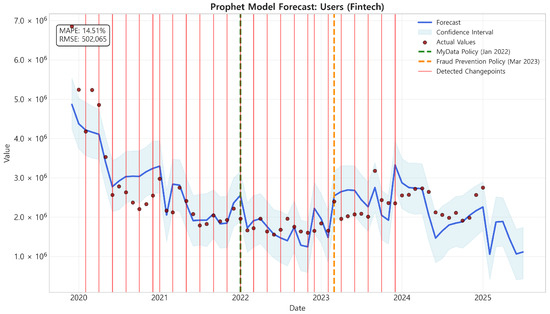
Figure 8.
Prophet modeling results for subscribers (FinTechs).
The Prophet modeling results, shown in Figure 5, Figure 6, Figure 7 and Figure 8, demonstrate the model’s ability to effectively capture and visualize trends and seasonality in registered account and subscriber data across FI and FinTech categories. The Prophet model captures the overall upward trend in all series, while also modeling the yearly seasonality with peaks generally occurring at the beginning of each year. Changepoint analysis, indicated by vertical red lines, reveals points where the growth trend changes. Notably, changepoints are detected in early 2022 and early 2023 across all indicators, aligning closely with the MyData policy implementation (January 2022, vertical green dashed line) and the introduction of financial fraud prevention regulations (March 2023, vertical orange dashed line). For Registered Accounts (FI) (Figure 5) and Subscribers (FI) (Figure 6), a changepoint is clearly visible slightly before the MyData policy implementation, suggesting a potential anticipatory effect or other coinciding factors influencing growth deceleration around that time. For FinTech-related indicators (Figure 7 and Figure 8), changepoints are more pronounced and closely aligned with both policy implementation dates, indicating a more direct and immediate impact of these policy changes on the growth patterns of FinTech-related registered accounts and subscribers. The Prophet model effectively detects and visualizes these policy impacts as changepoints, providing a clear visual representation of structural shifts in platform growth associated with policy interventions.
4.2.4. Model Prediction Performance Comparison
To compare the prediction performance of the ARIMA and Prophet models, I utilized Root Mean Squared Error (RMSE), Mean Absolute Error (MAE), and Mean Absolute Percentage Error (MAPE) metrics, evaluated on a validation dataset representing 20% of the total time series data. Table 3 presents the prediction performance comparison results for both models.
Table 3.
Model prediction performance comparison results.
The model prediction performance comparison, summarized in Table 3, reveals a consistent trend across all indicators: the ARIMA model outperforms the Prophet model in terms of prediction accuracy. For Registered Accounts (FI), the RMSE for ARIMA is approximately 291,349, significantly lower than the Prophet RMSE of 2,035,233. Similarly, for Subscribers (FI), ARIMA achieves an RMSE of 147,970 compared to Prophet’s 698,066. While the performance gap narrows slightly for FinTech-related indicators, ARIMA still maintains superior performance. For Registered Accounts (FinTech), ARIMA RMSE is 2,157,530 versus Prophet’s 2,425,787, and for Subscribers (FinTech), ARIMA RMSE is 334,886 compared to Prophet’s 551,018. MAPE values further corroborate these findings, with ARIMA consistently achieving lower percentage errors than Prophet. For instance, for Registered Accounts (FI), ARIMA MAPE is 4.48% while Prophet MAPE is 42.25%. This consistent outperformance of ARIMA over Prophet, despite Prophet’s strengths in handling seasonality and changepoints, suggests that the linear and autoregressive characteristics captured by ARIMA models are more pertinent for forecasting the qualitative growth indicators of Korea’s Open Banking Platform within the observed timeframe. Section 5.1 will delve deeper into the potential reasons for this unexpected result.
4.3. User-to-Account Ratio Analysis Results
To further investigate the qualitative growth dynamics of Korea’s Open Banking platform, I analyzed the trends in the user-to-account ratio, a key indicator of user engagement and platform utilization intensity. This ratio, calculated by dividing the number of registered accounts by the number of subscribers, represents the average number of registered accounts per user. Table 4 and Figure 9 illustrate the trends in the user-to-account ratio for financial institutions and FinTechs, and compare indicator values before and after major policy changes.
Table 4.
Data change comparison table before and after policy implementation (mean values).

Figure 9.
User-to-Account Ratio Trend for Financial Institutions (FI) and FinTechs. Trend lines are smoothed using a Savitzky-Golay filter with an adaptive window length.
Table 4 presents a comparative view of key growth indicators before and after the MyData policy (P1) and the Financial Fraud Prevention Regulation (P2). Notably, API call volume exhibits consistent exponential growth across policy periods, increasing by 353.94% post-MyData and a further 474.40% post-Fraud Regulation. In contrast, qualitative indicators show more nuanced and sometimes contrasting trends. For Financial Institutions (FI), Registered Accounts and Subscribers show positive growth post-MyData (43.73% and 35.38% respectively) but experience a decrease post-Fraud Regulation (−22.20% and −11.55%). Conversely, FinTechs exhibit a different pattern. Registered Accounts and Subscribers for FinTechs decrease slightly post-MyData (−7.87% and −41.03%) but show substantial growth post-Fraud Regulation (60.84% and 34.30%). The User-to-Account Ratio (UTA) for FIs increases moderately post-MyData (5.57%) but decreases post-Fraud Regulation (−11.62%). For FinTechs, the UTA ratio shows significant increases in both post-MyData (46.90%) and post-Fraud Regulation (19.98%) periods. This suggests that policy changes have differential impacts on FIs and FinTechs and that user engagement, as reflected by the UTA ratio, exhibits complex dynamics beyond simple quantitative growth metrics.
Analyzing the time series data visualized in Figure 9, distinct patterns emerge in the user-to-account ratios for FIs and FinTechs over time. The user-to-account ratio for FIs (UTA ratio (FI), blue line) shows a rapid increase from the platform launch until early 2020, reaching a peak around 3.5, followed by a gradual decline and stabilization around 2.8. This initial surge likely reflects early adopters, potentially power users, registering multiple accounts upon platform launch. The subsequent decline suggests a broader user base expansion, including users with fewer registered accounts per person, potentially indicating a shift from early adopter dominance to more mainstream adoption. The user-to-account ratio for FinTechs (UTA ratio (FinTech), red line), starting at a lower level around 1.5, exhibits a consistent upward trend throughout the observed period, gradually converging towards the FI ratio but remaining consistently lower. This gradual increase suggests that users initially accessing Open Banking services through FinTech platforms started with fewer linked accounts but progressively integrated more accounts over time as they became more familiar and comfortable with FinTech services. The smoothed trend lines (dashed lines) further highlight these underlying trends, indicating a clear divergence in user engagement patterns between FI and FinTech platforms. The vertical dashed lines in Figure 9 indicate the MyData Policy (Green) and Fraud Prevention Policy (Purple) implementation dates, providing a visual reference for policy impacts on user-account ratio trends. The annotation “Initial Growth Period” highlights the rapid UTA ratio (FI) increase in the early phase of Open Banking adoption. The interplay between these trends, policy changes, and the overall platform growth dynamics will be further discussed in Section 5.1.
5. Discussion and Conclusions
5.1. Discussion of Research Results
This section discusses the empirical findings in relation to the research questions, explores the broader academic and policy implications, and concludes by acknowledging the study’s limitations. Table 5 provides a condensed summary of the key findings for each research question, which will be elaborated upon in the following discussion.
Table 5.
Summary of Key Findings for Research Questions.
Research Question 1: Divergence between Quantitative and Qualitative Growth.
The empirical analysis reveals a significant divergence between the platform’s reported quantitative growth, illustrated in this study by a simulated API call volume trajectory reflecting public announcements, and its qualitative growth, as indicated by the decelerated growth in registered accounts and users based on actual platform statistics. While the simulated API call volume shows an exponential surge (an increase of 1571.68% between December 2019 and January 2025, as per public reports and our simulation), registered account and user growth rates (based on actual data) remained comparatively modest at 43.73% and 35.38%, respectively (post-MyData policy). This apparent disparity, keeping in mind the illustrative nature of the API call data used, suggests that the platform’s quantitative expansion is not proportionally translating into qualitative user base and account growth, pointing towards a potential imbalance. This divergence can be attributed to several interconnected mechanisms:
- 1.
- Intensified Usage by Existing Users (Intensive Margin Growth): The surge in API call volume is primarily fueled by increased engagement from existing users, not a proportional influx of new users. This ‘intensive margin growth’ means current users are making more API calls, utilizing a wider range of services and accessing data more frequently. Time series analysis confirms decelerating new user growth, supporting this mechanism. This trend inflates API call volumes without a corresponding expansion of the user base.
- 2.
- Efficiency Bias in API Call Volume Metrics: The disproportionate increase in API call volume may also be attributed to an ‘efficiency bias,’ where the metric is heavily influenced by specific types of API calls that are inherently high-volume, even if they do not necessarily reflect diverse platform utilization or value creation. Services such as balance inquiries, transaction history retrievals, and real-time data updates, while valuable, generate significantly higher API call frequencies compared to less frequent but potentially more value-added services like sophisticated financial planning tools or complex transaction executions. A concentration of platform usage in these high-frequency but potentially lower value-added services can inflate API call volume without reflecting a commensurate qualitative expansion of platform utility or user engagement.
- 3.
- System-Driven and Non-User Initiated API Calls: A further contributing factor to the divergence may be the presence of system-driven and non-user initiated API calls. Some FinTechs may implement automated processes that generate API calls for system maintenance, data synchronization, or proactive service monitoring, which are not directly initiated by active user engagement. These system-driven calls contribute to the overall API call volume but do not represent active user-driven platform utilization or qualitative growth in the user base. While the exact proportion of system-driven calls is difficult to quantify with publicly available data, and our simulated API data does not differentiate such call types, their potential contribution to the observed divergence cannot be discounted.
This empirical study, by employing a dual-track approach that examines both quantitative (API call volume) and qualitative (registered accounts, users) growth indicators, effectively highlights a critical qualitative imbalance masked by the platform’s apparent quantitative success. This imbalance raises concerns about the long-term sustainability and balanced ecosystem development of Korea’s Open Banking platform.
Research Question 2: Constraints on User Inflow and Base Expansion.
Analysis of the user-to-account ratio trends and policy impact reveals several factors that constrain new user inflow and user base expansion in Korea’s Open Banking platform. The stagnation and, in some cases, decline in user growth, despite the exponential increase in API call volume, suggests underlying challenges in attracting and retaining new users. Key constraining factors include:
- 1.
- Increased User Experience Complexity and Friction: The introduction of enhanced security measures and stricter regulatory compliance, particularly following the financial fraud prevention regulations in March 2023, has likely increased user experience complexity and friction. Strengthened identity verification processes, additional transaction authorization steps, and more stringent data access protocols, while crucial for security and regulatory compliance, can create barriers to entry and negatively impact user convenience, especially for new or less tech-savvy users. The Prophet model’s changepoint analysis, showing a deceleration in user growth coinciding with the policy implementation timing, supports this interpretation, suggesting that increased user experience complexity may be dampening new user inflow.
- 2.
- Weakening Differentiation and Value Proposition for Mass-Market Adoption: Following the initial wave of early adopters who were quick to embrace Open Banking’s novel functionalities, the platform may be facing challenges in articulating a compelling and differentiated value proposition to attract mass-market users. The initial novelty effect may be waning, and the platform may lack “killer applications” or services that resonate strongly with a broader user base beyond early tech enthusiasts and financially sophisticated individuals. The observed stagnation in the user-to-account ratio, particularly for FIs after the initial surge, may indicate a plateauing of user engagement and a need for renewed efforts to enhance the platform’s value proposition and attract a wider spectrum of users.
- 3.
- Ecosystem Imbalances and Differential Policy Impacts: The analysis reveals ecosystem imbalances and differential impacts of policy changes on financial institutions and FinTechs, which may indirectly constrain overall user base expansion. As shown in Table 4, policy changes like MyData and Fraud Prevention Regulations have had contrasting effects on FI and FinTech growth indicators, leading to shifts in competitive dynamics and ecosystem power balances. While MyData initially benefited FIs, Fraud Prevention Regulations seemed to favor FinTech growth, potentially reflecting adaptation strategies and varying compliance capabilities across different player types. Such imbalances and regulatory uncertainties can create an uneven playing field, potentially hindering overall ecosystem stability and dampening user confidence in the platform’s long-term viability, thereby indirectly constraining user base expansion.
Research Question 3: Data-Driven Governance for Innovation.
The comparison of ARIMA and Prophet models reveals valuable insights for data-driven governance in the context of Open Banking platform innovation. While the ARIMA model demonstrated superior prediction accuracy for the qualitative growth indicators, the Prophet model proved effective in detecting policy change points and visualizing structural shifts in growth patterns. This suggests that a data-driven governance approach should leverage a combination of analytical tools, rather than relying on a single model, to effectively manage platform volatility, predict policy impacts, and foster innovation. Specifically, the findings support the implementation of a data-driven governance framework that incorporates the following elements:
- 1.
- Complementary Use of Predictive Models: Employing an ensemble of predictive models, combining the strengths of ARIMA for short-term forecasting and pattern extraction with Prophet’s capabilities in changepoint detection and long-term trend analysis, can provide a more robust and comprehensive understanding of platform dynamics. The unexpected outperformance of ARIMA in this study highlights the importance of model selection based on data characteristics and specific analytical goals.
- 2.
- Focus on Qualitative Growth Indicators in Governance Metrics: Data-driven governance should shift its focus from solely monitoring quantitative metrics like API call volume to actively tracking and managing qualitative indicators such as registered accounts, active users, user-to-account ratios, service utilization diversity, and user satisfaction. Performance evaluation frameworks and incentive mechanisms should be redesigned to prioritize qualitative growth and balanced ecosystem development, moving beyond a narrow focus on API transaction volumes.
- 3.
- Data-Driven Policy Simulation and Impact Assessment: Establishing a ‘Data-Driven Policy Simulation Platform’, as proposed in Section 5.2.2, is crucial for proactively evaluating the potential impacts of policy changes and regulatory interventions on platform growth and ecosystem dynamics. Utilizing models like Prophet, with its changepoint detection capabilities and policy regressors, can enable policymakers to simulate policy scenarios, assess potential unintended consequences, and make more informed, evidence-based decisions. Institutionalizing ‘Evidence-Based Policy Evaluation’ with mandated data-driven impact assessments before and after policy implementations can further enhance the effectiveness and responsiveness of platform governance.
- 4.
- Open Banking Data Analysis Center for Collaborative Governance: Creating an ‘Open Banking Data Analysis Center,’ involving stakeholders from regulatory bodies, financial institutions, FinTechs, and academia, can foster collaborative data-driven governance. Such a center can serve as a hub for data sharing (within privacy and security constraints), joint analysis, and collective intelligence gathering, enabling a more holistic and ecosystem-wide perspective on platform governance and innovation strategies. This collaborative approach can facilitate data-driven policy adjustments, identify emerging challenges and opportunities, and promote a more balanced and sustainable innovation ecosystem within Korea’s Open Banking platform.
5.2. Implications and Recommendations
This study contributes both academically and practically by empirically analyzing the qualitative imbalance issue in Korea’s Open Banking platform using data and deriving policy recommendations for sustainable growth.
5.2.1. Academic Implications
This study offers three key academic contributions:
- 1.
- Multi-dimensional Growth Framework: I introduce a novel analytical framework that emphasizes the balance between qualitative and quantitative growth in platform research, expanding beyond traditional quantitative-focused metrics. By highlighting qualitative indicators like registered accounts, user numbers, and the user-to-account ratio, I provide a more holistic and balanced approach to diagnosing platform growth. This framework advances platform growth research by considering evolutionary stages: quantitative growth → qualitative growth → sustainable growth, systematically outlining core drivers and challenges at each stage.
- 2.
- Methodological Advancement in Data-Driven Platform Research: This study expands the methodological toolkit for data-based platform research by applying time series analysis to empirically assess ecosystem volatility and policy impacts. The comparison of ARIMA and Prophet models demonstrates Prophet’s effectiveness in handling platform data volatility and prediction uncertainty. The use of Prophet’s changepoint analysis to quantify structural shifts in platform growth due to policy changes enhances the scientific rigor of policy effect analysis. This contributes to the broader applicability of time series analysis in platform research and diversifies methodological approaches in data-driven platform studies.
- 3.
- Empirical Evidence and Generalizability through Case Study: The Korea Open Banking platform case study provides empirical evidence for platform qualitative growth and data-driven governance research, enhancing the generalizability and practical relevance of the findings. By balancing perspectives on the platform’s successes and challenges, diagnosing qualitative imbalances through data analysis, and proposing data-driven governance as a solution, this study offers insights and policy lessons applicable to similar platform ecosystems beyond Korea.
5.2.2. Policy Recommendations
Based on the research findings, I propose the following policy recommendations to foster the sustainable growth of Korea’s Open Banking platform:
Recommendation 1: Shift Performance Evaluation to Qualitative Indicators and Prioritize Balanced Ecosystem Growth. Platform governance should transition from a quantitative indicator-centric performance evaluation system to one that prioritizes qualitative indicators, placing balanced platform ecosystem growth at the forefront of policy.
Short-term (within 1 year) Implementation Plans:
- 1.
- Construct ‘Open Banking Quality Growth Dashboard’: Develop a real-time dashboard integrating key qualitative metrics: API call volume, registered account numbers, user numbers, user-to-account ratio, active user ratio, new user inflow rate, and user distribution by region and age.
- 2.
- Publish Quarterly ‘Open Banking Quality Growth Report’: Issue regular reports providing in-depth analysis of user behavior patterns, service utilization, and account activation rates, moving beyond simple growth rate reporting.
- 3.
- Reform Financial Institution and FinTechs Evaluation System: Transition from the current API processing volume-centric evaluation to a multidimensional system incorporating user satisfaction, service diversity, and account activation rates.
Medium to Long-term (within 3 years) Implementation Plans:
- 1.
- Introduce Performance-Based Incentive System: Implement differentiated incentives, such as API fee reductions, policy finance support, and priority access to regulatory sandboxes, for companies demonstrably contributing to qualitative indicator improvements.
- 2.
- Link to International Standards: Actively participate in the development of international standards for Open Banking qualitative growth evaluation in collaboration with organizations like the OECD and BIS, enabling global benchmarking.
Concretizing qualitative growth objectives and establishing a robust system for regularly monitoring and evaluating their achievement is crucial for strengthening platform governance accountability. Qualitative indicators must be integrated into the platform policy decision-making process, and policy incentives should prioritize qualitative growth to foster a balanced platform ecosystem.
Recommendation 2: Strengthen Data-Based Platform Governance Capabilities and Establish a Data-Driven Decision-Making System. Enhance data-based platform governance capabilities to proactively respond to platform volatility and ensure informed decision-making.
Data Infrastructure Construction:
- 1.
- Construct ‘Open Banking Integrated Data Lake’: Build a centralized data lake for collecting and managing API call data, transaction data, user behavior data, and error/failure logs.
- 2.
- Construct Real-time Data Pipeline: Establish a real-time data collection and processing system enabling data updates within 30 min.
- 3.
- Establish Data Standardization and Quality Management System: Develop standardized protocols for data provision across all participating institutions, ensuring consistent formats and data quality.
Analytical Capability Enhancement:
- 1.
- Establish ‘Open Banking Data Analysis Center’: Create a dedicated analysis organization with participation from the FSC, KFTC, academia, and industry experts.
- 2.
- Develop Prediction Model Ensemble System: Develop ensemble prediction models, combining the strengths of ARIMA and Prophet models, with monthly verification of prediction accuracy and continuous model improvement.
- 3.
- Construct AI-based Early Warning System: Implement an AI-driven warning system to proactively detect potential risks such as volatility spikes, user churn, and error rate increases.
Decision-Making System Innovation:
- 1.
- Develop ‘Data-based Policy Simulation Platform’: Create a policy experimentation environment for pre-simulating the impacts of regulatory changes, fee adjustments, and new service introductions.
- 2.
- Regularize ‘Open Banking Dashboard Meeting’: Institutionalize quarterly data-centered decision-making meetings with key stakeholders, including the FSC, Financial Supervisory Service, KFTC, FIs, and FinTechs.
- 3.
- Institutionalize Evidence-based Policy Evaluation: Mandate data-based effect analysis at 3-month, 6-month, and 1-year intervals before and after all major policy changes.
5.3. Limitations and Future Research Directions
While this study provides valuable insights into the qualitative imbalance issue in Korea’s Open Banking platform and offers data-driven governance innovation strategies, it has certain limitations that suggest avenues for future research.
First, the study is limited by its single case study approach. The in-depth analysis focuses specifically on Korea’s Open Banking platform, which may limit the generalizability of the findings. Future research should enhance robustness and generalizability by conducting comparative analyses across Open Banking platforms in different countries and across various types of platform ecosystems (e.g., e-commerce, social media). Cross-case analysis of platform success and failure factors, as well as governance model effectiveness, could further enrich platform governance theory.
Second, data constraints, particularly concerning the API call volume, represent a significant limitation. This study relied on publicly available data from the KFTC and FSC for registered accounts and users. However, granular, actual API call data categorized by type, frequency, or initiating entity (user vs. system) was not accessible for the research period. Consequently, I utilized a simulated API call volume trajectory based on publicly reported aggregate figures. The methodological implication of this approach is that while the simulation provides a general sense of the platform’s quantitative expansion as portrayed externally, it lacks the empirical richness of actual usage data. This limits the robustness of direct comparisons between quantitative and qualitative growth rates and prevents a deeper analysis of what specific API activities are driving the reported volume increases. The divergence highlighted in this paper should therefore be interpreted as indicative of a potential imbalance, warranting further investigation with more comprehensive data.
Future research should prioritize efforts to access or approximate actual API usage dynamics. Potential avenues include: (1) Collaborative research with platform operators (e.g., KFTC) or regulatory bodies (e.g., FSC) to analyze anonymized, aggregated API transaction logs, even if on a sample basis. (2) Conducting targeted surveys or in-depth interviews with participating financial institutions and FinTech companies to gather insights into their API utilization patterns, common use cases, and the proportion of automated versus direct user-initiated calls. (3) Developing proxy measures for API activity, potentially by analyzing related non-API platform metrics if available, or by modeling API usage based on specific service adoption rates. (4) Examining data from other Open Banking ecosystems internationally that may have more transparent data reporting standards to draw comparative insights. Integrating such data would allow for a more nuanced understanding of the relationship between API call volume and genuine platform value creation.
Furthermore, while this study focused on registered accounts and user numbers, incorporating more diverse qualitative data sources, as initially suggested in Section 2.2.4, would enrich future analyses. Integrating platform usage data (if accessible, such as actual API call types, service utilization patterns beyond simple counts, transaction data), stakeholder survey data (user satisfaction beyond simple numbers, operator perspectives, expert opinions), and external data (macroeconomic indicators, social media sentiment, news analysis) could provide a more comprehensive ecosystem view. Utilizing unstructured data analysis techniques (text mining, sentiment analysis, network analysis) and mixed methods research integrating qualitative and quantitative data could deepen the understanding of platform qualitative aspects and enhance research validity and reliability.
Third, limitations related to time series analysis methodology should be acknowledged. While ARIMA and Prophet models were utilized, there is scope for improving prediction accuracy and robustness by applying more advanced time series models, such as machine learning-based forecasting models and deep learning models. Future research could explore methodological extensions like ensemble forecasting techniques that combine the strengths of ARIMA and Prophet models, and apply causal inference methodologies and dynamic causal models to rigorously analyze the causal impacts of external shocks, such as policy changes. Further investigation into why the ARIMA model unexpectedly outperformed the Prophet model in this specific context is also warranted. Additionally, it is important to note that the Prophet model, by design, does not provide p-values for its parameters or components in the same way traditional statistical models like ARIMA do. While it offers diagnostics like changepoint detection and prediction intervals, the assessment of statistical significance for individual trend or seasonality components relies more on visual inspection and out-of-sample forecast performance rather than explicit p-values. This is a methodological characteristic of the Prophet framework.
Despite these limitations, this study makes significant contributions to platform ecosystem research by empirically analyzing the qualitative imbalance issue in Korea’s Open Banking platform and proposing data-driven governance innovation strategies. Quantitatively identifying the qualitative imbalance hidden behind the seemingly successful API call volume metric, and presenting a systematic analytical framework using qualitative indicators like registered accounts, user numbers, and the user-to-account ratio, is expected to contribute to the methodological advancement of future platform growth research.
Furthermore, the policy recommendations derived from data analysis provide practical guidelines for the sustainable growth of Open Banking platforms, offering valuable implications for platform governance practices. Future research will build upon this study by addressing its limitations and further exploring the mechanisms of sustainable platform ecosystem growth, utilizing more diverse data sources and advanced analytical methodologies.
Funding
This research received no external funding.
Institutional Review Board Statement
Not applicable.
Informed Consent Statement
Not applicable.
Data Availability Statement
Data are contained within the article.
Conflicts of Interest
The author declares no conflicts of interest.
Abbreviations
The following abbreviations are used in this manuscript:
| CV | Coefficient of Variation |
| SD | Standard Deviation |
| AIC | Akaike Information Criterion |
| BIC | Bayesian Information Criterion |
| MAE | Mean Absolute Error |
| MAPE | Mean Absolute Percentage Error |
| KFTC | Korea Financial Telecommunications and Clearings Institute |
| FI | Financial Institution |
| FinTech | financial technology company |
| EU | European Union |
| PSD2 | Payment Services Directive 2 |
Appendix A. Detailed ARIMA Model Results
Table A1 presents the detailed parameter estimates for the ARIMA models fitted to each time series. All models were specified with a differencing order of d = 1, as discussed in Section 3.3.3.
Table A1.
Detailed parameter estimates for optimal ARIMA models (d = 1).
Table A1.
Detailed parameter estimates for optimal ARIMA models (d = 1).
| Indicator | Optimal ARIMA | Parameter | Coefficient | Std. Error | p-Value | Model Fit Metrics (AIC, BIC, Ljung-Box p) |
|---|---|---|---|---|---|---|
| Registered Accounts (FI) | ARIMA (0,1,1) | ma.L1 | −0.4201 | 0.1110 | 0.000 | AIC: 1837.39 |
| sigma2 | 0.0000 | 0.000 | BIC: 1841.62 | |||
| L-B p: 0.892 | ||||||
| Users (FI) | ARIMA (0,1,1) | ma.L1 | −0.5240 | 0.1120 | 0.000 | AIC: 1730.15 |
| sigma2 | 0.0000 | 0.000 | BIC: 1734.37 | |||
| L-B p: 0.581 | ||||||
| Registered Accounts (Fintech) | ARIMA (2,1,2) | ar.L1 | −0.1804 | 0.1880 | 0.337 | AIC: 1867.21 |
| ar.L2 | 0.5051 | 0.2710 | 0.062 | BIC: 1877.76 | ||
| ma.L1 | −0.0012 | 0.1820 | 0.995 | L-B p: 0.978 | ||
| ma.L2 | −0.7837 | 0.2370 | 0.001 | |||
| sigma2 | 0.0000 | 0.000 | ||||
| Users (Fintech) | ARIMA (2,1,2) | ar.L1 | 0.1148 | 0.0570 | 0.044 | AIC: 1737.66 |
| ar.L2 | −0.7742 | 0.0610 | 0.000 | BIC: 1748.22 | ||
| ma.L1 | −0.3636 | 0.0690 | 0.000 | L-B p: 0.995 | ||
| ma.L2 | 0.8526 | 0.0620 | 0.000 | |||
| sigma2 | 0.0000 | 0.000 |
Note: ‘ar.L_n_’ refers to the n-th autoregressive term, ‘ma.L_n_’ refers to the n-th moving average term. ‘sigma2’ is the variance of the residuals. L-B p refers to the p-value of the Ljung-Box test for residual autocorrelation. AIC: Akaike Information Criterion, BIC: Bayesian Information Criterion. For ‘sigma2’, the provided ‘Std. Error’ and ‘p-value’ from the script output are listed; typically, direct significance testing for ‘sigma2’ is not a primary focus in ARIMA parameter interpretation in the same way as AR/MA coefficients.
Appendix B. Stationarity Test Results
To ensure the appropriateness of the ARIMA models, Augmented Dickey-Fuller (ADF) and Kwiatkowski-Phillips-Schmidt-Shin (KPSS) tests were conducted on each time series in its original level and after first differencing. The results, summarized in Table A2, guided the choice of the differencing order (d = 1) for all ARIMA models used in this study.
Table A2.
ADF and KPSS stationarity test results.
Table A2.
ADF and KPSS stationarity test results.
| Indicator | Series Level | ADF Statistic | ADF p-Value | KPSS Statistic | KPSS p-Value |
|---|---|---|---|---|---|
| Registered Accounts(FI) | Original | −1.851 | 0.355 | 0.356 | 0.096 |
| 1st Difference | −11.613 | 0.000 | 0.095 | 0.100 | |
| Users(FI) | Original | −2.118 | 0.237 | 0.410 | 0.073 |
| 1st Difference | −7.763 | 0.000 | 0.078 | 0.100 | |
| Registered Accounts(Fintech) | Original | −3.048 | 0.031 | 0.508 | 0.040 |
| 1st Difference | −7.568 | 0.000 | 0.247 | 0.100 | |
| Users(Fintech) | Original | −5.690 | 0.000 | 0.492 | 0.044 |
| 1st Difference | −4.694 | 0.000 | 0.497 | 0.042 |
Note: For the ADF test, the null hypothesis is that the series has a unit root (non-stationary). A p-value < 0.05 indicates stationarity. For the KPSS test, the null hypothesis is that the series is trend-stationary. A p-value < 0.05 suggests that differencing is required. The note “H0 is stationarity. If p < 0.05, series is non-stationary” from the CSV for KPSS p-value should be clarified based on the specific KPSS test implementation (e.g., test for level stationarity vs. trend stationarity and how p-values are interpreted regarding the need for differencing).
References
- Parker, G.G.; Van Alstyne, M.W.; Choudary, S.P. Platform Revolution: How Networked Markets are Transforming the Economy—And How to Make Them Work for You; WW Norton & Company: New York, NY, USA, 2016. [Google Scholar]
- Cusumano, M.A.; Gawer, A.; Yoffie, D.B. The Business of Platforms: Strategy in the Age of Digital Competition, Innovation, and Power; Harper Business: New York, NY, USA, 2019; Volume 320. [Google Scholar]
- Gomber, P.; Koch, J.A.; Siering, M. Digital Finance and FinTech: Current research and future research directions. J. Bus. Econ. 2017, 87, 537–580. [Google Scholar] [CrossRef]
- Accenture. Open Banking: Opening the Door to the Platform Economy. 2022. Available online: https://www.accenture.com/us-en/insights/banking/open-banking (accessed on 26 February 2025).
- European Commission. Directive (EU) 2015/2366 of the European Parliament and of the Council of 25 November 2015 on Payment Services in the Internal Market. 2015. Available online: https://eur-lex.europa.eu/legal-content/EN/TXT/?uri=CELEX:32015L2366 (accessed on 26 February 2025).
- Open Banking Implementation Entity. The Open Banking Standard. 2016. Available online: https://standards.openbanking.org.uk/ (accessed on 26 February 2025).
- Kwon, H.J. Performance and Development Direction of Open Banking Adoption; Korea Institute of Finance: Seoul, Republic of Korea, 2020; Available online: https://www.kif.re.kr/kif4/publication/pub_detail?mid=20&nid=189&sid=188&vid=6178&cno=276428&pn=1 (accessed on 26 February 2025). (In Korean)
- Financial Services Commission. Financial Payments Innovation Initiative. 2019. Available online: http://www.fsc.go.kr:8300/v/plZFjTJIphE (accessed on 26 February 2025).
- Kim, G.R.; Cho, M.J. Open Banking, the Prelude to Changes in the Financial Industry Landscape; Samjong KPMG Economic Research Institute: Seoul, Republic of Korea, 2019; Available online: https://assets.kpmg.com/content/dam/kpmg/kr/pdf/2019/kr-issuemonitor-open-banking-20190524.pdf(In Korean). (accessed on 26 February 2025). (In Korean)
- Oh, S.; Chung, G.; Cho, K. New sustainable fintech business models created by open application programming interface technology: A case study of Korea’s open banking application programming interface platform. Sustainability 2024, 16, 7187. [Google Scholar] [CrossRef]
- Financial Services Commission. Entities Can Now View All Their Accounts at Once with Open Banking. [Press Release]. 2024. Available online: http://www.fsc.go.kr:8300/v/ppVuKt8TKcB (accessed on 26 February 2025). (In Korean).
- Tiwana, A. Platform Ecosystems: Aligning Architecture, Governance, and Strategy; Newnes: Oxford, UK, 2013. [Google Scholar]
- Gawer, A.; Cusumano, M.A. Industry platforms and ecosystem innovation. J. Prod. Innov. Manag. 2014, 31, 417–433. [Google Scholar] [CrossRef]
- Boudreau, K.J. Open platform strategies and innovation: Granting access vs. devolving control. Manag. Sci. 2010, 56, 1849–1872. [Google Scholar] [CrossRef]
- De Reuver, M.; Sørensen, C.; Basole, R.C. The digital platform: A research agenda. J. Inf. Technol. 2018, 33, 124–135. [Google Scholar] [CrossRef]
- Eisenmann, T.; Parker, G.; Van Alstyne, M. Platform envelopment. Strateg. Manag. J. 2011, 32, 1270–1285. [Google Scholar] [CrossRef]
- Zhu, F.; Iansiti, M. Entry into platform-based markets. Strateg. Manag. J. 2012, 33, 88–106. [Google Scholar] [CrossRef]
- Ghazawneh, A.; Henfridsson, O. Balancing platform control and external contribution in third-party development: The boundary resources model. Inf. Syst. J. 2013, 23, 173–192. [Google Scholar] [CrossRef]
- Wareham, J.; Fox, P.B.; Cano Giner, J.L. Technology ecosystem governance. Organ. Sci. 2014, 25, 1135–1156. [Google Scholar] [CrossRef]
- European Banking Authority. Report on the Use of Digital Platforms in the EU Banking and Payments Sector; EBA: London, UK, 2021; Available online: https://service.betterregulation.com/document/530614 (accessed on 26 February 2025).
- Belleflamme, P.; Peitz, M. Industrial Organization: Markets and Strategies; Cambridge University Press: Cambridge, UK, 2015. [Google Scholar] [CrossRef]
- Taylor, S.J.; Letham, B. Forecasting at scale. Am. Stat. 2018, 72, 37–45. [Google Scholar] [CrossRef]
- FSC. You Can Manage Your Scattered Financial Information More Safely, Quickly, and Conveniently—Full Implementation of MyData (Personal Credit Information Management Business). [Press Release]. 4 January 2022. Available online: http://www.fsc.go.kr:8300/v/pvmFJTZC3c7 (accessed on 26 February 2025). (In Korean).
- FSC. [Joint Ministries] Announcement of Telecommunications and Financial Sector Measures to Eradicate Voice Phishing Crimes [Press Release]. 29 September 2022. Available online: http://www.fsc.go.kr:8300/v/pZ6tbuZCRTA (accessed on 26 February 2025). (In Korean).
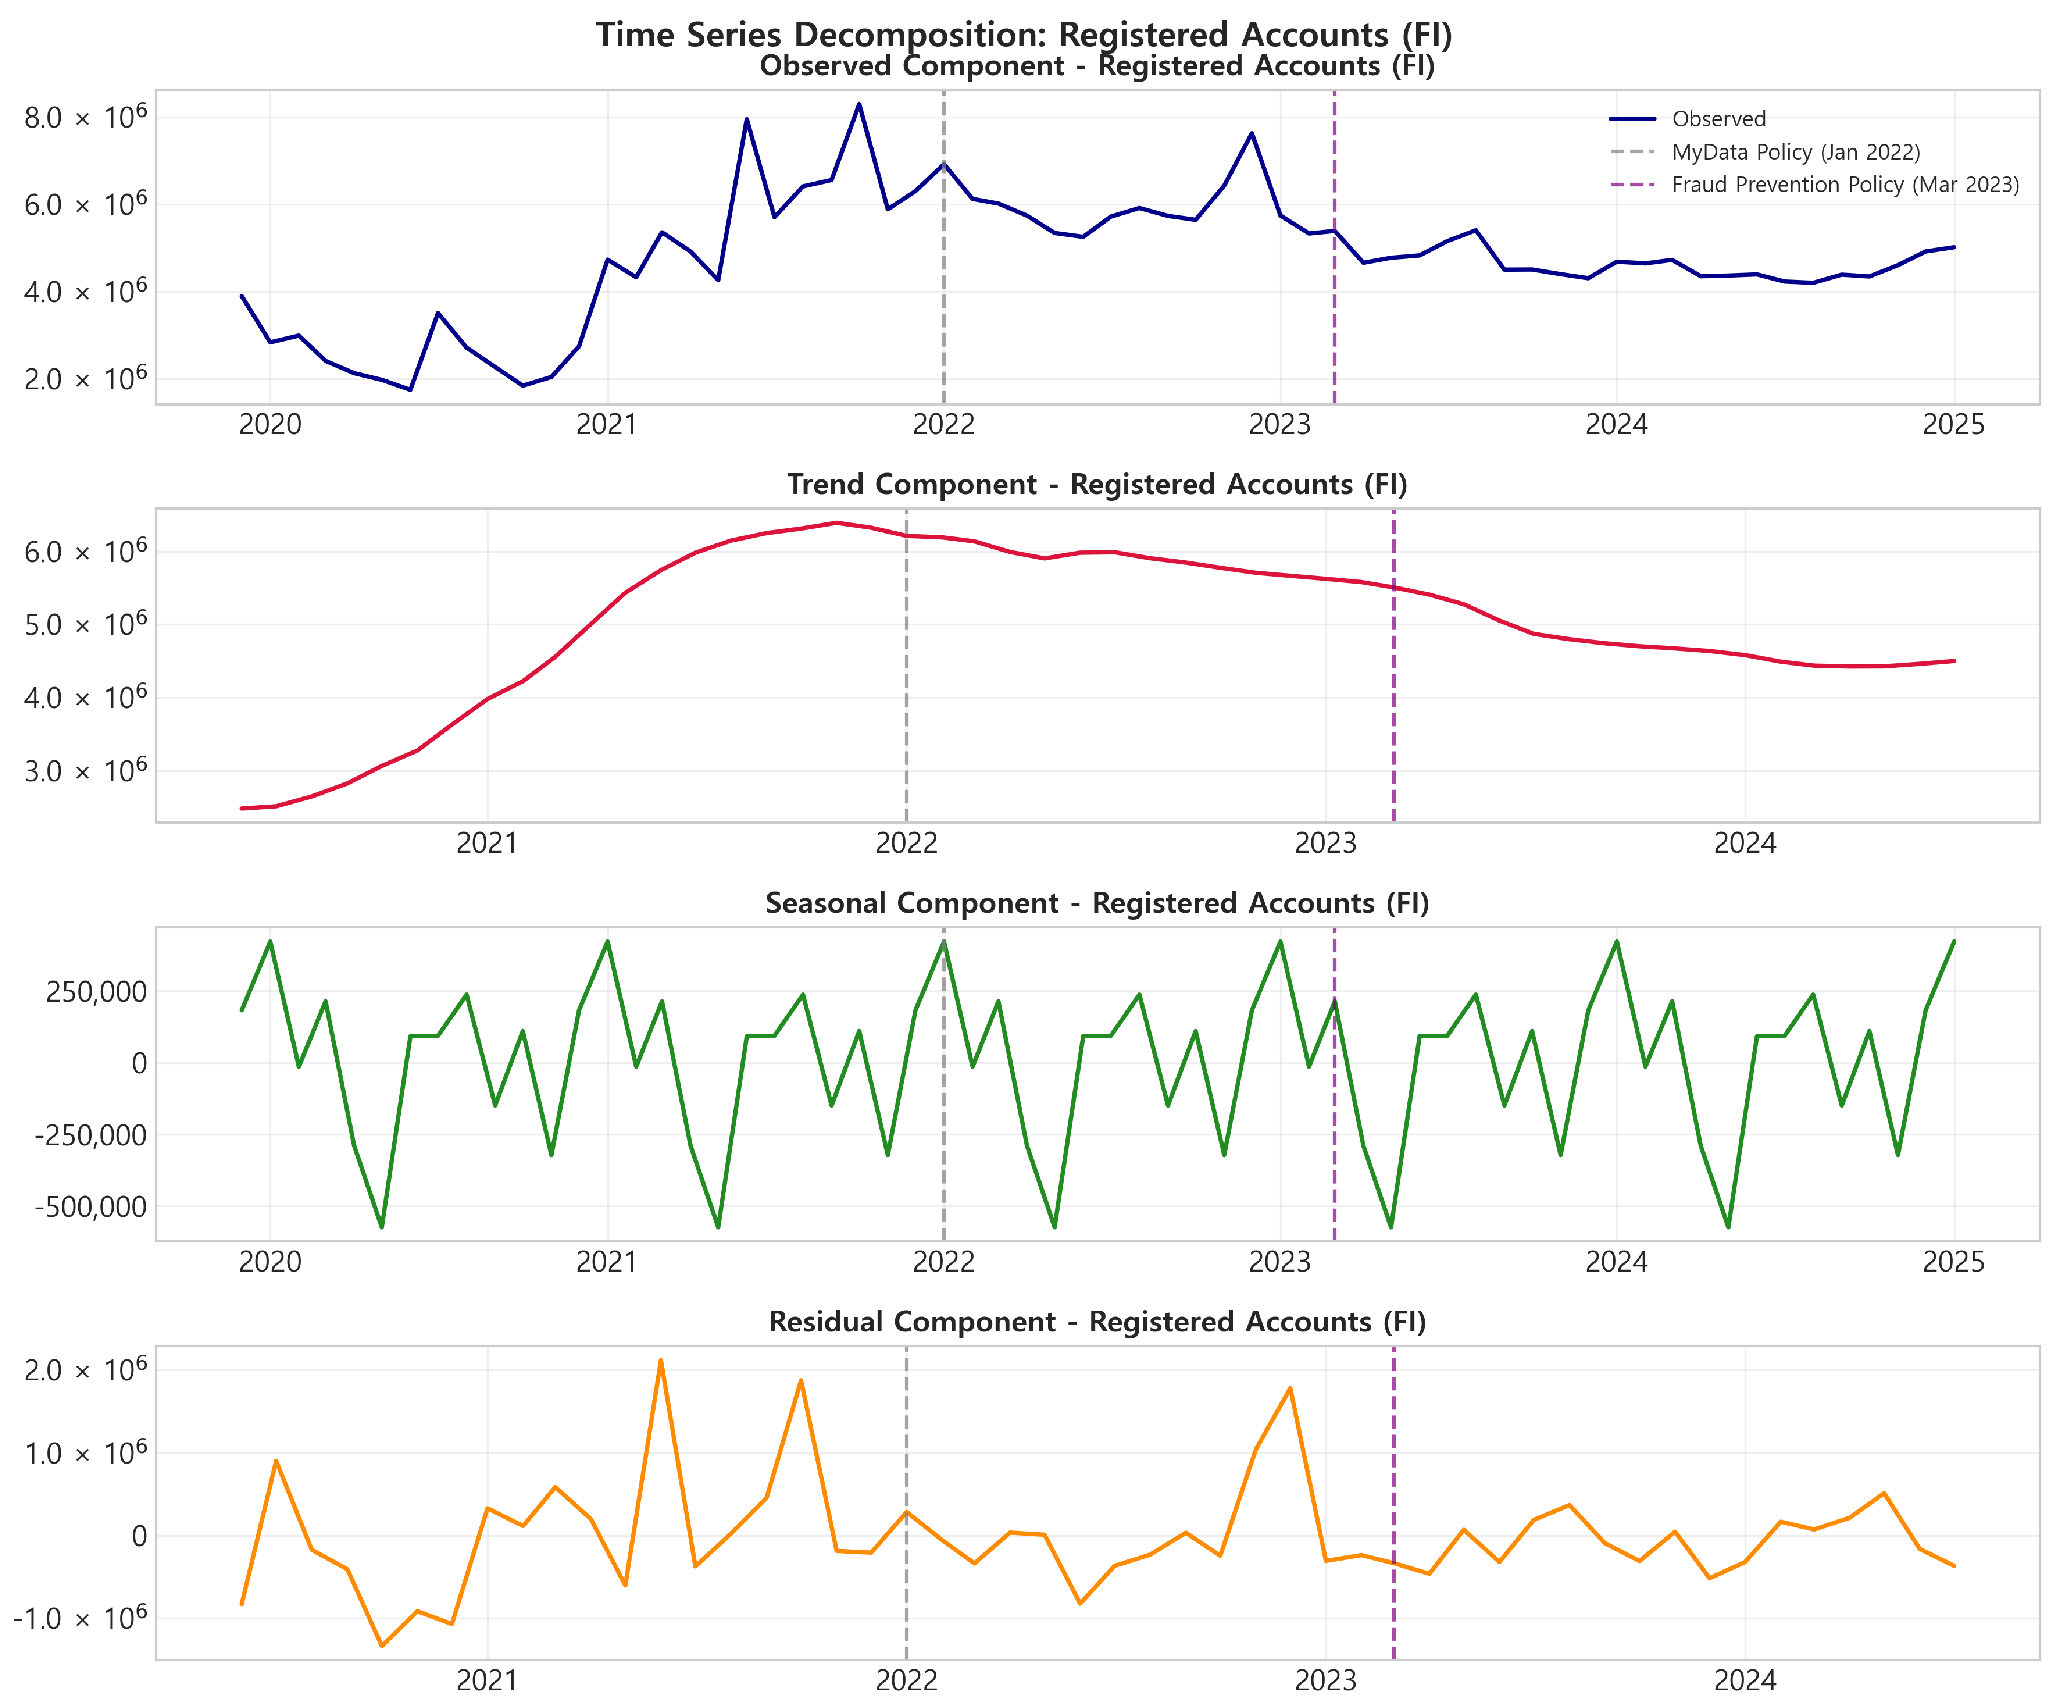
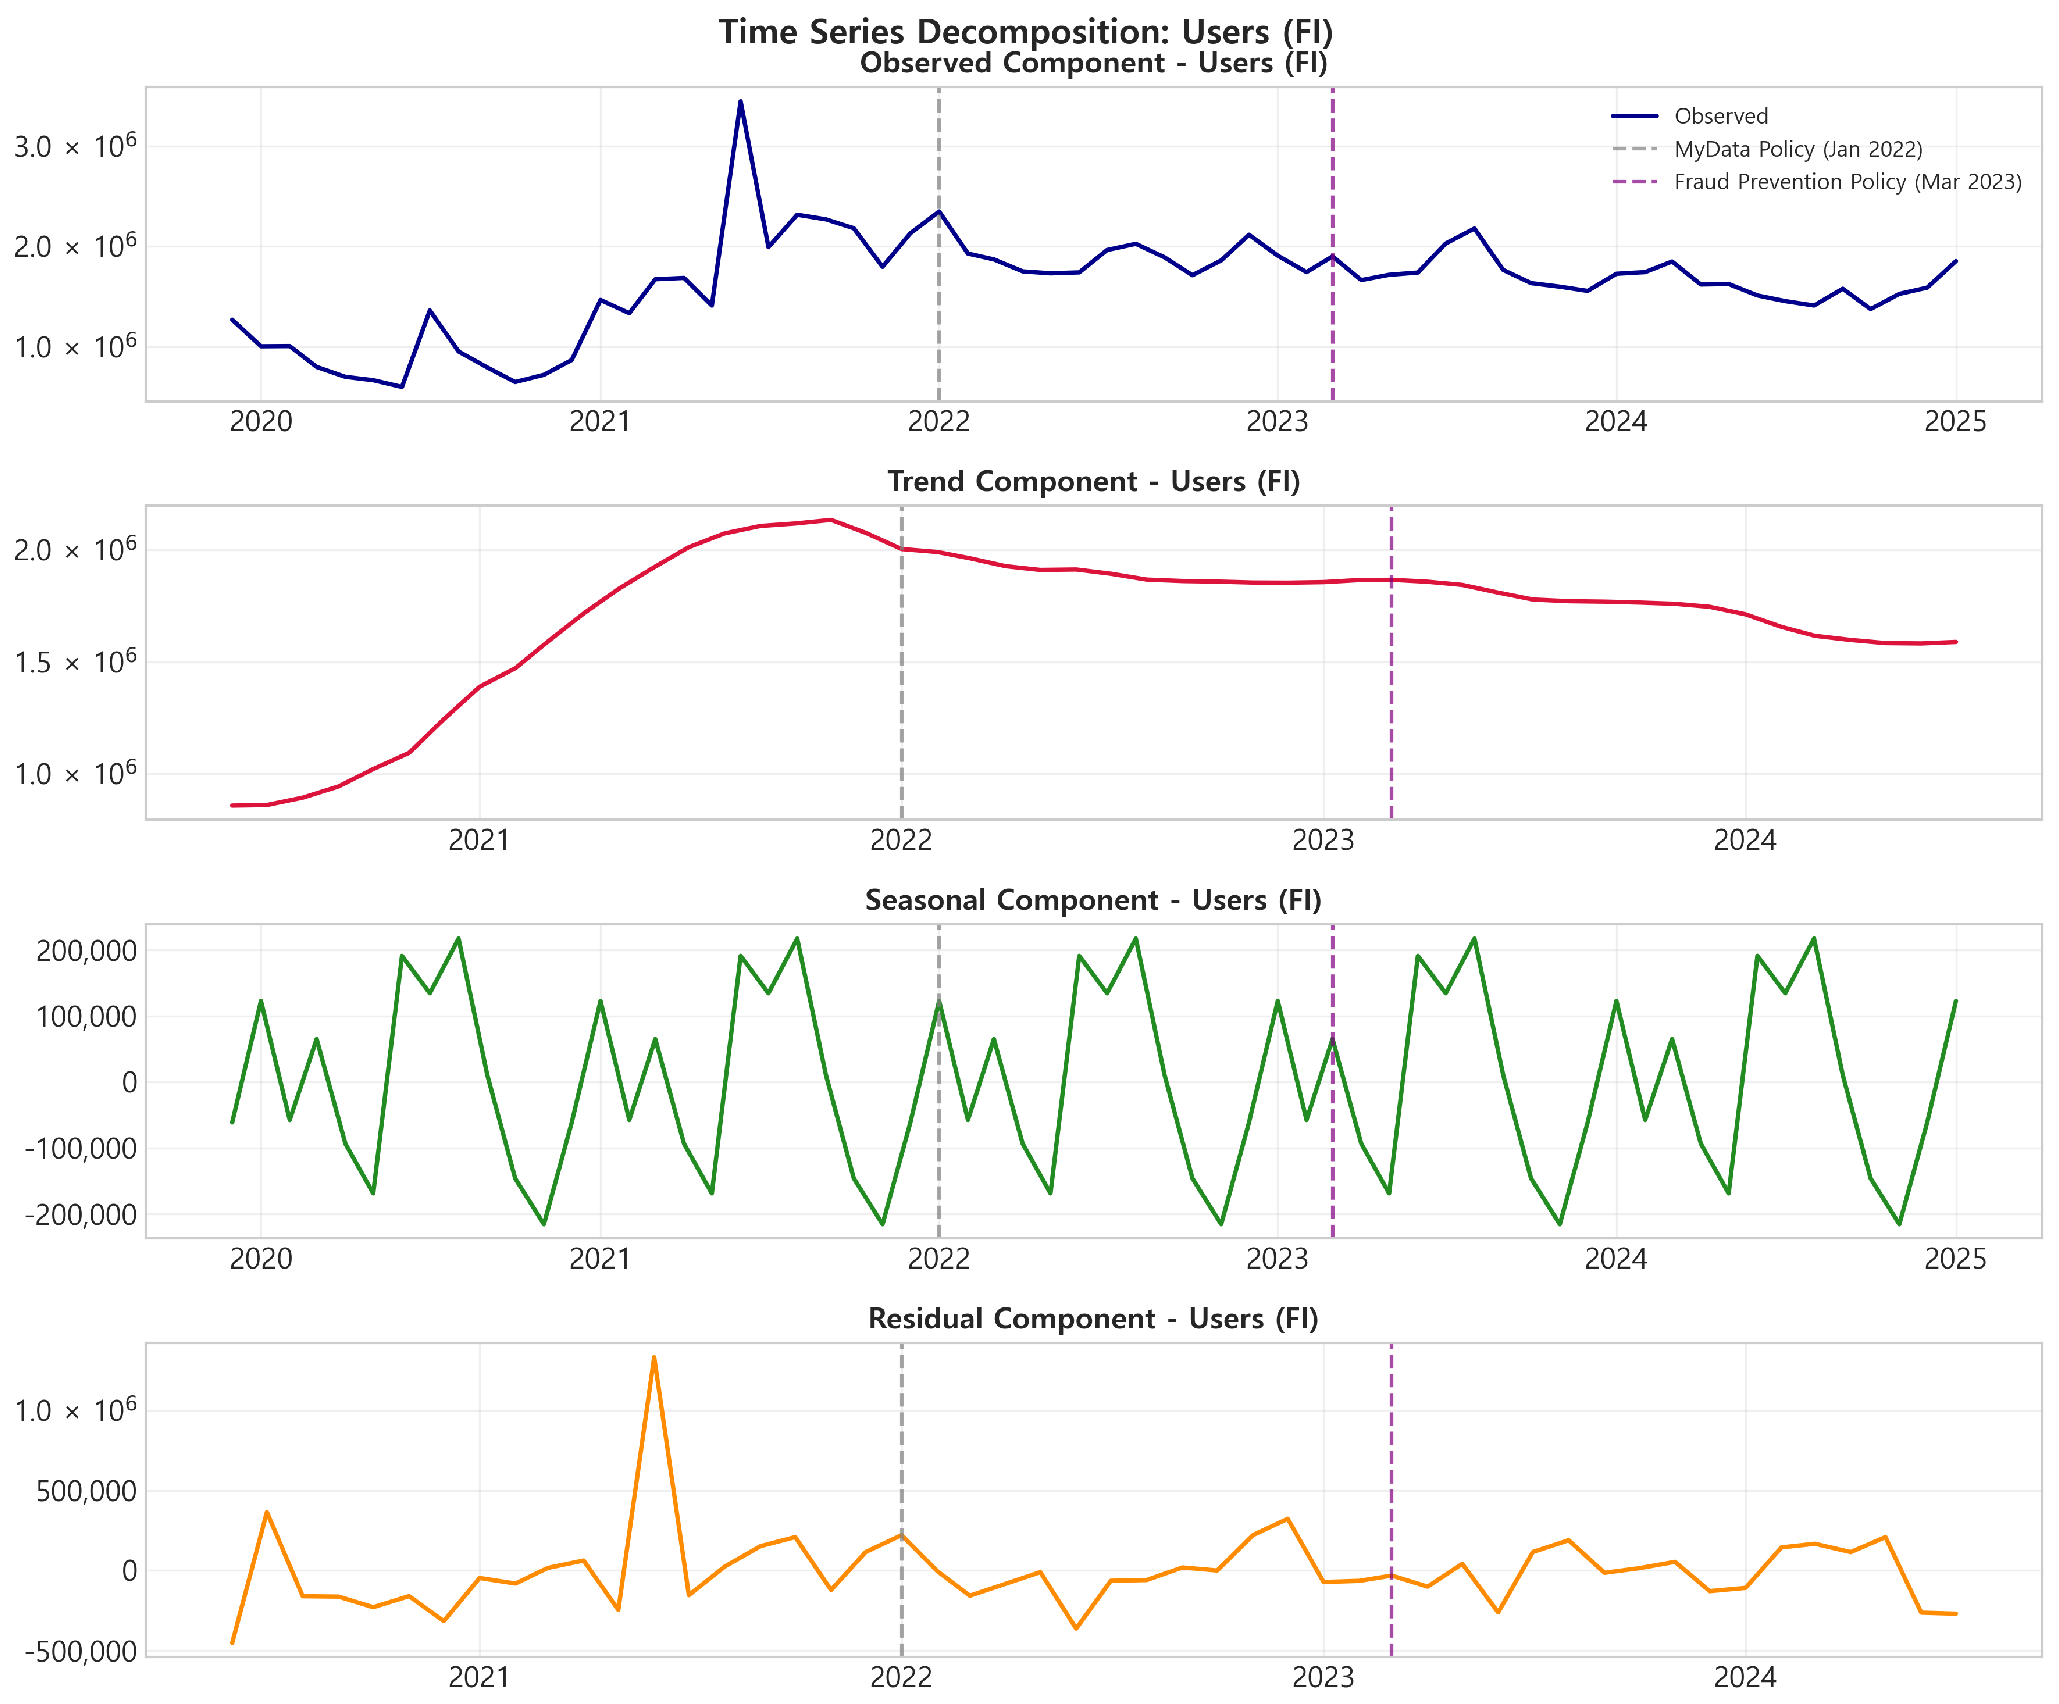
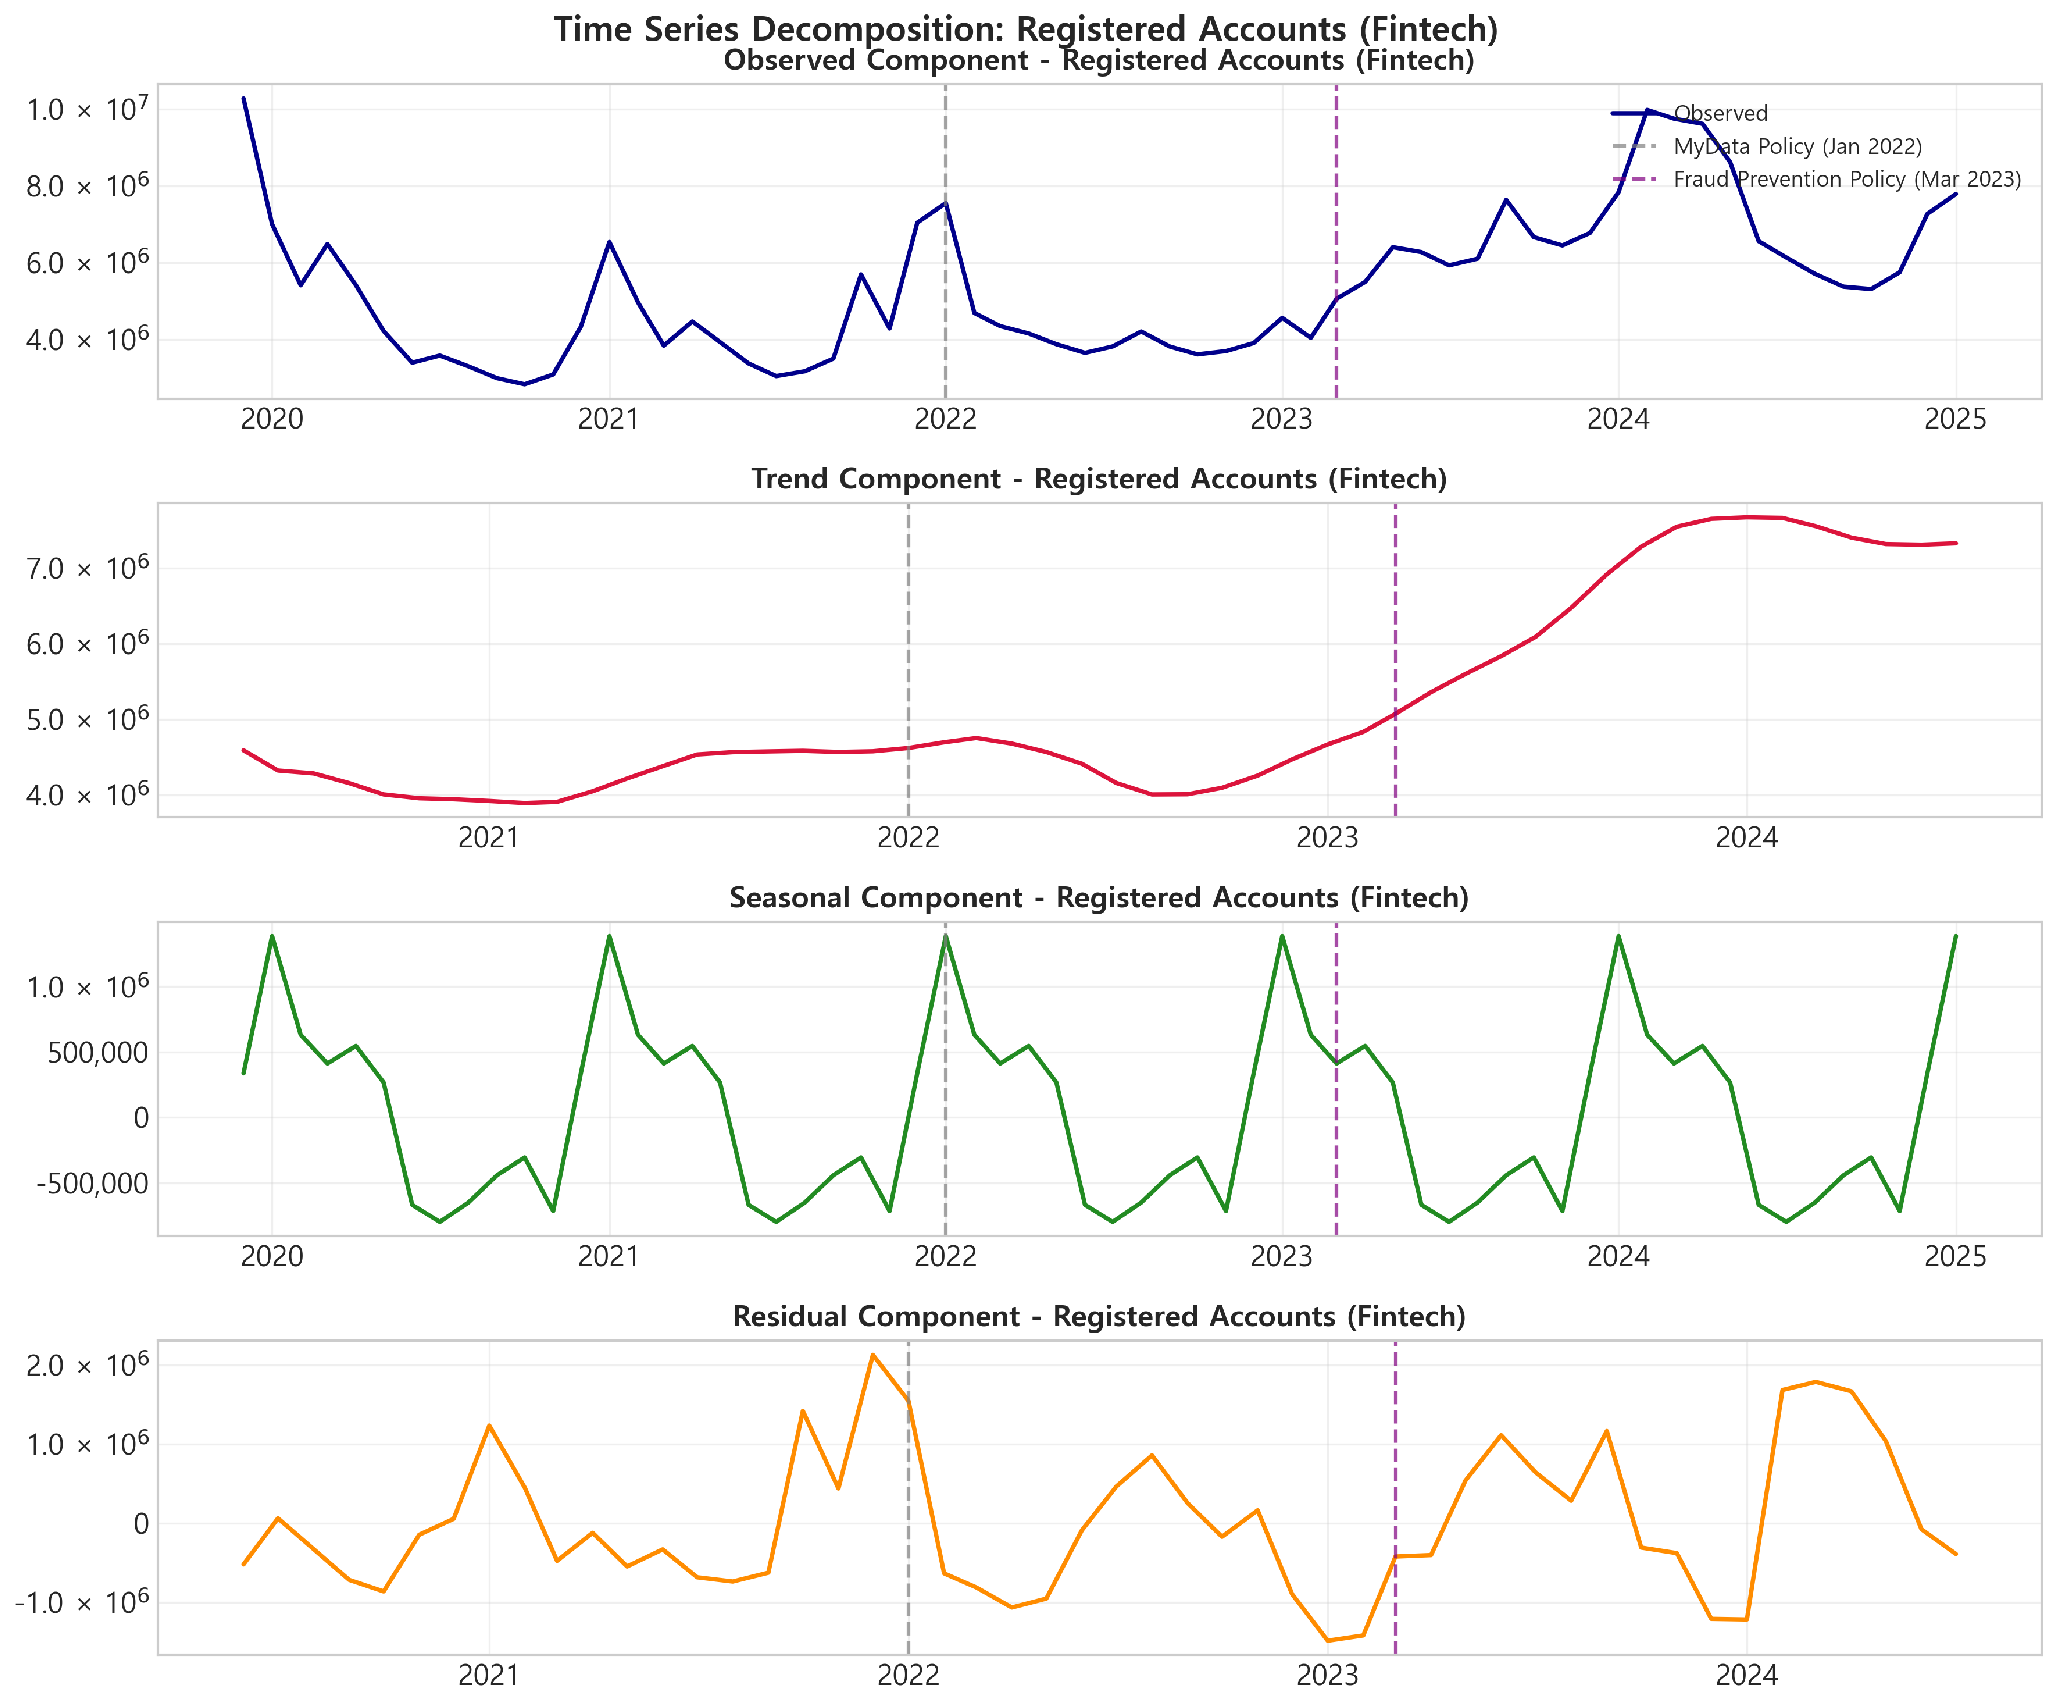
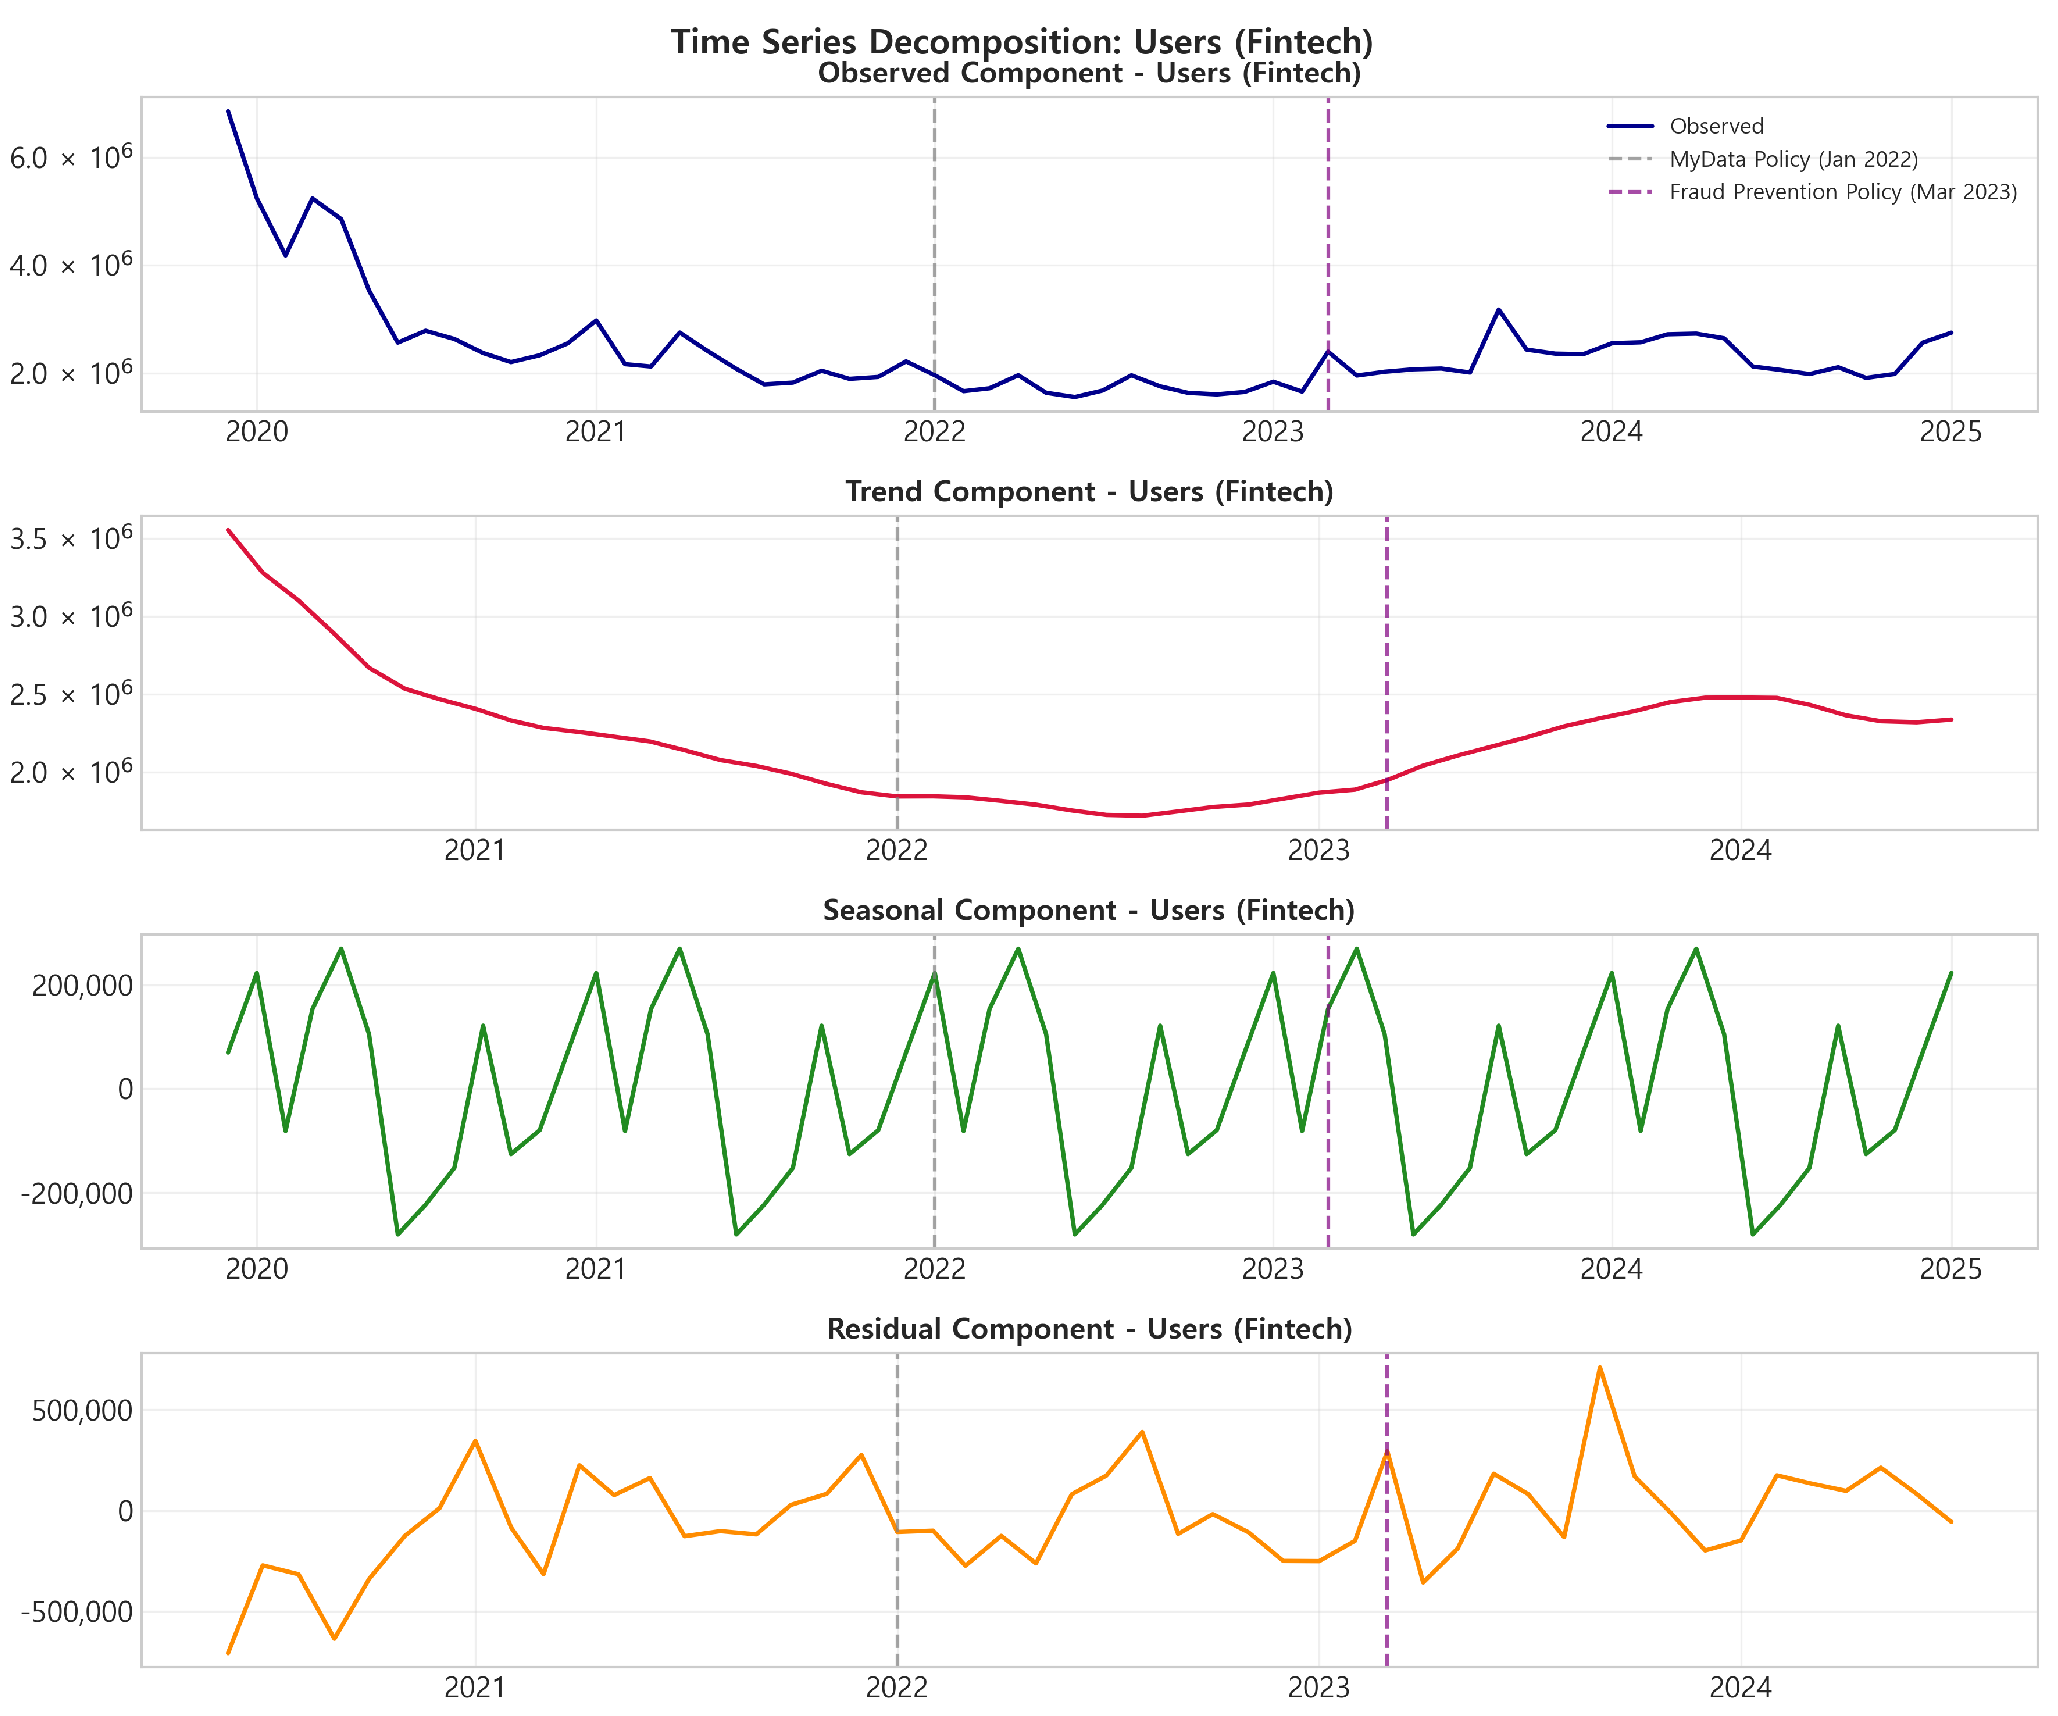
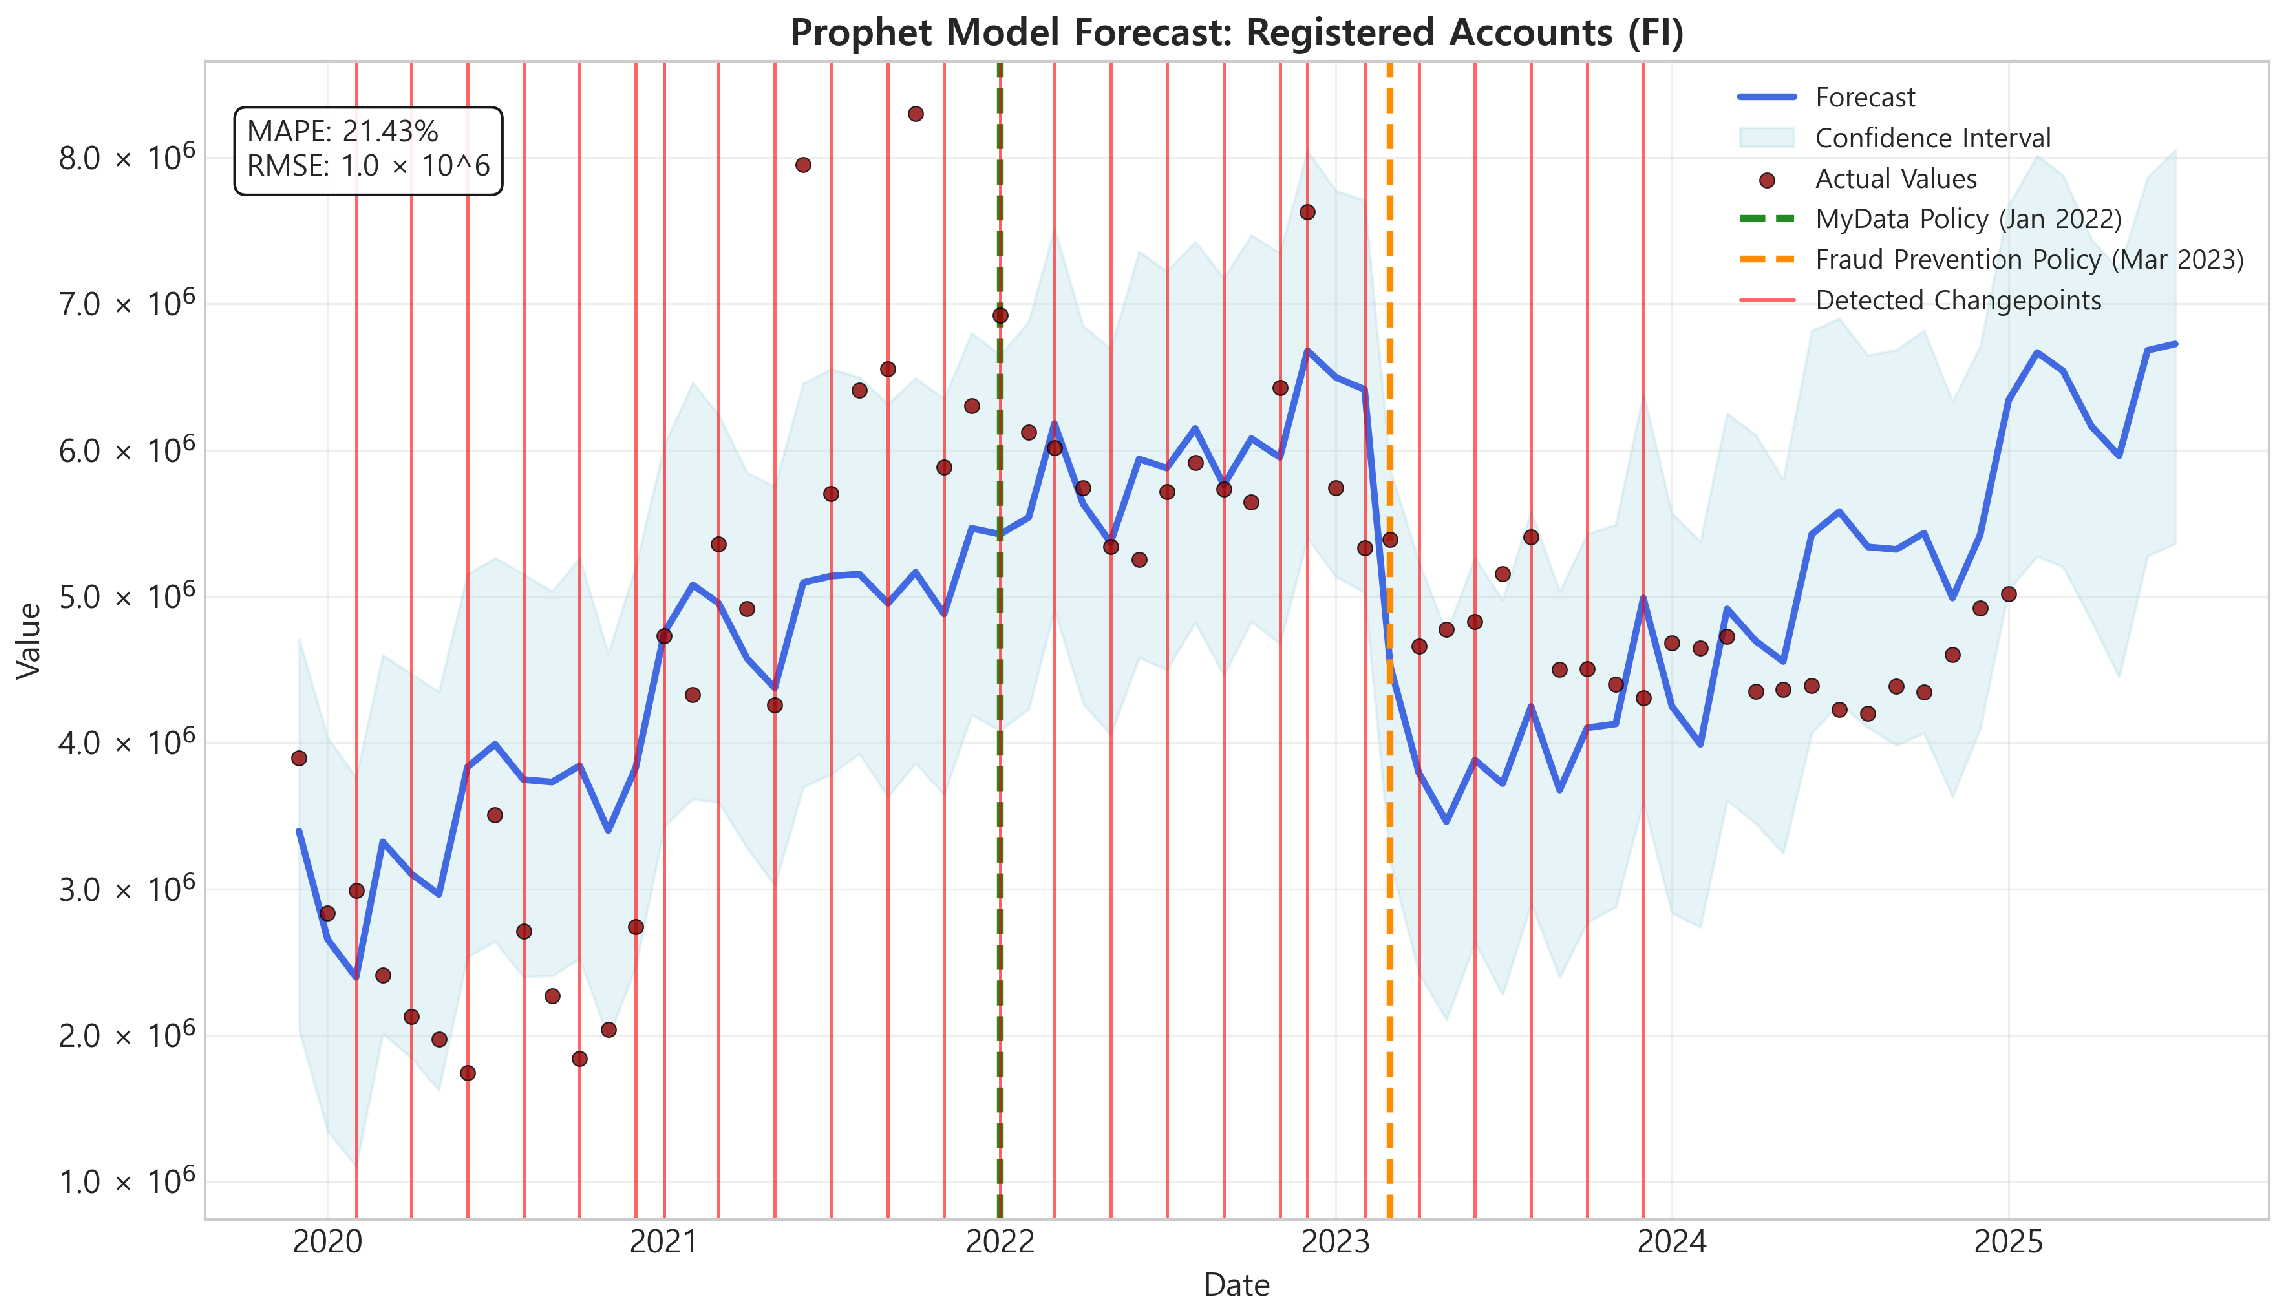

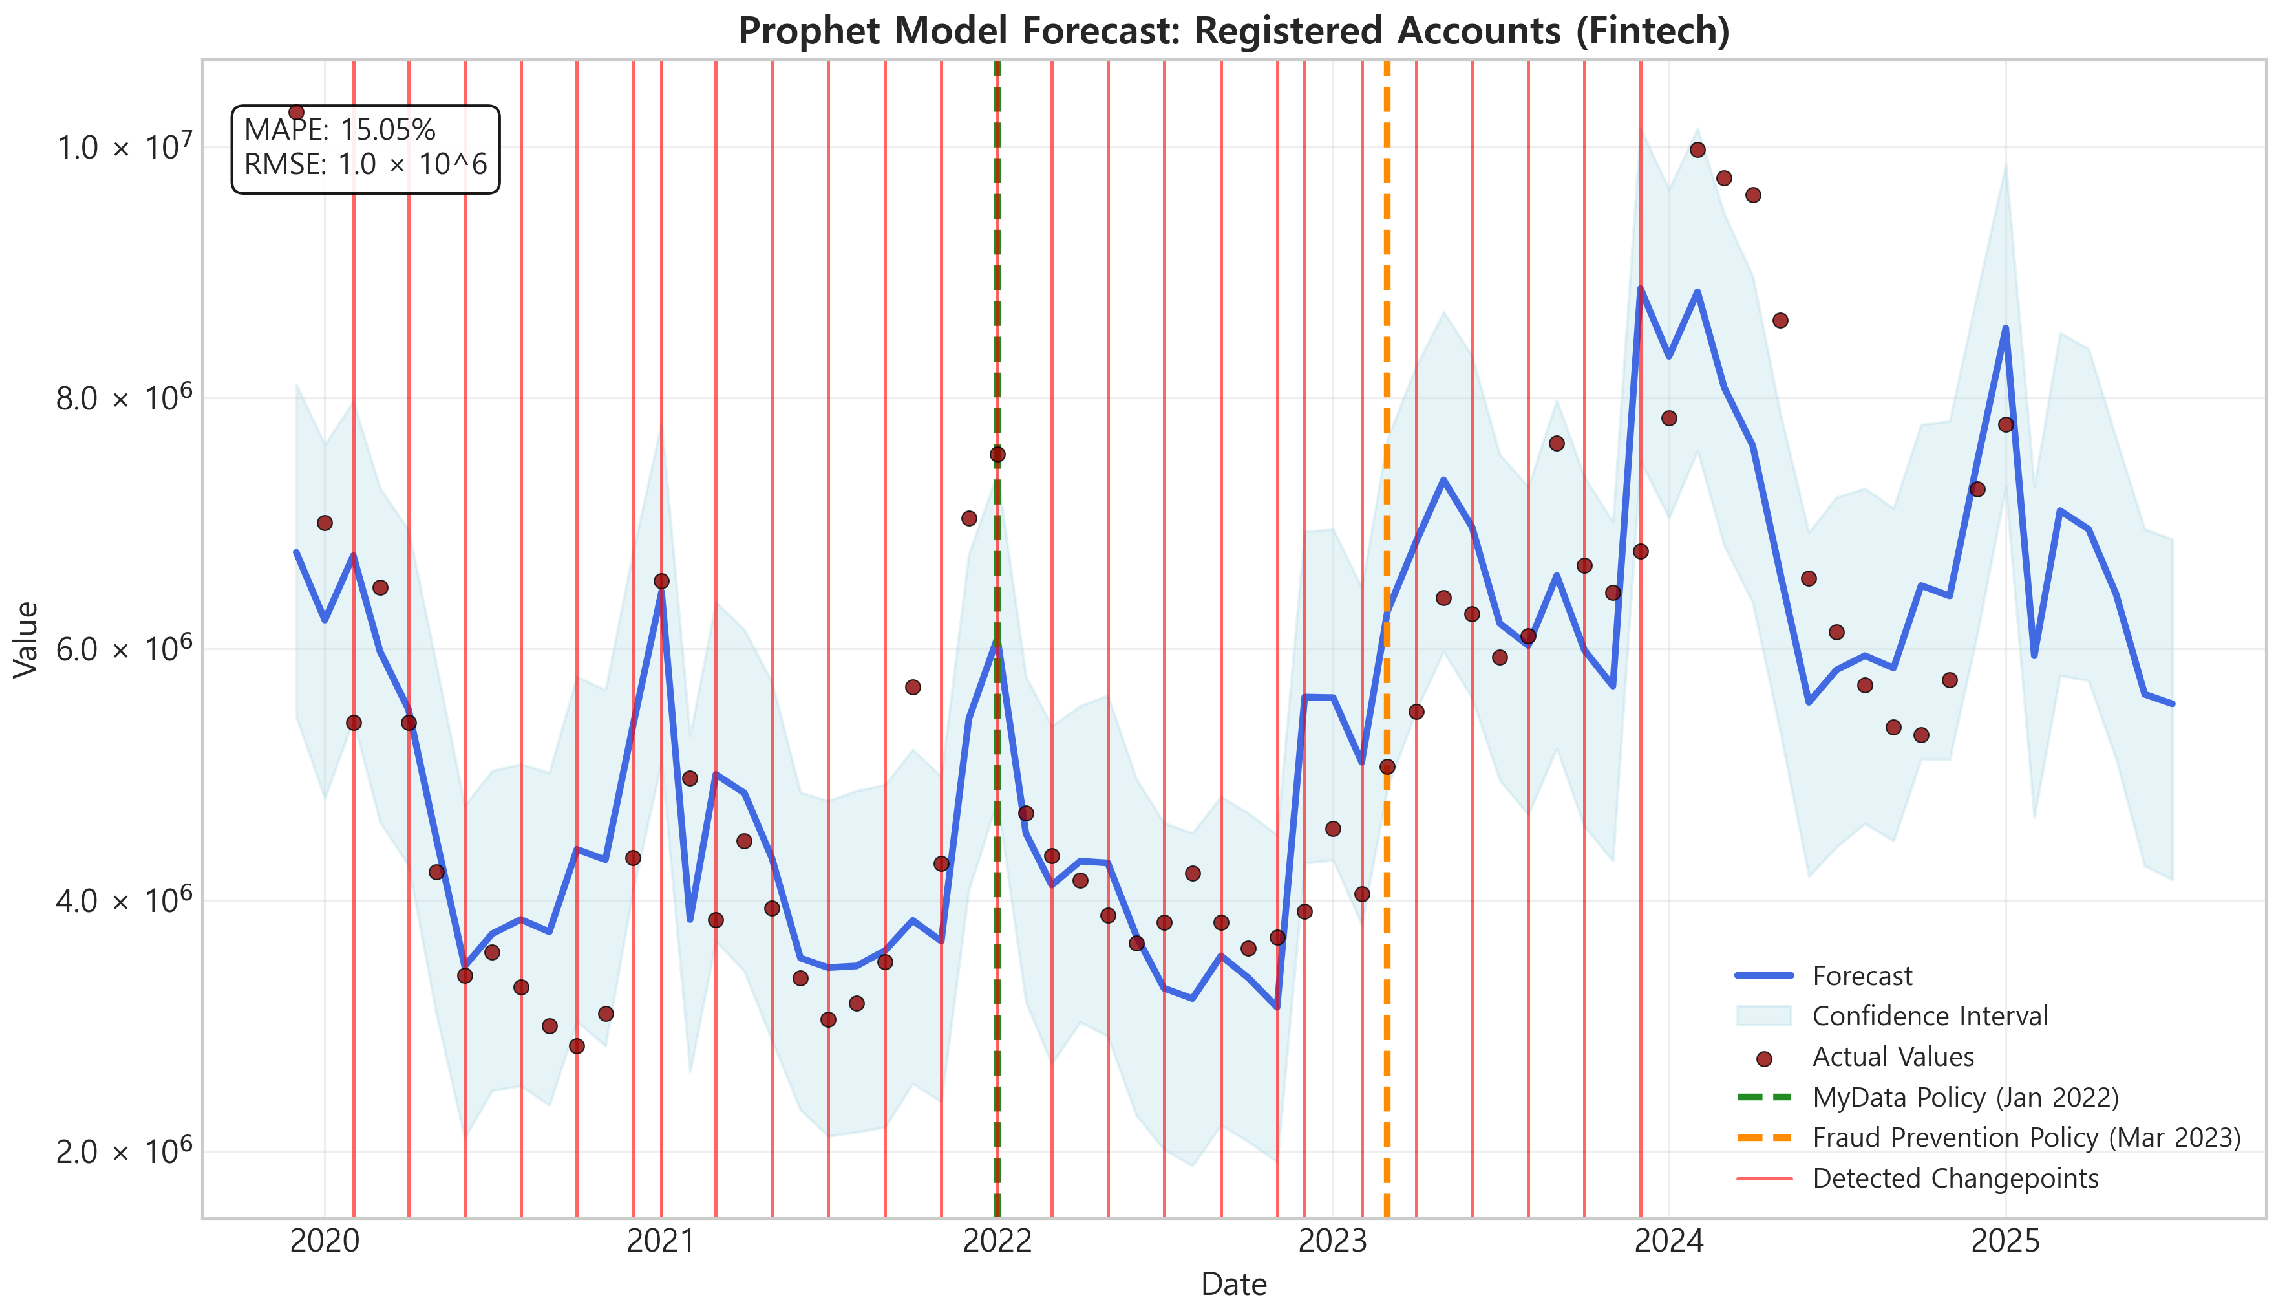
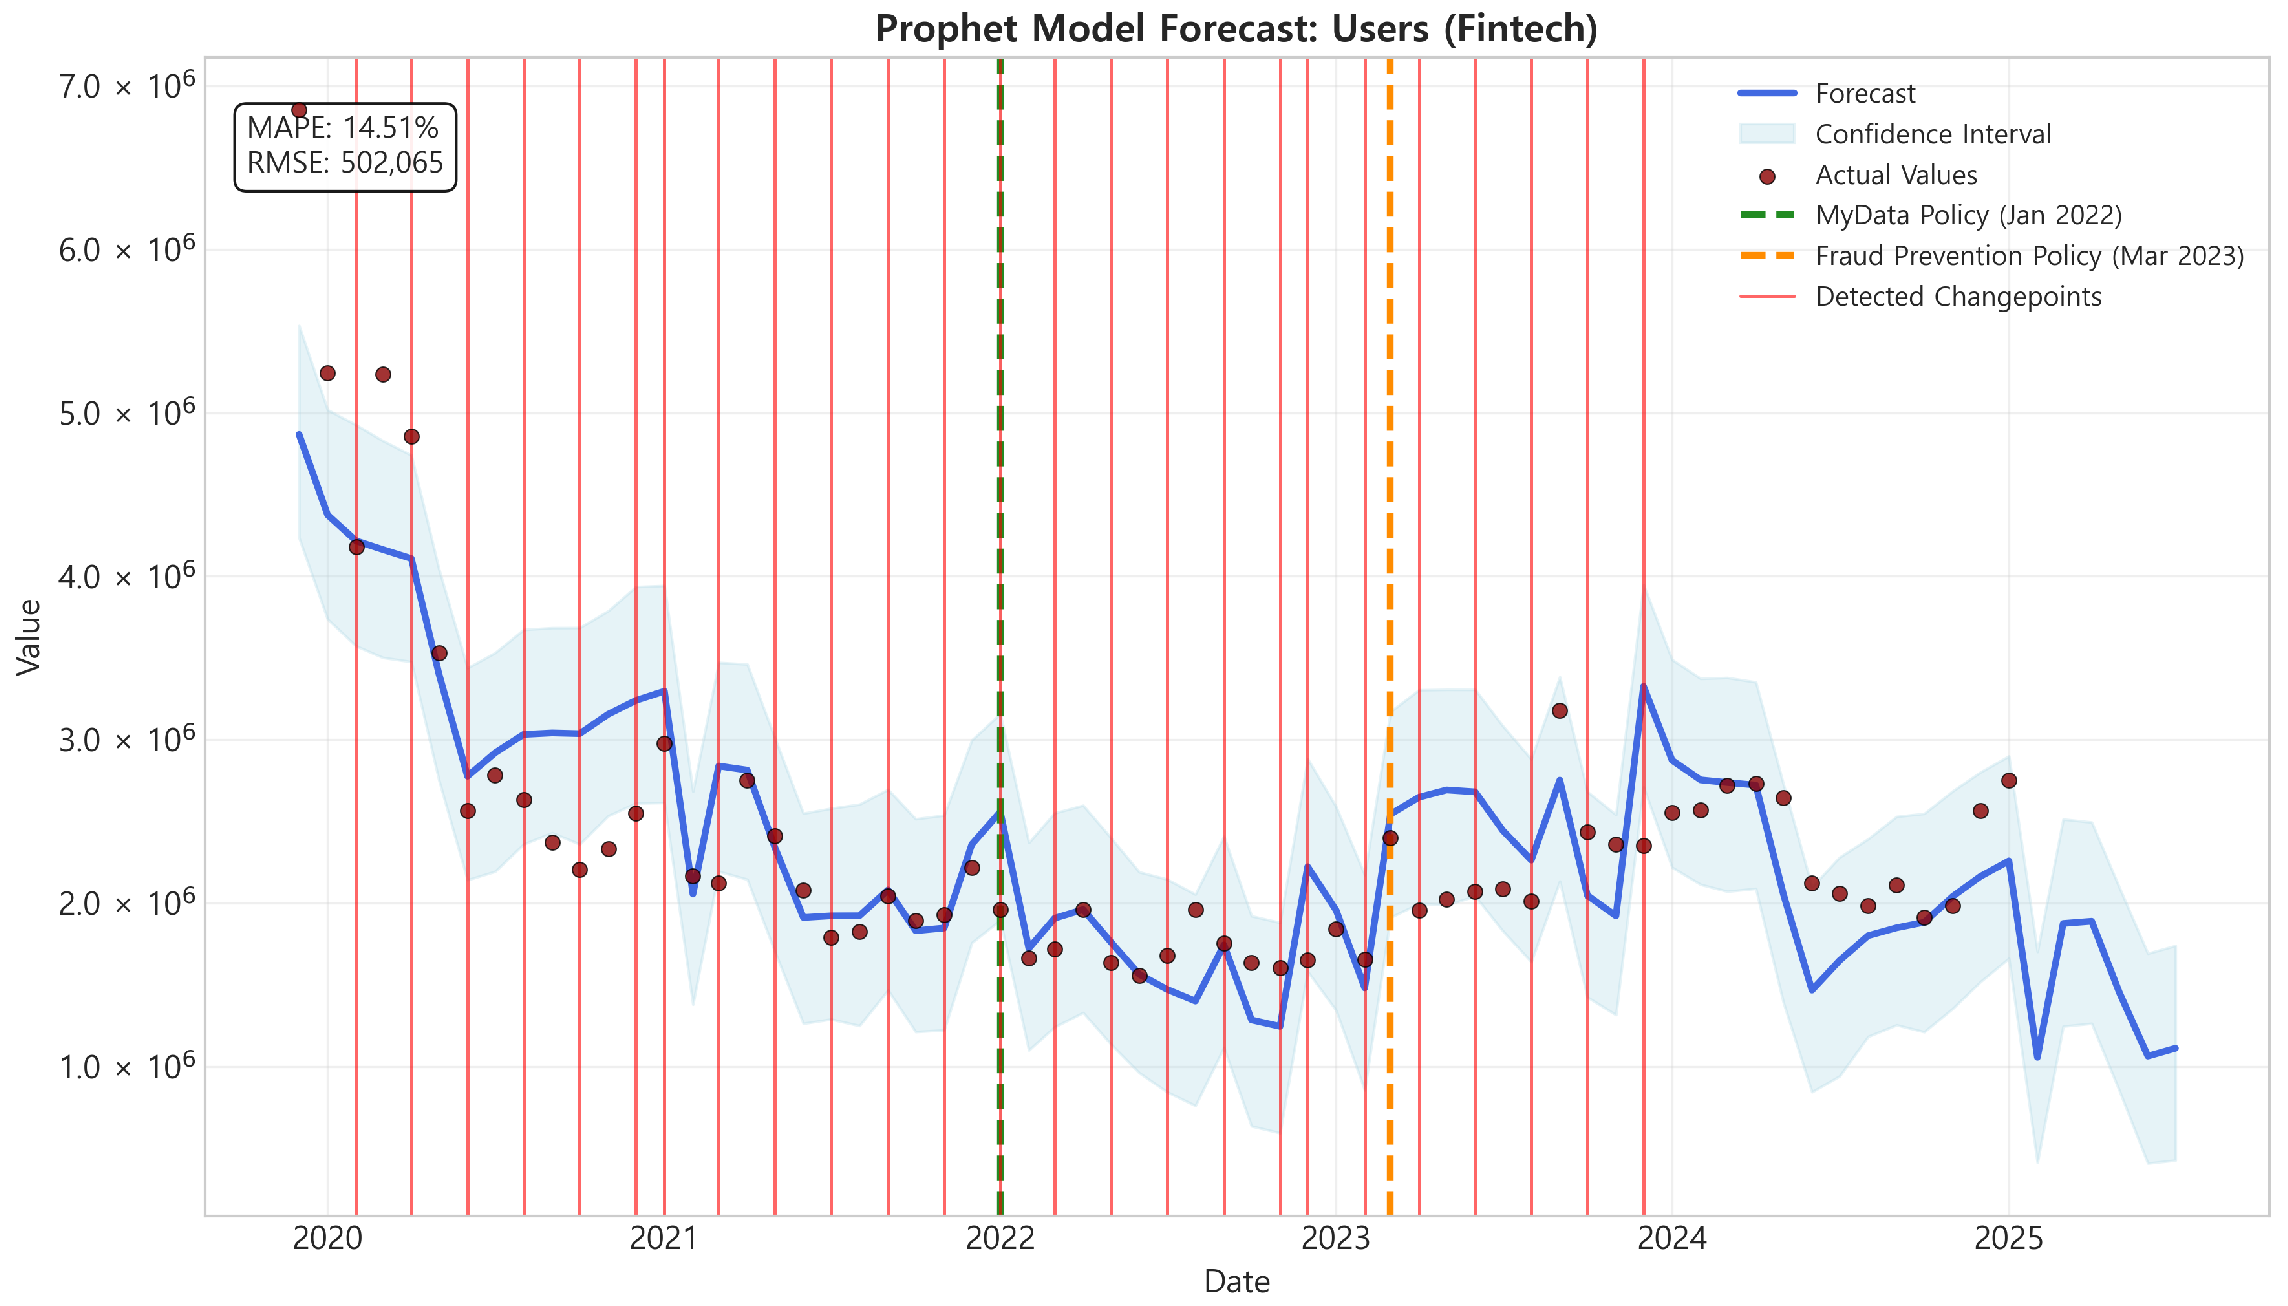
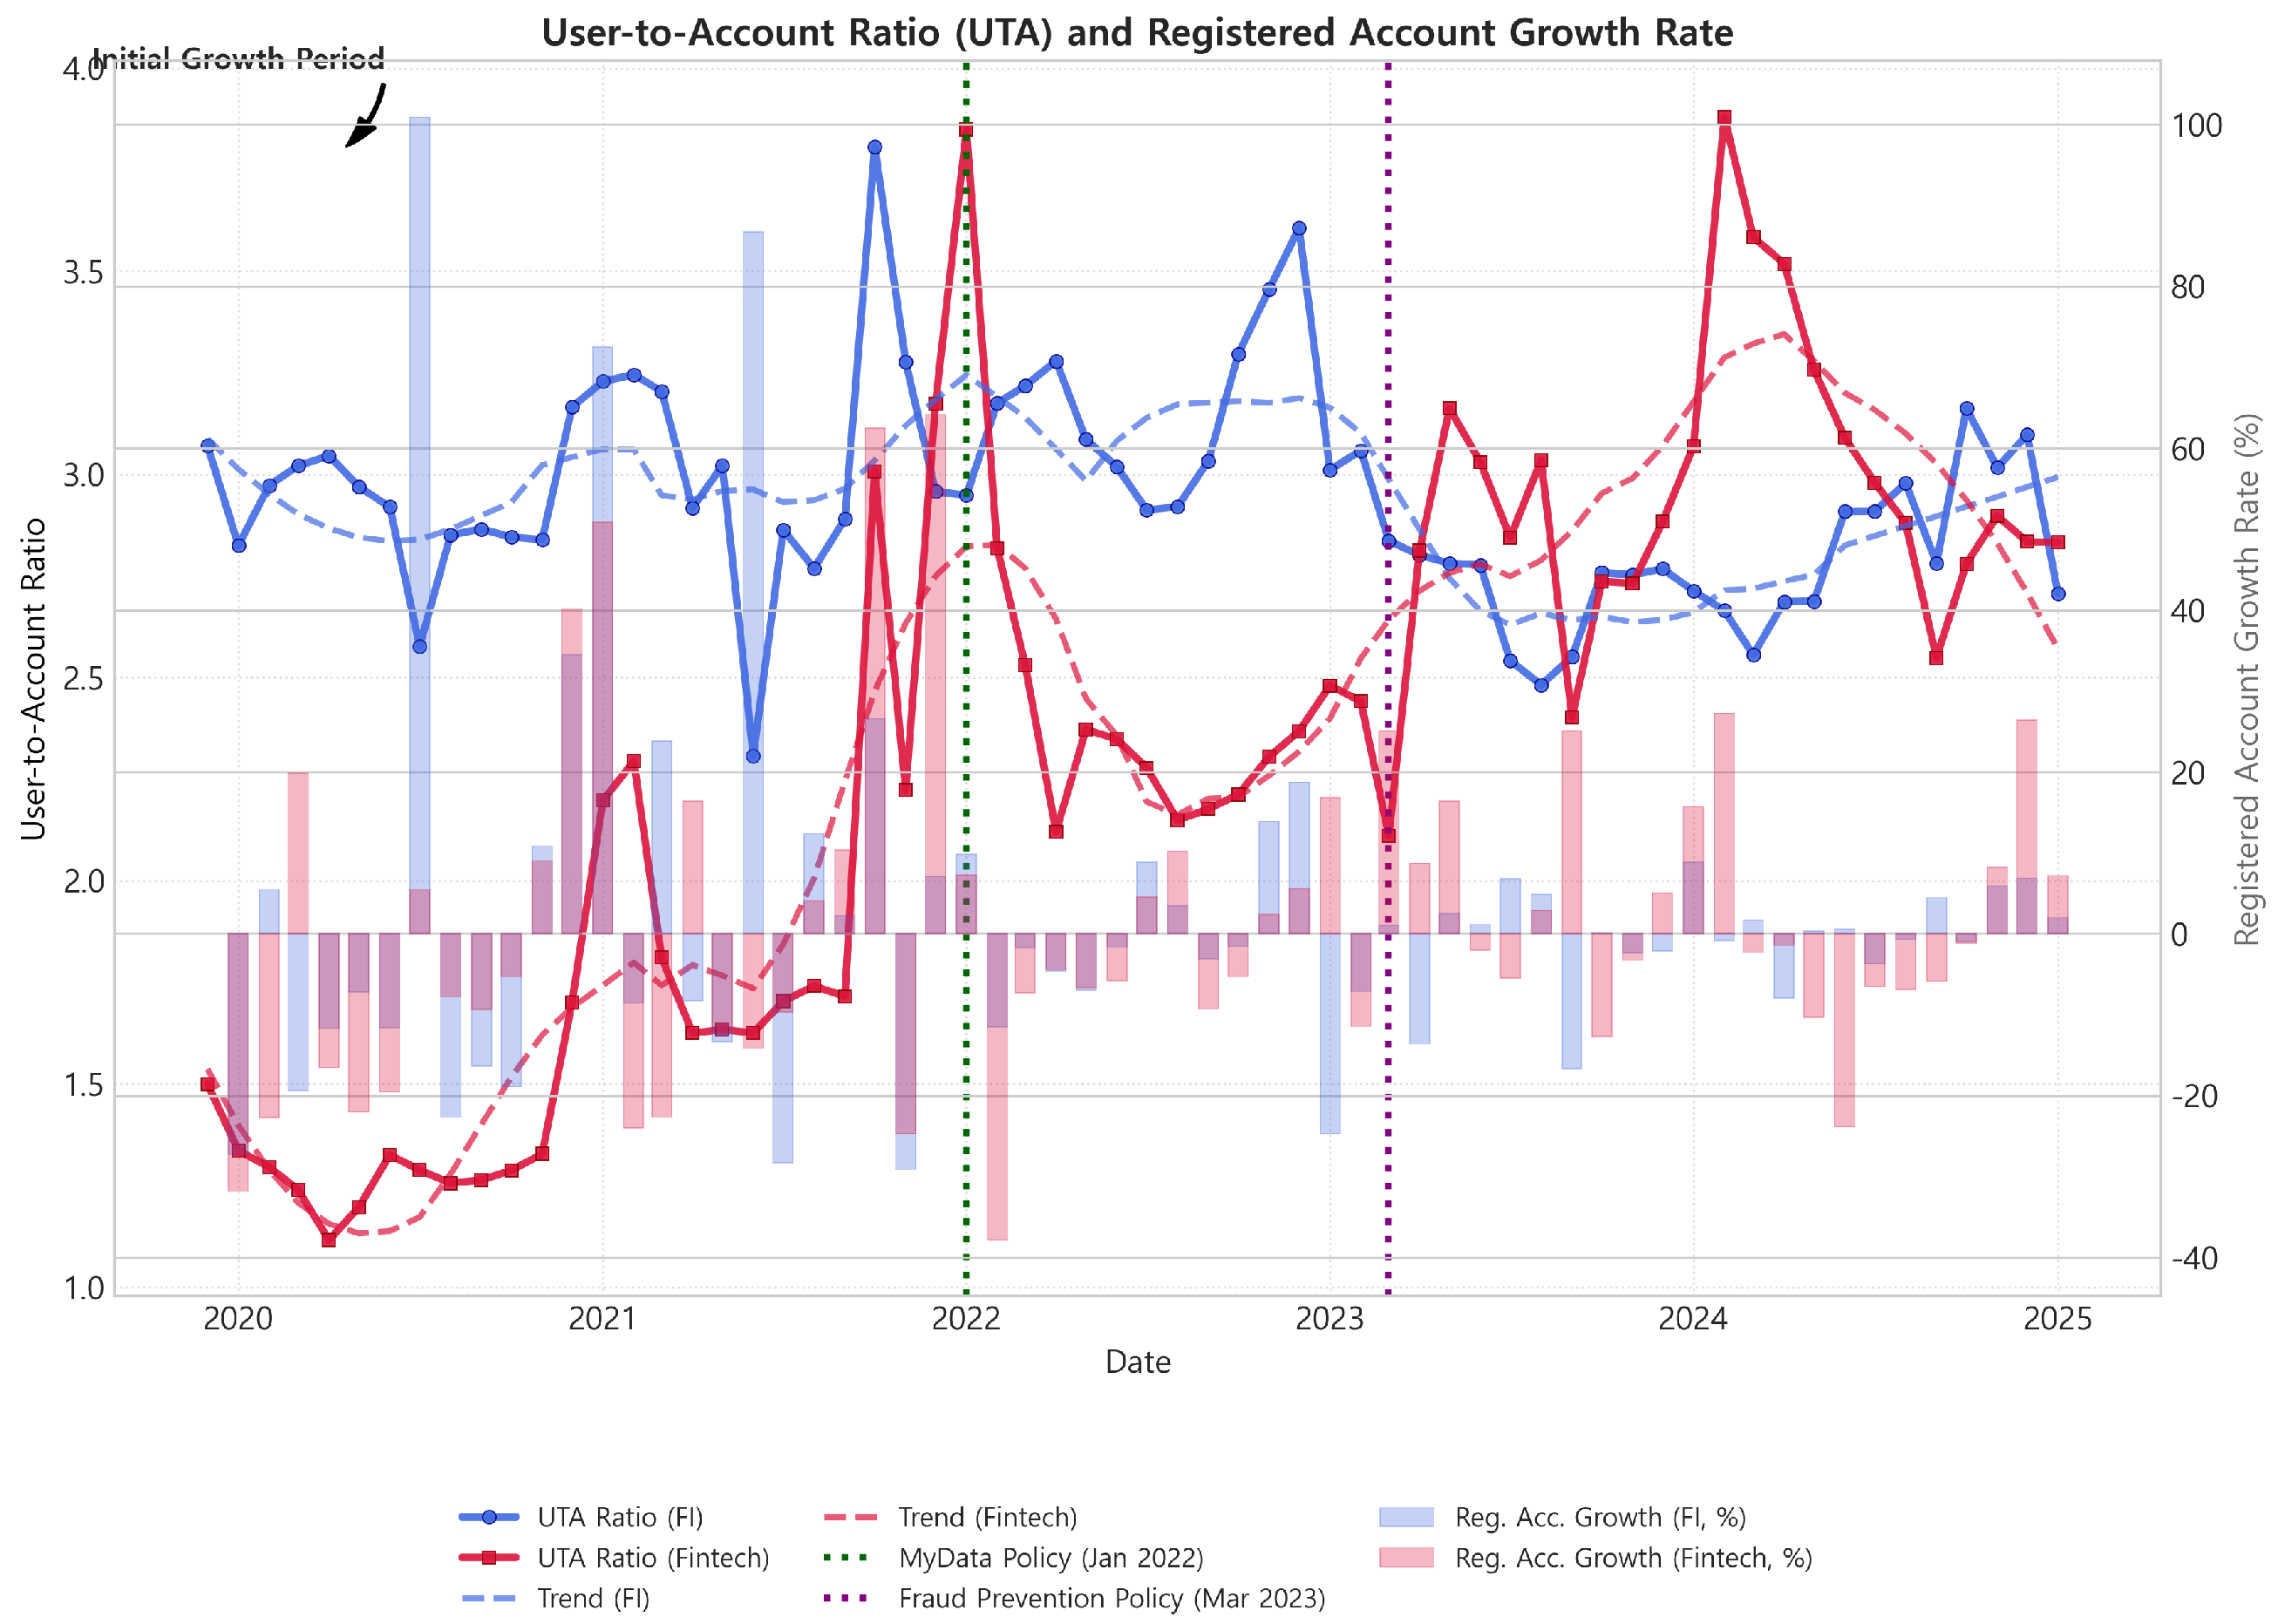
Disclaimer/Publisher’s Note: The statements, opinions and data contained in all publications are solely those of the individual author(s) and contributor(s) and not of MDPI and/or the editor(s). MDPI and/or the editor(s) disclaim responsibility for any injury to people or property resulting from any ideas, methods, instructions or products referred to in the content. |
© 2025 by the author. Licensee MDPI, Basel, Switzerland. This article is an open access article distributed under the terms and conditions of the Creative Commons Attribution (CC BY) license (https://creativecommons.org/licenses/by/4.0/).