Abstract
The pasture–animal interface of warm-season perennial grass–legume mixed pastures has never been investigated in forage-based equine systems. Therefore, this 2-year study investigated the herbage and animal responses under 84-day continuous stocking in mixed pastures of rhizoma peanut (RP, Arachis glabrata Benth) and bahiagrass (BG, Paspalum notatum Flüggé) with 30 kg nitrogen (N) ha−1 (BG-RP) compared to BG pastures fertilized with 120 kg N ha−1 (BG-N120) and no N (BG-N0). Measurements were taken every 14 days, except for intake and in vivo digestibility, which were measured every 28 days. BG-N120 had the highest stocking rate (p = 0.01; 3.7 AU ha−1) in 2019, while BG-N0 had the lowest (p = 0.01; 2.6 AU ha−1) in 2020. Crude protein and digestible energy were greatest (p < 0.05) for BG-N120 and BG-RP in some of the evaluation days in 2019 but similar across pastures in 2020. Crude protein digestibility was greatest (p < 0.05) for BG-RP in the late season. Intake was less (p = 0.03) for horses grazing BG-RP (3.2%BW) compared to BG-N0 (5.0%BW). Nonetheless, no differences (p > 0.05) were observed among pastures for body measurements. The results indicate that BG-RP pastures can improve forage nutritive value and maintain horse body condition while maintaining similar stocking rate to monoculture bahiagrass with high N fertilizer rates.
1. Introduction
Providing horses with pasture access is beneficial for their health, nutrition, and welfare. Horses allowed to graze full time or most of the day are less likely to develop dental abnormalities and gastric ulcers and are less exposed to endotoxins related to inflammatory airway disease [1,2,3]. However, managing horses in tropical pastures may require greater attention to nutritional requirements, as warm-season grasses often do not meet the demands of some classes of horses. Nitrogen fertilization is often used to increase the production and nutritional value of the forage [4], with annual fertilization rates in monoculture warm-season perennial grasses typically ranging from 100 to 200 kg N ha−1. Although N is essential to plant development, it is also costly and can lead to environmental impacts when applied in excess [5].
Incorporating a forage legume into tropical and subtropical grasslands may provide a sustainable alternative by replacing the need for high rates of N fertilizer while maintaining pasture productivity and providing high-nutritive value forage [6,7]. Rhizoma peanut (Arachis glabrata Benth.) is a warm-season perennial legume well adapted to subtropical regions of the U.S. In combination with its excellent nutritive value, it has potential for biological N fixation of 170 to 230 kg N ha−1 yr−1 when grown in monoculture [8]. Although most warm-season legumes persist poorly when planted with warm-season grasses in warm climates [9], rhizoma peanut spreads and persists for decades in grazed warm-season pastures grazed by cattle [10,11].
Warm-season perennial grasses are the foundation of pastures in the southern USA. In Florida horse operations, pastures are primarily based on bahiagrass (Paspalum notatum Flugge) and bermudagrass [Cynodon dactylon (L.) Pers.], which comprise 77 and 6%, respectively, of the primary pasture forage species [12]. When grown with bahiagrass in plot conditions, the rhizoma peanut added N to the system and improved the forage nutritive value [13]. However, rhizoma peanut–bahiagrass mixtures had lesser herbage accumulation when compared to heavily fertilized grass [13]. Conversely, in another study, the inclusion of rhizoma peanut into bahiagrass resulted in similar herbage accumulation compared to fertilized bahiagrass during most of the grazing season in grazing systems for cattle [7]. Differences among studies are attributed to weather conditions during the experiments and defoliation regimes used (small plots vs. continuously stocked grazed pasture).
Animal performance may also be enhanced in rhizoma peanut–bahiagrass systems. For example, a 74% increase was observed in cattle average daily gain with reduced N inputs (34 kg N ha−1 yr−1) compared to heavily fertilized bahiagrass pastures (224 kg N ha−1 yr−1) [7]. Unlike cattle operations, the objective of most horse operations is to maintain optimal health and performance. Thus far, no study has been conducted to investigate herbage and animal responses on warm-season grass–legume mixed pastures grazed by horses. We hypothesized that incorporating rhizoma peanut into warm-season pastures grazed by mature horses would offset N fertilizer in subtropical pasture systems, maintain forage production, increase forage quality, and maintain body weight and condition. Therefore, the objective of this study was to investigate the effect of intercropping rhizoma peanut into bahiagrass pastures grazed by horses in maintenance on forage quality and production and horse performance.
2. Materials and Methods
All animal protocols were approved by the University of Florida Institutional Animal Care and Use Committee (IACUC #201710092) under the Federation of Animal Sciences Societies Guide for the Care and Use of Agricultural Animals in Research and Teaching [14].
2.1. Experimental Site, Management, and Treatments
A two-year grazing experiment was conducted from July to October in 2019 and 2020. The study was located at the University of Florida, Beef Research Unit, Gainesville, FL (29°44′ N, 82°13′ W, 45 m). Soils at the site are Myakka fine sand (sandy, siliceous, hyperthermic Aeric Alaquods) and Pomona sand (sandy, siliceous, hyperthermic Ultic Alaquods) [15]. This study was conducted for 84 days each year, from 11 July to 3 October in 2019 and from 16 July to 8 October in 2020. Herbage responses included stocking rate, herbage mass, herbage accumulation rate, botanical composition, and nutrient composition. Horse responses included dry matter (DM) and nutrient intake and in vivo digestibility, proportion of the legume forage in fecal samples as a representative of the proportion of the legume forage in the diet, body weight, body condition score, and percentage of body fat.
Except for intake and in vivo digestibility of DM and nutrients, measurements were taken every 14 days. In both years, evaluations were conducted on days 0, 14, 28, 42, 56, 70, and 84. Corresponding dates within the year are presented in Table 1. For the purposes of this study, days 0 to 28, 28 to 56, and 56 to 84 were categorized as early-, mid-, and late-season, respectively. At the beginning of the experiment, the average Mehlich-I extractable soil P and K concentrations and pH from 0 to 20 cm depth from air-dried soils were 42 and 29 mg kg−1 and 5.9, respectively, in 2019 and 32 and 44 mg kg−1 and 5.8, respectively, in 2020. The monthly average temperature, rainfall, and solar radiation are shown in Figure 1.

Table 1.
Evaluation days and their respective dates within each year.
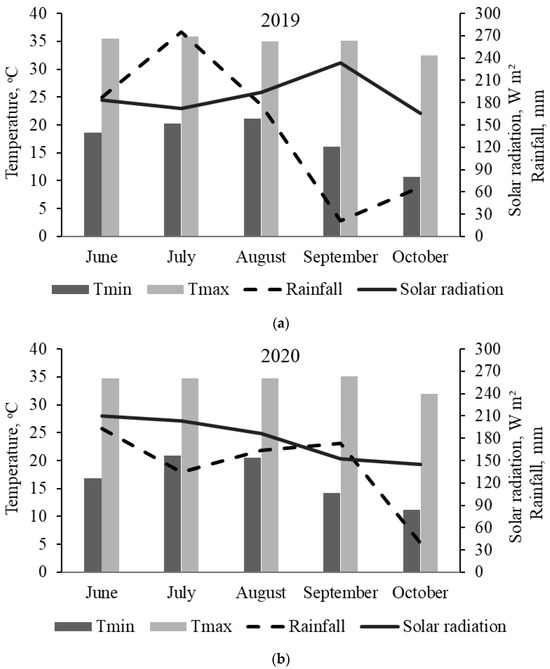
Figure 1.
Monthly weather conditions at the UF/IFAS Beef Research Unit, Gainesville, FL, during the experimental period in (a) 2019 and (b) 2020.
Treatments consisted of three ‘Argentine’ bahiagrass (BG) pastures: bahiagrass monoculture fertilized with N at 120 kg N ha−1 (BG-N120), bahiagrass monoculture with no N application (BG-N0), and bahiagrass intercropped with rhizoma peanut (RP) ‘Florigraze’ and fertilized with N at 30 kg N ha−1 (BG-RP). All pasture treatments were established more than 30 years prior to the initiation of the study. Each pasture (experimental unit) measured 1 ha, and treatments were replicated two times in a randomized complete block design, totaling six pastures. In 2019, all pastures were fertilized with 75 kg K ha−1 and 20 kg P ha−1. In 2020, pastures were fertilized with 42 kg K ha−1 and 11 kg P ha−1. Potassium and phosphorus were applied based on soil tests. Fertilizer application occurred three weeks before the beginning of the grazing season in both years.
Each experimental unit was grazed by two mature Quarter Horses (one mare and one gelding) with maintenance-only requirements, totaling 12 horses per year. The same horses remained on their assigned pasture during the 84 days of grazing. Horses were randomly assigned to a new pasture treatment the following year, as five of the 12 horses used in the first year of the study had to be replaced. The initial body weight of the horses was 534 ± 47 (mean ± SD) and 532 ± 51 kg for 2019 and 2020, respectively. Within each pasture, the horses had unlimited access to a shade structure, water, and a commercial mineral–vitamin supplement with a minimum of 0.15 g kg−1 of calcium, 0.08 g kg−1 of phosphorus, 0.12 g kg−1 of sodium chloride, 0.01 g kg−1 of magnesium, 1000 mg kg−1 of copper, 45 mg kg−1 of iodine, 4000 mg kg−1 of manganese, 19 mg kg−1 of selenium, 2950 mg kg−1 of zinc, 198,416 IU of vitamin A, 19,841 IU of vitamin D, and 1653 IU of vitamin E (Mineral Equalizer; Sweetlix, Mankato, MN, USA).
2.2. Herbage Responses
2.2.1. Stocking Rate
Pastures were continuously stocked, and the herbage allowance was adjusted every 14 days [16]. The herbage allowance [kg DM kg of bodyweight (BW)−1] was determined by dividing the herbage mass (kg DM ha−1) by the total body weight of horses in the experimental unit (kg BW). The herbage allowance was set based on the pasture with lesser herbage mass per kilogram of body weight. The area of pastures with greater herbage allowance was reduced using portable two-strand temporary electric fence, constructed with step-in posts and 5 cm polytape. The herbage allowance averaged 1.7 ± 0.49 (mean ± SD) and 2.1 ± 0.43 kg DM kg BW−1 in 2019 and 2020, respectively. Every 14 days, the stocking rate [SR, animal unit (AU) ha−1; AU = 450 kg)] was calculated by dividing the total body weight by 450 kg to obtain the AU, which was subsequently divided by the grazed pasture area in ha.
2.2.2. Herbage Accumulation Rate and Mass
The herbage mass (HM, kg DM ha−1) was measured using the double sampling technique [17] every 14 days (day 0, 14, 28, 42, 56, 70, and 84). Height was an indirect measurement using a 0.25 m2 aluminum settling-disk meter. Heights were taken from nine random sites within each experimental unit. The forage samples were collected from these same sites, dried at 65 °C for 72 h, and the dry weight was regressed against the disk height. Regression equations were calibrated every 28 days. Each prediction equation included 18 points for each treatment pasture, including the nine points from each replicate. Heights were taken from 30 random sites within each pasture every 14 days to estimate herbage mass of each experimental unit using the calibration equations. Across the 2 years, the R2 (average ± standard deviation) of the double-sampling procedure was 0.66 ± 0.05 for BG-RP, and 0.69 ± 0.11 for BG-N120 and BG-N0.
The herbage accumulation rate (HA, kg DM ha−1 d−1) was determined using three exclusion cages placed at random sites within each experimental unit and moved every 14 days. Disk heights were taken immediately before placing the cages and 14 days later when cages were removed [18]. Beginning and ending herbage mass for each 14-day interval were estimated using the same regression equation calibrated for HM within the whole experimental unit. Herbage accumulation was calculated as the difference between beginning and ending herbage mass divided by the number of days between measurements (14 days).
2.2.3. Botanical Composition
Botanical composition (BC, %) was determined before grazing began and at 14-day intervals throughout the 84-day study. Measurements were obtained using the double-sampling technique [19]. Nine representative 0.25-m2 metallic rings per experimental unit were hand clipped at the ground level, and fresh herbage samples were separated by hand into the respective components: BG and weed in the monoculture bahiagrass pastures and RP, BG, and weeds in the bahiagrass pasture intercropped with rhizoma peanut. For botanical composition, the ‘weed’ category was considered as any plant component other than BG or RP. Separated samples were dried in a forced-air oven at 60 °C until constant weight, and actual percentages of RP, BG, and weeds were determined based on the dry weight. Actual percentages of botanical components were used as direct measurements, and visual estimations were used as indirect measurements. Calibration equations were developed every 28 days, and actual percentages were regressed from visual estimations. For biweekly measurements of botanical composition, 30 random sites within each pasture were visually estimated for botanical composition. All visual estimations of botanical composition were performed by a single researcher familiar with botanical identification. Across the 2 years, the R2 (average ± standard deviation) of the double sampling procedure was 0.62 ± 0.08 for BG-RP (for percentages of RP); 0.55 ± 0.07 for BG-RP, 0.76 ± 0.11 for BG-N120, and 0.89 ± 0.08 for BG-N0 (for percentages of BG); and 0.26 ± 0.03 for BG-RP, 0.75 ± 0.15 for BG-N120, and 0.90 ± 0.09 for BG-N0 (for percentages of weed).
2.2.4. Nutrient Composition
Forage nutrient composition was measured by collecting samples in 10 locations within each experimental unit every 14 days. Hand-plucked samples were obtained from locations and at heights similar to areas grazed by the horses within the experimental unit, based on observations of animal defoliation for five days prior to the collection for each treatment pasture [20]. Therefore, forage sample included all forage components present in each respective pasture. Forage samples were dried in a forced-air oven at 55 °C for 72 h, and ground to pass a 2 mm sieve using a Wiley mill (Thomas Scientific, Swedesboro, NJ, USA). Ground samples were submitted to a commercial forage testing laboratory (Equi-Analytical, Ithaca, NY, USA) for analysis of nutrient composition. Nutrient composition was determined by near-infrared spectroscopy for dry matter (DM), organic matter (OM), crude protein (CP), equine digestible energy (DE), neutral detergent fiber (NDF), acid detergent fiber (ADF), and non-structural carbohydrates (NSC).
2.3. Animal Responses
2.3.1. Dry Matter and Nutrient Intake and Digestibility
Intake and digestibility of dry matter and nutrients were measured every 28 days using the dual marker system [21,22]. Titanium dioxide (TiO2; SpectrumTM Chemical, New Brunswick, NJ, USA) was used as the external indigestible marker to estimate daily fecal excretion. The indigestible NDF (iNDF) was used as the internal indigestible marker to estimate digestibility of DM and nutrients. Dry matter intake (DMI) was estimated by dividing fecal output by the diet indigestibility (1-DM digestibility) using the following equation:
The TiO2 was administered to horses in two, 2.5 g boluses twice a day (totaling 10 g TiO2 d−1) for 14 days. Each 2.5 g bolus dose of TiO2 was delivered by mouth using a hollow, cylinder-shaped 4 × 3 cm hay device sealed with a molasses paste (Figure 2; Horse pill carrier; Standlee Premium Products, Kimberly, ID, USA).
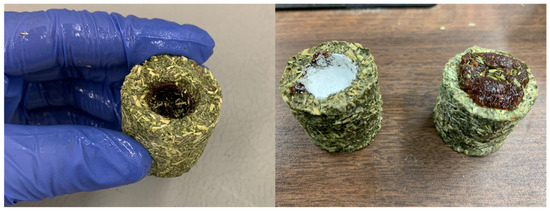
Figure 2.
Forage bolus device used for feeding the external marker (TiO2) for estimation of fecal excretion of horses in grazing systems during the 14-day digestibility assays (Credit: Ana Caroline Vasco).
Each year, three digestibility assays were conducted every 28 days corresponding with the early-, mid-, and late-season periods. The TiO2 boluses were fed in the last 14 days, and fecal and forage samples were collected in the last four days (on days 25–28, 53–56, and 81–84). Horses were individually hand-fed the boluses to ensure complete consumption of the marker. Fecal and forage samples were collected from the 11th to the 14th day of marker intake of each digestibility assay period. Fecal samples were collected twice daily at 12 h intervals, which were advanced by 3 h each day to account for diurnal variation. Fecal samples were collected by rectal grab or immediately after feces were voided. Feces were immediately homogenized, and a 300 g aliquot was subsampled and stored at −20 °C for posterior analysis. This resulted in two 300 g samples per day per horse and totaled eight samples per horse for each 4-day collection period [22]. Forage samples within each experimental unit were collected concurrently with fecal collection using the method described for samples collected for herbage nutrient composition and stored at −20 °C for subsequent analysis.
Fecal and forage samples were dried in a forced-air oven at 55 °C for 72 h. Samples were ground to pass a 2 mm screen using a Wiley mill. After grinding, fecal samples were composited by horse using a digestibility assay, and forage samples were composited by experimental unit using the digestibility assay. The fecal and forage samples were later quantified for iNDF. Titanium oxide was quantified exclusively in the fecal samples. To prepare samples for TiO2 determination, approximately 0.5 g of previously dried ground feces were dried in a forced-air oven at 105 °C for 24 h to determine DM, followed by 3 h combustion at 550 °C in a muffle furnace to determine OM. Ashed samples were analyzed for TiO2 using the method developed by Titgemeyer et al. [21] with modifications [23].
For quantification of iNDF, forage and fecal samples were weighed (0.5 g) into Ankom F57 filter bags (Ankom Technology Corp., Macedon, NY, USA) and incubated in situ in a cannulated steer for 288 h to ensure complete digestion of potentially digestible NDF fraction [24]. The steer remained on the bahiagrass pasture throughout the incubation period. After incubation, the samples were rinsed and analyzed for NDF concentration in a fiber analyzer (Ankom 200 Fiber Analyzer; Ankom Technology Corp., Macedon, NY, USA) using sodium sulfite and heat-stable α-amylase.
2.3.2. Proportion of Rhizoma Peanut in the Diet
The proportion of RP in the feces was quantified to estimate the proportion of RP in the diet by using the δ13C from the fecal and forage samples [25]. Fecal and forage samples were collected on the same days and times as the samples collected for measuring intake and nutrient digestibility. Fecal samples were stored at −20 °C until further analysis. For forage samples in the BG-RP pastures, BG and RP samples were collected separately. Forage and thawed fecal samples were oven dried and ground similarly to samples collected for the quantification of TiO2 and iNDF. After being ground to pass a 2 mm sieve, fecal samples were composited by horse, and forage samples were composited by forage species and experimental unit. Composites were ball milled (Mixer Mill MM 400; Retsch Technology, Haan, Germany) for 9 min at 25 Hz and analyzed for δ13C using a Carbon–Nitrogen–Sulfur analyzer (Vario Micro cube; Elementar, Langenselbold, Germany) coupled to an isotope ratio mass spectrometer (IsoPrime 100; IsoPrime, Cheadle, UK).
The proportion of rhizoma peanut in the feces was estimated using the following equation [25]:
where A is the δ13C of the fecal sample obtained, B is the δ13C of BG, and C is the δ13C of RP. The selection index was calculated by dividing the proportion of RP in the feces and the proportion of RP in the pasture based on botanical composition.
2.3.3. Body Measurements
Body weight (BW), body condition score (BCS) and body fat percentage of the horses were measured every 14 days. Horses were weighed using a livestock platform scale (PS2000; Salter Brecknell, Fairmount, MN, USA). Body condition score was determined independently by three trained researchers via visual appraisal and palpation of the six areas on a scale from 1 to 9, with 1 = emaciated and 9 = morbidly obese [26]. The body fat percentage was indirectly determined by measuring the rump subcutaneous adipose tissue thickness using the Westervelt method [27]. Briefly, adipose tissue thickness was determined by ultrasound of the rump area with a 5.0 MHz linear ultrasound transducer in real time. The transducer was perpendicularly placed at the midpoint between the end of the ileum and the ischium and 5.0 cm laterally from the midline of the body. Three measurements were taken from each image on both the right and left sides of the midline. The body fat percentage was estimated using the Westervelt’s regression equation to convert the average of the six measurements of rump adipose tissue thickness to an overall body fat percentage:
2.4. Statistical Analysis
Data were tested for normal distribution using the Shapiro-Wilk test and submitted to analysis of variance with repeated measures using the GLIMMIX procedure in SAS (Version 15.1, SAS Inst. Inc, Cary, NC, USA). Pastures were considered experimental units for all response variables. The two horses within each pasture were considered the sampling units, and animal responses were averaged within the experimental unit. The model included pasture treatment, year, evaluation day, and their interaction as fixed effects. Block, block × pasture, and block × pasture × year were considered random effects. Data were processed and estimated using the pasture (experimental unit) as the subject. The covariance function with the least Akaike’s Information Criterion was selected. Mean comparisons were adjusted using a Tukey test, and differences were considered significant at p ≤ 0.05.
3. Results
3.1. Herbage Responses
3.1.1. Stocking Rate
Stocking rate was affected by a year × treatment × evaluation day effect (Figure 3; p = 0.03, SEM = 0.34). In 2019, BG-N120 had greater SR than the other two pastures on day 28 but was similar to BG-N0 on days 42 and 84, with no difference among pastures on days 0, 14, 56, and 70. In 2020, BG-N120 had greater SR than BG-N0 on day 42, with no difference among pastures during the other evaluation days. In 2019, mean SR was greater (p = 0.01; SEM = 0.20) in BG-N120 (3.9 AU ha−1) than in BG-RP (3.7 AU ha−1) and BG-N0 (3.1 AU ha−1). In 2020, mean SR was lesser (p = 0.01; SEM = 0.20) in BG-N0 (2.6 AU ha−1) than in BG-N120 (2.9 AU ha−1) and BG-RP (2.9 AU ha−1), with BG-RP not differing from BG-N120.
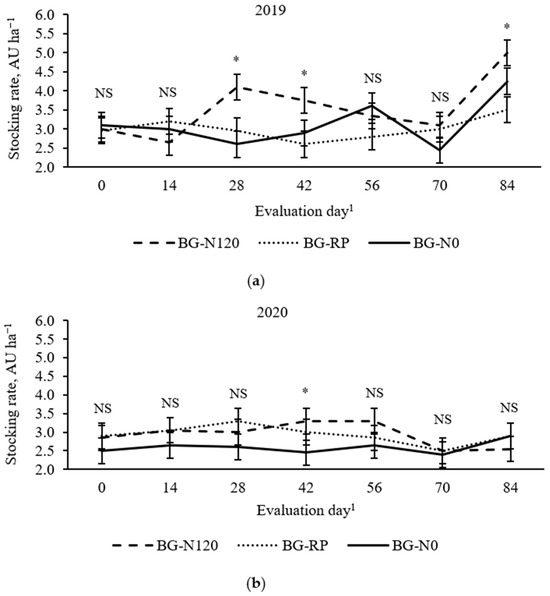
Figure 3.
Year × pasture × evaluation day effect (p = 0.03, SEM = 0.34) on stocking rate of bahiagrass pastures that were fertilized (BG-N120), unfertilized (BG-N0), or mixed with rhizoma peanut (BG-RP) and continuously stocked by horses in (a) 2019 and (b) 2020. * Pasture means differ (p < 0.05) within evaluation day. 1 In 2019, days 0, 14, 28, 42, 56, 70, and 84 refer to 11 July, 25 July, 8 August, 22 August, 5 September, 19 September, and 3 October, respectively. In 2020, days 0, 14, 28, 42, 56, 70, and 84 refer to 16 July, 30 July, 13 August, 27 August, 10 September, 24 September, and 8 October, respectively. NS = non-significant.
3.1.2. Herbage Accumulation Rate and Mass
Herbage accumulation rate was affected by a year × treatment × evaluation day effect (Figure 4; p = 0.04, SEM = 14). In 2019, BG-N120 had greater HA than BG-RP and BG-N0 on day 28 but was similar to BG-RP and greater than BG-N0 on day 70. There was no difference for HA among pastures across time in 2020. In 2019, BG-N120 had an early peak on day 28 (75 kg DM ha−1 d−1) and a late peak on day 70 (99 kg DM ha−1 d−1), while BG-RP and BG-N0 peaked on day 56 (100 and 98 kg DM ha−1 d−1, respectively). In 2020, BG-N120 peaked earlier than BG-RP and BG-N0 (133 kg DM ha−1 d−1 for BG-N120 on day 28 vs. 100 kg DM ha−1 d−1 for BG-RP and 93 kg DM ha−1 d−1 for BG-N120 on day 42).
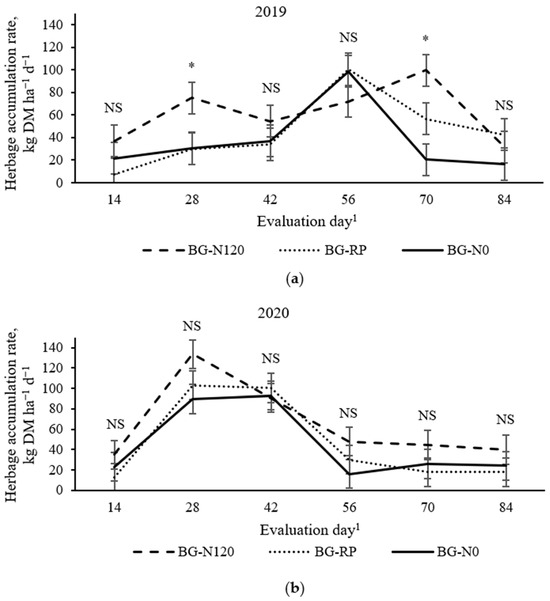
Figure 4.
Year × pasture × evaluation day effect (p = 0.04, SEM = 14) on herbage accumulation rate of bahiagrass pastures that were fertilized (BG-N120), unfertilized (BG-N0), or mixed with rhizoma peanut (BG-RP) and continuously stocked by horses in (a) 2019 and (b) 2020. * Pasture means differ (p < 0.05) within evaluation day. 1 In 2019, days 0, 14, 28, 42, 56, 70, and 84 refer to 11 July, 25 July, 8 August, 22 August, 5 September, 19 September, and 3 October, respectively. In 2020, days 0, 14, 28, 42, 56, 70, and 84 refer to 16 July, 30 July, 13 August, 27 August, 10 September, 24 September, and 8 October, respectively. NS = non-significant.
There was a year × treatment × evaluation day effect (p = 0.01, SEM = 150) on HM (Figure 5). Fertilized bahiagrass had greater HM than BG-N0 and BG-RP on day 28 in 2019, while no differences were observed among pastures on other days. No difference among pastures was observed in 2020. Overall greatest (p < 0.01, SEM = 42) HM occurred later in the grazing season (day 56 through day 84; 2800 kg DM ha−1) in 2019 and from early to mid-season (day 28 through day 42; 3500 kg DM ha−1) in 2020. The herbage mass averaged 2320 kg DM ha−1 in 2019 and was less (p < 0.01, SEM = 118) than the average of 2620 kg DM ha−1 in 2020. The mean HM for the two years was greatest (p = 0.01; SEM = 120) for BG-N120 (2660 kg DM ha−1) and BG-RP (2480 kg DM ha−1) and least for BG-N0 (2280 kg DM ha−1).
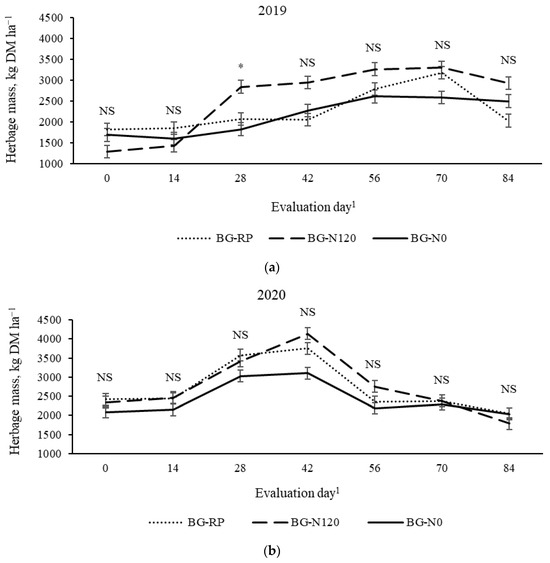
Figure 5.
Year × pasture × evaluation day effect (p = 0.01, SEM = 150) on herbage mass of bahiagrass pastures that were fertilized (BG-N120), unfertilized (BG-N0), or mixed with rhizoma peanut (BG-RP) and continuously stocked by horses in (a) 2019 and (b) 2020. * Pasture means differ (p < 0.05) within evaluation day. 1 In 2019, days 0, 14, 28, 42, 56, 70, and 84 refer to 11 July, 25 July, 8 August, 22 August, 5 September, 19 September, and 3 October, respectively. In 2020, days 0, 14, 28, 42, 56, 70, and 84 refer to 16 July, 30 July, 13 August, 27 August, 10 September, 24 September, and 8 October, respectively. NS = non-significant.
3.1.3. Botanical Composition
The percentage of bahiagrass was affected by pasture (p = 0.01, SEM = 3.5) and year (p = 0.01, SEM = 3.35). Fertilized bahiagrass had the greatest, and BG-RP had the least percentage of bahiagrass in BC, with BG-N0 being intermediate between them. Bahiagrass percent was greater in 2020 than in 2019 (75.4 vs. 62.2 ± 3.35%). There was a pasture × evaluation day effect (p = 0.01, SEM = 5.67) on the percentage of weed in the BC (Figure 6). Unfertilized bahiagrass had a greater weed percentage than BG-RP and BG-N120 on days 70 and 84. There was a weed percent increase from the early to the late season in BG-N0 while BG-RP and BG-N120 remained constant through the grazing season. The percentage of RP in BG-RP was not affected by time (p = 0.24, SEM = 7.0), averaged 29% of the botanical composition, and remained consistent in both years (Figure 7).
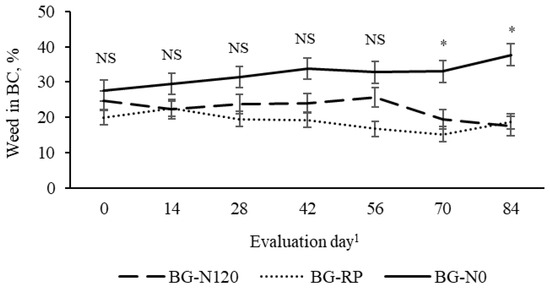
Figure 6.
Pasture × evaluation day effect (p = 0.01, SEM = 5.67) on percent of weed in the botanical composition of bahiagrass pastures that were fertilized (BG-N120), unfertilized (BG-N0), or mixed with rhizoma peanut (BG-RP) and continuously stocked by horses. * Pasture means differ (p < 0.05) within evaluation day. 1 In 2019, days 0, 14, 28, 42, 56, 70, and 84 refer to 11 July, 25 July, 8 August, 22 August, 5 September, 19 September, and 3 October, respectively. In 2020, days 0, 14, 28, 42, 56, 70, and 84 refer to 16 July, 30 July, 13 August, 27 August, 10 September, 24 September, and 8 October, respectively. NS = non-significant.
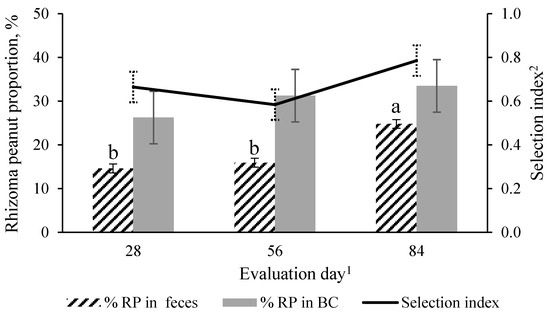
Figure 7.
Evaluation day effect (p = 0.03, SEM = 1.3) on the percent of rhizoma peanut (RP) in the feces of horses, percent of RP in herbage botanical composition (BC) (p = 0.24; SEM = 7.0), and selection index (p = 0.30; SEM = 0.2) of mature horses continuously stocked in bahiagrass pasture mixed with rhizoma peanut. a,b Means without a common letter differ (p < 0.05) across evaluation day. 1 In 2019, days 28, 56, and 84 refer to 8 August, 5 September, and 3 October, respectively. In 2020, days 0, 14, 28, 42, 56, 70, and 84 refer to 13 August, 10 September, and 8 October, respectively. 2 Selection index: percent of rhizoma peanut in the diet divided by percent of rhizoma peanut in pasture botanical composition.
3.1.4. Nutrient Composition
A year × pasture × evaluation day effect (p = 0.01, SEM = 0.045) was observed on equine DE (Figure 8). In 2019, BG-N120 resulted in equine DE greater than BG-N0, with BG-RP not differing from the other pastures on day 42, while, in 2020, BG-N120 had greater DE than BG-RP and BG-N0 on day 70. All other evaluation days showed similar equine DE across pastures. There was a year × pasture × evaluation day effect (p = 0.01, SEM = 8.2) on CP concentration (Figure 9). In 2019, differences in CP were only observed on day 0, with BG-N120 and BG-RP having greater CP than BG-N0 when concentrations were 155 g CP kg DM−1 for BG-N120 and BG-RP and 102 g CP kg DM−1 for BG-N0. No differences were observed among pastures from day 14 until late season in 2019. Except for days 14 and 84, the CP was similar among pastures in 2020, averaging 118 g CP kg DM−1. On day 14, BG-N120 resulted in greater CP than BG-N0, with BG-RP not differing from BG-N120 and BG-N0. On day 84, BG-RP had greater CP than BG-N0, with BG-N120 not differing from the other pastures. The CP concentrations in BG-N0 were not superior to any other pastures on any evaluation days in both years.
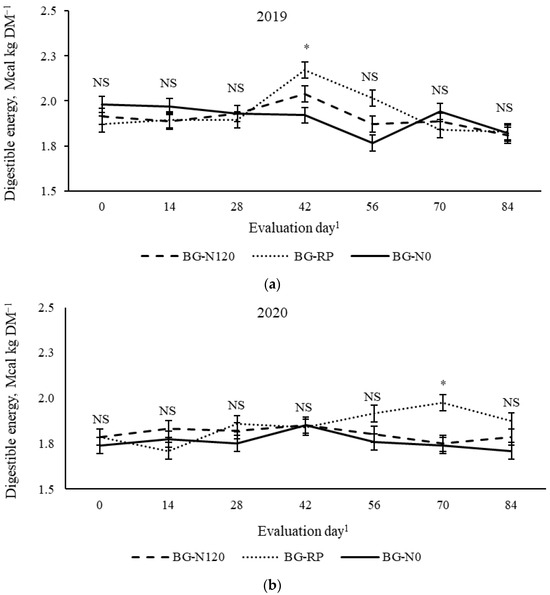
Figure 8.
Year × pasture × evaluation day interaction (p = 0.01, SEM = 0.045) on digestible energy of bahiagrass pastures that were fertilized (BG-N120), unfertilized (BG-N0), or mixed with rhizoma peanut (BG-RP) and continuously stocked by horses in (a) 2019 and (b) 2020. * Pasture means differ (p < 0.05) within evaluation day. 1 In 2019, days 0, 14, 28, 42, 56, 70, and 84 refer to 11 July, 25 July, 8 August, 22 August, 5 September, 19 September, and 3 October, respectively. In 2020, days 0, 14, 28, 42, 56, 70, and 84 refer to 16 July, 30 July, 13 August, 27 August, 10 September, 24 September, and 8 October, respectively. NS = non-significant.
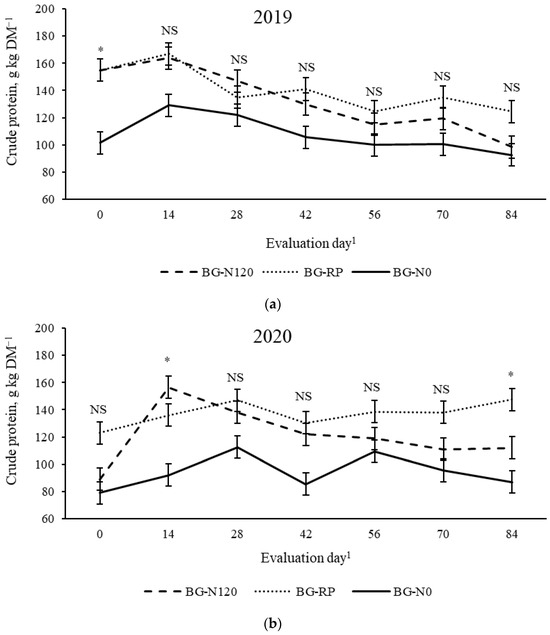
Figure 9.
Year × pasture × evaluation day interaction (p = 0.01, SEM = 8.2) on crude protein of bahiagrass pastures that were fertilized (BG-N120), unfertilized (BG-N0), or mixed with rhizoma peanut (BG-RP) and continuously stocked by horses in (a) 2019 and (b) 2020. * Pasture means differ (p < 0.05) within evaluation day. 1 In 2019, days 0, 14, 28, 42, 56, 70, and 84 refer to 11 July, 25 July, 8 August, 22 August, 5 September, 19 September, and 3 October, respectively. In 2020, days 0, 14, 28, 42, 56, 70, and 84 refer to 16 July, 30 July, 13 August, 27 August, 10 September, 24 September, and 8 October, respectively. NS = non-significant.
There was a pasture × evaluation day effect (p = 0.04, SEM =10.6) on NDF concentration (Figure 10). Early in the season (days 0 and 14), BG-RP had lesser NDF than BG-N0, with BG-N120 not differing from the other pastures. No difference among pastures was observed on days 28 and 42, averaging 684 and 700 g NDF kg DM−1, respectively. In the late season (days 56 and 84), NDF was consistently greater in the monoculture bahiagrass pastures than in the BG-RP. The NDF concentrations were also affected by year × evaluation day (Figure 11; p = 0.01, SEM = 17.5). In 2019, NDF decreased from day 0 (705 g NDF kg DM−1) to 14 (664 g NDF kg DM−1) and remained lower until the end of the grazing season. In 2020, NDF decreased from day 0 (737 g NDF kg DM−1) to 28 (687 g NDF kg DM−1) and remained constant after that. There was also a year × pasture × evaluation day effect (p = 0.03, SEM = 9.4) on ADF concentration (Figure 12). No difference was observed for ADF among pastures across time in 2019, and ADF averaged 403 g ADF kg DM−1. On days 56 and 84 in 2020, BG-N0 had greater ADF (439 and 465 g ADF kg DM−1, respectively) than BG-RP (387 and 407 g ADF kg DM−1, respectively), with BG-N120 (415 and 420 g ADF kg DM−1, respectively) similar to the other pastures.
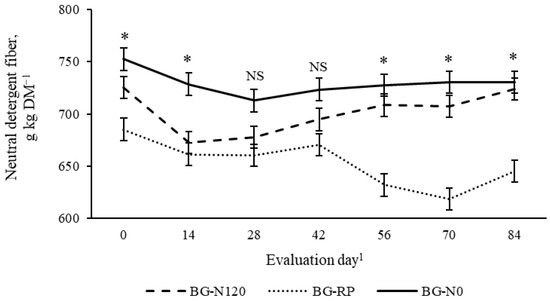
Figure 10.
Pasture × evaluation day interaction (p = 0.04, SEM = 10.6) on neutral detergent fiber (NDF) of bahiagrass pastures that were fertilized (BG-N120), unfertilized (BG-N0), or mixed with rhizoma peanut (BG-RP) and continuously stocked by horses. * Pasture means differ (p < 0.05) within evaluation day. 1 In 2019, days 0, 14, 28, 42, 56, 70, and 84 refer to 11 July, 25 July, 8 August, 22 August, 5 September, 19 September, and 3 October, respectively. In 2020, days 0, 14, 28, 42, 56, 70, and 84 refer to 16 July, 30 July, 13 August, 27 August, 10 September, 24 September, and 8 October, respectively. NS = non-significant.
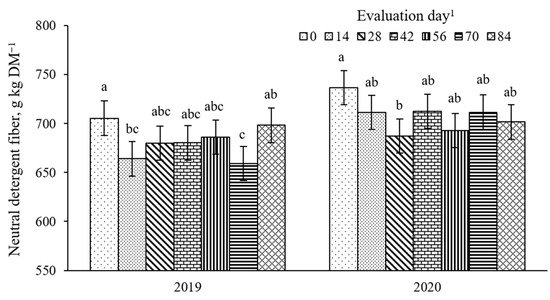
Figure 11.
Year × evaluation day interaction (p = 0.01, SEM = 17.5) on neutral detergent fiber (NDF) of bahiagrass pastures continuously stocked by horses. a,b,c Means without a common letter differ (p < 0.05) across time within year. 1 In 2019, days 0, 14, 28, 42, 56, 70, and 84 refer to 11 July, 25 July, 8 August, 22 August, 5 September, 19 September, and 3 October, respectively. In 2020, days 0, 14, 28, 42, 56, 70, and 84 refer to 16 July, 30 July, 13 August, 27 August, 10 September, 24 September, and 8 October, respectively.
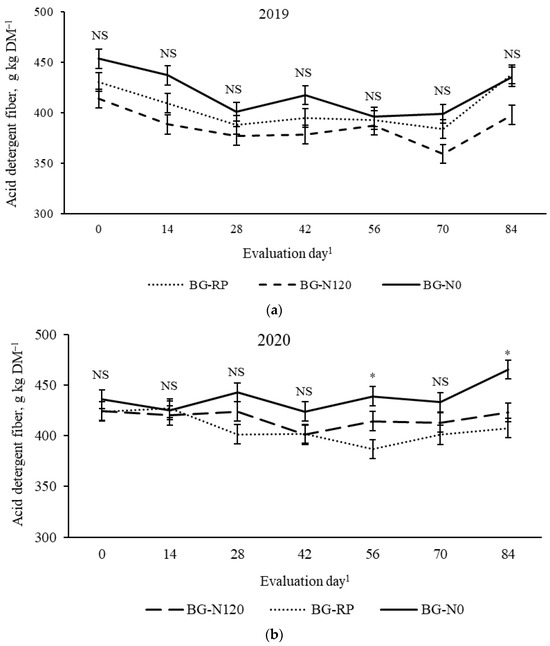
Figure 12.
Year × pasture × evaluation day interaction (p = 0.03, SEM = 9.4) on acid detergent fiber (ADF) of bahiagrass pastures that were fertilized (BG-N120), unfertilized (BG-N0), or mixed with rhizoma peanut (BG-RP) and continuously stocked by horses in (a) 2019 and (b) 2020. * Pasture means differ (p < 0.05) within evaluation day. 1 In 2019, days 0, 14, 28, 42, 56, 70, and 84 refer to 11 July, 25 July, 8 August, 22 August, 5 September, 19 September, and 3 October, respectively. In 2020, days 0, 14, 28, 42, 56, 70, and 84 refer to 16 July, 30 July, 13 August, 27 August, 10 September, 24 September, and 8 October, respectively. NS = non-significant.
There was a year × evaluation day effect (p = 0.01, SEM = 2.8) on NSC concentrations (Figure 13), with NSC consistently greater from the mid- to late-season in 2019 and lesser in the early- than in mid-season in 2020. Concentrations of NSC were also affected (p = 0.03, SEM = 3.4) by a pasture × evaluation day (Figure 14). Although NSC was similar among pastures in the early- and mid-season (from day 0 to 46), BG-RP was consistently greater in NSC than bahiagrass monoculture regardless of the fertilization level on days 56, 70, and 84 (57 vs. 45 g NSC kg DM−1, 75 vs. 62 g NSC kg DM−1, and 60 vs. 47 g NSC kg DM−1, respectively).
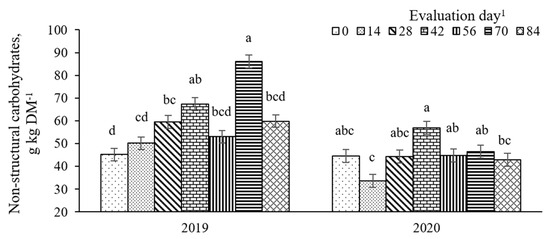
Figure 13.
Year × evaluation day interaction (p = 0.01, SEM = 2.8) on non-structural carbohydrates (NSC) of bahiagrass pastures continuously stocked by horses. a,b,c,d Means without a common letter differ (p < 0.05) across time within year. 1 In 2019, days 0, 14, 28, 42, 56, 70, and 84 refer to 11 July, 25 July, 8 August, 22 August, 5 September, 19 September, and 3 October, respectively. In 2020, days 0, 14, 28, 42, 56, 70, and 84 refer to 16 July, 30 July, 13 August, 27 August, 10 September, 24 September, and 8 October, respectively.
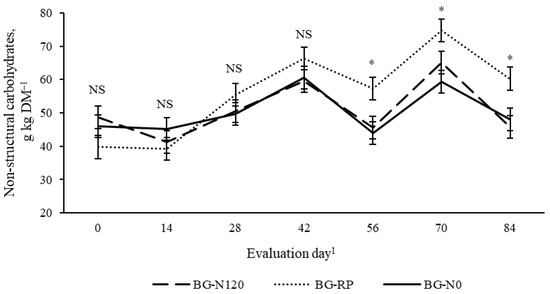
Figure 14.
Pasture × evaluation day interaction (p = 0.03, SEM = 0.34) on non-structural carbohydrates (NSC) of bahiagrass pastures that were fertilized (BG-N120), unfertilized (BG-N0), or mixed with rhizoma peanut (BG-RP) and continuously stocked by horses. * Pasture means differ (p < 0.05) within evaluation day. 1 In 2019, days 0, 14, 28, 42, 56, 70, and 84 refer to 11 July, 25 July, 8 August, 22 August, 5 September, 19 September, and 3 October, respectively. In 2020, days 0, 14, 28, 42, 56, 70, and 84 refer to 16 July, 30 July, 13 August, 27 August, 10 September, 24 September, and 8 October, respectively. NS = non-significant.
3.2. Animal Responses
3.2.1. Dry Matter and Nutrient Intake and Digestibility
The effects of pasture, evaluation day, and their interaction on intake and digestibility of dry matter and nutrients are shown in Table 2. There was a pasture effect (p = 0.03, SEM = 1.46) on the daily fecal output. Horses grazing BG-N0 had fecal output greater than those grazing BG-RP, while the fecal output of horses grazing BG-N120 was similar to those grazing BG-N0 and BG-RP. Incorporating rhizoma peanut into bahiagrass with less N fertilizer resulted in lesser DMI as %BW (p = 0.04, SEM = 0.5) and kg DM d−1 (p = 0.03, SEM = 3.34) than BG-N0 but similar to BG-N120. Similar responses among the three pastures were observed for intakes of OM (p = 0.03, SEM = 2.84), DE (p = 0.02, SEM = 6.97), NDF (p = 0.01, SEM = 2.08), and ADF (p = 0.01, SEM = 1.15). Intakes of CP and NSC were similar among horses grazing the three different pastures (p = 0.10, SEM = 0.31 and p = 0.44, SEM = 0.33, respectively). Evaluation day affected intake of DM %BW (p = 0.05, SEM = 0.63), OM (p = 0.02, SEM = 2.86), DE (p = 0.02, SEM = 6.99), NDF (p = 0.03, SEM = 2.10), ADF (p = 0.02, SEM = 1.17), and NSC (p = 0.02, SEM = 0.337). For all nutrients affected by time, intake was least in the early season and greatest in mid-season, with intake in the late season not differing from early- or mid-season.
Table 2.
Intake and digestibility of dry matter and nutrients of bahiagrass pastures that were fertilized with N, unfertilized, or intercropped with rhizoma peanut and continuously stocked by horses.
Unexpectedly, fertilizing monoculture bahiagrass or intercropping with rhizoma peanut at a lower fertilizer rate did not change (p > 0.05) digestibility of DM, OM, NDF, ADF, and NSC (Table 2). There was a pasture × evaluation day effect (p = 0.04, SEM = 32.5) on CP digestibility (Figure 15). Intercropping RP resulted in greater CP digestibility in the late season. Digestibility of CP for BG-N0 was the least on days 28 and 56 but similar to BG-N120 on day 84. There was an effect of evaluation day on digestibility of DM (p = 0.01, SEM = 9.4), OM (p = 0.01, SEM = 9.7), NDF (p = 0.01, SEM = 9.5), and NSC (p = 0.01, SEM = 10.1) (Table 2). For all nutrients affected by time, digestibility was least in the late season and similar between early- and mid-season.

Figure 15.
Pasture × evaluation day interaction (p = 0.03, SEM = 32.5) on crude protein (CP) digestibility of bahiagrass pastures that were fertilized with N (BG-N120), unfertilized (BG-N0), or mixed with rhizoma peanut (BG-RP) and continuously stocked by horses. * Pasture means differ (p < 0.05) within evaluation day. 1 In 2019, days 28, 56, and 84 refer to 8 August, 5 September, and 3 October, respectively. In 2020, days 28, 56, and 84 refer to 13 August, 10 September, and 8 October, respectively. NS = non-significant.
3.2.2. Proportion of Rhizoma Peanut in the Feces
The estimated proportion of RP in the feces was affected by evaluation day (Figure 7; p = 0.03, SEM = 4.52). The proportion of RP was similar between days 28 (14.6%) and 56 (15.9%) and greatest on day 84 (24.9%). There was no difference in the selection index across time (p = 0.25), which averaged 0.68. The selection index under 1.0 suggests horses had a preference for BG over RP throughout the grazing season (Figure 7).
3.2.3. Body Measurements
The effect of pasture, evaluation day, and their interaction on horses’ body measurements are shown in Table 3. Body weight (538 ± 18 kg; mean ± SEM) and body condition score (5.9 ± 0.2) did not differ among pastures and evaluation days (p > 0.05). The body fat percent was also not affected by pasture or interaction between pasture and evaluation day (p > 0.05). The evaluation day, however, affected (p = 0.03; SEM = 2.21) the body fat percent. The body fat percent decreased from 15.5% fat on day 0 to 14.7% fat on day 42, remaining constant until the end of the grazing season at day 84 (14.5% fat).
Table 3.
Mean body weight, body condition score (BCS), and percent body fat of horses continuously stocked in bahiagrass pastures that were fertilized with N, unfertilized, or intercropped with rhizoma peanut.
4. Discussion
4.1. Herbage Responses
The greater SR in BG-N120 pastures compared with BG-N0 in both years and of BG-RP compared with BG-N0 in 2020 indicate non-fertilized bahiagrass pastures require greater pasture area to maintain mature horses in the warm season compared to fertilizing or intercropping bahiagrass with RP. The difference in SR between both monoculture bahiagrass pastures may be explained by the reduced HM and HA of BG-N0 compared with BG-N120, while horses’ body weights did not differ. A similar SR between BG-N0 and BG-RP in 2020 was expected, as no difference in HM or HA was observed between the two pastures. Similar results were observed in a study evaluating the same forages grazed by beef cattle [7], with fertilized bahiagrass pastures resulting in a greater stocking rate during the warm season. When converted to area per animal needed (ha horse−1), the values reported in this study (BG-N120= 0.39, BG-RP= 0.41, and BG-N0= 0.43) are similar to the minimum recommended (0.4 to 0.8 ha horse−1) when managing horse pastures [28,29].
The increased HM for BG-N120 on day 28 compared to BG-RP and BG-N0 in 2019 might have resulted from the increased HA observed on the same evaluation day for BG-N120 compared to BG-RP and BG-N0. Increased HA for BG-N120 observed on day 28 may have been a result of the increased rainfall in July associated with the high rate of N fertilizer. Rainfall plays an important role in plant growth and hence HA, with increased rainfall promoting forage growth [4,30]. The similar HA between BG-N120 and BG-RP and the lowest HA of BG-N0 on day 70 may have resulted primarily from the N fertilizer application on BG-N120 and BG-RP and no N application on BG-N0 as the rainfall was significantly lower in September in the first year. The lack of difference across pastures for HA and HM in 2020 may have resulted due to more consistent weather conditions throughout the grazing season.
Reduced HA of bahiagrass intercropped with RP when compared to fertilized bahiagrass has also been reported in the literature (24 vs. 60 kg DM ha−1 d−1; [7]). The average HA reported in this study for BG-N120 (63 kg DM ha−1 d−1) corroborates with the study evaluating similar treatments in cattle grazing system in Florida [7], while the average for BG-RP (46 kg DM ha−1 d−1) was nearly twice that reported by the same study with cattle. That may be explained by differences in rainfall, solar radiation, and cultivars of rhizoma peanut used. A study conducted at the same research site of the current study in 2012 and 2013 evaluating different cultivars of RP reported that ‘Florigraze’ resulted in approximately 40% higher sward canopy height than ‘Ecoturf’ [31]. Because all treatments were under the same weather conditions, it is likely that differences in the sward canopy height may have resulted in differences in HA between both studies as, while the cattle study used ‘Ecoturf’ RP, the current study used ‘Florigraze’ RP.
Except on day 28 in 2019, the lack of difference in HM among pastures across time found in this study concurs with data of bahiagrass pastures continuously stocked by cattle reported by a study conducted in Florida [7]. The HM reported by that study was 700 kg DM ha−1 in each pasture system with a target herbage allowance of 1 kg DM−1 kg BW−1. The greater average HM (2470 kg DM ha−1) observed in this study resulted from the increased herbage allowance (1.9 kg DM−1 kg BW−1) and increased HA. In studies evaluating cool-season grass–legume pastures, the incorporation of legumes resulted in greater HM compared to grass monoculture [32,33]. High temperatures and rainfall during the warm season in tropical and subtropical regions induce faster growth of warm-season grasses [34,35] compared with cool-season grasses or legumes, potentially resulting in similar HM between monoculture and mixed pastures.
The stable proportion of RP in the BG-RP pasture is consistent with its ability to persist in the grass mixture reported in the literature [10,36]. The %RP found in this study (29%) is similar to that reported in the literature evaluating grazing systems consisting of bahiagrass pastures intercropped with RP (32%; [7]) but smaller than in BG-RP mixtures in small plot studies (35 to 81%; [13,31]). The increase in weed percent in the late season of BG-N0 compared with BG-N120 may be attributed to the feeding behavior of horses. As spot grazers, horses graze forage at the ground level in specific areas, constantly revisiting those grazed areas [37], which may have caused bare soil areas where weeds took advantage to spread in the BG-N0 pastures.
The decreased weed percent in the late-season of BG-N120 compared to BG-N0 is consistent with data reported in the literature [38,39], showing that N application improves the competitiveness of the desired forage and suppresses weed growth [37,38]. The similar weed proportion between BG-N120 and BG-RP, with both being lower than BG-N0, combined with similar HM across time in both years, reinforces that the incorporation of RP into bahiagrass pastures may be used as a strategy to maintain HM in warm-season pastures and help suppress weeds in comparison to bahiagrass monocultures with no N fertilizer applied [40,41]. In a study conducted on equine grazing systems using cool-season grass–legume mixed forages [33], a greater weed mass was observed in grass monoculture pastures fertilized with nitrogen 100 kg N ha−1 compared to those mixed with legumes and no N applied. The difference between cool- and warm-season grass pastures in response to the application of N fertilizers may be attributed to the difference in weed proportion between the two studies when comparing grass monoculture pastures vs. grass–legume mixed pasture. The fast growth of warm-season grass when fertilized with high rates of N may have contributed with the bahiagrass herbage taking over spots that could provide growth areas for weeds.
Including RP into bahiagrass did not affect forage equine DE. Similar results were observed when reporting organic matter digestibility as an energy predictor of BG-RP mixed pastures grazed by cattle in Florida [7]. The effect of N fertilization on equine DE of forages has not been previously reported in the literature. The levels of DE found in this study (~1.86 Mcal kg DM−1) were slightly lesser than the values reported (~2.00 Mcal kg DM−1) for warm-season pastures continuously stocked by horses [42] but within the range reported for warm-season forages for horses [43]. Nonetheless, when evaluating the total equine DE intake in the current study, all pastures exceeded the daily needs for horses at maintenance. The overall concentration of NSC in this study (52 ± 1.1 g NSC kg DM−1) was slightly greater than the value reported for warm-season perennial grass hays (~49 g NSC kg DM−1) in Virginia [44]. However, NSC in the current study was lesser than the 79–84 g NSC kg DM−1 reported for cool-season pastures grazed by horses in Minnesota [42]. In cool-season grasses, the simple sugars are stored as fructans, and they are synthesized in a process that is not self-limiting. The sum of simple sugars, starch, and fructans comprises the NSC [45,46]. For that reason, NSC are higher in cool-season grasses compared to warm-season grasses, and legumes are usually lower (approximately 110 g NSC kg DM−1) than grasses [45]. The non-structural carbohydrates concentration in horse pastures is of interest due to the increased risk of development of metabolic disorders when these carbohydrates are consumed in excess. Nonetheless, the values found in the current study are below the maximum recommended (100 to 120 g NSC kg DM−1) for horses to avoid metabolic disorders such as insulin resistance and laminitis [47,48].
Nitrogen application and incorporation of legumes are reported to increase the nutritive value of forages [9,33,49,50]. Greater CP and lesser NDF for mixtures than monoculture grasses in cool-season grass–legume mixed pastures grazed by horses has been reported in the literature [33]. In beef cattle grazing systems, the inclusion of RP with bahiagrass resulted in a greater CP and in vitro organic matter digestibility than the bahiagrass monoculture with and without N fertilization [50]. Therefore, improved nutrient composition in BG-RP and BG-N120 than in BG-N0 pastures was expected. Although CP was similar across pastures in most of the evaluation days, BG-N0 had lesser crude protein at any of the evaluation days, where differences were significant. Furthermore, greater NDF concentrations observed for BG-N0 in most of the evaluation days compared to the other two pastures suggests that the pasture’s nutritive value was improved when N was applied or rhizoma peanut was incorporated into bahiagrass pastures.
When provided pasture access, as spot grazers that constantly revisit grazed areas, horses almost exclusively select areas of forage regrowth compared to reproductive stems [37]. Therefore, the lack of difference among pastures for most of the nutrients measured across time may indicate that the method used for forage collection may also have affected the results of nutrient composition, as forage samples were collected based on the type of forage and sward structure selected by the horses during the previous five days before sample collection.
4.2. Animal Responses
The estimated pasture DMI reported in this study is substantially greater than the voluntary DMI of 2 to 2.5%BW typically required for horses fed all-forage diets [43]. Nonetheless, the range of 3.2 to 5.3%BW found here concurs with the estimated range of 3.2 to 5.0%BW for horses grazing cool-season grass–legume mixed pastures [51]. Similar results (3.7 to 4.9%BW) were reported for pony mares grazing grass–legume mixed pastures [52]. Overall, horses grazing BG-N0 required 41% more DMI than BG-RP to maintain the body parameters measured in this study. This suggests that horses in the BG-N0 had a lesser grazing efficiency than the other two pasture treatments, which is reinforced by the lower stocking rate compared to the other two treatments.
Horses are less likely to be affected by the physical limitation effect on intake as ruminants [53,54]. Therefore, they strategically increase their intake level to extract the nutrients necessary to meet their nutritional requirements when consuming low-nutritive-value forages, facilitated by the relatively faster rate of passage than ruminants [53,54,55]. Thus, the increased intake for horses grazing BG-N0 may result from the BG-N0 frequently presenting greater NDF. Considering the DMI of horses consuming non-fertilized pastures combined with the pasture’s greater NDF across most of the evaluation days, the similar DE and CP among pastures in most of the evaluation days could be the result of the method used for forage collection, which may have hindered detection of the pasture nutrient composition. Nonetheless, the authors recognize that methodological limitations during the marker feeding could have played a role in the high DMI for horses grazing BG-N0.
Methodological limitations for the estimation of daily fecal excretion with the external marker (TiO2) may have overestimated fecal output and hence daily dry matter intake. For this study, a 10 g daily dose was considered for the estimation of fecal output. Horses were administered two 2.5 g TiO2 boluses in the morning and two in the afternoon. The 2.5 g dose needed to be compacted to fit in the hay device, making it easy for the horses to expel a portion of the compacted marker once the hay device was chewed and swallowed. Horses’ heads were elevated until complete consumption. However, some horses tended to shake their heads during marker dosing, which may have resulted in the loss of a portion of the marker when horses lowered their heads. This could cause overestimation of the administered dose, overestimating fecal excretion and hence intake. If a similar method is used for administration of the marker in future studies, researchers need to make sure horses do not drop portion of the marker before swallowing. As a potential alternative, the marker can be provided with an increased amount of carrier made of hay or concentrate to dilute the marker, make it less noticeable by the horses, and hence assure complete ingestion of the marker. However, the use of concentrate as a marker carrier needs to be implemented with caution in grazing studies aiming to evaluate forage quality, as one of the key assumptions is the lack of additional sources of energy and protein.
Based on the amount of NSC and DM consumed, the diet selected by the horses had 37, 34, and 48% more NSC than the 51, 56, and 50 g NSC kg DM−1 in pasture nutrient composition of BG-N120, BG-RP, and BG-N0, respectively. Nonetheless, NSC concentrations were below the 10 to 12% threshold established for horses with metabolic dysfunction [47,48]. Horses in BG-N0 pastures were repeatedly observed pawing the soil and sorting for BG rhizomes, probably because of the rhizome’s commonly observed high concentration of non-structural carbohydrates [56]. The observed grazing pattern of horses in BG-N0 may have negatively affected the competitiveness of BG and resulted in a greater weed proportion than the fertilized bahiagrass monoculture.
Similar DMD among pastures was not expected in the current study. It is commonly reported in the literature that when fed to horses as hay, legumes have greater DMD than warm-season grasses [57,58,59,60]. However, the similar pasture nutrient composition associated with the spot-grazing behavior of the horses may have facilitated the similar digestibility of the nutrients. Nevertheless, the DMD reported in this study agrees with the 42 to 59 g kg−1 estimated with n-alkane in horses fed fresh forage [61,62]. The reduced digestibility of DM, OM, NDF, and NSC observed later in the season for all pastures was expected. With advancing maturity, leaf-to-stem ratio decreases and concentrations of the fiber components increase, eventually negatively affecting the digestibility of nutrients [63]. The drop in the digestibility of DM and nutrients with maturity found in this study concurs with data reported in the literature with horses fed all-forage diets [60,64].
The proportion of C3 plants in the feces measured by the δ13C is highly correlated to the proportion of C3 plants in the diet [65,66,67]. The increase in the proportion of RP in the feces over time (14.6 to 24.9%) observed in this study suggests that horses may have avoided RP early in the grazing season as a new component in their diet. That is a consequence of forage preference in horses being influenced by whether the horse had prior exposure to a novel food [68]. Therefore, a longer grazing period could have shown a more prominent proportion of RP in the diet. In a study evaluating similar pasture treatments in Florida reported that RP composed 44% of the diet of cattle continuously stocked in BG-RP pastures with a selection index of 1.38 (vs. 0.68 observed in this study) [7]. In that study, RP was strip-planted with BG, compared with the RP being intercropped into bahiagrass pastures in the current study, which could have facilitated the increased intake of RP by the animals grazing RP in strip grazing.
Similar body measurements across pasture over time were potentially maintained by the increase in dry matter intake of horses grazing BG-N0 which may have compensated for the reduction in nutritive value later in the grazing season. Regardless of the management practice implemented, bahiagrass pastures were able to maintain body condition of the horses throughout the grazing season from July to October in both years as suggested by the lack of effect of evaluation day on body condition score and weight. To the authors knowledge, no study reported the effect of continuously stocked pastures on horses’ body measurements when no supplemental feed was provided. Nonetheless, overall body condition score is within the ideal range for horses of 5 to 6 [26]. Combined with similar nutrient composition and HM, these findings confirm that all pastures provided adequate nutrition to maintain the horses’ health throughout the grazing season as suggested by constant body weight and condition score over time. Horses grazing BG-N0, however, had to consume more dry matter to be able to maintain similar body measurements and hence health condition. The decrease of 1% in body fat over time (15.5% to 14.5%) may be explained by differences in horse diet before and during the grazing season. Prior to study initiation, all horses were maintained on bahiagrass pastures and provided supplemental feed, including hay and concentrate, daily. Decreased body fat percentage has been reported when horses are provided with forage-only diets compared with high-concentrate diet and pasture access, while increasing the level of concentrate feed increases the body fat percentage [69]. Therefore, the change in diet from supplementing with concentrate to forage only may have played a role in reducing body fat during the grazing season. Nonetheless, at the end of the experiment, body fat percentage was within the ideal range for healthy (not underconditioned or overconditioned) horses [70].
5. Conclusions
The results of this study support our hypothesis that incorporating rhizoma peanut into warm-season pastures grazed by horses would offset N fertilizer in subtropical pastures for horses while maintaining forage production and horses’ body condition and resulting in similar stocking rates as bahiagrass monoculture with high N fertilizer rates. The incorporation of rhizoma peanut into warm-season pastures can maintain digestibility of protein longer than bahiagrass monocultures with or without N fertilization. Although the rhizoma peanut did not seem to be preferred over bahiagrass as indicated by the selection index of 0.68, a longer grazing season could have resulted in greater percentage of rhizoma peanut in the diet of horses, as they became more accustomed to this novel forage. Non-fertilized bahiagrass pastures, on the other hand, require a greater pasture area to maintain horses’ body condition, compared with fertilizing or intercropping bahiagrass pastures with rhizoma peanut, and result in an increased weed percentage in the botanical composition at the end of the grazing season. Overall, incorporating rhizoma peanut into warm-season pastures can provide more sustainable management practices into horse operations with decreased off-farm N inputs.
Author Contributions
Conceptualization, A.C.C.d.M.V., J.C.B.D.J., L.E.S., L.K.W. and C.L.W.; methodology, A.C.C.d.M.V., E.R.d.S.S., J.C.B.D.J., L.E.S., L.K.W. and C.L.W.; validation, A.C.C.d.M.V., J.C.B.D.J. and C.L.W.; formal analysis, A.C.C.d.M.V. and E.R.d.S.S.; investigation, A.C.C.d.M.V., H.L.S.V.N., J.M.L., L.K.W. and C.L.W.; resources, E.R.d.S.S., J.C.B.D.J., L.E.S., M.O.W., L.K.W. and C.L.W.; data curation, A.C.C.d.M.V. and H.L.S.V.N.; writing—original draft preparation, A.C.C.d.M.V.; writing—review and editing, A.C.C.d.M.V., E.R.d.S.S., J.C.B.D.J., L.E.S., M.O.W., H.L.S.V.N., J.M.L., L.K.W. and C.L.W.; visualization, A.C.C.d.M.V.; supervision, J.C.B.D.J., L.E.S., M.O.W., L.K.W. and C.L.W.; project administration, J.M.L. and C.L.W.; funding acquisition, A.C.C.d.M.V., J.C.B.D.J. and C.L.W. All authors have read and agreed to the published version of the manuscript.
Funding
This research was funded by the Office of Agricultural Water Policy of the Florida Department of Agriculture and Consumer Services, grant number 26177.
Institutional Review Board Statement
The animal study protocol was approved by the Institutional Animal Care and Use Committee of the University of Florida (IACUC #201710092; 18 January 2018).
Informed Consent Statement
Not applicable.
Data Availability Statement
The original contributions presented in the study are included in the article, further inquiries can be directed to the corresponding authors.
Acknowledgments
The authors would like to thank the graduate and undergraduate research assistants and interns at the University of Florida that assisted with sample collection. Additionally, we thank the Office of Agricultural Water Policy of the Florida Department of Agriculture and Consumer Services for financially supporting this study.
Conflicts of Interest
The authors declare no conflicts of interest.
References
- Feige, K.; Furst, A.; Eser, M.W. Effects of housing, feeding, and use on equine health with emphasis on respiratory and gastrointestinal disease. Schweiz. Arch. Tierheilkd 2002, 144, 348–355. [Google Scholar] [CrossRef]
- Berndt, A.; Derksen, F.J.; Robinson, N.E. Endotoxin concentrations within the breathing zone of horses are higher in stables than on pasture. Vet. J. 2010, 183, 54–57. [Google Scholar] [CrossRef] [PubMed]
- O’Neill, H.V.M.; Keen, J.; Dumbell, L. A comparison of the occurrence of common dental abnormalities in stabled and free-grazing horses. Animal 2010, 4, 1697–1701. [Google Scholar] [CrossRef] [PubMed]
- Viana, M.C.M.; Freire, F.M.; Ferreira, J.J.; Macêdo, A.R.; Cantarutti, R.B.; Mascarenhas, M.H.T. Adubação nitrogenada na produção e composição do capim braquiária sob pastejo rotacionado. Rev. Bras. Zoo. 2011, 40, 1497–1503. [Google Scholar] [CrossRef]
- Vendramini, J.M.B.; Silveira, M.L.A.; Dubeux, J.C.B., Jr.; Sollenberger, L.E. Environmental impacts and nutrient recycling on pastures grazed by cattle. Rev. Bras. Zoo. 2007, 36, 139–149. [Google Scholar] [CrossRef]
- Sollenberger, L.E.; Jones, C.S.; Prine, G.M. Animal performance on dwarf elephant grass and rhizoma peanut pastures. In Proceedings of the XVI International Grassland Congress, Nice, France, 6 September 1989. [Google Scholar]
- Jaramillo, D.M.; Dubeux, J.C.; Sollenberger, L.E.; Vendramini, J.; Mackowiak, C.; DiLorenzo, N.; Garcia, L.; Dantas Queiroz, L.M.; Santos, E.R.D.S.; Homem, B.G.C.; et al. Water footprint, herbage, and livestock responses for nitrogen-fertilized grass and grass-legume grazing systems. Crop Sci. 2021, 61, 3844–3858. [Google Scholar] [CrossRef]
- Dubeux, J.C., Jr.; Blount, A.R.; Mackowiak, C.; Santos, E.R.; Pereira Neto, J.D.; Riveros, U.; Garcia, L.; Jaramillo, D.M.; Ruiz-Moreno, M. Biological N2 fixation, belowground responses, and forage potential of rhizoma peanut cultivars. Crop Sci. 2017, 57, 1027–1038. [Google Scholar] [CrossRef]
- Muir, J.P.; Pitman, W.D.; Foster, J.L. Sustainable, low-input warm-season pasture grass-legume mixes: Mission (nearly) impossible? Grass Forage Sci. 2011, 66, 301–452. [Google Scholar] [CrossRef]
- Castillo, M.S.; Sollenberger, L.E.; Blount, A.R.; Ferrell, J.A.; Williams, M.J.; Mackowiak, C.L. Strip planting a legume into warm-season grass pasture: Defoliation effects during the year of establishment. Crop Sci. 2013, 53, 724–731. [Google Scholar] [CrossRef]
- Mullenix, M.K.; Sollenberger, L.E.; Blount, A.R.; Vendramini, J.; Silveira, M.L.; Castillo, M.S. Growth habit of rhizoma peanut affects establishment and spread when strip planted in bahiagrass pastures. Crop Sci. 2014, 54, 2886–2892. [Google Scholar] [CrossRef]
- Vasco, A.C.C.M.; Dubeux, J.C.B.; Wallau, M.O.; Wickens, C.L.; Warren, L.K. Characterization of Forage Utilization and Pasture Management Practices on Florida Horse Operations. J. Equine Vet. Sci. 2020, 95, 103253. [Google Scholar] [CrossRef] [PubMed]
- Santos, E.R.; Dubeux, J.C., Jr.; Sollenberger, L.E.; Blount, A.R.; Mackowiak, C.; DiLorenzo, N.; Jaramillo, D.M.; Garcia, L.; Pereira, T.P.; Ruiz-Moreno, M. Herbage responses and biological N2 fixation of bahiagrass and rhizoma peanut monocultures compared with their binary mixtures. Crop Sci. 2018, 58, 2149–2163. [Google Scholar] [CrossRef]
- Federation of Animal Science Societies (FASS). Guide for the Care and Use of Agricultural Animals in Research and Teaching, 3rd ed.; Federation of Animal Science Societies: Champaign, IL, USA, 2010. [Google Scholar]
- USDA Soil Survey Staff. Web Soil Survey; USDA Natural Resource Conservation Service: Washington, DC, USA, 2019.
- Sollenberger, L.E.; Moore, J.E.; Allen, V.G.; Pedreira, C.G. Reporting forage allowance in grazing experiments. Crop Sci. 2005, 45, 896–900. [Google Scholar] [CrossRef]
- Haydock, K.P.; Shaw, N.H. The comparative yield method for estimating dry matter yield of pasture. Aust. J. Exp. Agric. 1975, 15, 663–670. [Google Scholar] [CrossRef]
- Vendramini, J.M.B.; Sollenberger, L.E.; Lamb, G.C.; Foster, J.L.; Liu, K.; Maddox, M.K. Forage accumulation, nutritive value, and persistence of ‘Mulato II’ brachiariagrass in Northern Florida. Crop Sci. 2012, 52, 914–922. [Google Scholar] [CrossRef]
- Ortega-S, J.A.; Sollenberger, L.E.; Quesenberry, K.H.; Cornell, J.A.; Jones, C.S., Jr. Productivity and persistence of rhizoma peanut pastures under different grazing managements. Agron. J. 1992, 84, 799–804. [Google Scholar] [CrossRef]
- McEvoy, M.; Delaby, L.; Murphy, J.; Boland, T.; O’Donovan, M. Effect of herbage mass and allowance on sward characteristics, milk production, intake and rumen volatile fatty acid concentration. Grass Forage Sci. 2010, 65, 335–347. [Google Scholar] [CrossRef]
- Titgemeyer, E.C.; Armendariz, C.K.; Bindel, D.J.; Greenwood, R.H.; Löest, C.A. Evaluation of titanium dioxide as a digestibility marker for cattle. J. Anim. Sci. 2001, 79, 1059–1063. [Google Scholar] [CrossRef]
- Winsco, K.N.; Coverdale, J.A.; Wickersham, T.A.; Lucia, J.L.; Hammer, C.J. Influence of maternal plane of nutrition on mares and their foals: Determination of mare performance and voluntary dry matter intake during late pregnancy using a dual-marker system. J. Anim. Sci. 2013, 91, 4208–4215. [Google Scholar] [CrossRef][Green Version]
- Garcia, L.; Dubeux, J.C., Jr.; Sollenberger, L.E.; Vendramini, J.M.; DiLorenzo, N.; Santos, E.R.; Jaramillo, D.M.; Ruiz-Moreno, M. Nutrient excretion from cattle grazing n-fertilized grass or grass-legume pastures. Agron. J. 2021, 113, 3110–3123. [Google Scholar] [CrossRef]
- Krizsan, S.J.; Huhtanen, P. Effect of diet composition and incubation time on feed indigestible neutral detergent fiber concentration in dairy cows. J. Dairy Sci. 2013, 96, 1715–1726. [Google Scholar] [CrossRef] [PubMed]
- Jones, R.J.; Ludlow, M.M.; Troughton, J.H.; Blunt, C.G. Estimation of the proportion of C3 and C4 plant species in the diet of animals from the ratio of natural 12C and 13C isotopes in the faeces. J. Agric. Sci. 1979, 92, 91–100. [Google Scholar] [CrossRef]
- Henneke, D.R.; Potter, G.D.; Kreider, J.L.; Yeates, B.F. Relationship between condition score, physical measurements and body fat percentage in mares. Equine Vet. J. 1983, 15, 371–372. [Google Scholar] [CrossRef]
- Westervelt, R.G.; Stouffer, J.R.; Hintz, H.F.; Schryver, H.F. Estimating fatness in horses and ponies. J. Anim. Sci. 1976, 43, 781–785. [Google Scholar] [CrossRef]
- Burk, A.O.; Fiorellino, N.M.; Shellem, T.A.; Dwyer, M.E.; Vough, L.R.; Dengler, E. Field Observations from the University of Maryland’s Equine Rotational Grazing Demonstration Site: A Two Year Perspective. J. Equine Vet. Sci. 2011, 31, 302–303. [Google Scholar] [CrossRef]
- Singer, J.W.; Bamka, W.J.; Kluchinski, D.; Govindasamy, R. Using the recommended stocking density to predict equine pasture management. J. Equine Vet. Sci. 2002, 22, 73–76. [Google Scholar] [CrossRef]
- Patton, B.D.; Dong, X.; Nyren, P.E.; Nyren, A. Effects of grazing intensity, precipitation, and temperature on forage production. Rangel. Ecol. Manag. 2007, 60, 656–665. [Google Scholar] [CrossRef]
- Mullenix, M.K.; Sollenberger, L.E.; Wallau, M.O.; Rowland, D.L.; Blount, A.R.; Vendramini, J.M.; Silveira, M.L. Sward structure, light interception, and rhizome-root responses of rhizoma peanut cultivars and germplasm to grazing management. Crop Sci. 2016, 56, 899–906. [Google Scholar] [CrossRef]
- Berdahl, J.D.; Karn, J.F.; Hendrickson, J.R. Dry matter yields of cool-season grass monocultures and grass–alfalfa binary mixtures. Agron. J. 2001, 93, 463–467. [Google Scholar] [CrossRef]
- DeBoer, M.L.; Grev, A.M.; Sheaffer, C.C.; Wells, M.S.; Martinson, K.L. Herbage mass, botanical composition, forage nutritive value, and preference of grass–legume pastures under horse grazing. Crop. Forage Turfgrass Manag. 2020, 6, e20032. [Google Scholar] [CrossRef]
- Edwards, E.J.; Osborne, C.P.; Stromberg, C.A.; Smith, S.A.; Bond, W.J.; Christin, P.A.; Cousins, A.B.; Duvall, M.R.; Fox, D.L.; Freckleton, R.P.; et al. The origins of C4 grasslands: Integrating evolutionary and ecosystem science. Science 2010, 328, 587–591. [Google Scholar] [CrossRef] [PubMed]
- Gowik, W.; Westhoff, P. The path from C3 to C4 photosynthesis. Plant Physiol. 2011, 155, 56–63. [Google Scholar] [CrossRef] [PubMed]
- Dunavin, L.S. Florigraze rhizoma peanut in association with warm-season perennial grasses. Agron. J. 1992, 84, 148–151. [Google Scholar] [CrossRef]
- Rook, A.J.; Dumont, B.; Isselstein, J.; Osoro, K.; Wallis DeVries, M.F.; Parente, G.; Mills, J. Matching type of livestock to desired biodiversity outcomes in pastures—A review. Biol. Conserv. 2004, 119, 137–150. [Google Scholar] [CrossRef]
- Di Tomaso, J.M. Approaches for improving crop competitiveness through the manipulation of fertilization strategies. Weed Sci. 1995, 43, 491–497. [Google Scholar] [CrossRef]
- Wang, L.; Liu, Q.; Dong, X.; Liu, Y.; Lu, J. Herbicide and nitrogen rate effects on weed suppression, N uptake, use efficiency and yield in winter oilseed rape (Brassica napus L.). Glob. Ecol. Conserv. 2019, 17, e00529. [Google Scholar] [CrossRef]
- Drenovsky, R.E.; James, J.J. Designing invasion-resistant plant communities. The role of plant functional traits. Rangelands 2010, 32, 32–37. [Google Scholar] [CrossRef]
- Sanderson, M.A.; Brink, G.; Stout, R.; Ruth, L. Grass–legume proportions in forage seed mixtures and effects on herbage yield and weed abundance. Agron. J. 2013, 105, 1289–1297. [Google Scholar] [CrossRef]
- DeBoer, M.L.; Hathaway, M.R.; Kuhle, K.J.; Weber, P.S.D.; Reiter, A.S.; Sheaffer, C.C.; Wells, M.S.; Martinson, K.L. Glucose and insulin response of horses grazing alfalfa, perennial cool-season grass, and teff across seasons. J. Vet. Equine Sci. 2018, 68, 33–38. [Google Scholar] [CrossRef]
- National Research Council (NRC). Nutrient Requirements of Horses, 6th revised ed.; National Academy Press: Washington, DC, USA, 2007. [Google Scholar]
- Ghajar, S.M.; McKenzie, H.; Fike, J.; McIntosh, B.; Tracy, B.F. Evaluating digestibility and toxicity of native warm-season grasses for equines. Transl. Anim. Sci. 2021, 5, txaa224. [Google Scholar] [CrossRef]
- Chatterton, N.J.; Harrison, P.A.; Bennett, J.H.; Asay, K.H. Carbohydrate partitioning in 185 accessions of Gramineae grown under warm and cool temperatures. J. Plant Physiol. 1989, 134, 169–179. [Google Scholar] [CrossRef]
- Zhao, D.; MacKown, C.T.; Starks, P.J.; Kindiger, B.K. Interspecies variation of forage nutritive value and nonstructural carbohydrates in perennial cool-season grasses. Agron. J. 2008, 100, 837–844. [Google Scholar] [CrossRef]
- Borgia, L.; Valberg, S.; Watts, K.; Pagan, J. Glycemic/insulemic response to feeding hay with different water-soluble carbohydrate content in healthy and Polysaccharide Storage Myopathy-affected horses. J. Equine Vet. Sci. 2009, 5, 355–357. [Google Scholar] [CrossRef]
- Frank, N. Equine metabolic syndrome. Vet. Clin. N. Am. Equine Pract. 2011, 27, 73–92. [Google Scholar] [CrossRef]
- Perry, L.; Baltensperger, D. Leaf and stem yields and forage quality of three n-fertilized warm-season grasses. Agron. J. 1979, 71, 355–358. [Google Scholar] [CrossRef]
- Kohmann, M.M.; de Oliveira Bauer, M.; Sollenberger, L.E.; Moreno, L.S.; da Silva, L.S.; Saraiva, S.; Dubeux, J.C., Jr. Legume proportion affects bahiagrass–rhizoma peanut mixture production and nutritive value and legume composition of cattle diets. Appl. Animal Sci. 2022, 38, 560–569. [Google Scholar] [CrossRef]
- Smith, D.G.; Mayes, R.W.; Hollands, T.; Cuddeford, D.; Yule, H.H.; Ladrero, C.M.; Gillen, E. Validating the alkane pair technique to estimate dry matter intake in equids. J. Agric. Sci. 2007, 145, 273–281. [Google Scholar] [CrossRef]
- Longland, A.C.; Ince, J.; Harris, P.A. Estimation of pasture intake by ponies from liveweight change during six weeks at pasture. J. Equine Vet. Sci. 2011, 5, 275–276. [Google Scholar] [CrossRef]
- Cymbaluk, N.F. Comparison of forage digestion by cattle and horses. Can. J. Anim. Sci. 1990, 70, 601–610. [Google Scholar] [CrossRef]
- Cuddeford, D. Factors affecting feed intake. In Equine Applied and Clinical Nutrition, 1st ed.; Geor, R.J., Harris, P.A., Coenen, M., Eds.; Saunders Elsevier: New York, NY, USA, 2013; pp. 64–79. [Google Scholar]
- Houpt, K.A. Mastication and Feeding in Horses. In Feeding in Domestic Vertebrates: From Structure to Behaviour, 1st ed.; Bells, V., Ed.; CABI: London, UK, 2006; pp. 195–209. [Google Scholar]
- Rice, R.W.; Sollenberger, L.E.; Quesenberry, K.H.; Prine, G.M.; French, E.C. Establishment of rhizoma perennial peanut with varied rhizome nitrogen and carbohydrate concentrations. Agron. J. 1996, 88, 61–66. [Google Scholar] [CrossRef]
- LaCasha, P.; Brady, H.; Allen, V.; Richardson, C.; Pond, K. Voluntary intake, digestibility, and subsequent selection of Matua bromegrass, coastal bermudagrass, and alfalfa hays by yearling horses. J. Anim. Sci. 1999, 77, 2766–2773. [Google Scholar] [CrossRef] [PubMed]
- Sturgeon, L.S.; Baker, L.A.; Pipkin, J.L.; Haliburton, J.C.; Chirase, N.K. The digestibility and mineral availability of matua, bermuda grass, and afalfa hay in mature horses. J. Equine Vet. Sci. 2000, 20, 45–48. [Google Scholar] [CrossRef]
- Eckert, J.V.; Myer, R.O.; Warren, L.K.; Brendemuhl, J.H. Digestibility and nutrient retention of perennial peanut and bermudagrass hays for mature horses. J. Anim. Sci. 2010, 88, 2055–2061. [Google Scholar] [CrossRef] [PubMed]
- Hansen, T.L.; Chizek, E.L.; Zugay, O.K.; Miller, J.M.; Bobel, J.M.; Chouinard, J.W.; Adkin, A.M.; Skurupey, L.A.; Warren, L.K. Digestibility and retention time of coastal bermudagrass (Cynodon dactylon) hay by horses. Animals 2019, 9, 1148. [Google Scholar] [CrossRef]
- Stevens, D.M.; Van Ryssen, J.B.J.; Marais, J.P. The use of n-alkane markers to estimate the intake and apparent digestibility of ryegrass and Kikuyu by horses. S. Afr. J. Anim. Sci. 2002, 32, 50–56. [Google Scholar] [CrossRef]
- Ferreira, L.M.M.; Garcia, U.; Rodrigues, M.A.M.; Celaya, R.; Dias-da-Silva, A.; Osoro, K. Estimation of feed intake and apparent digestibility of equines and cattle grazing on heathland vegetation communities using the n-alkane markers. Livest. Sci. 2007, 110, 46–56. [Google Scholar] [CrossRef]
- Burns, J.C.; Pond, K.R.; Fisher, D.S.; Luginbuhl, J.M. Changes in forage quality, ingestive mastication, and digesta kinetics resulting from switchgrass maturity. J. Anim. Sci. 1997, 75, 1368–1379. [Google Scholar] [CrossRef]
- Staniar, W.B.; Bussard, J.R.; Repard, N.M.; Hall, M.H.; Burk, A.O. Voluntary intake and digestibility of teff hay fed to horses. J. Anim. Sci. 2010, 88, 3296–3303. [Google Scholar] [CrossRef]
- Neto, J.D.P.; Junior, J.C.B.D.; de Carvalho, F.F.R.; dos Santos, M.V.F.; Ruiz-Moreno, M.; da Silva Santos, E.R. Tracing back sheep diet composition feeding grass-legume mixtures using fecal δ13C. Small Rumin. Res. 2019, 175, 7–14. [Google Scholar] [CrossRef]
- van Cleef, F.O.; Dubeux, J.C., Jr.; Naumann, H.D.; Santos, E.R.; Sollenberger, L.E.; Vendramini, J.M.; Ruiz-Moreno, M.; Ciriaco, F.M.; DiLorenzo, N. Methane emissions and δ13C composition from beef steers consuming increasing proportions of sericea lespedeza hay on bermudagrass hay diets. J. Anim. Sci. 2021, 99, skab224. [Google Scholar] [CrossRef]
- Jaramillo, D.M.; Ruiz-Moreno, M.; Vendramini, J.M.B.; Sollenberger, L.E.; DiLorenzo, N.; Queiroz, L.M.D.; Santos, E.R.S.; Garcia, L.; Abreu, D.S.; Dubeux, J.C.B., Jr. Methane emissions and 13C composition from beef steers consuming binary C3–C4 diets. J. Anim. Sci. 2023, 101, skad181. [Google Scholar] [CrossRef] [PubMed]
- Van Den Berg, M.; Giagos, V.; Lee, C.; Brown, W.Y.; Hinch, G.N. Acceptance of novel food by horses: The influence of food cues and nutrient composition. Appl. Anim. Behav. Sci. 2016, 183, 59–67. [Google Scholar] [CrossRef]
- Carter, R.A.; McCutcheon, L.J.; George, L.A.; Smith, T.L.; Frank, N.; Geor, R.J. Effects of diet-induced weight gain on insulin sensitivity and plasma hormone and lipid concentrations in horses. Am. J. Vet. Res. 2009, 70, 1250–1258. [Google Scholar] [CrossRef]
- Dugdale, A.H.A.; Grove-White, D.; Curtis, G.C.; Harris, P.A.; Argo, C.M. Body condition scoring as a predictor of body fat in horses and ponies. Vet. J. 2012, 194, 173–178. [Google Scholar] [CrossRef]
Disclaimer/Publisher’s Note: The statements, opinions and data contained in all publications are solely those of the individual author(s) and contributor(s) and not of MDPI and/or the editor(s). MDPI and/or the editor(s) disclaim responsibility for any injury to people or property resulting from any ideas, methods, instructions or products referred to in the content. |
© 2025 by the authors. Licensee MDPI, Basel, Switzerland. This article is an open access article distributed under the terms and conditions of the Creative Commons Attribution (CC BY) license (https://creativecommons.org/licenses/by/4.0/).