Article

Nutritional and Structural Components of Forage Sorghum Subjected to Nitrogen Fertilization and Molybdenum

by
Glícia Rafaela Freitas da Fonsêca
1,
Jamiles Carvalho Gonçalves de Souza Henrique
2,
Ednaete Bezerra de Alcântara
1,
Náthaly Vitória Santos Almeida
1,
Alexandre Campelo de Oliveira
1,
Maria Luana da Silva Medeiros
1,
Arthur Lucas Júlio Silva
1 and
Evaristo Jorge Oliveira de Souza
1,*
1
Academic Unit of Serra Talhada, Federal Rural University of Pernambuco, Serra Talhada 56909-535, PE, Brazil
2
Campus I Lot. Cidade Universitaria, Federal University of Paraiba, Areia 58051-900, PB, Brazil
*
Author to whom correspondence should be addressed.
Submission received: 3 November 2024 / Revised: 29 November 2024 / Accepted: 6 December 2024 / Published: 2 January 2025

Abstract

:
Semi-arid regions present edaphoclimatic limitations for forage production, primarily affecting plant growth and development. Crops adapted to such conditions, like forage sorghum, and nutritional supplementation with nitrogen and molybdenum, can increase forage production. The objective of this study was to evaluate the interaction between nitrogen and molybdenum on the bromatological and structural components of forage sorghum (SF-15) cultivated in a semi-arid environment, with the hypothesis that nitrogen fertilization combined with molybdenum would enhance nitrogen use efficiency in sorghum. The methodology involved a 5 × 2 factorial experiment in a randomized block design (RBD) with increasing doses of nitrogen (urea) (0, 50, 100, 150, 300 kg ha¹) and two doses of molybdenum (sodium molybdate): 0 and 160 g ha−1, conducted over three cultivation cycles. At the end of each cycle, morphological variables were evaluated, and yield of natural mass (YNM), yield of dry mass (YDM), crude protein production (CPP), and bromatological components were determined. Morphometric characteristics were influenced by the interaction between cycle x nitrogen doses (N) and molybdenum doses (Mo). For productive characteristics, there was an interaction between cycle and nitrogen doses, with the first regrowth cycle and the dosage of 100 kg ha−1 N showing the highest mean. Bromatological components were influenced by the N and Mo interaction. The study confirmed the synergistic effect between nitrogen and molybdenum. It is recommended to use 100 kg ha−1 nitrogen fertilization for an average production of 10 t ha−1 for SF-15 sorghum.

1. Introduction

Semi-arid regions exhibit edaphoclimatic characteristics that limit livestock production due to high temperatures and the significant variability of water availability. These conditions primarily affect plant growth and development [1,2]. When cultivated in unfavorable environments, plants may show a high stem/leaf ratio, a characteristic undesirable for animal production [3]. A high stem/leaf ratio negatively impacts forage digestibility and intake due to the increased amount of fibrous tissue in the stem and the reduced protein content in the leaves, which ultimately affects the quality of consumed forage and animal weight gain, thereby reducing overall livestock production [4]. Therefore, increasing the cultivation of forage plants adapted to the edaphoclimatic conditions of this region, along with appropriate management practices (e.g., irrigation, foliar fertilization, planting density, and others), enhances the quality of forage production and improves the efficient use of natural resources, helping to mitigate animal feed scarcity and increase forage availability [1,5].
Among the commonly used forage plants, forage sorghum stands out. This crop demonstrates tolerance to high air temperatures, regrowth capacity, low water demand, and saline water tolerance, as well as low soil fertility requirements, managing to maintain grain and dry matter production under adverse conditions [6,7]. In terms of nutritional components, sorghum plays an important role in the diet of ruminants, being considered an excellent source of fiber, with an average of 7.1% crude protein, and it has a high content of soluble carbohydrates [8,9,10]. Despite its adaptability to adverse conditions, positive responses to nitrogen fertilizers and irrigation with saline water are highlighted in the literature [11].
Nitrogen fertilization is of great importance, as nitrogen is a fundamental nutrient for plants, being a component of biomolecules of great significance (i.e., NADH, chlorophylls, nucleic acids, amino acids, and others) [12]. When nitrogen is available in the soil solution, it is absorbed by the roots, passing through the epidermal and cortical cells, which facilitate the uptake of nitrate (NO3) and ammonium (NH4+) into the plasma membrane and cytosol. In the cytosol, nitrates are reduced to nitrite by nitrate reductase, and nitrite is further reduced to ammonium (NH4+) by nitrite reductase. Ammonium is then incorporated into amino acids, forming glutamate and glutamine, which are important for chlorophyll synthesis, contributing to carbohydrate storage and improving forage quality [13]. Forage quality is a highly relevant characteristic in animal feed, as higher-quality forage meets the nutritional requirements of livestock [14]. The literature also indicates that nitrogen fertilization enriched with micronutrients such as molybdenum, zinc, manganese, boron, iron, and copper enhances the nutritional quality of feed by increasing protein content in the grains and reducing antinutritional factors through the action of hydrolytic enzymes that break down and solubilize tannins [14].
Molybdenum (Mo) plays a crucial role in plant metabolism, directly influencing biological nitrogen fixation and improving nitrate utilization, as it is part of the enzyme complex known as nitrogenase. Nitrogenase breaks the triple bond of nitrogen atoms, ultimately converting nitrite into ammonium, which is then available to the plant for synthesizing nitrogenous compounds, marking the initial step in integrating nitrogen into proteins [15,16]. Furthermore, studies have shown that Mo application can increase protein content in maize grains, as reported by [17], who observed a 3% increase in crude protein content in maize grains. However, further investigation is needed into the interaction between nitrogen and Mo, especially in sorghum cultivation under semi-arid conditions, as the existing literature on this topic is limited and the information is scarce.
Therefore, this study aimed to evaluate the interaction between nitrogen and molybdenum in the structural, productive, and bromatological components of forage sorghum SF-15 cultivated in a semi-arid environment, hypothesizing that nitrogen fertilization combined with molybdenum would enhance nitrogen utilization by the plant.

2. Materials and Methods

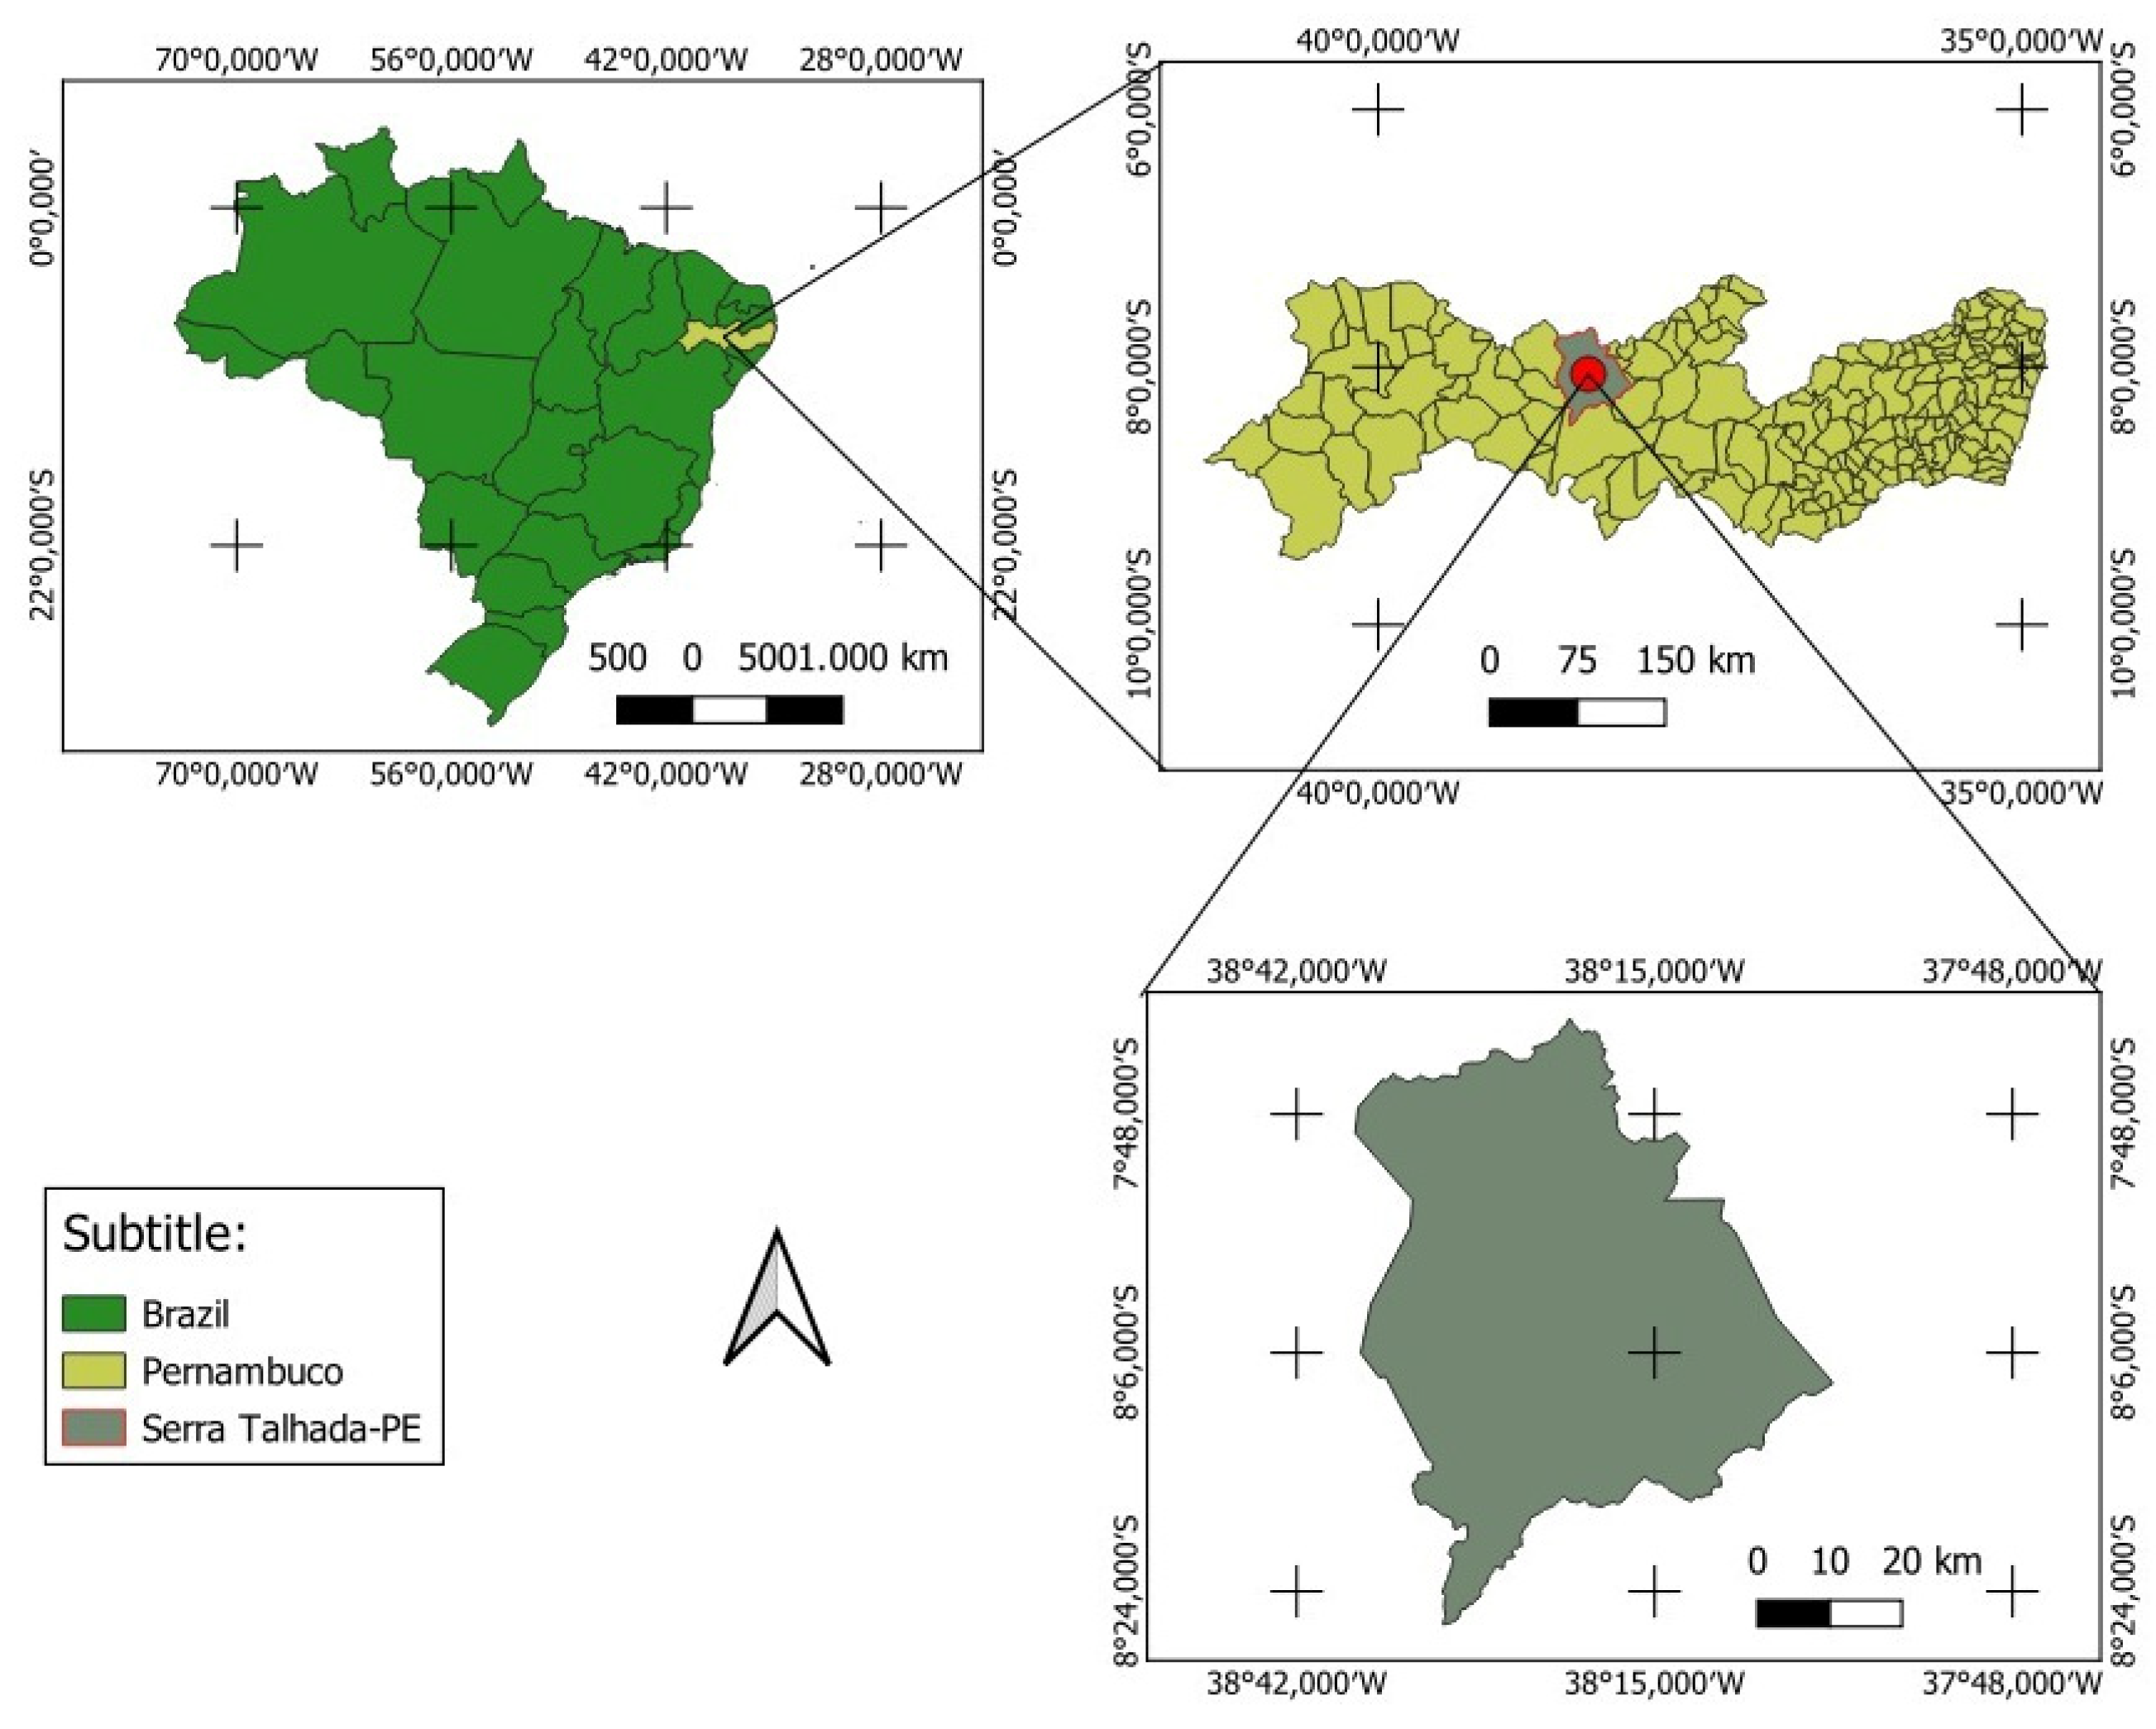
2.1. Study Area and Plant Material

The experiment was conducted at the Federal Rural University of Pernambuco, Academic Unit of Serra Talhada—UAST, located at the following coordinates: latitude 7°59′7″ S; longitude 38°17′34″ W, and an altitude of 499 m, in the municipality of Serra Talhada (Figure 1).
According to the Köppen classification, the local climate is categorized as BSwh’, Semi-arid, with rainfall during the summer and dry conditions during the winter [18]. The region has an average annual temperature of 25 °C, an average annual precipitation of 632 mm, relative humidity around 63%, and an atmospheric demand ranging between 1800 and 2000 mm year−1 [19].
The experiment was organized into four blocks, each containing ten plots. Each plot had an area of 10.5 m2, consisting of four plant rows, each 3.0 m long and containing 45 sorghum plants, resulting in a total of 180 plants per plot (Figure 2). Sorghum seeds (SF15) were sown in furrows approximately 0.05 cm deep, spaced 0.80 m between rows and 0.20 m between plants, with an average of fifteen plants per linear meter after thinning.
The experimental design adopted was a randomized block design (RBD), organized in a 5 × 2 factorial scheme with four replications, totaling 40 experimental units. The treatments consisted of five nitrogen rates (0, 50, 100, 150, and 300 kg ha−1), equivalent to 33 g, 66 g, 100 g, and 200 g (urea was used as the commercial source), applied to the soil, with one-third applied in the furrows during sowing and two-thirds applied 25 days after emergence. Additionally, two molybdenum rates were tested (using sodium molybdate as the commercial source) (0 and 160 g ha−1). The Mo rates were based on the study conducted by [20].

2.2. Climatic Conditions and Soil Classification

During the experiment, the meteorological conditions were monitored. Precipitation was concentrated between October 2022 and May 2023, totaling 746.6 mm. However, November (194 mm) and March (256.6 mm) alone accumulated 450.6 mm, representing more than 50% of the total precipitation during the experimental period. The average daily temperature was 25.97 °C, with maximum daily temperatures reaching up to 34 °C, particularly in September and October 2022, the most critical months for sorghum in terms of temperature and precipitation.
The soil in the area is classified as Cambissolo Háplico Ta Eutrophic Typical (Table 1), according to the Brazilian Soil Classification System—SBCS [21].

2.3. Experimental Conduction

The experiment was conducted over three cycles of cultivation, with an average duration of 99 days between cycles. The first cycle lasted from 15 July 2022 to 1 November 2022 (a total of 108 days), the second from 2 November 2022 to 30 January 2023 (90 days), and the third from 31 January 2023 to 9 May 2023 (99 days). The nitrogen source used was urea, which was applied and incorporated into the soil with one-third applied immediately after sowing and two-thirds applied 25 days after plant emergence for the first cycle. For the second and third cycles, one-third of the urea was applied 10 days after cutting, with two-thirds applied 30 days after cutting. At the end of the applications, an irrigation layer was provided to prevent losses due to volatilization. For the molybdenum source (sodium molybdate), 16 g was diluted in 20 L of water and applied via foliar spray using a 20-L backpack pressure sprayer, 40 days after the first nitrogen application in the first cycle, and for the second and third cycles, the application was made 40 days after cutting.

2.4. Irrigation

The water supply was provided through a drip irrigation system, with a watering schedule every two days and emitters spaced 0.20 m apart. The applied water depth was 50% of the crop’s water requirement, following recommendations based on the crop’s evapotranspiration while respecting the demand for each phenological phase. The application of 50% of the crop’s water requirement was based on research conducted by [11]. The water used was sourced from an artesian well, with the following characteristics: pH = 6.84, Na+ = 0.08 mg L−1, K+ = 0.01 mg L−1, Cl⁻ = 329.44 mg L−1, and electrical conductivity of 1.62 dS m−1.
For calculating the applied water depth, the mathematical model used was: ETc = ETo × Kc, where ETc represents the crop evapotranspiration (mm day−1), ETo is the reference evapotranspiration (mm day−1), and Kc is the crop coefficient. The reference evapotranspiration was obtained daily throughout the experiment period using the Penman-Monteith equation (Equation (1)) as parameterized in FAO Bulletin 56 [22], where:
E T o = 0.408 R n G + γ 900 t   +   273 u 2 e s e + γ ( 1 + 0.34 u 2 )
ETo—Reference evapotranspiration (mm d−1); Rn—Surface radiation balance (MJ m−2 d−1); G—Soil heat flux density (MJ m−2 d−1); T—Air temperature at 2 m height (°C); u2—Wind speed at 2 m height (m s−1); es—Saturation vapor pressure (kPa); ea—Partial vapor pressure (kPa); ∆—Slope of the saturation vapor pressure curve (kPa °C−1), e γ—Psychrometric coefficient (kPa °C−1).
Regarding the meteorological data, it was collected throughout the entire experimental period from the automatic weather station of the National Institute of Meteorology (INMET), which was located 300 m from the experimental area.

2.5. Biometric Analyses

At the end of each production cycle, five plants were selected from the useful rows of each plot, and the following variables were evaluated: plant height (PH, cm), defined as the vertical distance from the base of the plant to the insertion point of the panicle; length of the most developed leaf (LDL, cm), measured as the horizontal distance from the ligule to the tip of the leaf; width of the most developed leaf (WDL, cm), measured at the midpoint of the leaf length; average plant width (APW, cm), calculated as the sum of the two largest horizontal widths across the plant divided by two. All measurements were taken using a measuring tape. The stem thickness (ST, cm) was measured at a height of 10 cm above the ground using a universal caliper with a precision of 0.05 mm. Additionally, the number of live leaves (NLL, units) and the number of dead leaves (NDL, units) were recorded, with dead leaves defined as those having more than 50% of the leaf blade senescent.
Using the data from WDL and LDL, the leaf area of the most developed leaf (LA, cm2) was calculated using the equation proposed by [23] where:
LA3+ (cm2) = (0.74 × WDL3+ × LDL3+)

2.6. Yield

For forage accumulation, at the end of each production cycle, the number of plants in two linear meters within the two central rows was counted to obtain the final plant density. Subsequently, five plants from the useful plot were harvested and weighed to determine the natural mass (NM). The plants were then chopped using a forage machine to reduce particle size. After chopping, 500 mg per treatment was collected, placed in previously labeled craft paper bags, and transferred to a forced air circulation oven set at 55 °C, where they remained for 72 h until reaching constant weight. After this process, the bags were removed from the oven and left on the laboratory bench until they reached room temperature, after which they were weighed on a semi-analytical balance to obtain the dry mass value. The ratio of green mass to dry mass resulted in the dry matter content of the plant. To estimate the yield of natural mass (YNM kg ha−1), the total natural mass and final plant density were considered. To estimate the yield of dry mass (YDM kg ha−1), the dry matter content of the plant and the estimated values of the green mass of the plants were taken into account.

2.7. Bromatological Analyses

With the pre-dried samples, they were ground in a Willey knife mill and passed through sieves with a 1 mm diameter mesh, then placed in pre-labeled plastic bags for subsequent nutritional analysis of the sorghum. For dry matter (DM) analysis, the method (G-003/1) was used, where approximately 2 g of the pre-dried samples were placed in pre-labeled crucibles and taken to a forced air circulation oven at a temperature of 105 °C for 16 h to completely remove the moisture content from the sample. For mineral matter (MM), the method (M-001/2) was employed, where the samples dried at 105 °C were placed in a muffle furnace at a temperature of 550 °C for three hours to incinerate the material, resulting in the ash content. For crude protein (CP), the Kjeldahl method was used, which involved initially digesting the samples, followed by distillation, and finally titration. Neutral detergent fiber (NDF) was determined using the method (F-001/2), where the samples were placed in pre-labeled TNT bags (4 cm × 4.5 cm) and then placed in a fiber analyzer, to which a neutral detergent solution and the enzyme alpha-amylase were added. The samples were heated to a temperature of 105 °C for one hour, after which they were washed, weighed, and the NDF content was determined [24].

2.8. Statistical Analysis

The statistical model adopted was:
yijk = m + Ai + Bj + Ck + (AB)ij + (AC)ik +(BC)jk + (ABC)ijk + eijk
where: yijk = replication, m = overall mean, Ai = effect of nitrogen application on sorghum, Bj = effect of molybdenum application on sorghum, Ck = effect of cycle on sorghum, (AB)ij = effect of interaction between Ai and Bj, (AC)ik = effect of interaction between Ai e Ck, (BC) jk = effect of interaction between Bj e Ck, (ABC)ijk = effect of interaction among Ai, Bj, e Ck, e eklj = random error.
The data were subjected to normality and homoscedasticity tests. Meeting the assumptions, an analysis of variance (ANOVA) was conducted. For all variables, the F-test (p < 0.05) was performed, and when significant, regression analysis was carried out for the nitrogen treatments. The data were also subjected to principal component analysis (PCA). All data analyses and graphs were performed using R language through the RStudio interface version 4.3.0 and SigmaPlot 15.0, respectively.

3. Results

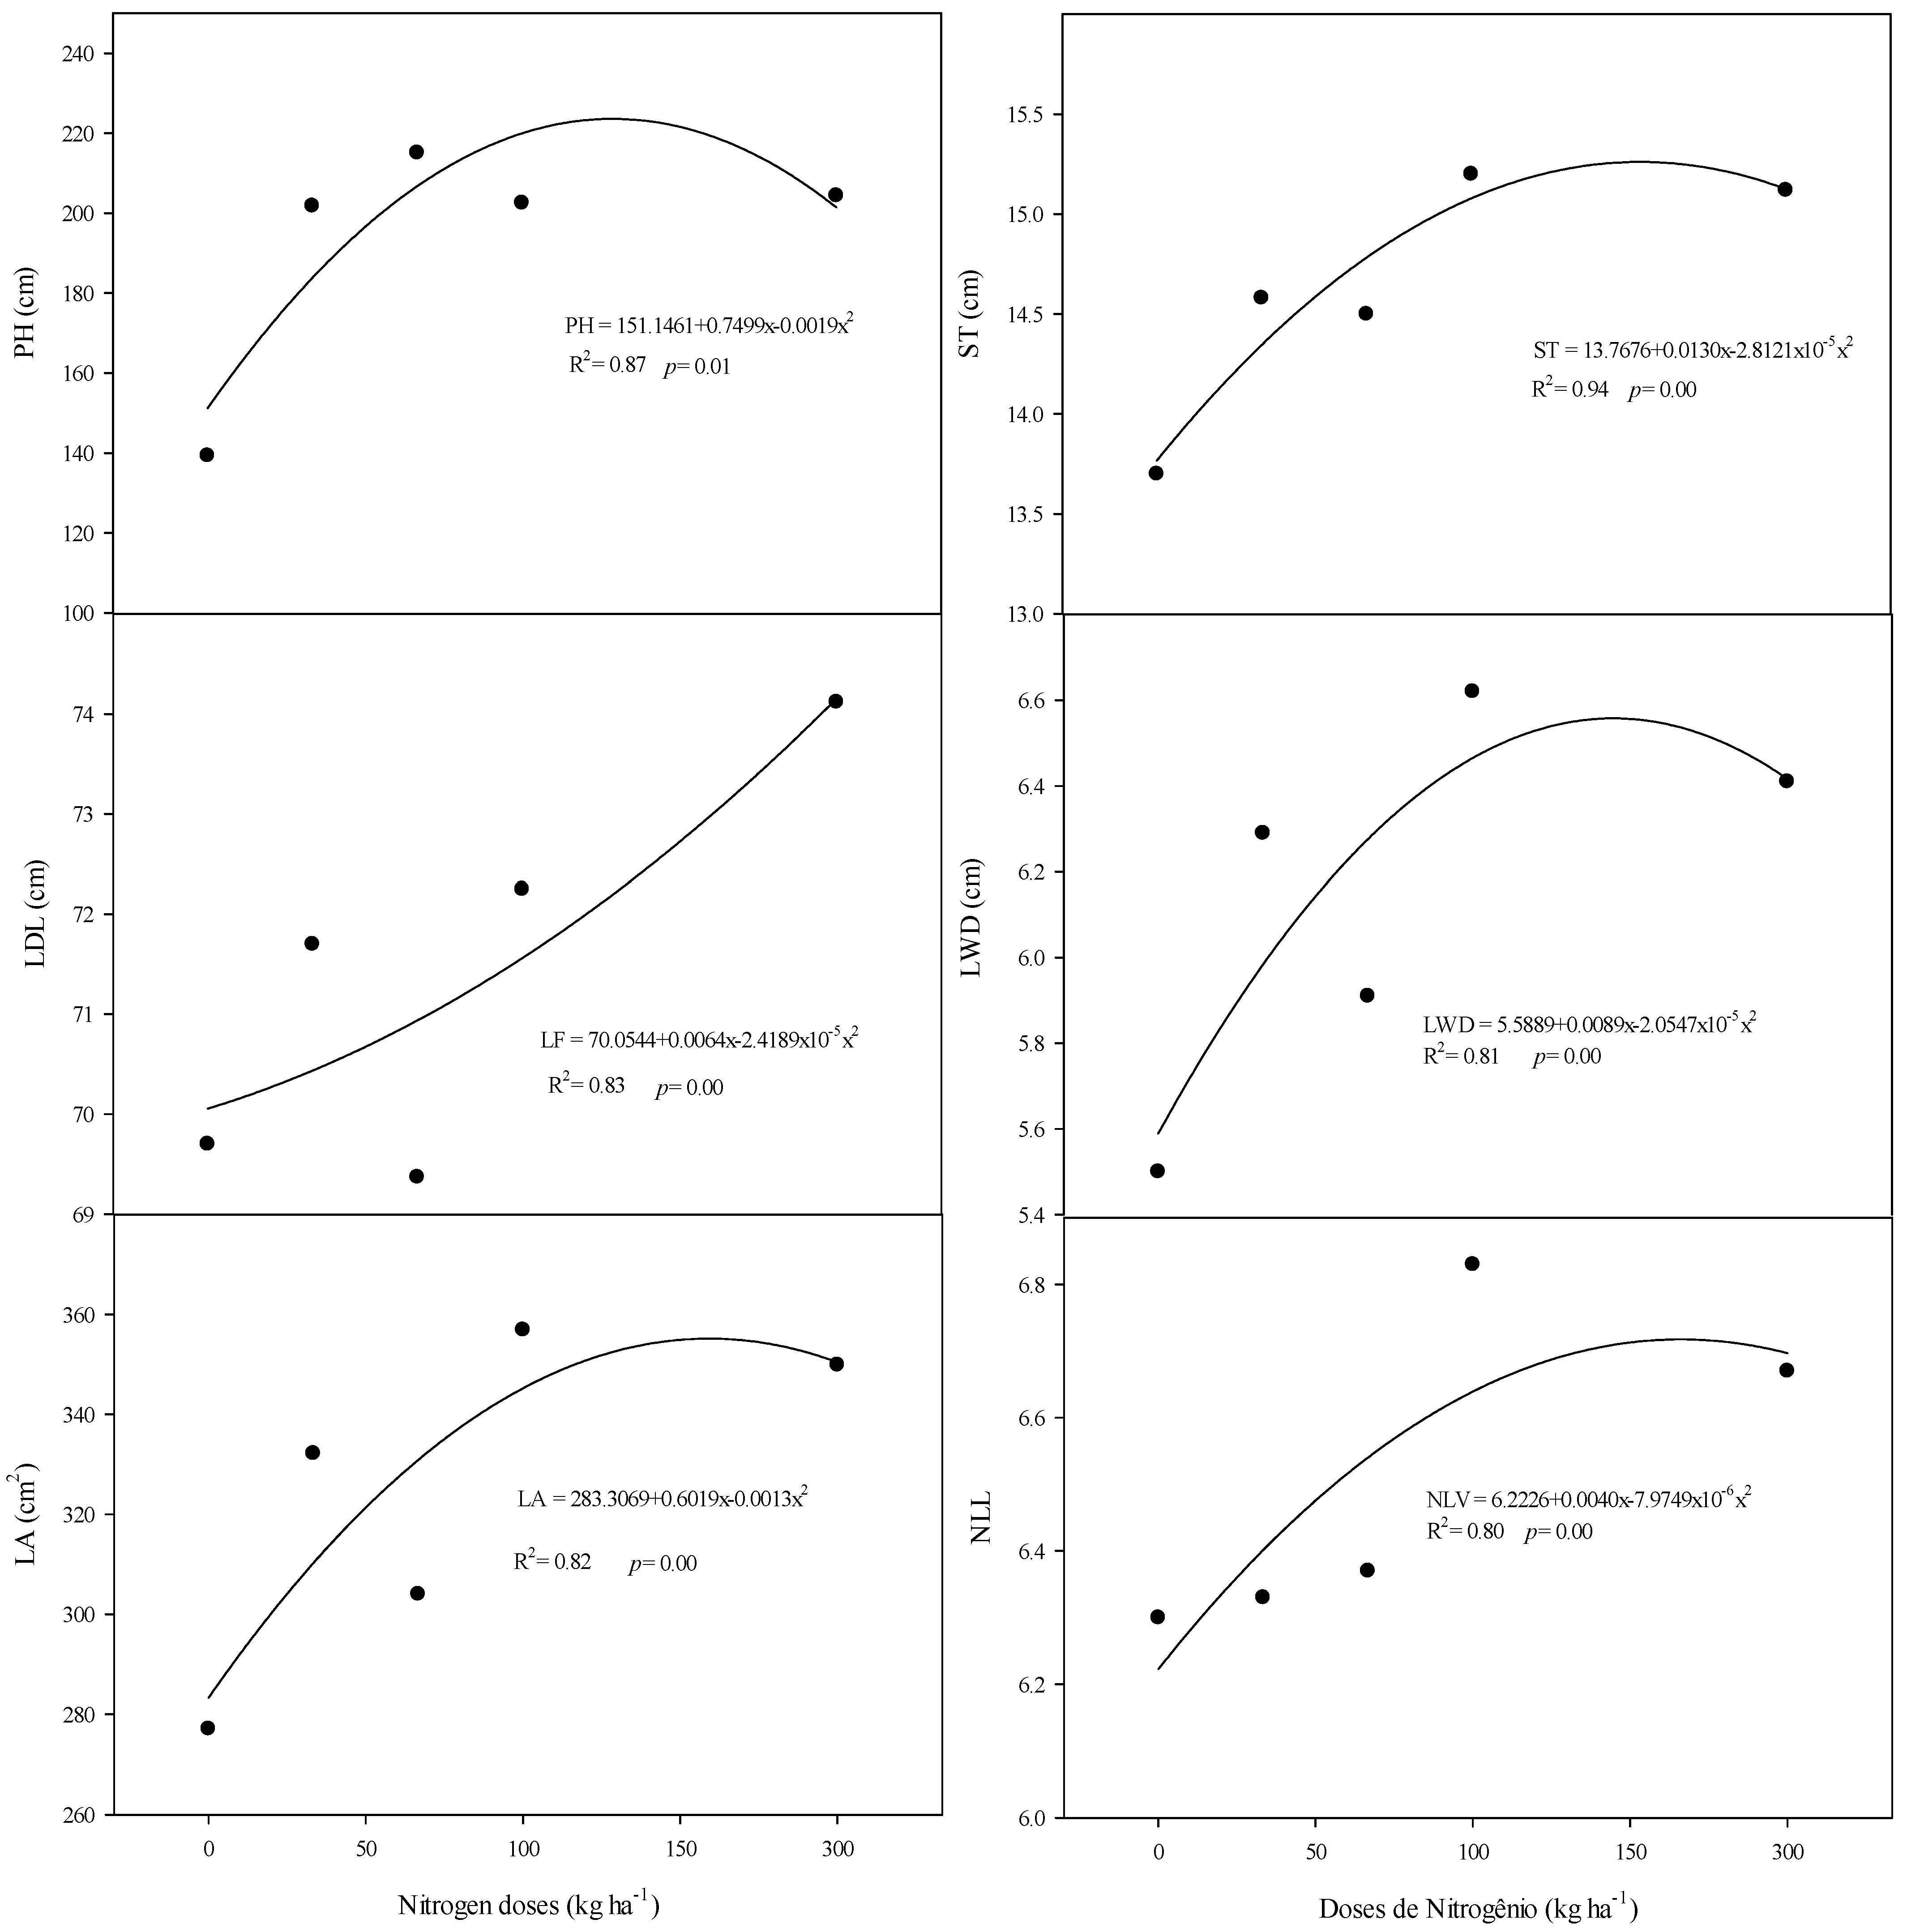
3.1. Morphometric Characteristics

The analysis of significant interactions considering the biometric variables—plant height (PH), average plant width (APW), stem thickness (ST), number of living leaves (NLL), number of dead leaves (NDL), length of the most developed leaf (LDL), width of the most developed leaf (WDL), and leaf area (LA)—takes into account the definitions provided and the complex interactions between cycle, nitrogen (N) doses, and molybdenum (Mo) doses.
Each interaction reveals how the development cycles and different nutrient doses affect the behavior of these variables. For isolated cycles, it was found that regrowth cycle 2 was superior to regrowth cycle 1 (p = 0.00, Table 2) and to the plant cycle in almost all variables, except for NDL. Regarding Mo doses (p = 0.00, Table 2), only NLL showed a statistical difference, where the absence of the micronutrient was superior to its dose of 160 g ha−1.
In the interaction Cycle × N, it was observed that the cycle (plant, regrowth 1, and regrowth 2) influences the response of biometric variables, where PH showed a statistical difference (p = 0.00, Table 2), indicating that regrowth cycle 1 had the best plant height among the cycles for the dose of 100 kg ha−1 of N. Additionally, comparing doses within each cycle, it was noted that higher N doses resulted in greater growth, especially in the regrowth phases. The behavior was similar for ST and LDL (p = 0.00, Table 2), where increasing N doses among cycles often led to regrowth 2 being superior, and comparing doses within each cycle, higher N doses yielded higher averages.
For WDL, regrowth cycle 1 was superior at most N doses, with the dose of 100 kg ha−1 resulting in the highest WDL (p = 0.00, Table 2). Comparing increasing N doses within each cycle, it was remarkable that in the initial phase, the highest N dose (300 kg ha−1) was superior to others; however, for regrowth 2, doses of 50 and 150 kg ha−1 of N achieved the greatest increase in sorghum leaf width.
The number of living leaves (NLL) in regrowth cycle 2 without N application yielded the highest value for the variable (p = 0.03, Table 2). Furthermore, when comparing doses within the cycle for regrowth 2, the highest average was observed without nitrogen application, which was also true for NDL, where the highest average in the plant cycle was at the dose of 0 kg ha−1 of N (p = 0.00, Table 2). However, in the plant cycle for NLL, a different behavior was observed, as the dose that most significantly increased the number of living leaves was 150 kg ha−1 of N (p = 0.00, Table 2). NDL showed a statistical difference for the cycles, with regrowth cycle 1 achieving greater increases at higher N doses.
Average Plant Width (APW) (p = 0.00, Table 2) did not show statistical differences regarding N doses within each cycle. However, among the plant and regrowth 1 cycles, it was observed that the highest N dose (300 kg ha−1) increased the variable compared to others.
In the interaction Cycle × Mo, it was noted that the effect of the cycle on biometric variables—ST, LDL, NLL, NDL, and APW—was more pronounced in the final cycles (p = 0.00; 0.00; 0.03; 0.00, Table 2). As cycles progressed alongside the highest Mo dose, an increase in the variables was observed. For Mo doses, the application of 160 g ha−1 of Mo in the plant cycle decreased ST, while this effect increased in regrowth cycles, where the effect of molybdenum was more noticeable. LDL and APW achieved the highest averages with the highest Mo doses in regrowth cycle 2 (p = 0.00, Table 2).
In the interaction between N and Mo, there was a significant variation in plant responses to the combinations of these nutrients. The length of the most developed leaf (LDL) and plant height (PH) were particularly influenced (p = 0.00, Table 2), where the dose of 100 kg ha−1 of N, along with the presence of Mo, provided greater plant height, and for LD, 300 kg ha−1 of N with the application of 160 g ha−1 of Mo increased the length of the most developed leaf. For NLL and NDL, similar behavior was observed, as for NLL, with increasing N doses in the presence of molybdenum, the variable showed a positive increase (p = 0.00, Table 2), and the same was true for NDL, where the highest averages were at the dose of 300 kg ha−1 of N with Mo (p = 0.00, Table 2).
In the interaction Cycle × N × Mo, the results indicate that PH was significantly influenced by the cycle, the doses of N and Mo, as well as their interactions. In the initial plant cycle, the maximum height of 147.0 cm was achieved with a dose of 50 kg ha−1 of N and 0 g ha−1 of Mo, while the minimum height of 120.75 cm was observed in regrowth cycle 1 without the addition of N and Mo (p = 0.00, Table 2).
The stem thickness (ST) showed a similar response (p = 0.00, Table 2), with maximum values obtained in the second regrowth at 16 mm using 150 kg ha−1 of nitrogen (N) and 160 g ha−1 of molybdenum (Mo). However, the first regrowth exhibited the lowest values with low doses of N and no Mo, indicating that the supplementation of Mo becomes more important in the later stages of development.
The length of the most developed leaf (LDL) also followed this pattern (p = 0.00, Table 2), with higher values observed in the regrowths, particularly in the second regrowth, where the interaction between 150 kg ha−1 of N and 160 g ha−1 of Mo resulted in a length of 82.75 cm. Regarding the number of living leaves (NLL), it was found that increasing the dose of N, especially when combined with Mo in the second regrowth, favored a greater number of living leaves (p = 0.00, Table 2), with a maximum of 8.25 leaves. The number of dead leaves (NDL), on the other hand, exhibited a distinct behavior (p = 0.00, Table 2). In the initial plant stage, the highest doses of N and the presence of Mo resulted in a lower number of dead leaves. The leaf area (LA) was maximized in the second regrowth, with a value of 350 cm2 using 300 kg ha−1 of N and 160 g ha−1 of Mo, indicating that the combination of high doses of N and Mo promotes a greater leaf area in advanced cycles. The average plant width (APW) showed significant variation throughout the cycles (p = 0.00, Table 2), with the highest values also observed in the second regrowth, again indicating the effectiveness of combined doses of N and Mo at this stage.
In summary, the interaction between cycle, doses of N, and Mo highlights that nutritional management should be adapted to the different stages of plant development. While initial doses of N are more critical for the early plant phase, the application of Mo gains importance during regrowths, maximizing variables such as leaf area and height.
The plant height (PH) in Figure 3 exhibited a significant quadratic response to the increase in nitrogen doses (p = 0.01), with the regression equation indicating a maximum efficiency dose (MED) of approximately 197.34 kg ha−1 of N.
This result suggests that the height of the SF-15 sorghum reaches its maximum development point at this dosage, indicating a positive response to the increase of nitrogen (N) up to this limit. Higher doses, as indicated by the equation, would result in a decrease in height.
The stem thickness (ST) (Figure 3) (p = 0.00) also showed a quadratic response to nitrogen; however, the calculated maximum efficiency dose (MED) was 231 kg ha−1 of N, a value significantly higher than that observed for plant height.
The length of the most developed leaf (LDL) (Figure 3) exhibited a similar behavior (p = 0.00), with a MED of approximately 132 kg ha−1 of N. The leaf width (WDL) also showed a quadratic response to the increase in nitrogen doses (p = 0.00). Regarding the number of living leaves (NLL) (Figure 3) (p = 0.00), the regression equation indicated a MED of 251 kg ha−1. For leaf area (LA) (Figure 3), a crucial indicator of the total photosynthetic capacity of the plant, the response to nitrogen yielded a MED of approximately 231.50 kg ha−1 (p = 0.00).

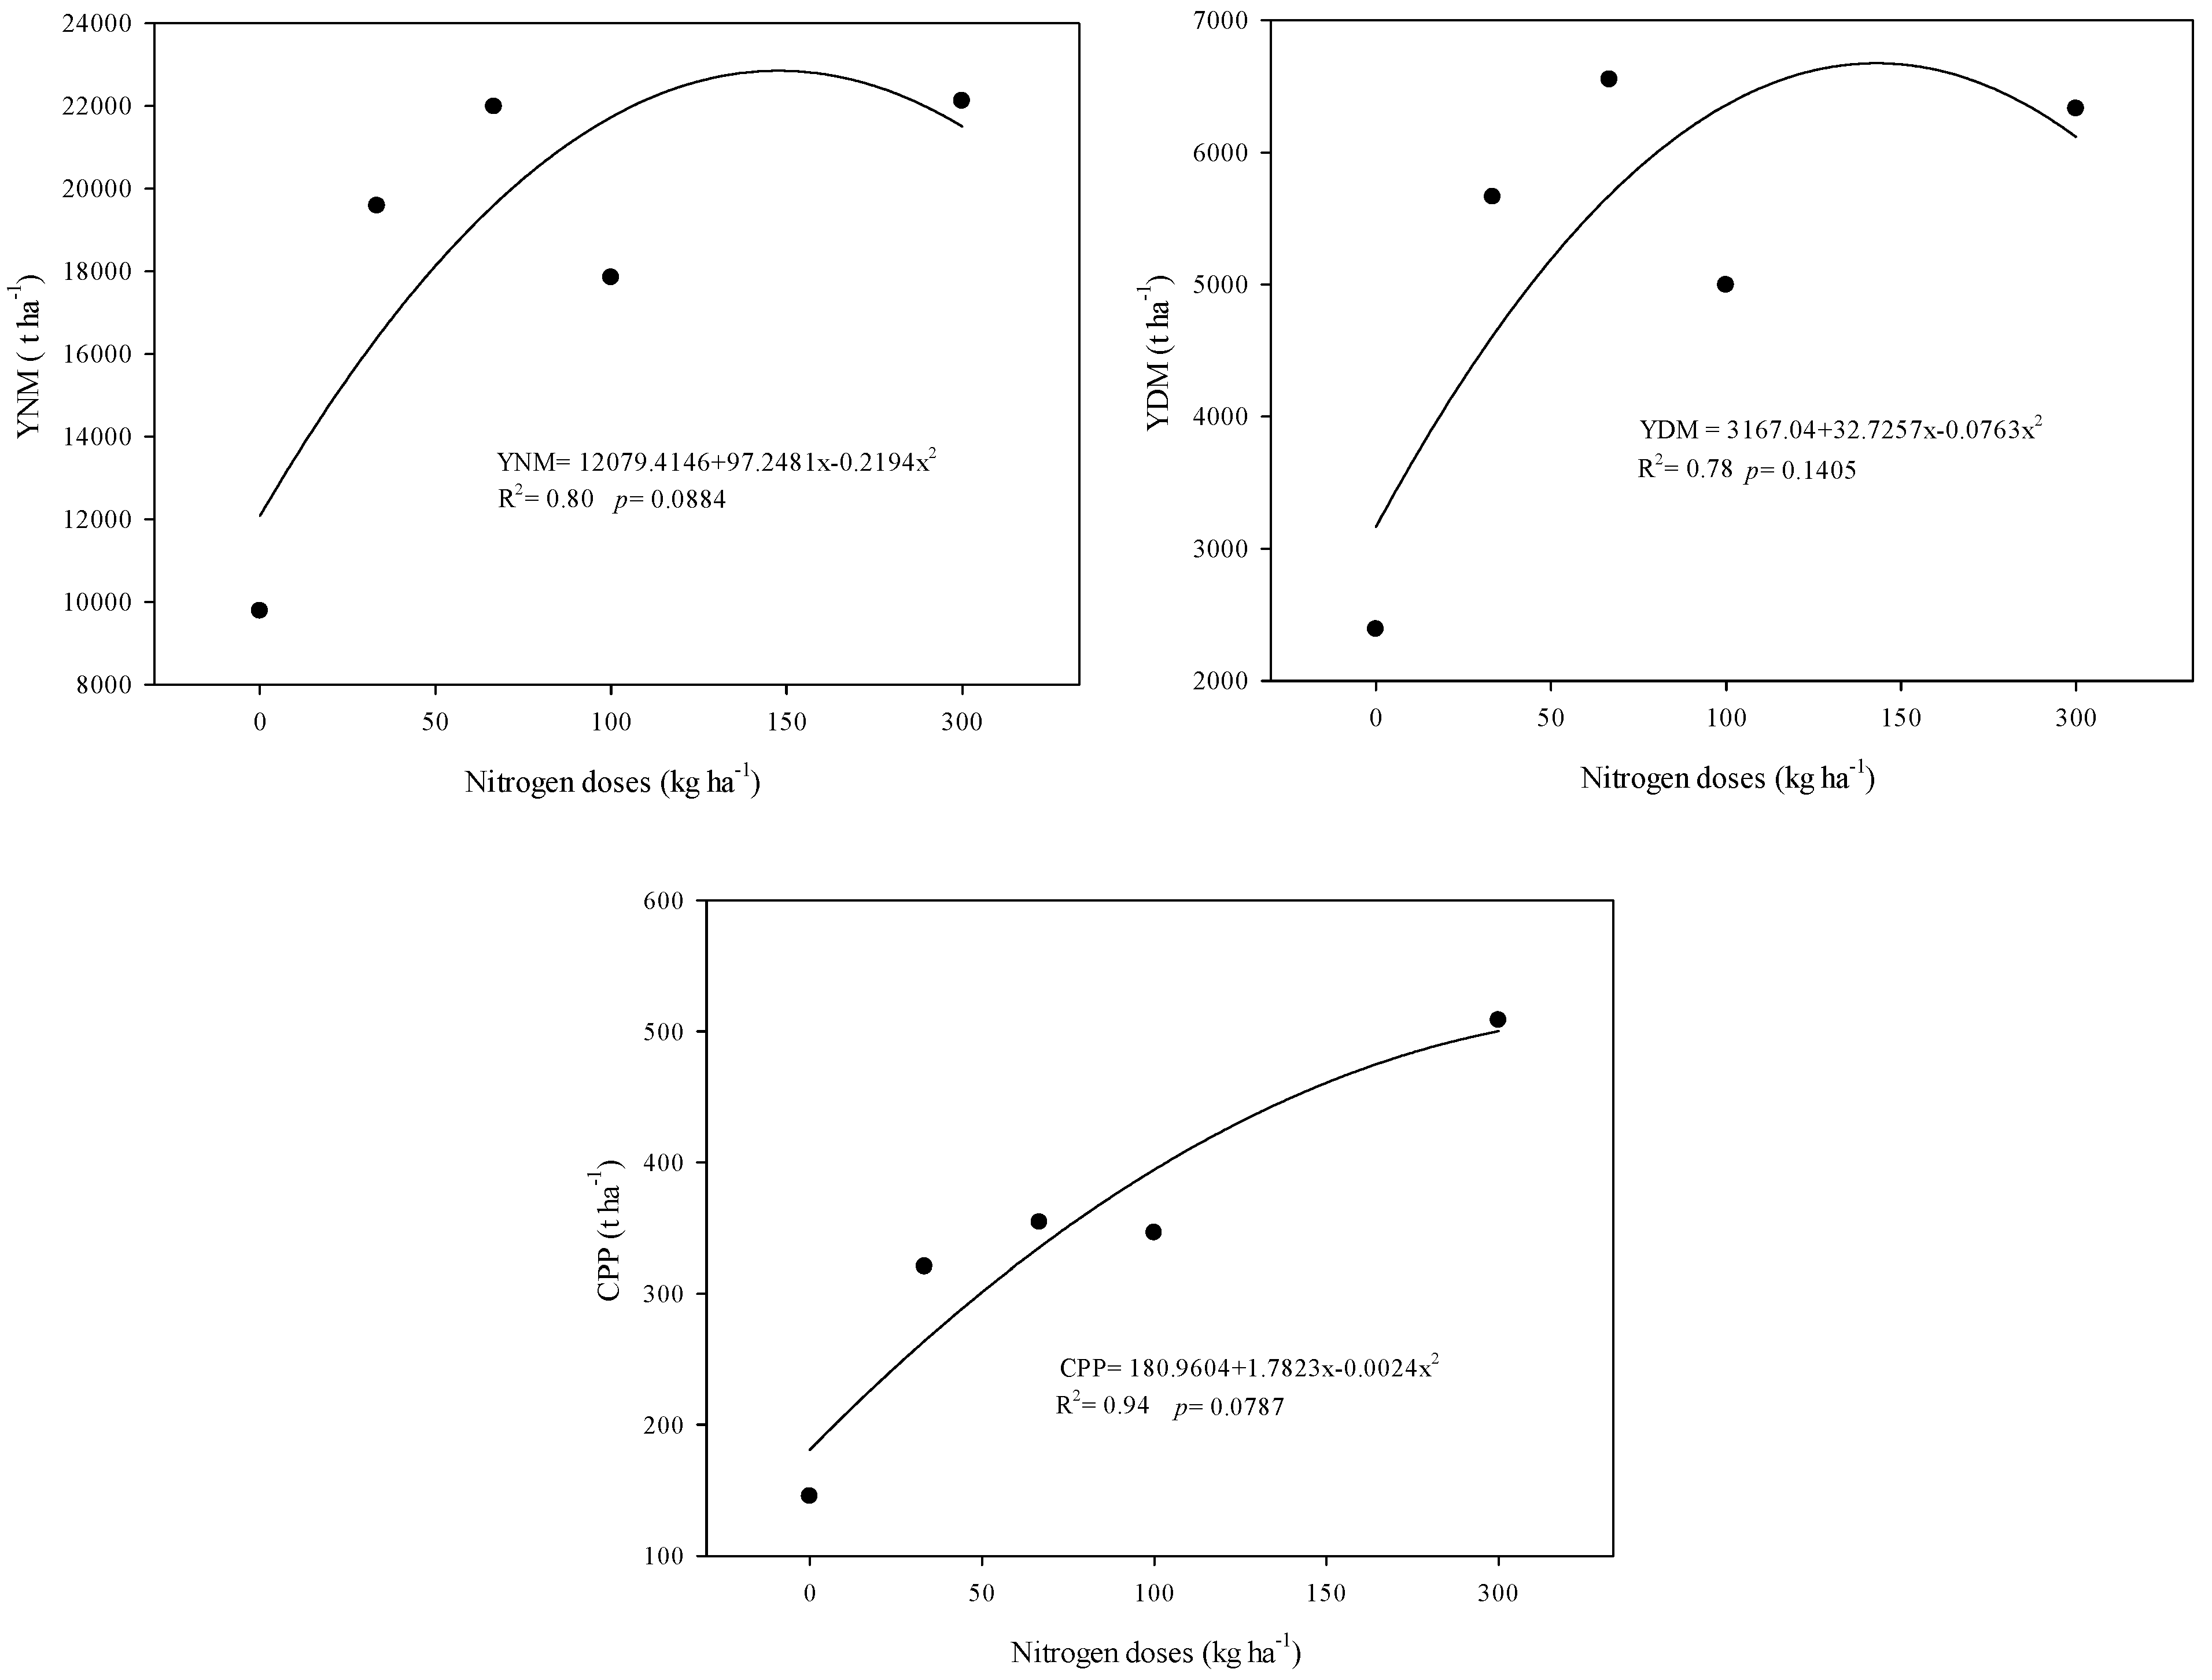
3.2. Productive Characteristics

In the cycle treatment, a significant difference was observed for the variables yield of natural mass (YNM), yield of dry mass (YDM), and crude protein production (CPP). It was noted that the productivity of these variables was significantly higher in regrowth 1, with 21.71 t ha−1, 6.68 t ha−1, and 0.43 t ha−1, respectively (p = 0.00, Table 3). These variables were also significantly influenced by the interaction between the cycle and nitrogen (N) doses. The highest values for YMN, YDM, and CPP were obtained in the interaction between regrowth 1 and a dose of 100 kg ha−1 of N, with a productivity of 31.87 t ha−1 (p = 0.04, Table 3), 10.27 t ha−1 (p = 0.00, Table 3), and 0.59 t ha−1 (p = 0.01, Table 3), respectively.
In the nitrogen (N) dose treatment, significant differences were also observed for the variables of yield of natural mass (YNM), yield of dry mass (YDM), and crude protein production (CPP) (p ≥ 0.05, Figure 4). The YNM (p = 0.04, Figure 4) and YDM (p = 0.01, Figure 4) variables exhibited a similar behavior, showing an initial increase as nitrogen doses were raised, peaking at around 150 kg ha−1 N. After this point, these variables began to decline with further increases in doses, particularly at the highest dose of 300 kg ha−1 N (p = 0.00, Figure 4). Meanwhile, the CPP variable displayed a trend of increase in response to increasing N doses. At the lowest N levels, the CPP values were lower, but with the increase in doses, a steady growth was observed (p = 0.03, Figure 4).

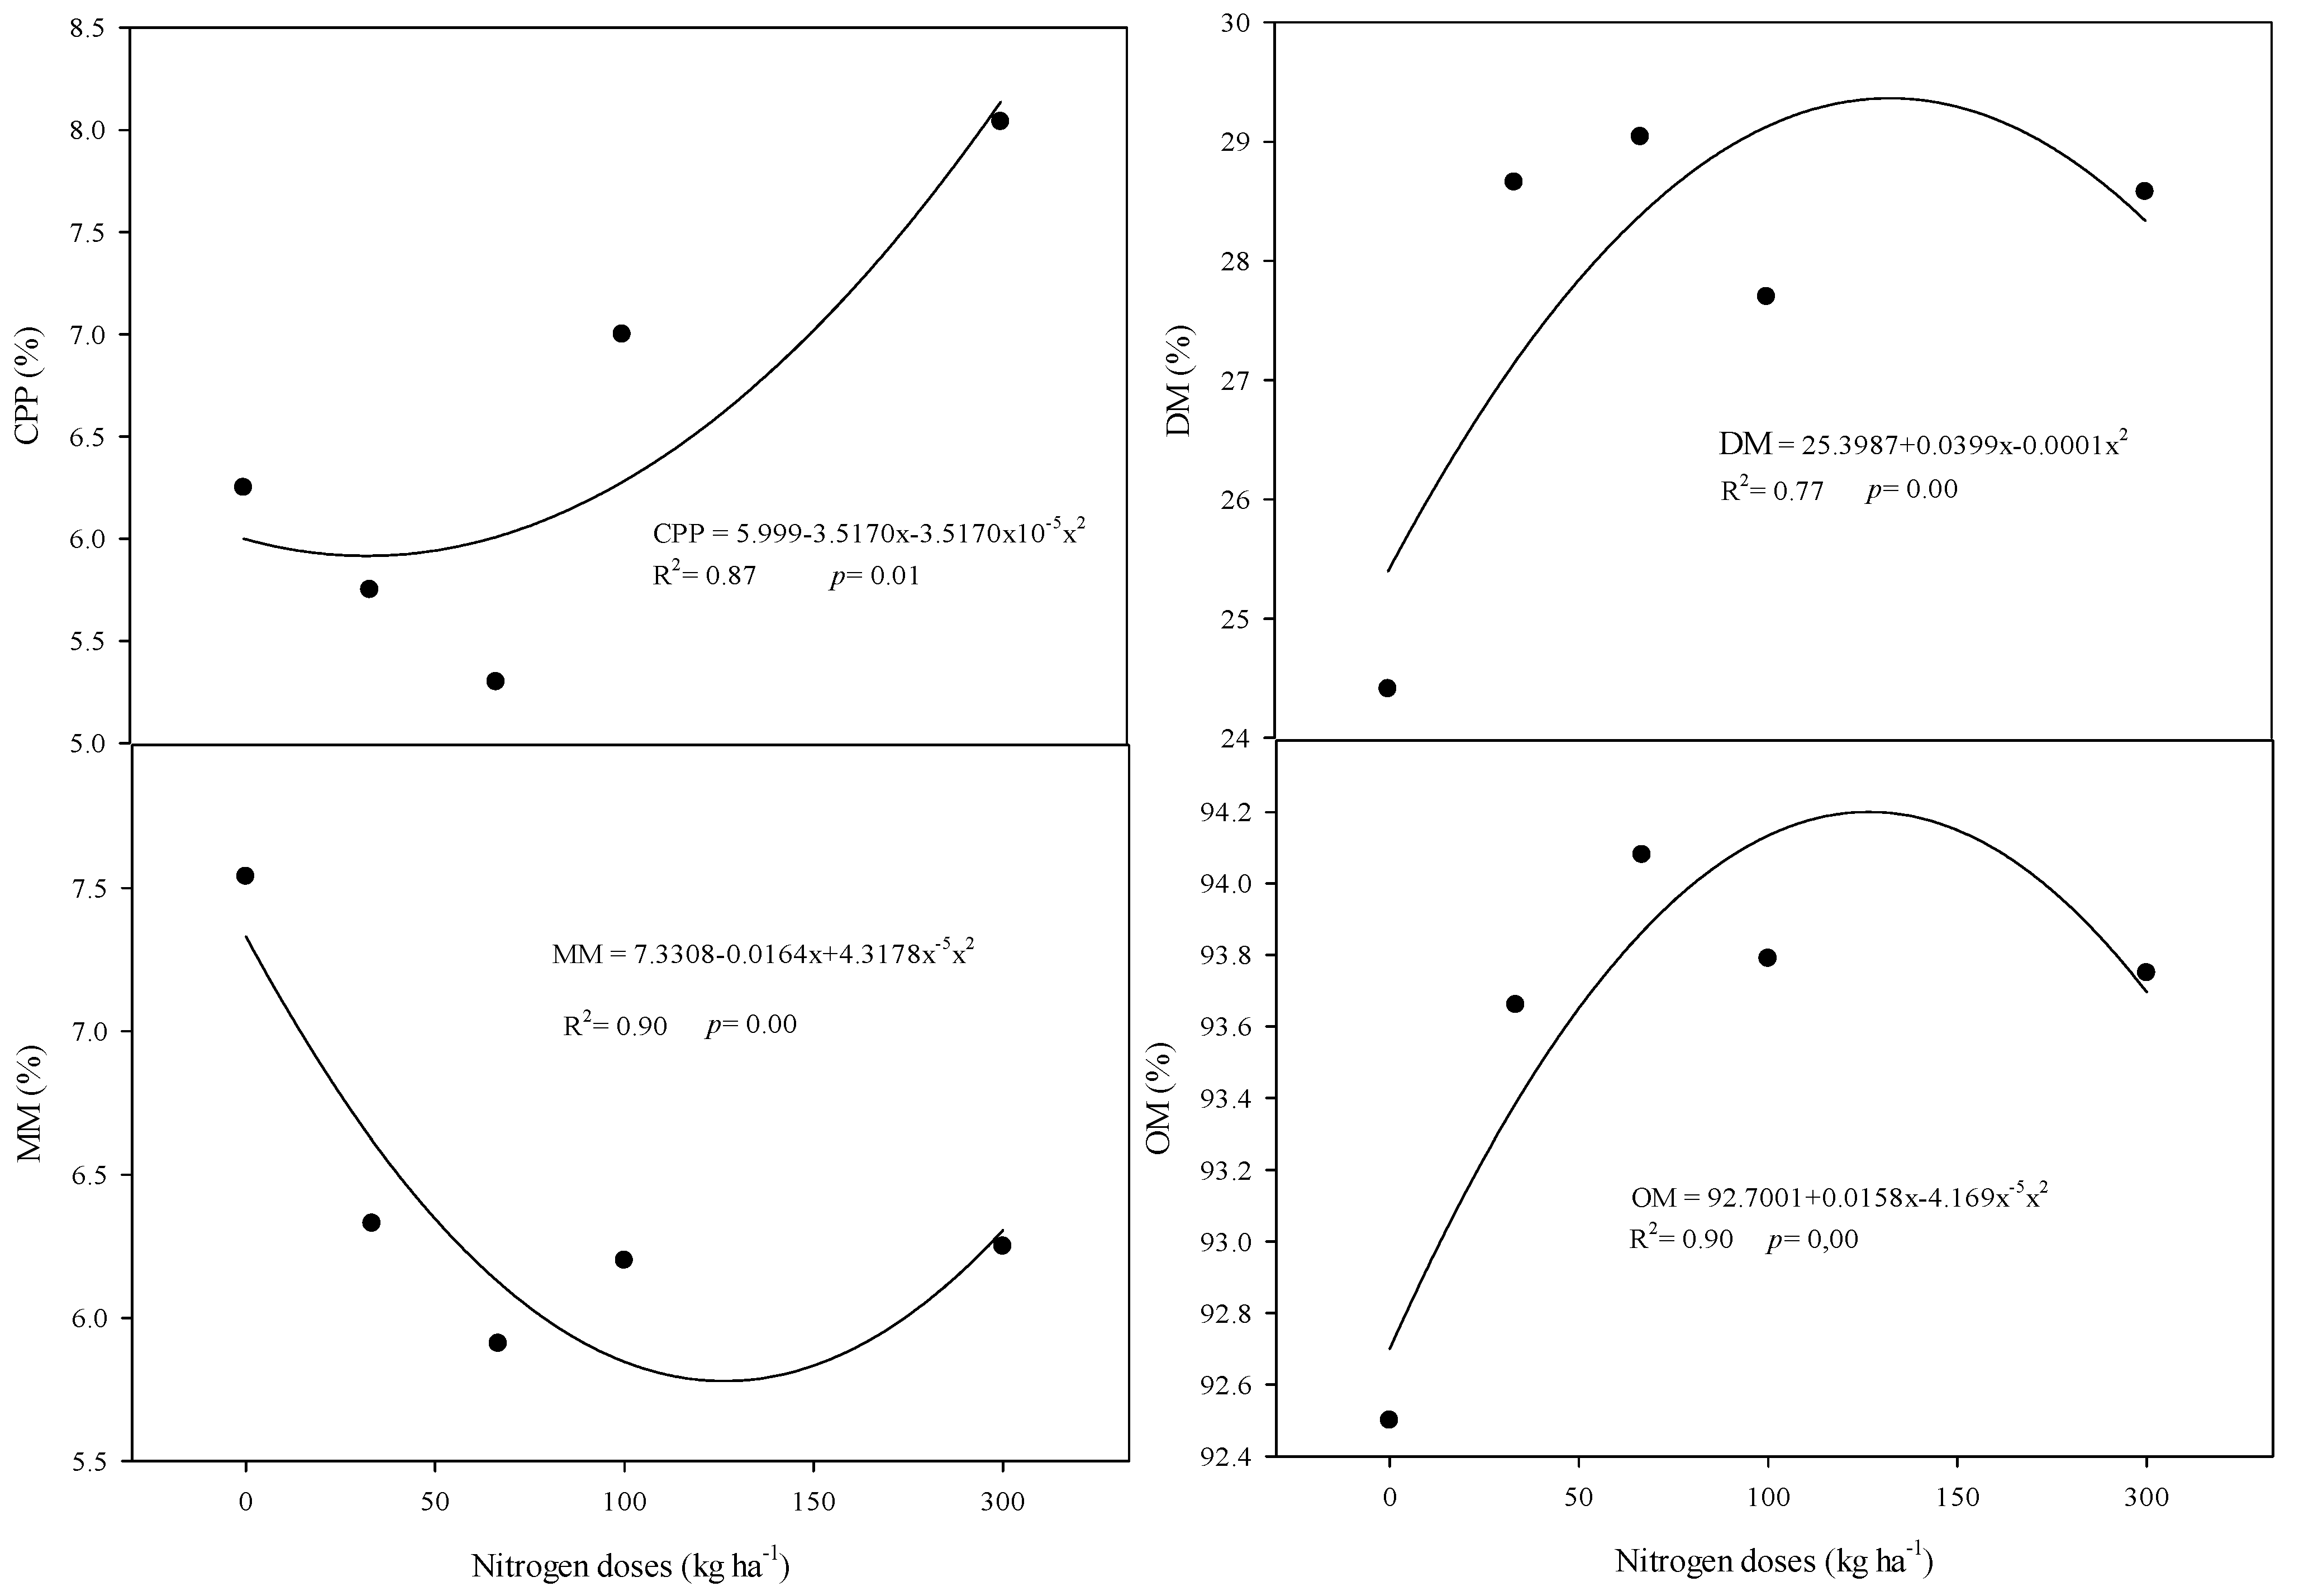
3.3. Bromatological Components

In the cycle treatment, the rude Crude Protein (CP) showed a significant reduction in the regrowth cycles, with a decrease of 11.3% in regrowth 1 (p = 0.00, Table 4) and 13.2% in regrowth 2 (p = 0.00, Table 4) compared to the plant cycle. The Dry Matter (DM) reached its highest value in regrowth 1, showing a significant increase of 14.08% (p = 0.00, Table 4) relative to the plant cycle and 11.55% compared to regrowth 2 (p = 0.00, Table 4). Neutral Detergent Fiber (NDF) was also influenced by the cycle factor, with the highest value observed in regrowth 1, presenting an increase of 2.61% (p = 0.03, Table 4) compared to the plant cycle, while regrowth 2 maintained similar values to the plant cycle. The Mineral Matter (MM) significantly decreased over the cycles, with the lowest MM recorded in regrowth 2, showing reductions of 15.54% (p = 0.00, Table 4) and 10.02% (p = 0.00, Table 4) compared to the plant and regrowth 1 cycles, respectively. On the other hand, Organic Matter (OM) was higher in regrowth 2, presenting a significant increase of 1.18% (p = 0.00, Table 4) and 0.73% (p = 0.00, Table 4) compared to the plant and regrowth 1 cycles, respectively.
In the interaction between cycle and N, significant differences were observed for the variables CP (Crude Protein), DM (Dry Matter), NDF (Neutral Detergent Fiber), and OM (Organic Matter). For CP, the highest increments were found in the interactions of the plant cycle and a dose of 300 kg ha−1 of N, regrowth 1 with doses of 300 kg ha−1 of N, and regrowth 2 with the absence of N, showing values of 9.37% (p = 0.03, Table 4), 8.37% (p = 0.03, Table 4), and 8.0% (p = 0.03, Table 4), respectively. The highest values for DM occurred in the interaction of the plant cycle with doses of 50 kg ha−1 of N, regrowth 1 with doses of 100 kg ha−1 of N, and regrowth 2 with doses of 50 kg ha−1 of N, resulting in values of 28.87% (p = 0.03, Table 4), 32.25% (p = 0.03, Table 4), and 28.50% (p = 0.03, Table 4), respectively. OM also achieved higher values in these interactions, with results such as 93.12% (p = 0.03, Table 4), 94.60% (p = 0.03, Table 4), and 94.87% (p = 0.03, Table 4). Regarding NDF, the highest values were found in the interaction of the plant cycle and a dose of 0 kg ha−1 with 67.00% (p = 0.00, Table 4), in the interaction of regrowth 1 and a dose of 0 kg ha−1 with 71.37% (p = 0.00, Table 4), and in the interaction of regrowth 2 and a dose of 100 kg ha−1 with 68.00% (p = 0.00, Table 4).
In the factor of cycle versus Mo, significant differences were noted for the variables CP and DM, where the plant cycle with the absence of Mo resulted in a higher value for PB at 7.10% (p = 0.03, Table 4) compared to regrowth 1 and 2 with the presence and/or absence of Mo. Meanwhile, the variable DM achieved its highest value at 30.30% (p = 0.03, Table 4) in the interaction of regrowth 1 with the presence of Mo (160 g ha−1).
In the interaction between N doses and Mo, significant differences were observed for the variables CP (Crude Protein), DM (Dry Matter), NDF (Neutral Detergent Fiber), and MM (Mineral Matter). When comparing the doses of N and the absence and/or presence of Mo, CP had the highest value in the interaction of 300 kg ha−1 of N and the absence of Mo (8.08%, p = 0.03, Table 4). DM was highest in the interaction of 100 kg ha−1 of N with the presence of Mo (29.50%, p = 0.03, Table 4), while NDF (68.83%, p = 0.03, Table 4) and MM (7.58%, p = 0.03, Table 4) were highest in the interaction of 0 kg ha−1 of N and the absence of Mo.
In the triple interaction of cycle versus N doses versus presence and absence of Mo, both CP and DM were influenced. The highest CP value (9.75%, p = 0.00, Table 4) occurred in the plant cycle with a dose of 300 kg ha−1 of N and the presence of Mo, while the highest DM value (32.00%, p = 0.00, Table 4) was found in regrowth 1 with a dose of 100 kg ha−1 of N and the absence of Mo.
For the treatment of nitrogen doses (N), significant differences were noted for the variables MM, OM, CP, and DM. For MM, a significant reduction occurred as the doses of N increased (p = 0.00, Figure 5), reaching a minimum value near 150 kg ha−1, followed by a slight increase at the dose of 300 kg ha−1 of N. The variable OM showed an initial increase as the nitrogen doses were raised, peaking around 150 kg ha−1 of N. After this point, OM began to decline with further increases in doses, particularly at the highest dose of 300 kg ha−1 of N (p = 0.00, Figure 5).
The CP variable exhibited a progressive increase in response to rising N doses. At lower N levels, CP values were lower, but with increasing doses, there was a consistent growth, culminating in approximately 20% increments compared to the control (p = 0.00, Figure 5).
The DM variable initially showed an increasing response with rising N doses, peaking around 100 kg ha−1 of N. After this point, DM began to slightly decrease with further N dose increases, especially at the 300 kg ha−1 dose. When comparing DM values at the minimum and maximum doses of N, there was an increase of approximately 11% (p = 0.00, Figure 5).

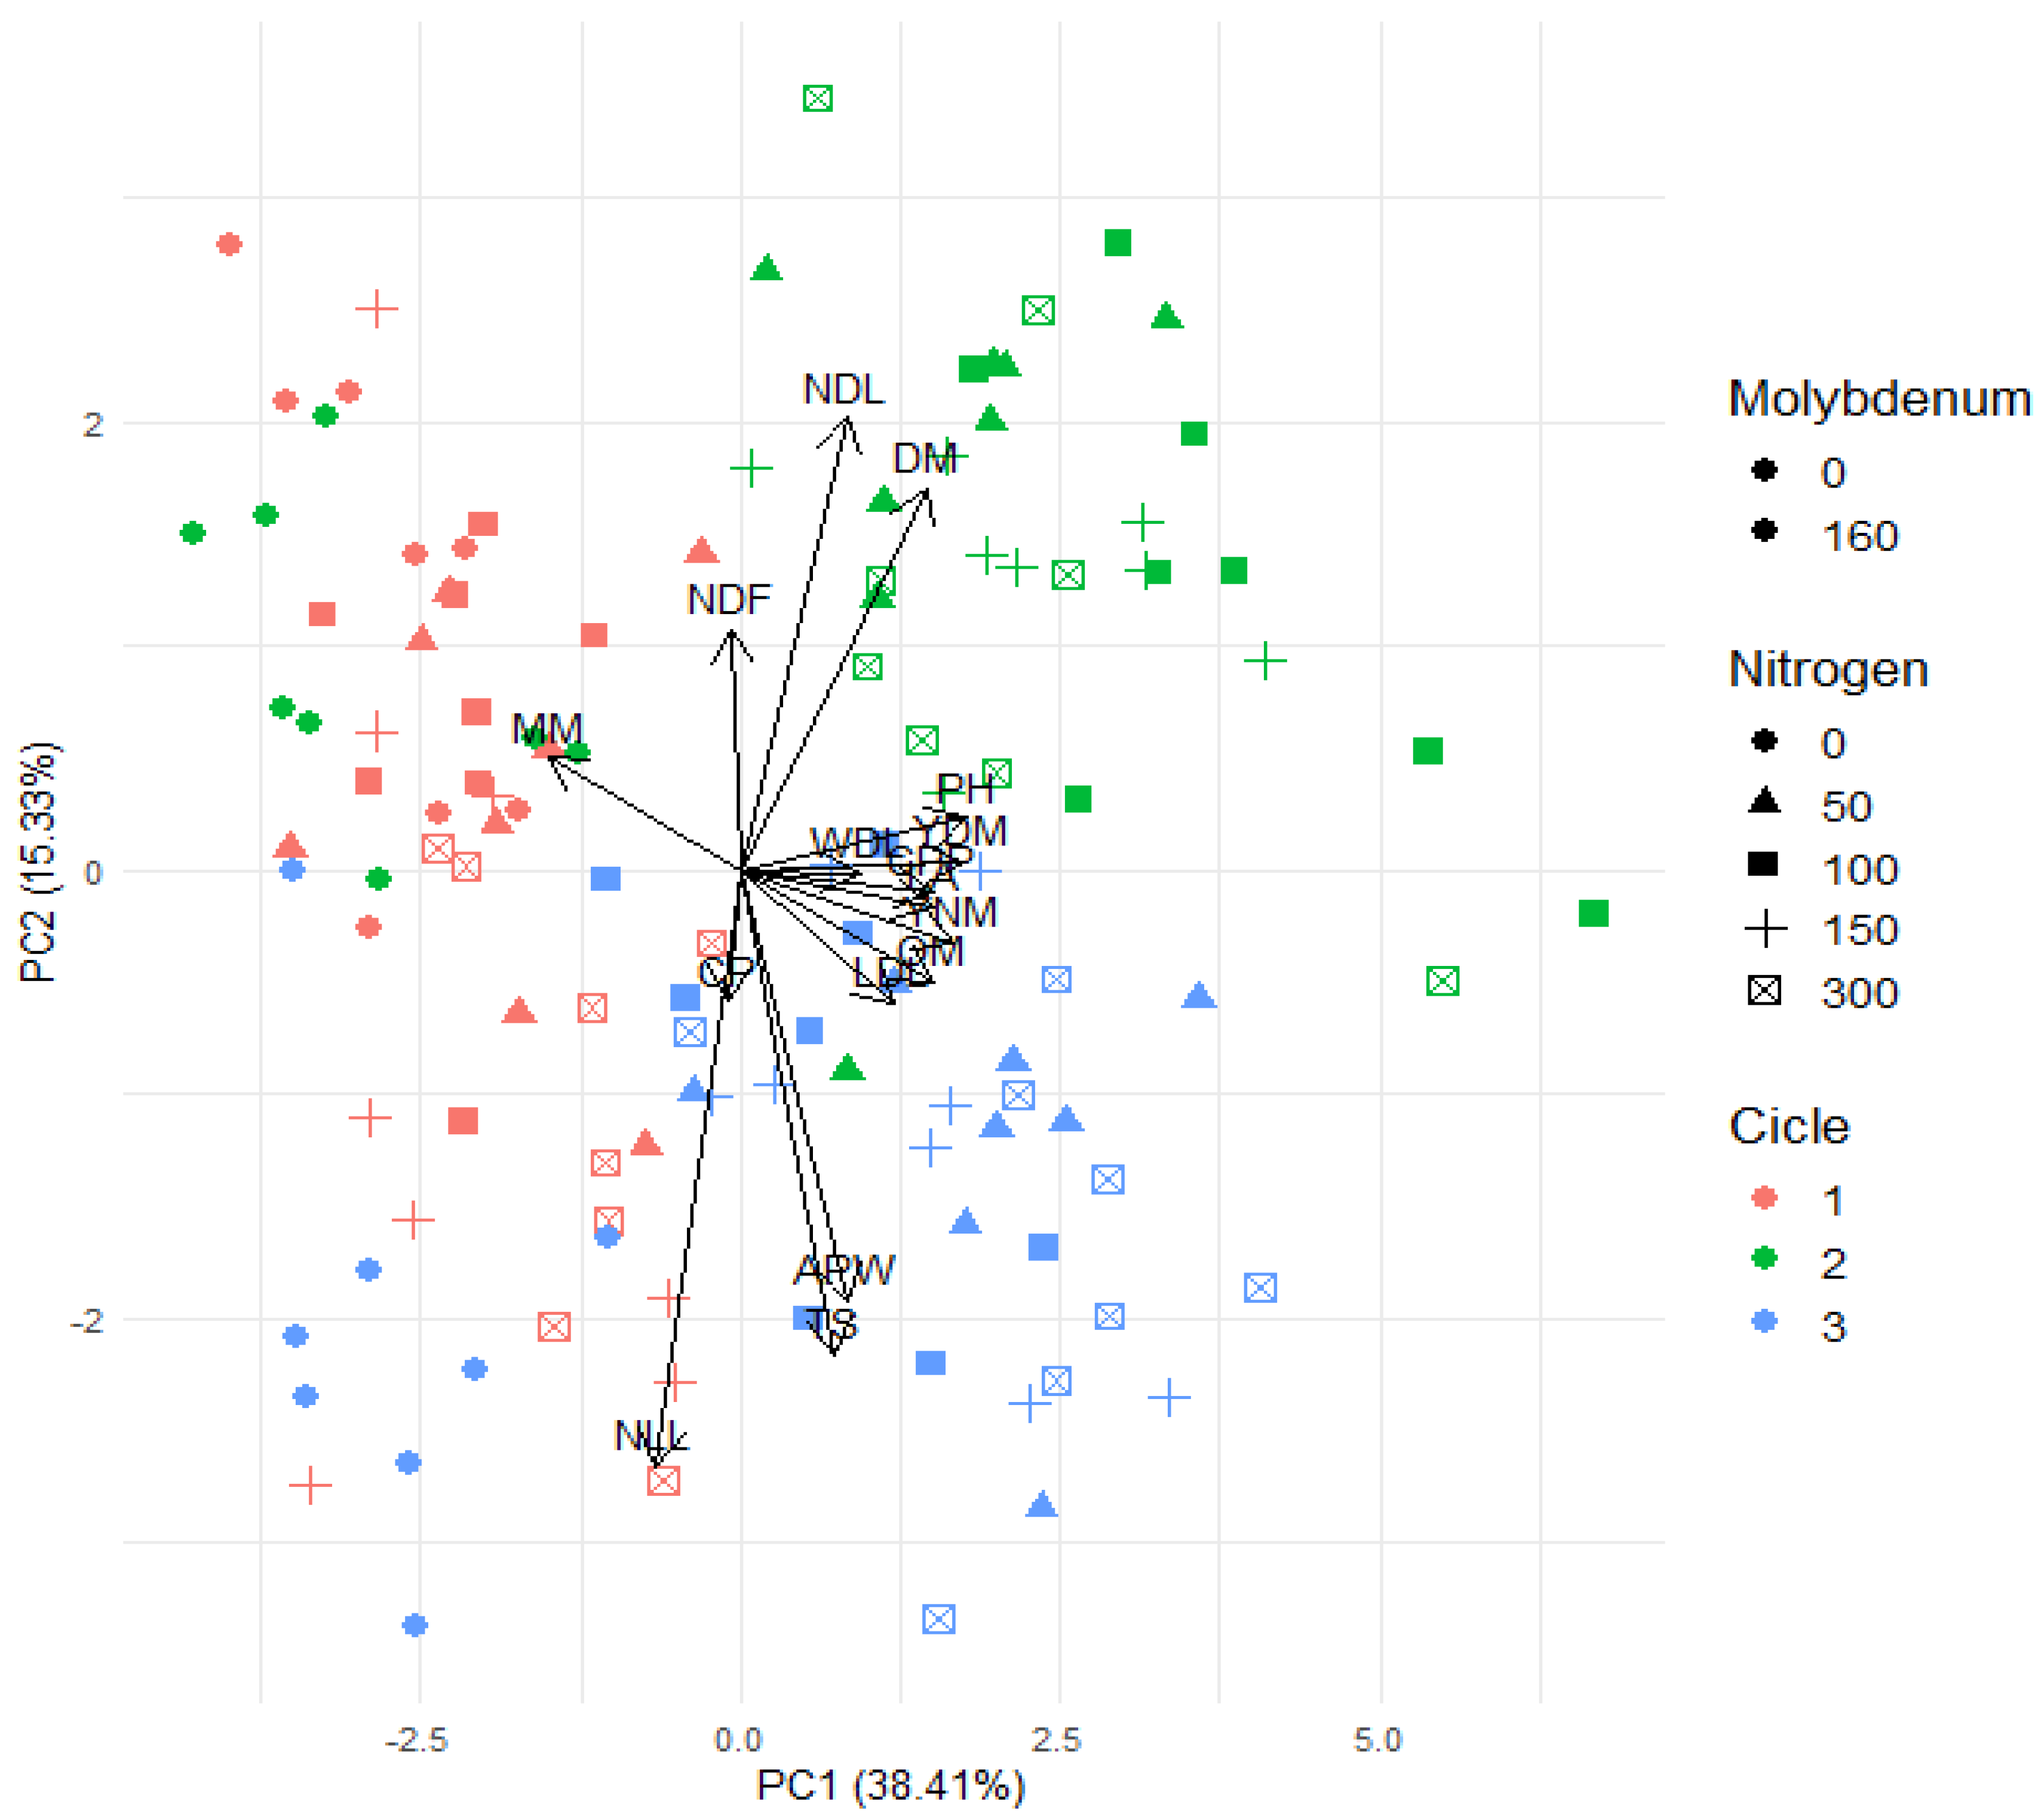
3.4. Relationship Between Analyzed Variables and Nitrogen and Molybdenum Fertilization Management in Consecutive Cycles of Forage Sorghum Under Water Deficit

The Principal Component Analysis (PCA) depicted in the graph considers three main factors: the cycle, nitrogen doses, and the absence or presence of molybdenum. These factors are related to the observations in a two-dimensional space formed by the first two principal components, PC1 and PC2, which explain 38.41% and 15.33% of the total variance of the data, respectively (Figure 6).
The projected variables, such as NDL (Number of Dead Leaves), DM (Dry Matter), and NDF (Neutral Detergent Fiber), exhibit long vectors, suggesting that they make a significant contribution to the principal components. Consequently, the proximity between the variables indicates that they are correlated; NDL and DM are close together and point in a similar direction, suggesting a positive correlation between them. Conversely, inverse relationships can be observed with the variables MM (Mineral Matter), PMN (Natural Matter Production), OM (Organic Matter), as well as NDF and LDL (Length of the most Developed Leaf) and ST (Stem Thickness), as their eigenvectors are in opposite directions, indicating an inverse relationship.
The different nitrogen levels, particularly the higher levels (larger circles), appear to be primarily distributed in the upper right quadrant, suggesting that these levels are associated with characteristics reflected by PC1 and PC2. Observations with low nitrogen levels are spread across other quadrants, indicating a lower correlation with the variables represented by these components. The sizes of the symbols reflect the levels of molybdenum, with larger circles, indicating higher concentrations, predominantly located to the right of the graph, suggesting that molybdenum doses may be related to variables that have greater influence on PC1.

4. Discussion

4.1. The Morphometric Characteristics of Sorghum Are Influenced by Consecutive Cycles, Nitrogen Doses, and Molybdenum

The positive results in the final cycles (regrowth cycle 1 and 2) for the morphometric variables (plant height, leaf width, stem thickness, leaf length, leaf width, leaf area, number of green leaves, and number of dead leaves), as well as the addition of nitrogen doses and the presence of molybdenum, may be directly related to the favorable climatic conditions that occurred during the final cycles. The rainy season concentrated at the beginning of regrowth cycle 1 and continued throughout cycle 2, leading to greater water availability for sorghum and consequently diluting the salts from the irrigation water that accumulate in the soil.
The morphometric variables are interrelated, primarily with the production of dry matter (DM). The values found in the present study reflect this relationship and demonstrate that the SF-15 sorghum exhibits taller plants, a greater number of green leaves, a lower number of dead leaves, and wider leaves when receiving nitrogen fertilization associated with molybdenum during the final cycles (regrowth cycle 1 and 2). It also displays a more efficient photosynthetic apparatus, justified by the high values obtained in this research. With all these characteristics present, the radiation incident on the plant will be intercepted, favoring the uptake of CO2 and other photoassimilates, which will subsequently be translocated throughout the plant, resulting in about 90% of the dry matter produced [25,26].
The increase in these variables, in addition to water availability, can also be explained by the essential role of nitrogen associated with molybdenum, as molybdenum is directly involved in nitrogen metabolism, integrating the nitrite reductase and nitrogenase enzymatic complexes [13]. Consequently, nitrogen can positively affect the electron transport chain in the synthesis of ATP, NADPH, and carboxylation efficiency [27]. This process is fundamental in protein construction, essential for the development of plant tissues. Thus, with water and nitrogen availability, there is an improvement in amino acid formation, significantly increasing the growth variables of sorghum, which is an important condition in areas where access to forage is limited. Therefore, SF-15 sorghum may serve as an alternative food source for livestock.

4.2. The Productive Characteristics of Sorghum SF-15 Are Influenced by the Productive Cycle and Nitrogen

The results obtained in this study showed that sorghum performs better during regrowth compared to the first cycle (plant cycle), with nitrogen fertilization resulting in a positive increase in natural matter productivity, dry matter, and crude protein productivity, which are crucial variables for livestock production.
These results are related to climatic conditions and the physiological responses of the plant, as the highest average air temperatures and the greatest water accumulation occurred during regrowth cycle 1, alongside the availability of nitrogen. The literature indicates that air temperature, without water restrictions, positively influences plant development by directly affecting its metabolism [28]. Nitrogen is a component of the chlorophyll molecule, which is essential during the photosynthesis process, the main metabolic process of plants [29]. Therefore, under favorable edaphoclimatic conditions, plants tend to express their productive potential. The highest productivities (31 t ha−1 natural matter and 10 t ha−1 dry matter) obtained in this study are similar to the results reported by [30] et al. (2012), who achieved (28 t ha−1 natural matter and 11 t ha−1 dry matter) with the same cultivar (SF-15) and similar climate.
The increasing responses of crude protein productivity (CPP) concerning nitrogen doses can be primarily related to the nitrogen content available to the plants, which is utilized in combining the carbon skeleton to produce amino acids that result in proteins [12]. The accumulation of nitrogen in sorghum is variable, with most being accumulated in the panicle; however, unlike plants such as corn, sorghum does not cease its nitrogen accumulation until it is harvested [31].

4.3. Bromatological Components Are Positively Influenced by Cycle, Nitrogen, and Molybdenum

The bromatological components primarily comprise the nutritional part of the plant, and the present study demonstrated positive responses for these variables concerning cycles, nitrogen fertilization, and the presence or absence of molybdenum (Mo). The results indicate that for the crude protein (CP) variable, the plant cycle with the addition of nitrogen and the absence of Mo yielded the best outcomes. In contrast, the highest levels of dry matter (DM), neutral detergent fiber (NDF), mineral matter (MM), and organic matter (OM) were obtained in the subsequent cycles (regrowth cycles 1 and 2), along with the addition of nitrogen and the absence of Mo, except for the NDF variable, where the presence of Mo reduced its levels, highlighting the excellent nutritional value of sorghum SF-15.
In addition to nitrogen and molybdenum fertilization, the timing of harvest may have contributed to these results, as nutrient production tends to increase significantly throughout the plant’s development due to the translocation of nutrients to the panicle [31]. This explains why protein levels were higher in the plant cycle, which was the longest (duration of 108 days, while the others were 90 and 99 days), occurring during a critical period due to climatic conditions for sorghum. This limitation led to a lower biomass accumulation and, consequently, a higher accumulation of CP in the plant.
Crude protein is an important factor in reducing livestock production costs, as the higher the nutritional value of forages, the lower the costs of supplementation [32]. The nutritional value of forage primarily depends on CP levels to enhance quality, promoting rapid weight gain and increased milk production [33,34]. In this case, the elevated CP levels indicate that sorghum SF-15 can be offered to ruminant animals.
Other nutrients increased due to the increment in dry matter production during regrowth cycles 1 and 2 under favorable climatic and nutritional conditions. Nitrogen fertilization was essential in both climatic scenarios. The unfavorable conditions in the plant cycle were mitigated by nitrogen fertilization, as nitrogen can enhance the plant’s metabolism by providing amino acids such as proline. This increases the activity of antioxidant enzymes, eliminates free radicals, stabilizes proteins, membranes, and subcellular structures, and protects cellular functions by eliminating reactive oxygen species (ROS) [35]. Under favorable conditions, nitrogen was available for the plant to primarily produce dry matter, which justifies the increase in nutrient levels during regrowth cycles 1 and 2.
The levels of dry matter and organic matter are related to the nutritional content of the food, including carbohydrates, lipids, proteins, and minerals, making dry matter values highly significant for diet formulation [36,37]. On the other hand, mineral matter levels represent the inorganic part of the plant and are inversely proportional to organic matter levels. The results obtained in this study revealed that nitrogen fertilization decreased mineral matter levels. This is a positive gain in the nutritional value of the forage, as lower mineral matter levels correlate with higher nutrient levels in the plant [38].
Neutral detergent fiber levels are negatively related to food digestibility and may interfere with consumption, as they represent the fibrous fraction of the food [31]. The results from this study showed that nitrogen fertilization associated with molybdenum during regrowth is capable of decreasing the NDF levels present in sorghum SF-15, highlighting the nutritional characteristics for the consumption of herbivorous animals.

5. Conclusions

In this study, the interaction between Nitrogen and Molybdenum was evaluated concerning the productive, bromatological, and structural components of the forage sorghum SF-15, cultivated in a semi-arid environment, assuming the efficiency of Nitrogen utilization by the plant. It was confirmed that there is a synergistic action between nitrogen and molybdenum for the structural and bromatological components studied.
It is recommended to use nitrogen fertilization at a rate of 100 kg ha−1 of N to achieve an average production of 10 t ha−1 of dry matter, thereby promoting forage production and increasing the nutrient supply in sorghum SF-15. Moreover, to promote the growth of forage sorghum, it is recommended to carry out planting during periods with favorable climatic conditions, particularly when water availability is higher, combined with the application of nitrogen fertilizers and molybdenum.
However, future research should address certain limitations, such as the need for long-term trials under different environmental conditions and soil types to validate the broader applicability of these findings.

Author Contributions

To the authors, G.R.F.d.F. for data curation, investigation, methodology, original draft writing, and visualization, J.C.G.d.S.H. for data curation, investigation, methodology, writing—review & editing, E.B.d.A., investigation, N.V.S.A., investigation, A.C.d.O. for project administration, supervision, methodology, M.L.d.S.M., investigation, A.L.J.S., investigation and E.J.O.d.S. for conceptualization, data curation, formal analysis, investigation, methodology, project administration, resources, supervision, writing—original draft, writing—review & editing. All authors have read and agreed to the published version of the manuscript.

Funding

This study was supported by the Coordination for the Improvement of Higher Education Personnel (CAPES), grant number: 88882.461697/2019-01, G.R.F.d.F.

Institutional Review Board Statement

Not applicable.

Informed Consent Statement

Not applicable.

Data Availability Statement

The data from this study are available from the corresponding author upon request.

Acknowledgments

The authors would like to thank the Coordination for the Improvement of Higher Education Personnel (CAPES) for their financial support, which enabled the execution of this research. They also express gratitude to the Federal Rural University of Pernambuco, Serra Talhada Academic Unit (UFRPE/UAST), and the Graduate Program in Plant Production (PGPV) for providing the field area and access to essential laboratory, bibliographic, and technological resources for the advancement of this research. Finally, they acknowledge the Ruminant Studies and Research Center (Rumiagro) and the research group in Plant Nutrition in the semi-arid region, NutriPlant, for their collaboration, support, and the opportunity to be part of committed and dedicated research teams.

Conflicts of Interest

The authors of this study declare no conflicts of interest.

References

  1. Alves, C.P.; Jardim, A.M.; Júnior, G.D.; de Souza, L.S.; de Araújo, G.G.; de Souza, C.A.; da Silva Salvador, K.R.; Leite, R.M.; Pinheiro, A.G.; da Silva, T.G. How to enhance the agronomic performance of cactus-sorghum intercropped system: Planting configurations, density and orientation. Ind. Crop. Prod. 2022, 184, 115059. [Google Scholar] [CrossRef]
  2. Oliveira, L.B.; Macêdo, A.J.d.S.; Santos, E.M. Interaction Between Native and Cultivated Forage Species in Semi-Arid Conditions. Arq. Ciênc. Vet. Zool. UNIPAR. 2019, 22, 127–138. [Google Scholar] [CrossRef]
  3. Uzcátegui, J.P.V.; Chompre, K.; Castillo, D.; Rangel, S.; Rangel, A.B.; Piña, A. Nutritional assessment of tropical pastures as a sustainability strategy in dual-purpose cattle ranching in the South of Lake Maracaibo, Venezuela. J. Saudi Soc. Agric. Sci. 2021, 21, 432–439. [Google Scholar] [CrossRef]
  4. Akin, D.E. Histological and Physical Factors Affecting Digestibility of Forages. Agron. J. 1989, 81, 17–25. [Google Scholar] [CrossRef]
  5. Nunes, J.d.S.L.; Silva, T.G.F.; de Souza, L.S.B.; Jardim, A.M.d.R.F.; Alves, H.K.M.N.; da Cruz Neto, J.F.; Leite, R.M.C.; Pinheiro, A.G. Morphogenesis of forage cactus under modification of the growth environment. Agrometeoros 2020, 27, 367–375. [Google Scholar] [CrossRef]
  6. Perazzo, A.F.; Santos, E.M.; Pinho, R.M.A.; Campos, F.S.; Ramos, J.P.d.F.; de Aquino, M.M.; da Silva, T.C.; Bezerra, H.F.C. Agronomic characteristics and rain use efficiency in sorghum cultivars in the semi-arid region. Cienc. Rural. 2000, 30, 365–372. [Google Scholar] [CrossRef]
  7. Silva, H.W.; Guimaraes, C.R.B.; Andriguetti, S.C.; Godinho, A.M.M.; dos Santos, A.T.; Araújo, E.B.; Fachiano Junior, L.C.; Pereira, C.W. de J. Forage sorghum productivity as a function of cutting interval and regrowth. Braz. J. Dev. 2020, 6, 14441–14450. [Google Scholar] [CrossRef]
  8. Jardim, A.M.d.R.F.; de Souza, L.S.B.; Alves, C.P.; de Araújo, J.F.N.; de Souza, C.A.A.; Pinheiro, A.G.; de Araújo, G.G.L.; Campos, F.S.; Tabosa, J.N.; da Silva, T.G.F. Intercropping forage cactus and sorghum in a semi-arid environment improves biological efficiency and competitive ability through interspecific complementarity. J. Arid Environ. 2021, 188, 104464. [Google Scholar] [CrossRef]
  9. Moura, M.M.A.; Pires, D.A.d.A.; Rodrigues, J.A.S.; Sales, E.C.J.; Costa, R.F.; Tolentino, D.C. Chemical composition of sorghum genotypes silages. Acta Sci. 2016, 38, 369–373. [Google Scholar] [CrossRef]
  10. Pino, F.; Heinrichs, A.J. Sorghum forage in precision-fed dairy heifer diets. J. Dairy Sci. 2017, 100, 224–235. [Google Scholar] [CrossRef] [PubMed]
  11. Oresca, D.; de Oliveira, A.C.; da Silva, T.G.F.; Pessoa, L.G.M.; de Souza, J.C.G. Agronomic performance of forage sorghum and millet grown under irrigation with saline water and nitrogen doses in the Brazilian semi-arid. Res. Soc. Dev. 2021, 10, 1–18. [Google Scholar] [CrossRef]
  12. Taiz, L.; Zeiger, E.; Moller, I.M.; Murphy, A. Growth and Development. In Plant Physiology and Development, 6th ed.; Lima, L.B., Preparação, A.S., Neumann, L.P., Arte, S.G., Eds.; Artmed: Porto Alegre, Rio Grande do Sul, Brazil, 2017; pp. 377–731. [Google Scholar]
  13. Bredemeier, C.; Mundstock, C.M. Regulation of nitrogen absorption and assimilation in plants. Cienc. Rural. 2013, 43, 1771–1776. [Google Scholar] [CrossRef]
  14. Ahmed, S.O.; Abdalla, A.W.H.; Inoue, T.; Ping, A.; Babiker, E.E. Nutritional quality of grains of sorghum cultivar grown under different levels of micronutrients fertilization. Food. Chem. 2014, 159, 374–380. [Google Scholar] [CrossRef]
  15. Albino, U.B.; CAMPO, R. JEffect of molybdenum sources and doses on Bradyrhizobium survival and biological nitrogen fixation in soybean. Pesqui. Agropecu. Bras. 2001, 36, 527–534. [Google Scholar] [CrossRef]
  16. Oliveira, S.L.; Crusciol, C.A.C.; Rodrigues, V.A.; Galeriani, T.M.; Portugal, J.R.; Bossolani, J.W.; Moretti, L.G.; Calonego, J.C.; Cantarella, H. Molybdenum Foliar Fertilization Improves Photosynthetic Metabolism and Grain Yields of Field-Grown Soybean and MaizeFront. Plant Sci. 2022, 13, 887682. [Google Scholar] [CrossRef]
  17. Ferreira, A.C.d.B.; Araújo, A.D.A.; Pereira, P.R.G.; Cardoso, A.A. Agronomic and nutritional characteristics of corn fertilized with nitrogen, molybdenum and zinc. Sci. Agric. 2001, 58, 131–138. [Google Scholar] [CrossRef]
  18. Alvares, C.A.; Stape, J.L.; Sentelhas, P.C.; De Moraes, J.L.G.; Sparovek, G. Köppen’s climate classification map for Brazil. Meteorol. Z. 2013, 22, 711–728. [Google Scholar] [CrossRef]
  19. Silva, A.d.S.; Mendes, A.M.S.; Silva, A.F.; de Souza, A.V.; Neves, A.L.A. Characterization of the Brazilian Semiarid: Natural and human factors. In Brazilian Semiarid: Research, Development and Innovation; Sá, I.B., da Silva, P.C.G., Eds.; Embrapa Semiarid: Petrolina, Brazil, 2010; pp. 17–48. [Google Scholar]
  20. Cirino Júnior, B.; Henrique, J.C.G.S.; Maciel, L.H.; Souza, C.M.P.G.; De Alcântara, E.B.; Da Silva, N.S.G.; Santos, H.G.; Jacomine, P.K.T.; Anjos, L.H.C.; Oliveira, V.A. Diagnostic attributes and other attributes. In Brazilian Soil Classification System, 5th ed.; Santos, H.G., Ed.; Embrapa: Brasilia, Brazil, 2018; pp. 29–48. [Google Scholar]
  21. Allen, R.G.; Pereira, L.S.; Raes, D.; Smith, M. Guidelines for computing crop water requirements. FAO-56 1998, 56, 300–1998. [Google Scholar]
  22. Guimarães, D.P.; Sans, L.M.A.; Moraes, A.V.d.C. Estimation of Leaf Area of Corn Cultivars. In Proceedings of the XXIV National Corn and Sorghum Congress, Florianopolis, SC, Brazil, 1–5 September 2002. [Google Scholar]
  23. Detman, E.; Silva, L.F.C.; Rocha, G.C.; Palma, M.N.N.; Rodrigues, J.P.P. Methods for Food Analysis, 2nd ed.; Suprema: Visconde do Rio Branco, MG, Brazil, 2021. [Google Scholar]
  24. Figueredo Júnior, L.G.M.; Dourado Neto, D.; Oliveira, R.F.; Manfron, P.A.; Martin, T.N. Model for Estimating the Leaf Area Index for Corn Crops. Rev. Bras. Milho Sorgo 2005, 4, 8–13. [Google Scholar] [CrossRef]
  25. Vieira Junior, P.A.; Dourado Neto, D.; Bernardes, M.S.; Fancelli, A.L.; Manfron, P.A.; Martin, T. Methodology for Estimating Leaf Area of Corn Genotypes. Rev. Bras. Milho Sorgo 2006, 5, 182–191. [Google Scholar] [CrossRef]
  26. Henrique, J.C.G.d.S.; de Oliveira, A.C.; da Silva, T.G.F.; Carvalho, L.H.M.; de Souza, E.J.O.; da Fonseca, G.R.F.; Santos, H.R.B.; Cruz, G.H. de L. Nitrogen and molybdenum fertilization influence on enzymatic activity and productivity enhancement of forage sorghum under water deficit in the Brazilian semi-arid region. J. Plant Nutr. 2024, 47, 2543–2570. [Google Scholar] [CrossRef]
  27. Rodrigues, J.C.; Souza, P.J.d.O.; Lima, R.T. Estimation of basal temperatures and thermal requirements in hoses in the northeast of the state of Pará. Braz. Fruit Grow. Mag. 2013, 35, 143–150. [Google Scholar]
  28. Basi, S.; Neumann, M.; Marafon, F.; Ueno, R.K.; Sandini, I.E. Influence of nitrogen fertilization on the quality of corn silage. Braz. J. Appl. Technol. Agric. Sci. 2011, 4, 219–234. [Google Scholar] [CrossRef]
  29. Tabosa, J.N.; da Silva, F.G.; do Nascimento, M.M.A.; Barros, A.H.C.; Brito, A.R.M.B.; Simplício, J.B. Forage Sorghum Genotypes in the Semiarid Region of Pernambuco and Alagoas—Estimates of Genetic Parameters of Production Variables. In Proceedings of the XXIX National Corn and Sorghum Congress, Aguas de Lindóia, São Paulo, Brazil, 26–30 August 2012. [Google Scholar]
  30. Soares, E.R.; Coutinho, E.L.M.; Ramos, S.B.; Da Silva, M.S.; Barbosa, J.C. Accumulation of dry matter and macronutrients in sweet sorghum cultivars. Agric. Sci. 2013, 35, 3015–3030. [Google Scholar] [CrossRef]
  31. Macedo, C.H.O.; Santos, E.M.; da Silva, T.C.; de Andrade, A.P.; da Silva, D.S.; da Silva, A.P.G.; de Oliveira, J.S. Production and Bromatological Composition of Sorghum (Sorghum Bicolor) Cultivated Under Doses of Nitrogen. Arch. Zootec. 2012, 61, 209–216. [Google Scholar] [CrossRef]
  32. Buso, W.H.D.; Morgado, H.S.; Silva, L.B.; França, A.F.S. Use of forage sorghum in animal feed. Revista Pubvet. 2011, 5, 1145. [Google Scholar] [CrossRef]
  33. Kaplan, M.; Kara, K.; Unlukara, A.; Kale, H.; Buyukkilic Beyzi, S.; Varol, I.S.; Kizilsimsek, M.; Kamalak, A. Water deficit and nitrogen affects yield and feed value of sorghum sudangrass silage. Agric. Water Manag. 2019, 218, 30–36. [Google Scholar] [CrossRef]
  34. Tang, C.; Yang, X.; Chen, X.; Ameen, A.; Xie, G. Sorghum biomass and quality and soil nitrogen balance response to nitrogen rate on semiarid marginal land. Field Crop. Res. 2018, 215, 12–22. [Google Scholar] [CrossRef]
  35. Reddy, P.S.; Gadi, J.; Rasineni, G.K.; Maheswari, M.; Reddy, A.R.; Varshney, R.K.; Kishor, P.B.F. Proline over-accumulation alleviates salt stress and protects photosynthetic and antioxidant enzyme activities in transgenic sorghum [Sorghum bicolor (L.) Moench]. Plant Physiol. Biochem. 2015, 94, 104–113. [Google Scholar] [CrossRef]
  36. Lima, N.V.; da Silva, R.A.; Trigueiro, R.W.d.P.; de Lima, A.V.; da Cruz Júnior, C.B. Bromatology of dry, organic and mineral matter, crude protein, ether extract and total digestible nutrients of forage species from the caatinga preferred by sheep in a semi-arid climate. J. Anim. Environ. Res. 2023, 5, 1–23. [Google Scholar]
  37. Rocha, J.E.d.S.; Tonucci, R.G.; Fernandes, F.É.d.P.; Magalhães, Y.A. Productivity and bromatological composition of sorghum hybrids cultivated in an agroforestry system in the semi-arid region. In Proceedings of the IX Northeastern Congress on Animal Production and XV Northeastern Symposium on Ruminant Feeding, Ilhéus, BA, Brazil, 11–14 November 2014. [Google Scholar] [CrossRef]
  38. Anfinrud, R.; Cihacek, L.; Johnson, B.L.; Ji, Y.; Berti, M.T. Sorghum and kenaf biomass yield and quality response to nitrogen fertilization in the Northern Great Plains of the USA. Ind. Crop. Prod. 2013, 50, 159–165. [Google Scholar] [CrossRef]
Figure 1. Location of the experimental area at the Academic Unit of Serra Talhada, Serra Talhada—PE, Brazil.
Grasses 04 00001 g001
Figure 2. Illustrative diagram of the experimental plot layout.
Grasses 04 00001 g002
Figure 3. Plant Height (PH), Stem Thickness (ST), Length of the Most Developed Leaf (LDL), Width of the Most Developed Leaf (WDL), Leaf Area (LA), and Number of Live Leaves (NLL) of sorghum SF-15 fertilized with increasing doses of nitrogen, associated or not with molybdenum, cultivated under water deficit conditions in the semiarid region of Pernambuco.
Grasses 04 00001 g003
Figure 4. Yield of natural mass (YNM), yield of dry mass (YDM), and crude protein production (CPP) of sorghum SF-15 fertilized with increasing doses of N, with or without Mo, grown under water deficit conditions in the semi-arid region of PE.
Grasses 04 00001 g004
Figure 5. Mineral matter (MM), organic matter (OM), crude protein (CP), and dry matter (DM) of sorghum SF-15 fertilized with increasing doses of N, with or without Mo, grown under water deficit conditions in the semi-arid region of PE.
Grasses 04 00001 g005
Figure 6. Graphical representation of the relationship between biometric variables (PH, TS, LDL, SD, NLL, NDL, WDL, LA), bromatological components (CP, NDF, DM, MM, OM), and yield (YNM, YDM, CPP) of sorghum SF-15 fertilized with increasing doses of N, with or without Mo, grown over three consecutive cycles under water deficit conditions in the semi-arid region of PE.
Grasses 04 00001 g006
Table 1. Chemical and physical attributes of Cambissolo Háplico Típico soil from the experimental area in Serra Talhada, PE, Brazil.
Chemical Attributes
Dep.PpHKMoNaAlCaSARMgH + AlCSCECVESPOM
cmmg/dm³ cmolc/dcm³%
0–203836.710.48<LQ0.1103.610.092.610.476.817.2893.541.511.14
20–403886.740.4<LQ0.1903.90.142.670.57.167.6693.472.480.94
Physical analysis
Dep.BDPDTPNAFFTTCSFSSilteArgila
cmg/cm3%%
0–201.612.5336.264.3259.0073.6044.5029.1015.9010.50
20–401.662.4732.804.3958.3172.2048.8823.3417.2010.50
Dep.—Depth; P—Phosphorus; pH—Hydrogen potential; K—Potassium; Mo—Molybdenum; Na—Sodium; Al—Aluminum; Ca—Calcium; SAR—Sodium Adsorption Ratio; Mg—Magnesium; H + Al—Potential Acidity; CS—Cation Sum ; CEC—Cation Exchange Capacity; V—Base Saturation; ESP—Exchangeable Sodium Percentage; OM—Organic Matter; LQ—Limit of Quantification; BD—Bulk Density; PD—Particle Density; TP—Total Porosity; NA—Natural Sand; FF—Flocculation Degree; TT—Total Sand; CS—Coarse Sand; FS—Fine Sand.
Table 2. Morphometric characteristics of the SF-15 sorghum fertilized with increasing doses of nitrogen (N) associated or not with molybdenum (Mo), cultivated under water deficit conditions in the semi-arid region of Pernambuco (PE).
CyclePH (cm)ST (mm)WDL (cm)LA (cm2)NLVNLDLDL (cm)
Plant131.47 b 13.75 b 61.25 b 281.75 b 7.07 a 5.15 b 73.75 c
Regrowth 1225.47 a 13.80 b 76.07 a 351.97 a 5.37 b 6.25 a 84.70 b
Regrowth 2220.90 a 16.32 a 76.97 a 338.37 a 7.32 a 5.17 b 98.97 a
CV (%) 9.47 13.60 7.68 10.41 9.29 14.96 17.02
p0.00 0.00 0.00 0.00 0.00 0.00 0.00
Mo doses (g ha−1) NLV
160 6.45 b
0 6.73 a
CV (%) 9.29
p 0.01
Cycle × N (Kg ha−1)PH (cm)ST (mm)WDL (cm)APW (cm)LA (cm2)NLVNLDLDL (cm)
Plant0 124.75 bA 12.00 bB 60.87 bA 5.87 aAB 262.62 bB 6.62 bB 6.12 aA 70.00 bA
Plant50 138.00 bA 14.87 abA 57.00 bA 6.25 aAB 259.25 bB 6.87 aAB 5.50 bAB 67.25 cA
Plant100 136.87 cA 12.87 bAB 60.12 bA 5.75 bB 252.25 cB 6.87 aAB 5.12 bAB 72.62 bA
Plant150 128.12 bA 13.87 aAB 63.62 bA 6.37 aAB 312.37 bA 7.62 aA 4.50 cB 77.37 bA
Plant300 129.62 bA 15.12 abA 64.62 bA 6.75 aA 322.25 bA 7.37 aAB 4.50 bB 81.50 aA
Regrowth 10 139.25 abC 13.12 bA 72.37 aB 5.12 aB 258.12 bB 5.75 cA 5.37 abB 83.87 abA
Regrowth 150 241.50 aB 14.00 bA 80.37 aA 6.12 aA 372.37 aA 5.12 bA 6.75 aA 85.37 bA
Regrowth 1100 272.75 aA 15.00 abA 73.12 aB 6.62 aA 362.12 aA 5.25 bA 6.25 aAB 80.75 abA
Regrowth 1150 231.62 aB 13.75 aA 77.25 aB 6.87 aA 393.75 aA 5.37 bA 6.75 aA 85.87 abA
Regrowth 1300 242.25 aB 13.12 bA 77.25 aB 6.50 aA 373.50 aA 5.37 bA 6.12 aAB 87.62 aA
Regrowth 20 153.87 aB 16.00 aA 75.87 aA 5.50 aB 310.50 aBC 7.87 aA 4.62 bB 96.25 aA
Regrowth 2 50 225.87 aA 16.50 aA 77.75 aA 6.50 aA 365.00 aA 7.00 aB 5.87 abA 110.75 aA
Regrowth 2100 235.62 bA 15.87 aA 74.87 aA 5.37 bB 297.75 bC 7.00 aB 4.50 bB 95.75 aA
Regrowth 2 150 247.87 aA 15.87 aA 75.87 aA 6.62 aA 364.62 aA 7.50 aAB 5.62 bAB 95.87 aA
Regrowth 2 300 241.25 aA 17.37 aA 80.50 aA 6.00 aAB 354.00 abB 7.25 aAB 5.23 abB 96,25 aA
CV (%) 9.7013.60 7.68 11.38 10.41 9.29 14.96 17.02
p0.00 0.00 0.00 0.00 0.00 0.03 0.00 0.00
Cycle × Mo (g ha−1)ST (mm) WDL (cm) NLVNLDLDL (cm)
Plant013.90 bA 59.55 bA 6.75 bB 5.35 bA 72.95 bA
Plant 16013.60 bA 62.95 bA 7.40 aA 5.05 bA 74.55 cA
Regrowth 1013.35 bA 76.85 aA 5.25 cA 6.15 aA 83.50 bA
Regrowth 116014.25 bA 75.30 aA 5.50 bA 6.35 aA 85.90 bA
Regrowth 2016.05 aA 77.80 aA 7.35 aA 5.20 bA 95.30 aA
Regrowth 2 16016.60 aA 76.15 aA 7.30 aA 5.15 bA 102.65 aA
CV (%) 13.60 7.68 9.29 14.96 17.02
p0.00 0.00 0.030.00 0.00
N (kg ha−1) × Mo (g ha−1)PH (cm)ST (mm)WDL (cm) NLVNLDLDL (cm)
0 0 132.75 bA 13.66 aA 65.83 cB 6.58 aA 5.33 bA 80.75 aA
50 0 217.83 aA 14.58 aA 73.58 aA 6.16 aA 6.58 aA 82.91 aA
100 0 199.25 aB 14.25 aA 69.58 bA 6.66 aA 4.91 bB 84.50 aA
150 0 202.08 aA 14.41 aA 71.58 aA 6.58 aB 5.75 abA 84.58 aA
300 0 204.25 aA 15.25 aA 76.41 aA 6.25 aB 5.08 bA 86.83 aA
0 160 145.83 cA 13.75 aA 73.58 aA 6.91 aA 5.41 aA 86.26 aA
50 160 187.75 bB 14.58 aA 69.83 aA 6.50 abA 5.66 aB 83.16 aA
100 160 230.91 aA 14.75 aA 69.16 aA 6.08 bB 5.50 aA 88.25 aA
150 160 203.00 bA 16.00 aA 72.91 aA 7.08 aA 5.50 aA 92.33 aA
300 160 204.50 bA 15.00 aA 71.83 aB 7.08 aA 5.50 aA 88.75 aA
CV (%) 9.70 13.607.68 9.29 14.96 17.02
p0.00 0.00 0.00 0.03 0.00 0.00
C × N × MoPH (cm)ST (mm)WDL (cm)NLVNLDLA (cm2)LDL (cm)
Plant0 0 126.75 aAa 12.50 aa 57.25 bAb 6.50 abAa 6.25 aAa 251.25 ba 68.50 aAa
Plant50 0 147.00 cAa 15.50 aAa 59.00 bAb 6.50 abAa 5.75 bABa 282.75 ba 65.25 bAa
Plant100 0 135.25 ba 13.25 aAa 58.75 bAb 7.25 aA 4.75 abAa 248.50 bAa 75.75 aAa
Plant150 0 126.25 ba 13.75 aAa 59.75 bb 6.75 bAb 5.25 aABa 299.25 ba 74.50 aAa
Plant300 0 134.50 bAa 14.50 abAa 63.00 bAb 8.50 aAb 4.25 bBa 291.75 bb 80.75 aAa
Plant0 160 122.75 ba 11.50 bBa 64.50 bBb 6.75 bCa 6.00 aAa 274.00 aCa 71.50 bAa
Plant50 160 129.00 bAa 14.25 aBa 55.00 bBb 7.25 aBCa 5.25 aABa 235.75 ba 69.25 bAa
Plant100 160 138.50 caAa 12.50 aABa 61.50 bBb 6.50 aCa 5.50 abAa 256.00 bCa 69.50 bAa
Plant150 160 130.00 bAa 14.00 aABa 67.50 bAa 8.50 aAb 3.75 bBb 325.50 bABa 80.25 aAa
Plant300 160 124.75 ba 15.75 aAa 66.25 bAb 8.00 aABa 4.75 bABa 352.75 aAa 82.25 aAa
Regrowth 10 0 120.75 aCb 13.25 aAa 68.00 aBb 5.75 aBa 5.00 abBa 223.00 bBb 80.50 aAa
Regrowth 150 0 274.75 aAa 13.75 aAa 81.75 aAb 5.00 bAa 7.50 aABa 389.25 aAa 85.25 bAa
Regrowth 1100 0 240.25 aBb 14.50 aAa 74.0 aABa 5.50 bAa 6.50 aABa 369.25 aAa 80.00 aAa
Regrowth 1150 0 233.75 aBa 13.25 aAa 77.0 aABa 5.00 cAa 6.50 aABa 391.00 aAa 85.25 aAa
Regrowth 1300 0 235.50 aBa 12.00 bAa 83.50 aAa 5.00 bA 5.75 aBa 391.50 aAa 86.50 aAa
Regrowth 10 160 157.75 aDa 13.00 bAa 76.75 aa 5.75 bAa 5.75 abAa 293.25 aBa 87.25 abAa
Regrowth 150 160 208.25 aCb 14.25 aAa 79.00 aAa 5.25 bAa 6.00 aAb 355.50 aABa 85.50 bAa
Regrowth 1100 160 305.25 aAa 15.5 aAa 72.25 aAa 5.00 bAa 6.50 aAa 355.00 aABa 81.5 abAa
Regrowth 1150 160 229.50 aBa 14.25 aAa 77.50 aAa 5.75 Baa 7.00 aAa 396.50 aAa 86.50 aAa
Regrowth 1300 160 249.00 aBa 14.25 bAa 71.00 abAb 5.75 bAa 6.50 aAa 355.50 aAa 88.75 aAa
Regrowth 20 0 150.75 aBa 15.25 aAa 72.25 aAa 7.50 aAa 4.75 bBa 323.50 aABa 93.25 aAa
Regrowth 250 0 231.75 ba 16.50 aAa 80.00 aAa 7.00 Aaa 6.50 abAa 372.75 aAa 110.0 aAa
Regrowth 2100 0 222.25 aAb 16.00 aAa 76.00 aAa 7.25 aAa 4.00 bBa 297.25 bBa 93.00 aAa
Regrowth 2150 0 246.25 aAa 15.75 aAa 78.00 aAa 8.0 aAa 5.5 aABa 374.50 aAa 93.75 aAa
Regrowth 2300 0 242.75 aAa 16.75 aAa 82.75 aAa 7.0 aAa 5.25 abAa 357.5 aABa 86.50 aAa
Regrowth 20 160 157.0 aBa 16.75 aAa 79.50 aAa 8.25 aAa 4.50 bAa 297.50 aAa 99.25 aAa
Regrowth 250 160 220.0 aAa 16.50 aAa 75.5 aAa 7.0 aBa 5.25 aABb 357.25 aAa 111.5 aAa
Regrowth 2100 160 249.0 bAa 15.75 aAa 73.75 aAa 6.75 aBa 5.00 bAa 298.25 aba 98.5 aAa
Regrowth 2150 160 249.50 aAa 16.00 aAa 73.75 aAa 7.0 aBb 5.75 aAa 354.75 aba 98.00 aAa
Regrowth 2300 160 239.75 aAa 18.00 aAa 78.25 aAa 7.5 aABa 5.25 abAa 350.50 aAa 106.00 aAa
CV (%) 9.7 13.6 7.68 9.29 14.96 10.41 17.02
p0.00 0.00 0.00 0.03 0.00 0.04 0.00
PH = Plant Height; LDL = Length of the most Developed Leaf; ST = Stem Thickness; NLV = Number of Live Leaves; NDL = Number of Dead Leaves; WDL = Width of the Most Developed Leaf; LA = Leaf Area; APW = Average Plant Width. In the Cycle x N interactions, lowercase letters refer to the cycles and uppercase letters to the nitrogen doses; in Cycle x Mo, lowercase letters refer to the cycles and uppercase letters to the molybdenum doses; in N × Mo, lowercase letters refer to nitrogen and uppercase letters to the molybdenum doses; in C × N × Mo, lowercase letters refer to the cycles, italicized lowercase letters to molybdenum doses, and uppercase letters to nitrogen doses. Means followed by the same letter do not differ statistically according to Tukey’s test at 5%.
Table 3. Yield of sorghum SF-15 fertilized with increasing doses of N, with or without Mo, grown under water deficit conditions in the semi-arid region of PE.
CycleYNM (t ha−1)YDM (t ha−1)CPP (t ha−1)
Plant14.10 c 3.69 c 0.26 c
Regrowth 121.71 a6.68 a 0.43 a
Regrowth 218.97 b 5.18 b 0.30 b
CV (%) 38.8 39.03 36.49
p0.00 0.00 0.00
Cycle × N (Kg ha−1)YNM (t ha−1)YDM (t ha−1)CPP (t ha−1)
Plant09.68 aA 2.54 aA 0.15 aC
Plant5015.75 aA 4.22 bA 0.29 aB
Plant10014.56 bA 3.86 bA 0.20 bB
Plant15012.55 aA 3.16 bA 0.24 bC
Plant30017.93 aA 4.66 bA 0.44 aB
Regrowth 1010.16 aC 2.46 aC 0.11 aB
Regrowth 15022.59 aAB 6.92 aB 0.37 aA
Regrowth 110031.87 aA 10.27 aA 0.59 aA
Regrowth 115020.85 aB 6.53 aB 0.46 aA
Regrowth 130023.09 aAB 7.21 aB 0.62 aA
Regrowth 209.48 aB 2.15 aB 0.17 aA
Regrowth 25020.40 aA 5.83 bA 0.29 aB
Regrowth 210019.51 bA 5.51 bA 0.25 bB
Regrowth 215020.11 aA 5.29 abA 0.32 abB
Regrowth 230025.34 aA 7.11 aA 0.45 aC
CV (%) 38.8 39.03 36.49
p0.04 0.000.01
Yield of natural mass (YNM), yield of dry mass (YDM), and crude protein production (CPP). In the Cycle × N interactions, lowercase letters refer to cycles, while uppercase letters indicate nitrogen doses. Means followed by the same letter do not differ statistically according to Tukey’s test at 5%.
Table 4. Bromatological components of sorghum SF-15 fertilized with increasing doses of N, with or without Mo, grown under water deficit conditions in the semi-arid region of PE.
CycleCP (%)DM (%)NDF (%)MM (%)OM (%)
Plant7.07 a 26.25 c 66.22 b 6.95 a 93.05 c
Regrowth 16.27 b 29.95 a 67.95 a 6.52 b 93.47 b
Regrowth 26.10 b 26.85 b 66.42 b 5.87 c 94.15 a
CV (%) 12.15 3.33 4.68 7.37 10.51
p0.00 0.00 0.03 0.00 0.00
Cycle × N (Kg ha−1)PB (%)DM (%)NDF (%)OM (%)
Plant 0 6.12 bCD 26.50 abA 67.00 aA 93.00 bA
Plant 50 6.75 aBC 26.87 aA 66.00 bA 93.12 aA
Plant 100 5.50 abD 26.50 abA 66.75 abA 93.12 aA
Plant 150 7.62 aB 25.50 bA 65.25 cA93.12 aA
Plant 300 9.37 aA 25.87 abA 66.12 bA 92.87 cA
Regrowth 1 0 4.62 cD 24.00 cA 71.37 aA 92.25 bC
Regrowth 150 5.37 bCD 30.62 bA 68.37 bAB 93.25 bB
Regrowth 1100 5.87 bC 32.25 aA 68.75 abA 94.60 aA
Regrowth 1150 7.12 abB 31.25 abA 64.12 cB 93.75 bB
Regrowth 1300 8.37 aA 31.62 abA 67.12 cAB 93.50 bB
Regrowth 2 0 8.00 aA 22.75 cA 63.37 cB92.25 bB
Regrowth 250 5.12 cC 28.50 aA 66.25 bAB94.62 aA
Regrowth 2100 4.75 cC 28.37 aA 68.00 aA 94.50 aA
Regrowth 2150 6.25 bB 26.37 bA 67.87 aAB 94.50 aA
Regrowth 2300 6.37 bB 28.25 aA 66.62 bAB 94.87 aA
CV (%) 12.15 3.33 4.86 10.51
p0.00 0.00 0.00 0.00
Cycle × Mo (g ha−1)CP (%) DM (%)
Planta 0 7.10 aA 26.85 bA
Planta 160 7.05 aA 25.65 cB
Regrowth 10 6.35 bA 29.60 aB
Regrowth 1160 6.20 bA 30.30 aA
Regrowth 20 5.90 bA 27.05 bA
Regrowth 2160 6.30 bA 26.65 bA
CV (%) 12.15 3.33
p0.00 0.00
N (kg ha−1) × Mo (g ha−1)CP (%)DM (%)NDF (%)MM (%)
0 0 6.25 bcA 25.25 cA 68.83 aA 7.58 aA
50 0 5.75 cA 29.33 aA 67.91 abA 6.25 bA
100 0 5.50 cA 28.58 abB 68.08 abA 6.00 bA
150 0 6.75 bA 28.08 bA 65.58 abA 6.25 bA
300 0 8.00 aA 28.91 abA 65.0 bB 6.33 bA
0 160 6.25 bA 24.58 cA 65.66 aB 7.50 aA
50 160 5.75 bcA 28.00 bA 65.83 aA 6.41 bA
100 160 5.25 cA 29.50 aA 67.58 aA 5.83 cA
150 160 7.25 aA 27.33 bB 65.91 aA 6.16 bcA
300 160 8.08 aA 28.25 bA 68.25 aA 6.16 bcA
CV (%) 12.15 3.33 4.86 7.37
p0.00 0.00 0.01 0.00
C × N × MoCP (%)DM (%)
Plant0 0 6.25 bBCa 26.00 aAa
Plant50 0 7.00 aBCa 27.75 bAa
Plant100 0 5.75 aCa 26.75 bAa
Plant150 0 7.50 aABa 27.75 bAa
Plant300 0 9.00 aAa 26.00 cAa
Plant0 160 6.00 bCa 27.00 aAa
Plant50 160 6.50 aBCa 26.00 cAa
Plant100 160 5.25 aCa 26.25 cAa
Plant150 160 7.75 aBa 23.25 cBb
Plant300 160 9.75 aAa 25.75 bAa
Regrowth 10 0 4.25 cCa 23.25 bBb
Regrowth 150 0 5.50 bBCa 31.00 aAa
Regrowth 1100 0 6.00 aBa 32.00 aAa
Regrowth 1150 0 7.00 abBa 30.50 aAb
Regrowth 1300 0 9.00 aAa 31.25 aAa
Regrowth 10 160 5.00 bCa 24.75 bCa
Regrowth 150 160 5.25 aCa 30.25 aBa
Regrowth 1100 160 5.75 aBCa 32.50 aAa
Regrowth 1150 160 7.25 aABa 32.00 aABa
Regrowth 1300 160 7.75 bAb 32.00 aABa
Regrowth 20 0 8.25 aAa 23.50 bCa
Regrowth 250 0 4.75 bBa 29.25 bAa
Regrowth 2100 0 4.75 aBa 27.00 bBb
Regrowth 2150 0 5.75 bBa 26.00 cBa
Regrowth 2300 0 6.00 bBa 29.50 bAa
Regrowth 20 160 7.75 aAa 22.00 cCb
Regrowth 250 160 5.50 aCa 27.75 bBb
Regrowth 2100 160 4.75 aCa 29.75 bAa
Regrowth 2150 160 6.75 aABa 26.75 bBa
Regrowth 2300 160 6.75 bABb27.00 bBb
CV (%) 12.15 3.33
p0.00 0.00
CP = Crude Protein; DM = Dry Matter; NDF = Neutral Detergent Fiber; MM = Mineral Matter; OM = Organic Matter. In the Cycle × N interactions, lowercase letters refer to cycles and uppercase letters to nitrogen doses; in Cycle × Mo interactions, lowercase letters refer to cycles and uppercase letters to molybdenum doses; in N × Mo interactions, lowercase letters refer to cycles and uppercase letters to molybdenum doses; in C × N × Mo interactions, lowercase letters refer to cycles, lowercase italic letters to nitrogen doses, and uppercase letters to molybdenum doses. Means followed by the same letter do not differ statistically according to Tukey’s test at 5%.
Disclaimer/Publisher’s Note: The statements, opinions and data contained in all publications are solely those of the individual author(s) and contributor(s) and not of MDPI and/or the editor(s). MDPI and/or the editor(s) disclaim responsibility for any injury to people or property resulting from any ideas, methods, instructions or products referred to in the content.

