Article

Dynamics of Mulatto Grass Regrowth Depending on Rotational Cattle Grazing Management

by
Carlindo Santos Rodrigues
1,*,
Márcia Cristina Teixeira da Silveira
2,
Leandro Martins Barbero
3,
Salim Jacaúna Sousa Júnior
4,
Veridiana Aparecida Limão
3,
Guilherme Pontes Silva
5,
Sila Carneiro da Silva
5 and
Domicio do Nascimento Júnior
6,†
1
Federal Institute of Education, Sciences and Technology Baiano—IF Baiano, João do Nascimento Avenue, Campus Uruçuca, Uruçuca 45680-000, BA, Brazil
2
Embrapa Maize and Sorghum, Sete Lagoas 35701-970, MG, Brazil
3
Faculty of Veterinary Medicine—FVM, Federal University of Uberlândia—FUU, Pará Avenue, 1720 Bloco 2T, Uberlândia 38400-902, MG, Brazil
4
Faculty of Agronomic Engineering—FAE, Federal University of Pará, Belém 66050-060, PA, Brazil
5
School of Agriculture “Luiz de Queiroz”, Department of Animal Science, University of São Paulo, Pádua Dias Avenue, Piracicaba 13418-900, SP, Brazil
6
Department of Animal Science, Federal University of Viçosa—UFV, Avenida P.H. Rolfs, s/n, Campus Universitário, Viçosa 36570-900, MG, Brazil
*
Author to whom correspondence should be addressed.
Deceased author.
Grasses 2024, 3(3), 174-189; https://doi.org/10.3390/grasses3030013
Submission received: 25 April 2024 / Revised: 23 July 2024 / Accepted: 24 July 2024 / Published: 3 September 2024

Abstract

:
This study was carried out to characterize the dynamics of forage accumulation during the regrowth of Mulatto grass submitted to rotational grazing strategies. The treatments corresponded to combinations between two pre-grazing conditions (95% and a maximum light interception during regrowth—LI95% and LIMax) and two post-grazing conditions (post-grazing heights of 15 and 20 cm), according to a 2 × 2 factorial arrangement and randomized complete block design, with four replications. Rates of leaf growth (LGR), stems growth (SGR), total growth (TGR), leaf senescence (LSR), grass accumulation (GAR) (kg·ha−1·day−1), and the senescence/canopy growth ratio during different stages of regrowth. There was no difference between the management strategies for TGR. However, a higher GAR was reported for pastures managed with LI95% relative to LIMax, of 161.7 and 120.2 kg DM ha−1·day−1, respectively. Pastures managed with LI95% have a lower SGR in the intermediate and final regrowth period, reflecting the efficient control in the stalks production. On the other hand, in pastures managed, the LIMax showed higher SGR and LSR in the final regrowth phase. Thus, the LAI was higher in pastures managed at LI95% compared to those managed at LIMax, of 163.9 and 112.7 kg DM ha−1·day−1, respectively. Mulatto grass pastures, which were managed at LI95% pre-grazing, corresponded to approximately 30 cm in height, showed higher LAI, and ensured a low SGR throughout the regrowth period, constituting a more efficient management strategy.

1. Introduction

Livestock production in pastures occurs predominantly in tropical areas [1,2,3], characterized by environments of high solar radiation, temperature, and rainfall. These conditions favor the higher productivity of C4 grasses compared to C3 species, resulting in the higher efficiency of water and nitrogen use of the former under conditions of high temperatures [4,5].
In Brazil, a significant increase in the productivity of cultivated pastures has been observed in the last years, mainly due to the adoption of new technologies by the ranchers, including the use of new fodder options [6]. There is a serious lack of diversity among cultivated species, with only one cultivar, Brachiaria brizantha cv. Marandu (Marandu grass), dominating 45% of the pasture area and 60% of the seeds sold, while the other forage species, in their rich variety, are neglected [7]. However, monoculture makes the activity vulnerable, so it is essential to introduce new forage species to increase pasture diversification, with advantages not only for the environment but above all to ensure more rational exploitation of livestock [7].
In this scenario, Mulatto grass, a hybrid of Brachiaria (Brachiaria ruziziensis × Brachiaria brizantha cv. Marandu) [8], has been highlighted as an option for good adaptation to soils with low fertility, with good persistence, even under dry matter, good forage production and nutritive value [9,10,11,12]. However, little is known about its pattern of growth and accumulation of forage during regrowth when managed intermittently, a condition that hinders the achievement of its productive potential and adoption by the rural producers.
The management of tropical forages requires special care, as they present with rapid growth and a sharp decline in nutritional quality [13]. Therefore, understanding the growth processes of forage plants is the first step in the definition of grazing management’s rational strategies. After defoliation, a series of physiological and morphological responses are triggered. These effects, in an integrated way, provide the restoration of the canopy for the growth and senescence processes, guaranteeing the persistence of the plant in the plant community [14]. The recovery of the canopy after defoliation is a dynamic process during the regrowth period, as a function of the grazing management strategy used (a combination of the frequency and severity of defoliation). It determines the reestablishment of the pasture area of the pastures and, consequently, the quantity and morphological composition of the forage produced.
The growth of a crop is a function of the interception of the incident light (IL) by the sward canopy through its leaf area index (LAI) [15]. In tropical pastures, evident progress in grazing management was obtained from using the light interception concept to evaluate the most appropriate moment to interrupt the regrowth of forage grasses and establish targets or management goals (e.g., height of the grass for animals to enter and exit the paddocks). High-performance indexes and animal productivity were obtained when regrowth was interrupted when the sward canopy reached 95% interception of the incident light. In this condition, there was a higher dry matter yield of leaves and forage with a low proportion of stalks and dead material. Consequently, this ensured forage of good nutritional value, high consumption, and grazing efficiency [16,17,18,19,20,21,22,23,24,25].
Under these management conditions, parameters such as leaf and stem growth rates, as well as senescence rates, forage accumulation, and leaf area index are essential for understanding the dynamics of post-grazing regrowth [26,27]. In this way, enabling the understanding of the functional responses of grass subjected to grazing by cattle leads to solid and efficient pasture management planning.
Similar information is scarce in the literature for Mulatto grass. Thus, this work aimed to evaluate the process of forage accumulation (growth and senescence) during the regrowth of managed Mulatto grass using light interception criteria to identify suitable targets for the height at which animals enter and exit the paddocks. With this, determining the Mulatto grass regrowth stages that present the best forage accumulation rates makes it possible to identify the ideal times to reintroduce cattle to the pasture, ensuring the efficient use of forage and minimizing the environmental impact of grazing. This study aims to evaluate the dynamics of growth rates and leaf senescence of Mulatto grass in response to different grazing strategies, making it possible to understand the grazing strategy that increases the efficiency of forage harvesting by the animal.

2. Materials and Methods

2.1. Location of the Experiment and Climatic Conditions

The experiment was conducted at Piracicaba, state of São Paulo, Brazil, (22°42′ S, 47°37′ W and 550 m a.s.l). The experiment was established on a moderately rolling transition between a Mollisol and a Vertisol (USDA Soil Taxonomy) of high fertility. The soil of the 0–20 cm layer [28] had the following chemical composition: 0.01 M CaCl2; pH = 5.5; organic matter = 38.5 g dm−3; P (ion-exchange resin) = 82 mg dm−3; Ca = 104 mmolc dm−3; Mg = 30 mmolc dm−3, K = 6.4 mmolc dm−3; H + Al = 30 mmolc dm−3; sum of bases = 140 mmolc dm−3; cation exchange capacity = 171 mmolc dm−3; and base saturation = 82%).
According to the Köppen classification, the climate is Cwa type (i.e., mesothermal humid subtropical with a dry winter). Information regarding the climatic conditions during the experimental period was obtained from a meteorological station located approximately 500 m from the experimental site.
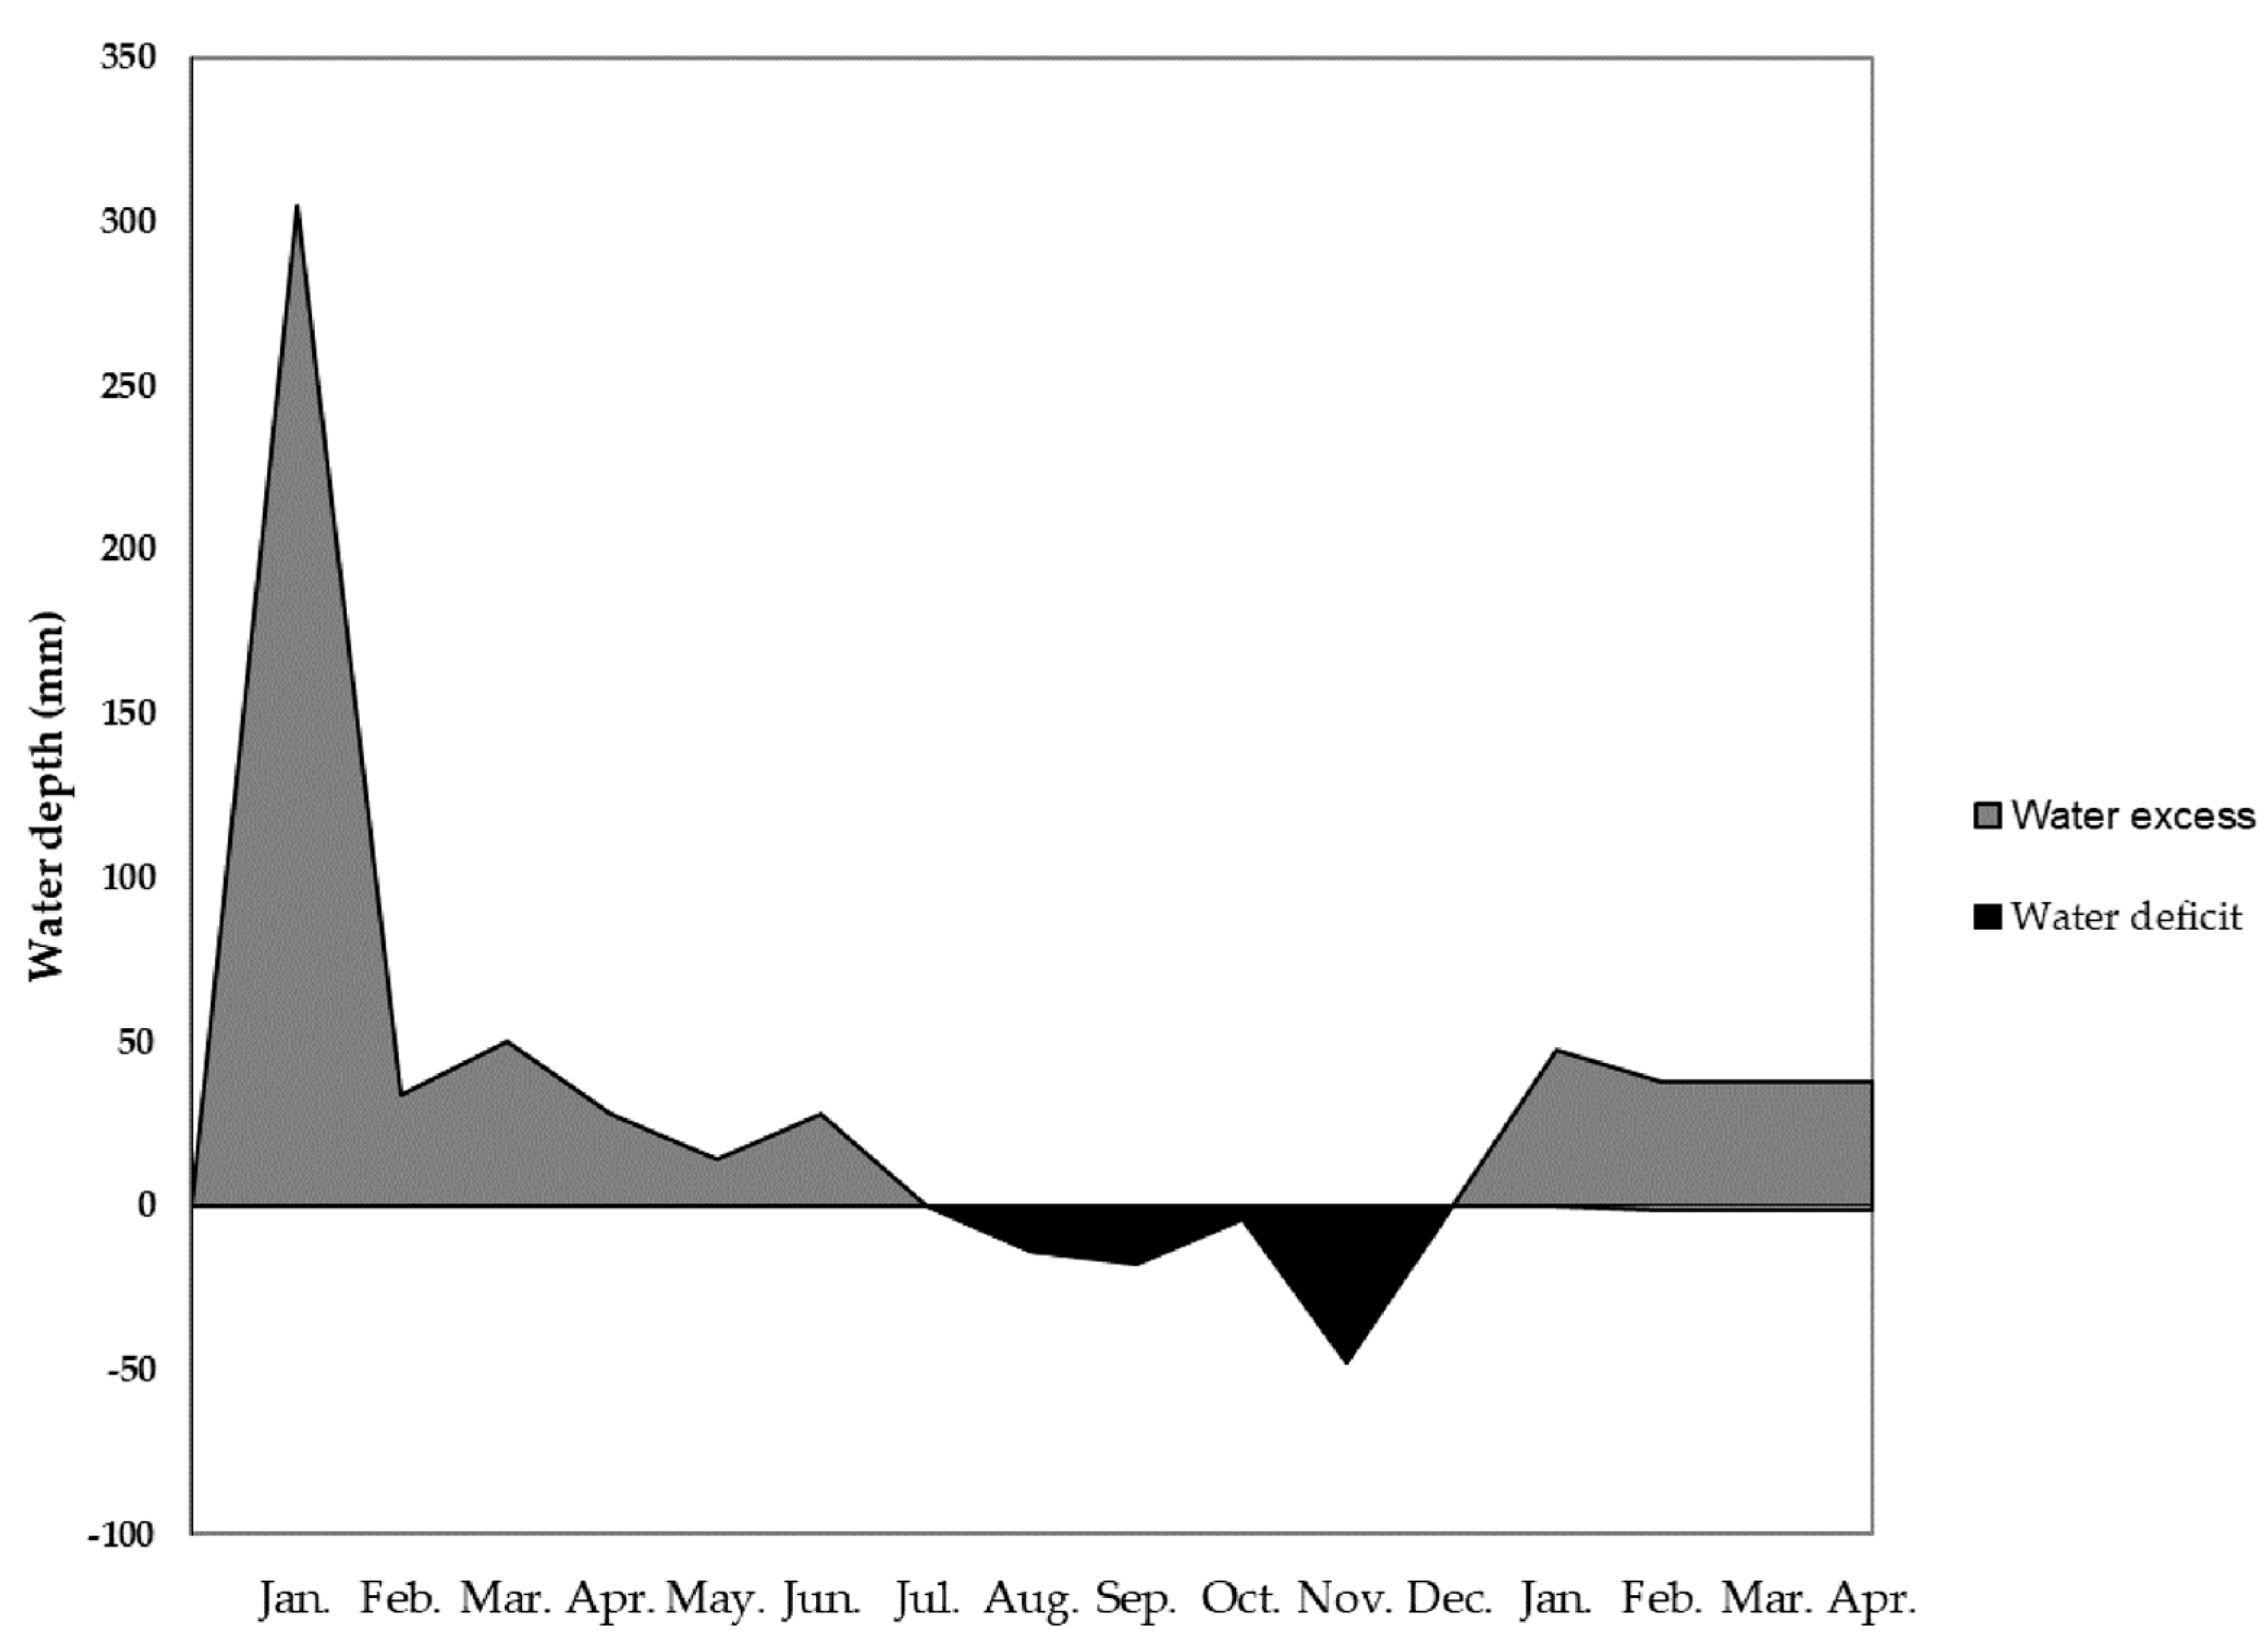
The climatic data for the experimental period were collected monthly, being evaluated as the average maximum, mean, and minimum temperatures, and precipitation measured (Figure 1). Besides, data were used to calculate monthly soil water balance [29] using 50 mm as available water capacity (AWC) (Figure 2).

2.2. Plant Material and Implementation of the Experiment

The pasture of Brachiaria hybrid Mulato (CIAT 36061) (mulatto grass) was established in November 2004. Since its implantation, the area was used for intermittent stocking with beef cattle until November 2007. Then, it was submitted to grazing and subsequent grazing of uniformity to approximately 10 cm of the soil. After mowing, 60 kg ha−1 of nitrogen was applied in the form of ammonium nitrate. After that, the monitoring of the pastures started to be implemented for the experimental treatments. In total, 270 kg ha−1 of N was applied during the rainy season (late spring and summer), including initial fertilization. The experiment started in January 2008, after a complete grazing cycle in all experimental paddocks, a condition in which post-grazing height targets was established and ended in April 2009.
It is important to highlight that the research was carried out during this period, however, the questions raised and the parameters studied are very important and current for animal production in pastures, as they affect the yield and nutritional value of the forage. Therefore, the research carried out has a great practical dimension, indicating the possibilities of using Mulatto grass in the rational management of pastures in Brazil and other parts of the world under similar climatic conditions.

2.3. Treatments, Experimental Design

The treatments corresponded to combinations between two pre-grazing conditions (95% or maximum interception of the light incident during LI95% regrowth or LIMax, respectively) and two post-grazing conditions (15 and 20 cm post-grazing heights), and were allocated to the experimental units (paddocks of 1.200 m2 each) according to a 2 × 2 factorial arrangement and a complete randomized complete block design with four replications. The grazing was performed by heifers of the Nelore and Canchim breeds with the initial weight of 270 kg, and the number of animals used was scaled so that the grazing occurred in no more than 12 h (“mob grazing”, Gildersleeve et al. [30]).

2.4. Data Collection and Sampling

The light intercepted by the forage canopy was evaluated using the canopy analyzer (LI-COR model LAI 2000, Lincoln, NE, USA). Measurements were made right after the animals left the paddocks, and after that, weekly during regrowth until LI90% was reached. From that point, readings began to be performed every two days until 95 and/or the maximum of light interception by the canopy were reached. Maximum LI was characterized in the condition that the light interception did not increase during two consecutive readings and corresponded to the value of approximately 99%. Measurements were performed at ten measurement stations per experimental unit. In this way, at the locations the heights represented the average pasture condition at the time of sampling and corresponded to a reading above the canopy and five readings at the ground level at each station. So, ten readings were made above the canopy, and, 50 readings at ground level, per paddock. The height of the canopy was determined with the same frequency of light interception measurements using a sward stick, and 100 measurements were taken along a priori defined trajectories and used consistently throughout the experimental period for each paddock.
The leaf area index (LAI) was determined from forage samplings in the pre- and post-grazing in paddock locations that represented the average condition of the pastures at the time of sampling (height assessment), using a metal frame measuring 0.90 × 0.37 m (0.333 m2). Three samples were collected per paddock, cutting the forage at ground level. The material was taken to the laboratory, where the leaf blades of the stem were manually separated. The leaf blades were passed through the integrated leaf area (Apparatus Li-Cor.Inc.modeloLAI-3100 Area Meter), to determine the leaf area of the samples and the values in the LAI calculation of pastures.
Forage mass sampling was carried out at pre- and post-grazing locations in paddocks representative of the average pasture condition at the time of sampling (evaluation of forage height and mass), using a 0.90 × 0.37 m metal frame. (0.333 m2). Three samples were collected per paddock, which were combined to form a composite sample. The leaf blades were passed through the leaf area integrator (LI-Cor. Apparatus LAI-3100 Area Meter2), to determine the leaf area of the sample and the values used in the calculation of the leaf area index (LAI) of the pastures.
The evaluations of the forage accumulation process during regrowth reported in this study were performed during the second growing season (January to April 2009), after a year of the imposition of treatments to experimental paddocks. To estimate the dynamics of forage accumulation (growth and senescence rates), basal and aerial tillers were marked on all paddocks at each grazing cycle [31]. The marking was always done in the post-grazing condition using sites that corresponded to points representing the average condition of the paddocks at the time of marking (visual evaluation of the forage mass and height of the pasture). Ten tillers were randomly marked every 20 cm in a straight line at three paddock sites, totaling 30 tillers per trough and 120 tillers per treatment. At each grazing cycle, a new tiller group was selected for the evaluations.
At every 3 and 4 days (twice a week), all tillers were evaluated for the following characteristics: (a) leaf blade length and (b) classified as expanding, expanded, senescent, or dead leaf. The leaves were classified as expanding when their ligule was not exposed; expanded when ligule was visible and/or its growth ceased (a fact that was considered after two consecutive evaluations with zero variation in leaf blade length); senescent when part of the leaf blade showed signs of senescence (yellowing and/or necrosis in any region of the leaf blade); and dead when more than 50% of the leaf limbus was compromised by senescence.
Leaf length was measured according to the stage of development of the leaves. For expanded leaves, the length was measured from the tip of the leaf to its ligule. In the case of expanding leaves, the same procedure was adopted, however, considering the last expanded leaflet as the reference for measurement. For leaves in senescence, instead of the tip of the leaf, the point was considered until senescence was detected, that is, yellowing and/or necrosis of the green part of the leaf blade. The distance from the soil (or insertion point, in the case of aerial tillers) to the last fully expanded leaflet was used to measure the stem length.
The length variation of each leaf blade and stem, at each sampling date, allowed the calculation of the stretching and senescence rates (in cm tillers−1-day−1). Positive variations in length allowed calculation of elongation rates for leaves and stems. The reduction in the green leaf fraction of senescent leaves (negative variations in length) allowed for the calculation of senescence rates.
On the last day of each evaluation period, all the marked tillers were collected (cut at the soil level or the insertion point in the main tiller in the case of aerial tillers), placed in plastic bags, and taken immediately to the cold room to minimize losses per breath and evaporation. Manual separation of leaf blades, stems (stem + leaf sheaths), and senescent/dead material was carried out, which the material was then taken to oven drying at 65 °C for 72 h. After drying, the material was weighed and the mass of each component divided by the total length, thus generating a gravimetric conversion factor (g cm−1) used to transform all field measurements, expressed in cm tillers−1 day−1, in g tillers−1 day−1. The final transformation for kg ha−1·day−1 of forage dry mass was performed by multiplying these values by the population density of tillers in each paddock, determined in a concomitant experiment in the same experimental area [32].
The sum of leaf growth with stem growth gave rise to total growth (Equation (1)). Besides, the difference between total growth and senescence values allowed the calculation of forage accumulation rates (Equation (2)):
Total growth (kg ha−1·day−1) = Leaf growth + Stem growth,
Forage accumulation (kg ha−1·day−1) = Growth − Senescense,
It was also calculated for the participation of senescence as the proportion of growth (Equation (3)) [33]:
Senescense/Growth ratio = (Senescense/Growth),

2.5. Statistical Analysis

As the regrowth period was variable for each experimental unit and treatment, depending on how the treatments were defined, the regrowth period for each paddock was divided into three sub-periods (initial phase, intermediate phase, and final phase), and rate calculations of leaf and stem growth, senescence, and forage accumulation were carried out using tiller population density values measured throughout the grazing cycles during the experimental period.
The variables leaf growth rate, leaf senescence rate, stem growth rate, total growth rate (leaves + stems), forage accumulation rate, and senescence/growth ratio were subjected to analysis of variance using PROC MIXED statistical package SAS® (Statistical Analysis System), version 9.2 for Windows® [34]. Akaike’s Information Criterion was used in the choice of variance and covariance matrix [35]. Thus, it was possible to detect the effects of the main causes of variation (pre-grazing light interception, post-grazing height, and regrowth phase) as well as the interaction between them. The effects of pre-grazing, post-grazing height, and regrowth phase and their interactions were considered fixed effects, and blocks considered random effects [36].
The means of the treatments were estimated using the “LSMEANS” and, the comparison between them using the probability of the difference (“PDIFF”). Differences were declared significant at p < 0.05. Quadratic regressions were used to assess the relationship between leaf area index and canopy light interception and were performed using the R software (version 3.1.2); R Development Core Team [37].

3. Results

The mean values of light interception in the pastures managed with the LI95% target were about 15% higher than those obtained with the LIMax target in the initial regrowth phase (Table 1). However, in the intermediate phase, pastures managed with the LIMax target showed values that were already equivalent to the values of the final phase of pastures, which was managed with LI95% target. The mean LI values reached in the final regrowth phase in the pastures managed with the LI95% target remained very close to the stipulated target.
The post-grazing height target (initial phase) was effectively reached for pastures submitted to treatments 95/15, 95/20, and LIMax/20. However, in pastures submitted to LIMax/15 treatment, post-grazing height was higher than planned (Table 2). The mean values of canopy height reached in the final phase (pre-grazing) in the grazing managed with LI95% were close to 30 cm. In the pastures managed with the LIMax target, the values were close to 40 cm.
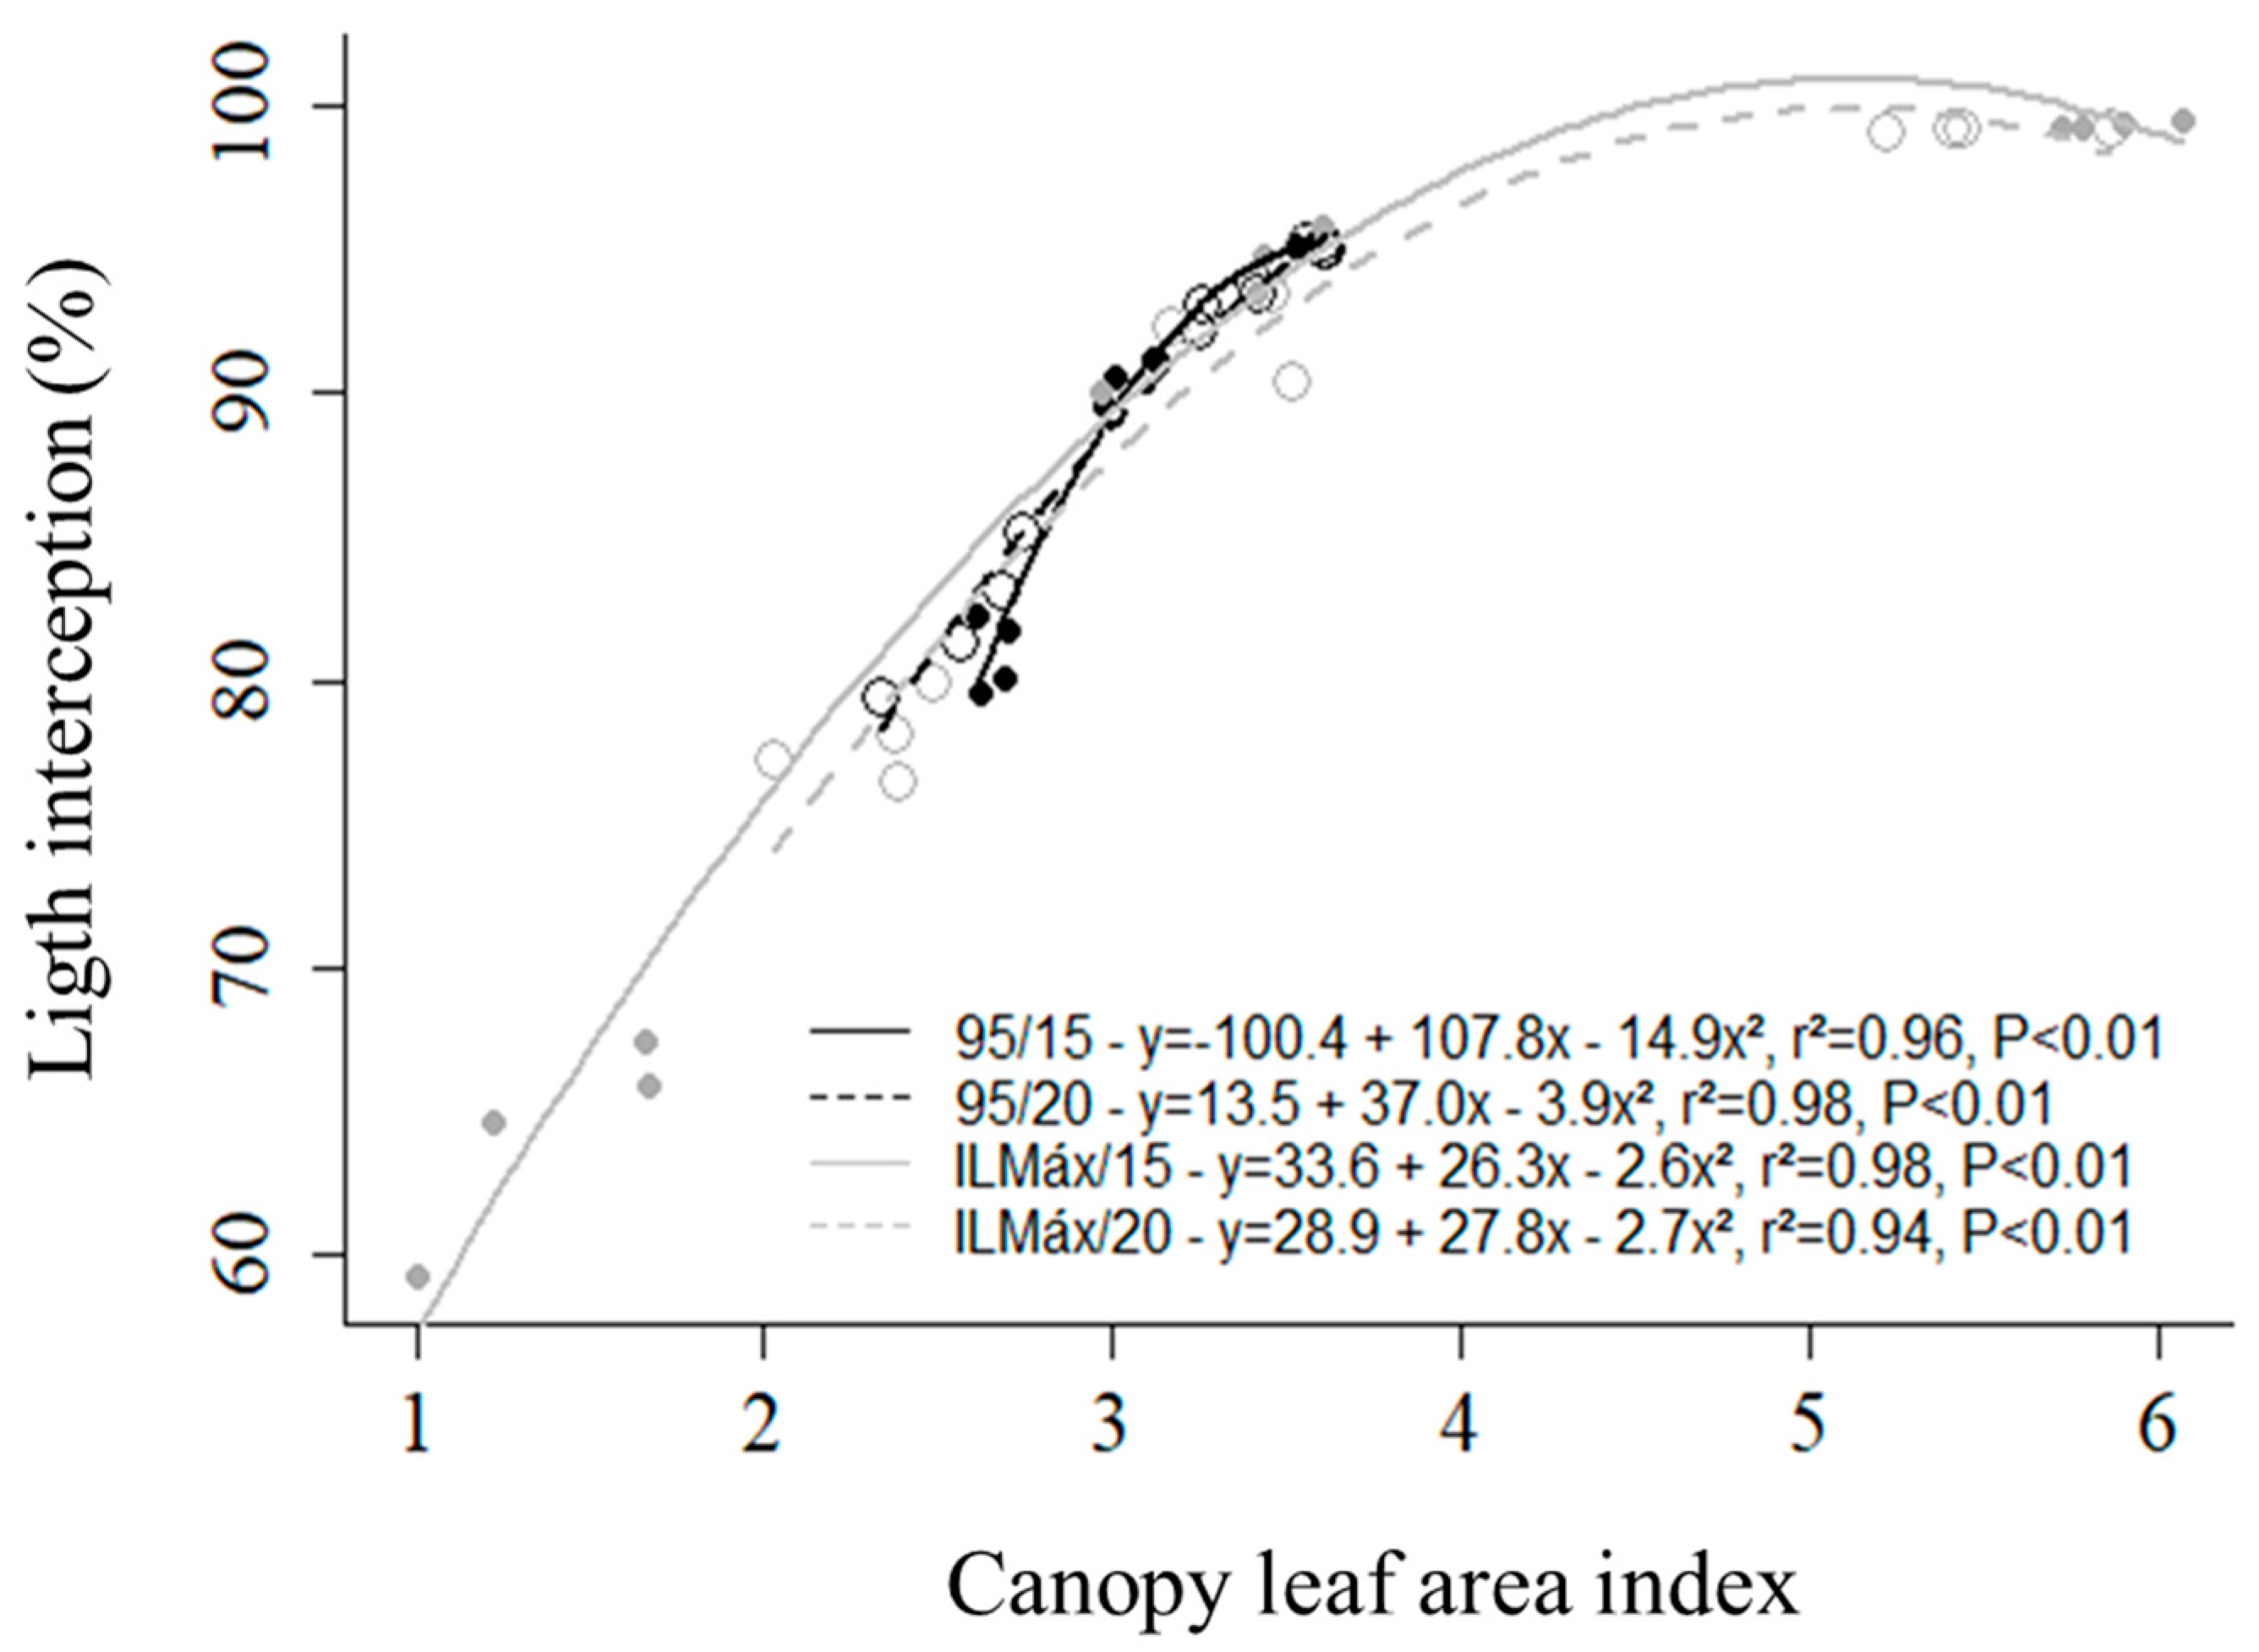
Light interception of the forage canopy increased quadratically with the leaf area index (LAI) of pastures for all management strategies evaluated (Figure 3). LAI values ranged from 1.0 to 6.1, with more significant variations for the LIMax/15 management strategy and lower variation for the 95/20 management strategy, from 2.6 to 3.6, from the beginning to the end of the regrowth period.
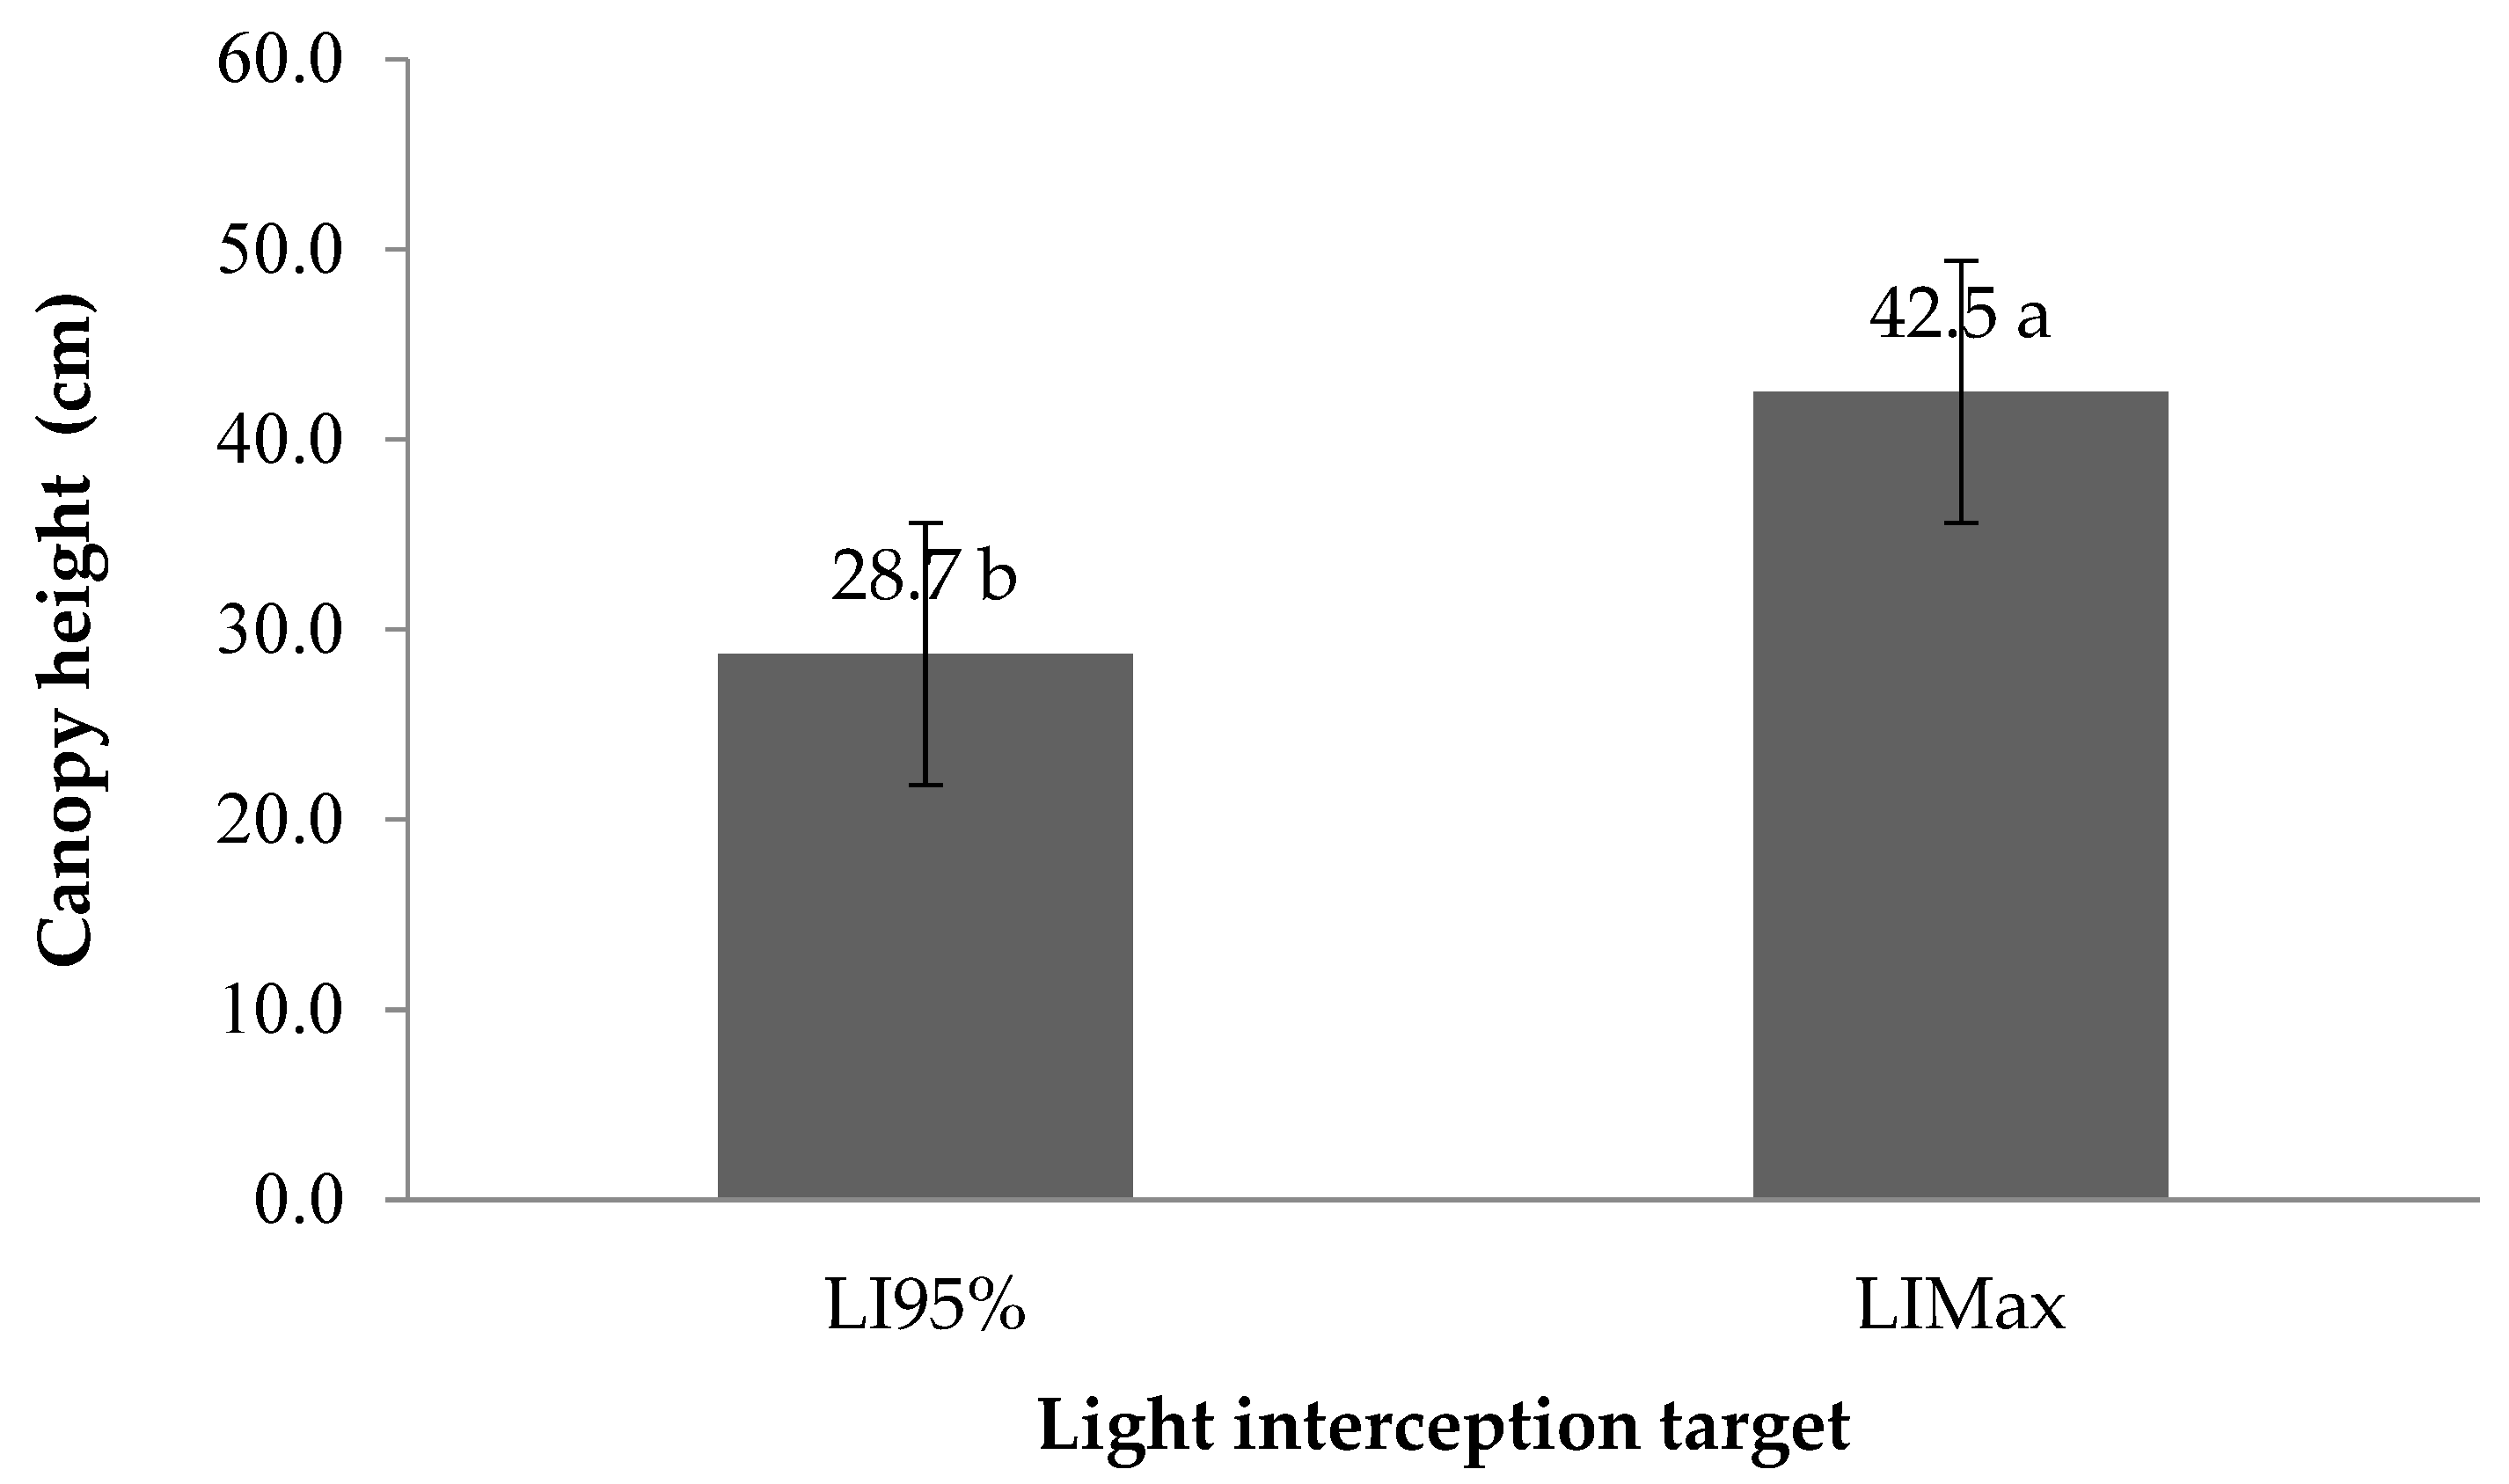
The pre-grazing height of the canopy varied with the LI target (p < 0.01). Higher heights were recorded in the pastures managed with the LIMax target compared to those managed with the LI95% target (Figure 4). There was no interaction between pre-grazing light interception and post-grazing height (p = 0.34).
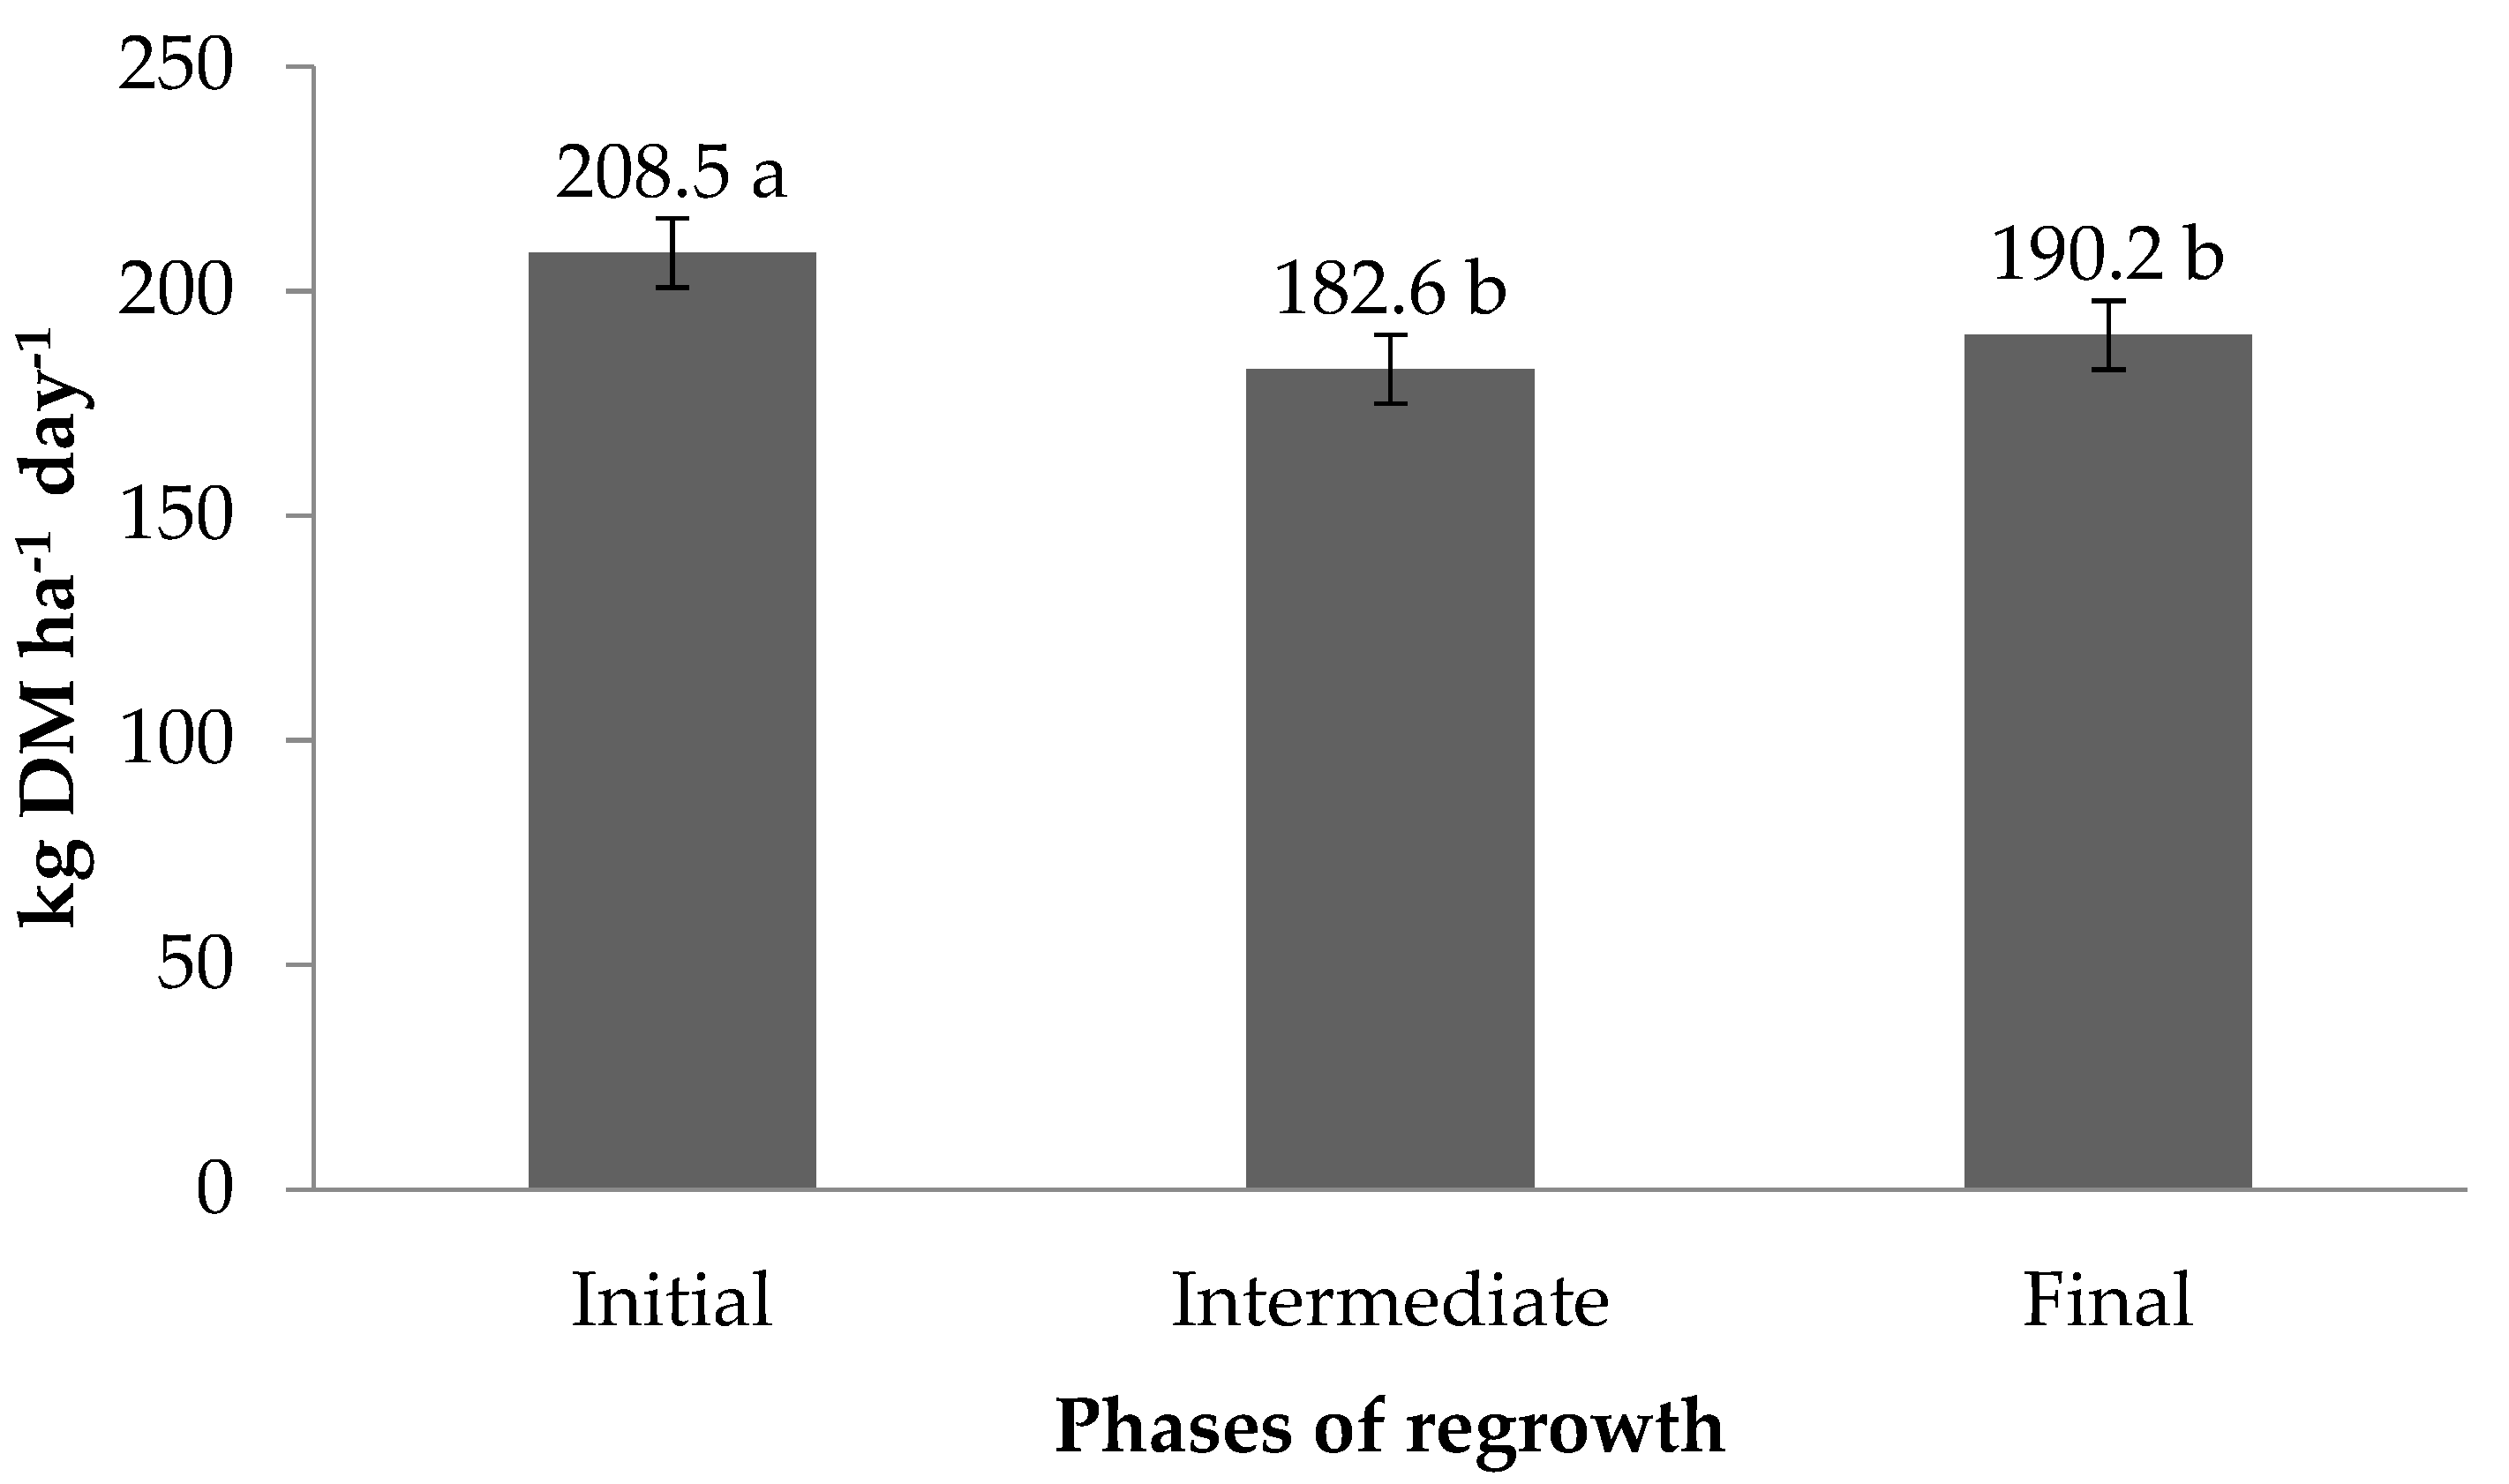
The total growth rate was not influenced by the management strategies evaluated (p = 0.1763). It only varied with the regrowth phase (p = 0.0089), with higher values recorded in the initial and final phases and lower in the intermediate phase (Figure 5).
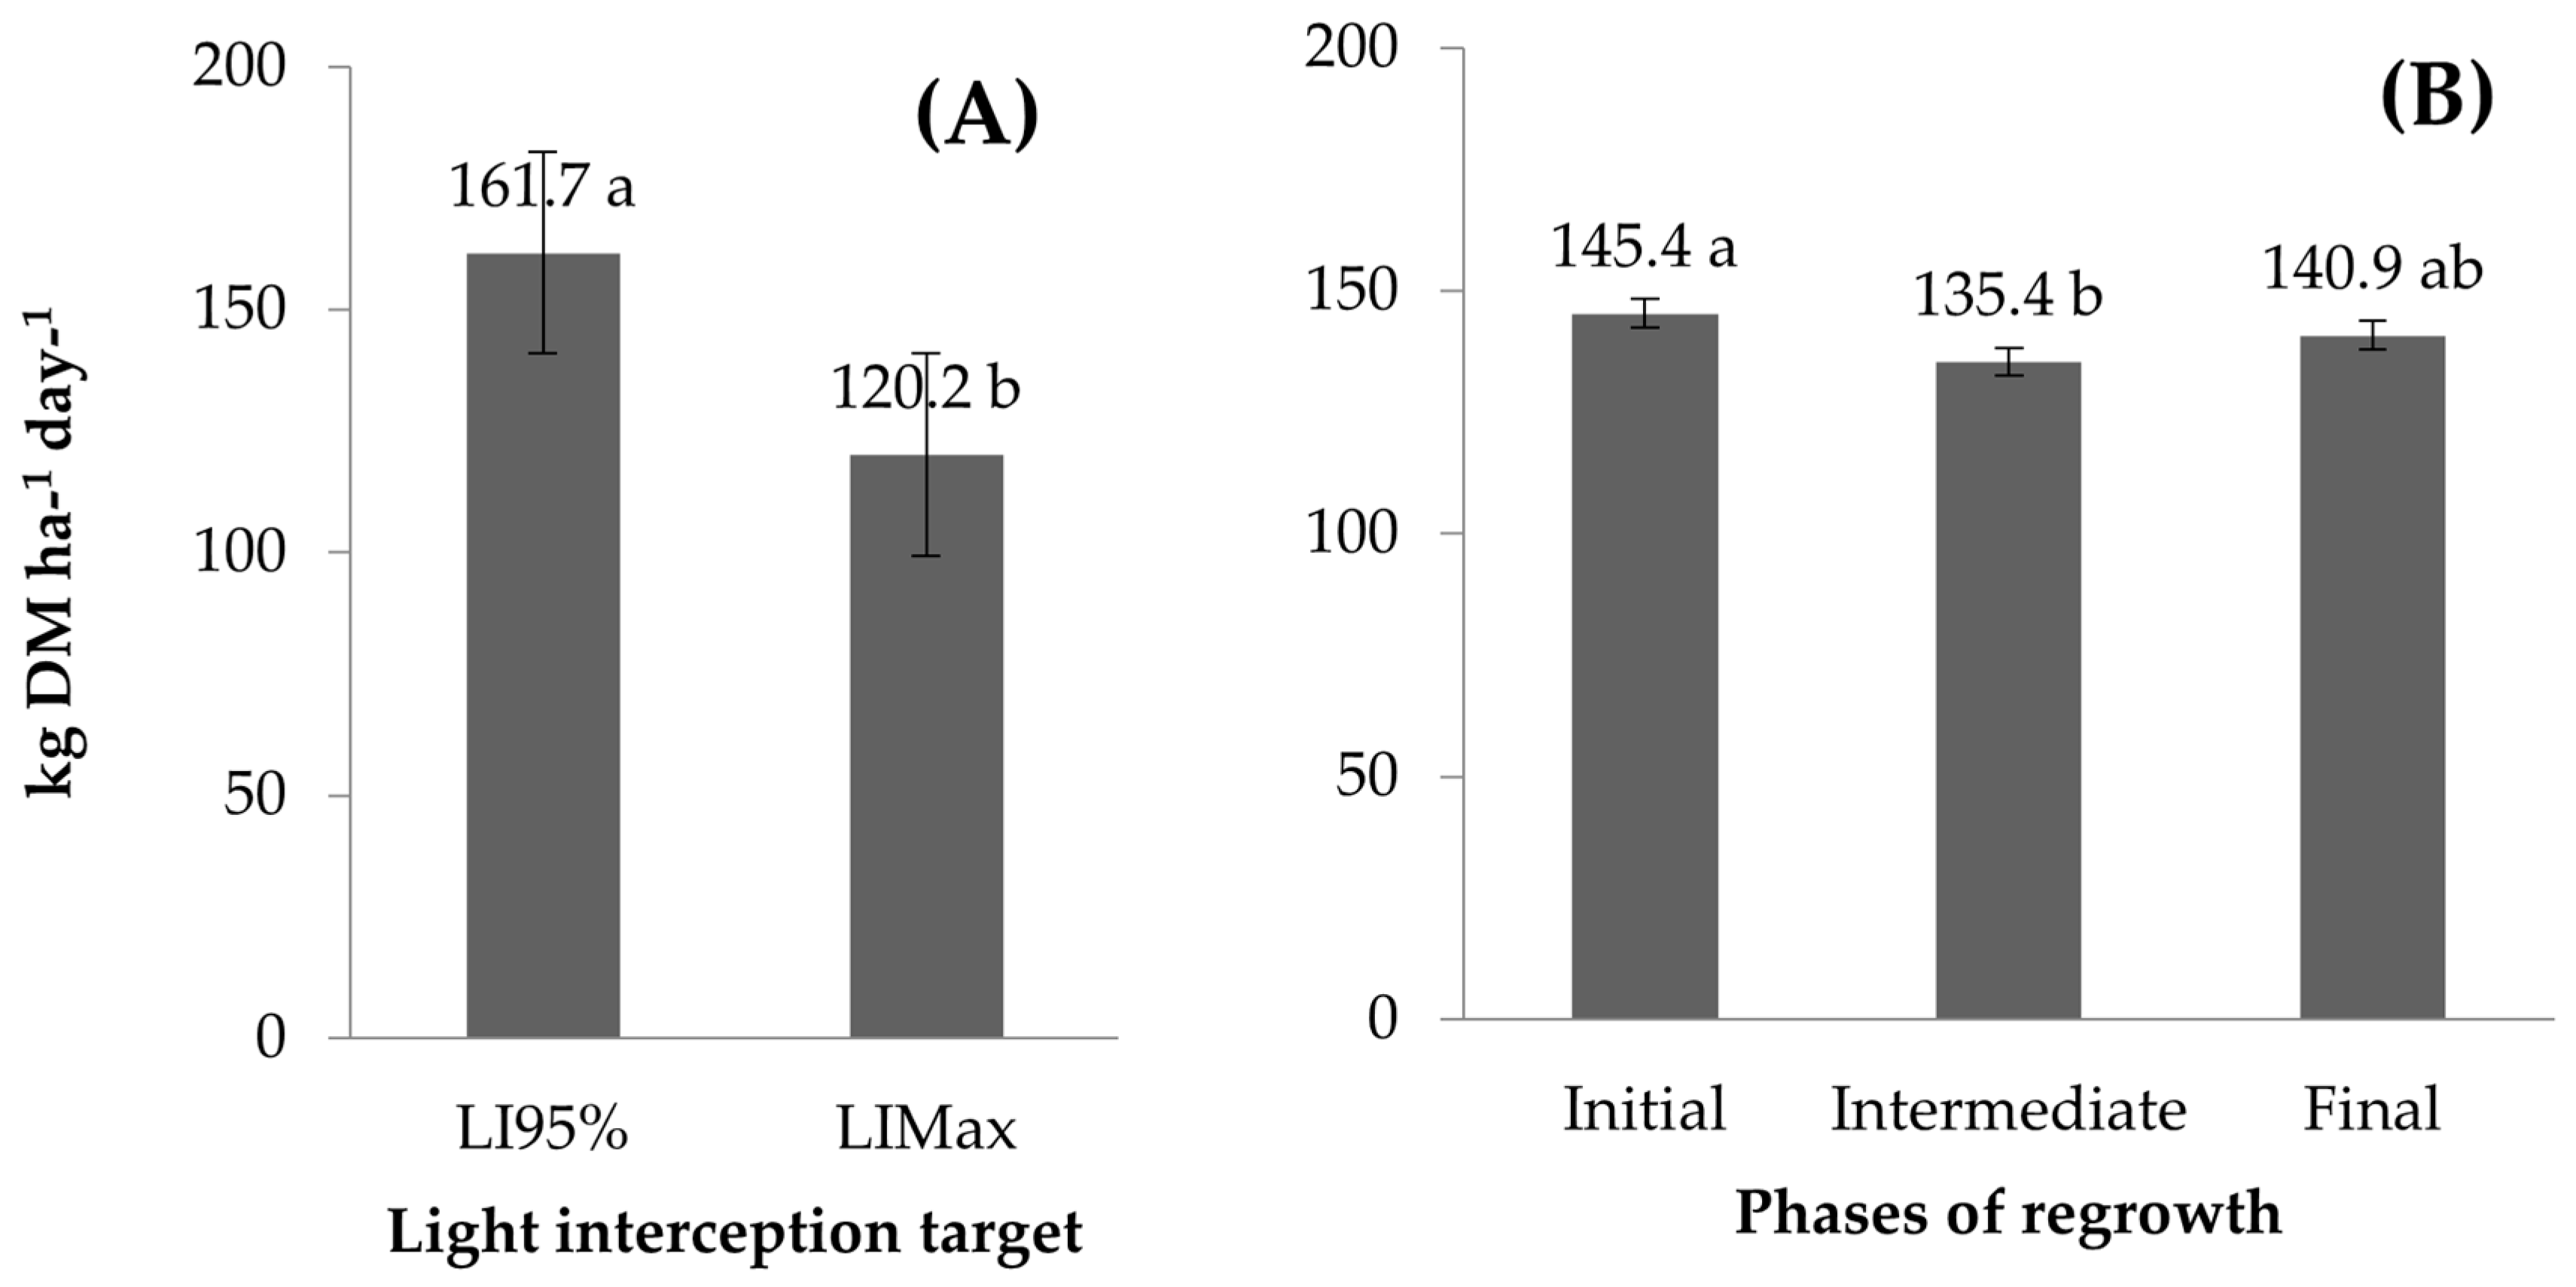
The foliar growth rate varied with the pre-grazing LI target (p = 0.0328) and with the regrowth phase (p = 0.0356). Pastures managed with the LI95% target presented higher values than pastures managed with the LIMax target (Figure 6A). During regrowth, higher values were recorded in the initial phase and smaller in the intermediate phase of regrowth (Figure 6B).
The growth rate of stems varied with phase of regrowth (p = 0.0078) and post-grazing height × regrowth (p = 0.0035) and light intercept × regrowth phase (p = 0.0001). Pastures managed with the LI95% target presented higher values in the initial regrowth phase, reducing in the intermediate phase, and remaining relatively constant until the end of regrowth. The inverse pattern was observed for the pastures managed with the LIMax target, with higher values recorded at the end of the regrowth period. Higher stems growth rates were recorded for the grasses managed with the LI95% target in the initial and intermediate stages of regrowth compared to those managed with the LIMax target. However, in the final phase, there was an inversion of the pattern, with higher values recorded in the pastures managed with the LIMax target (Table 3).
Regarding post-grazing height, the stems’ growth rate remained stable throughout the regrowth period in the pastures managed with the goal of a post-grazing height of 15 cm (Table 4). In pastures managed with the targets of a post-grazing height of 20 cm, higher values of shoot growth rate were recorded in the initial regrowth phase compared with the intermediate and final phases.
The leaf senescence rate varied with the phase of regrowth (p = 0.0052) and with pre-grazing LI interaction and regrowth phase (p = 0.0023). In the grazing managed with LI95%, the values remained stable throughout the regrowth period, whereas in pastures managed with the LIMax target, the leaf senescence rate increased during the regrowth phases. Grasses managed with the target LI95% presented with higher values in the initial phase, whereas in the final phase, higher values were recorded in the pastures managed with the LIMax target (Table 5).
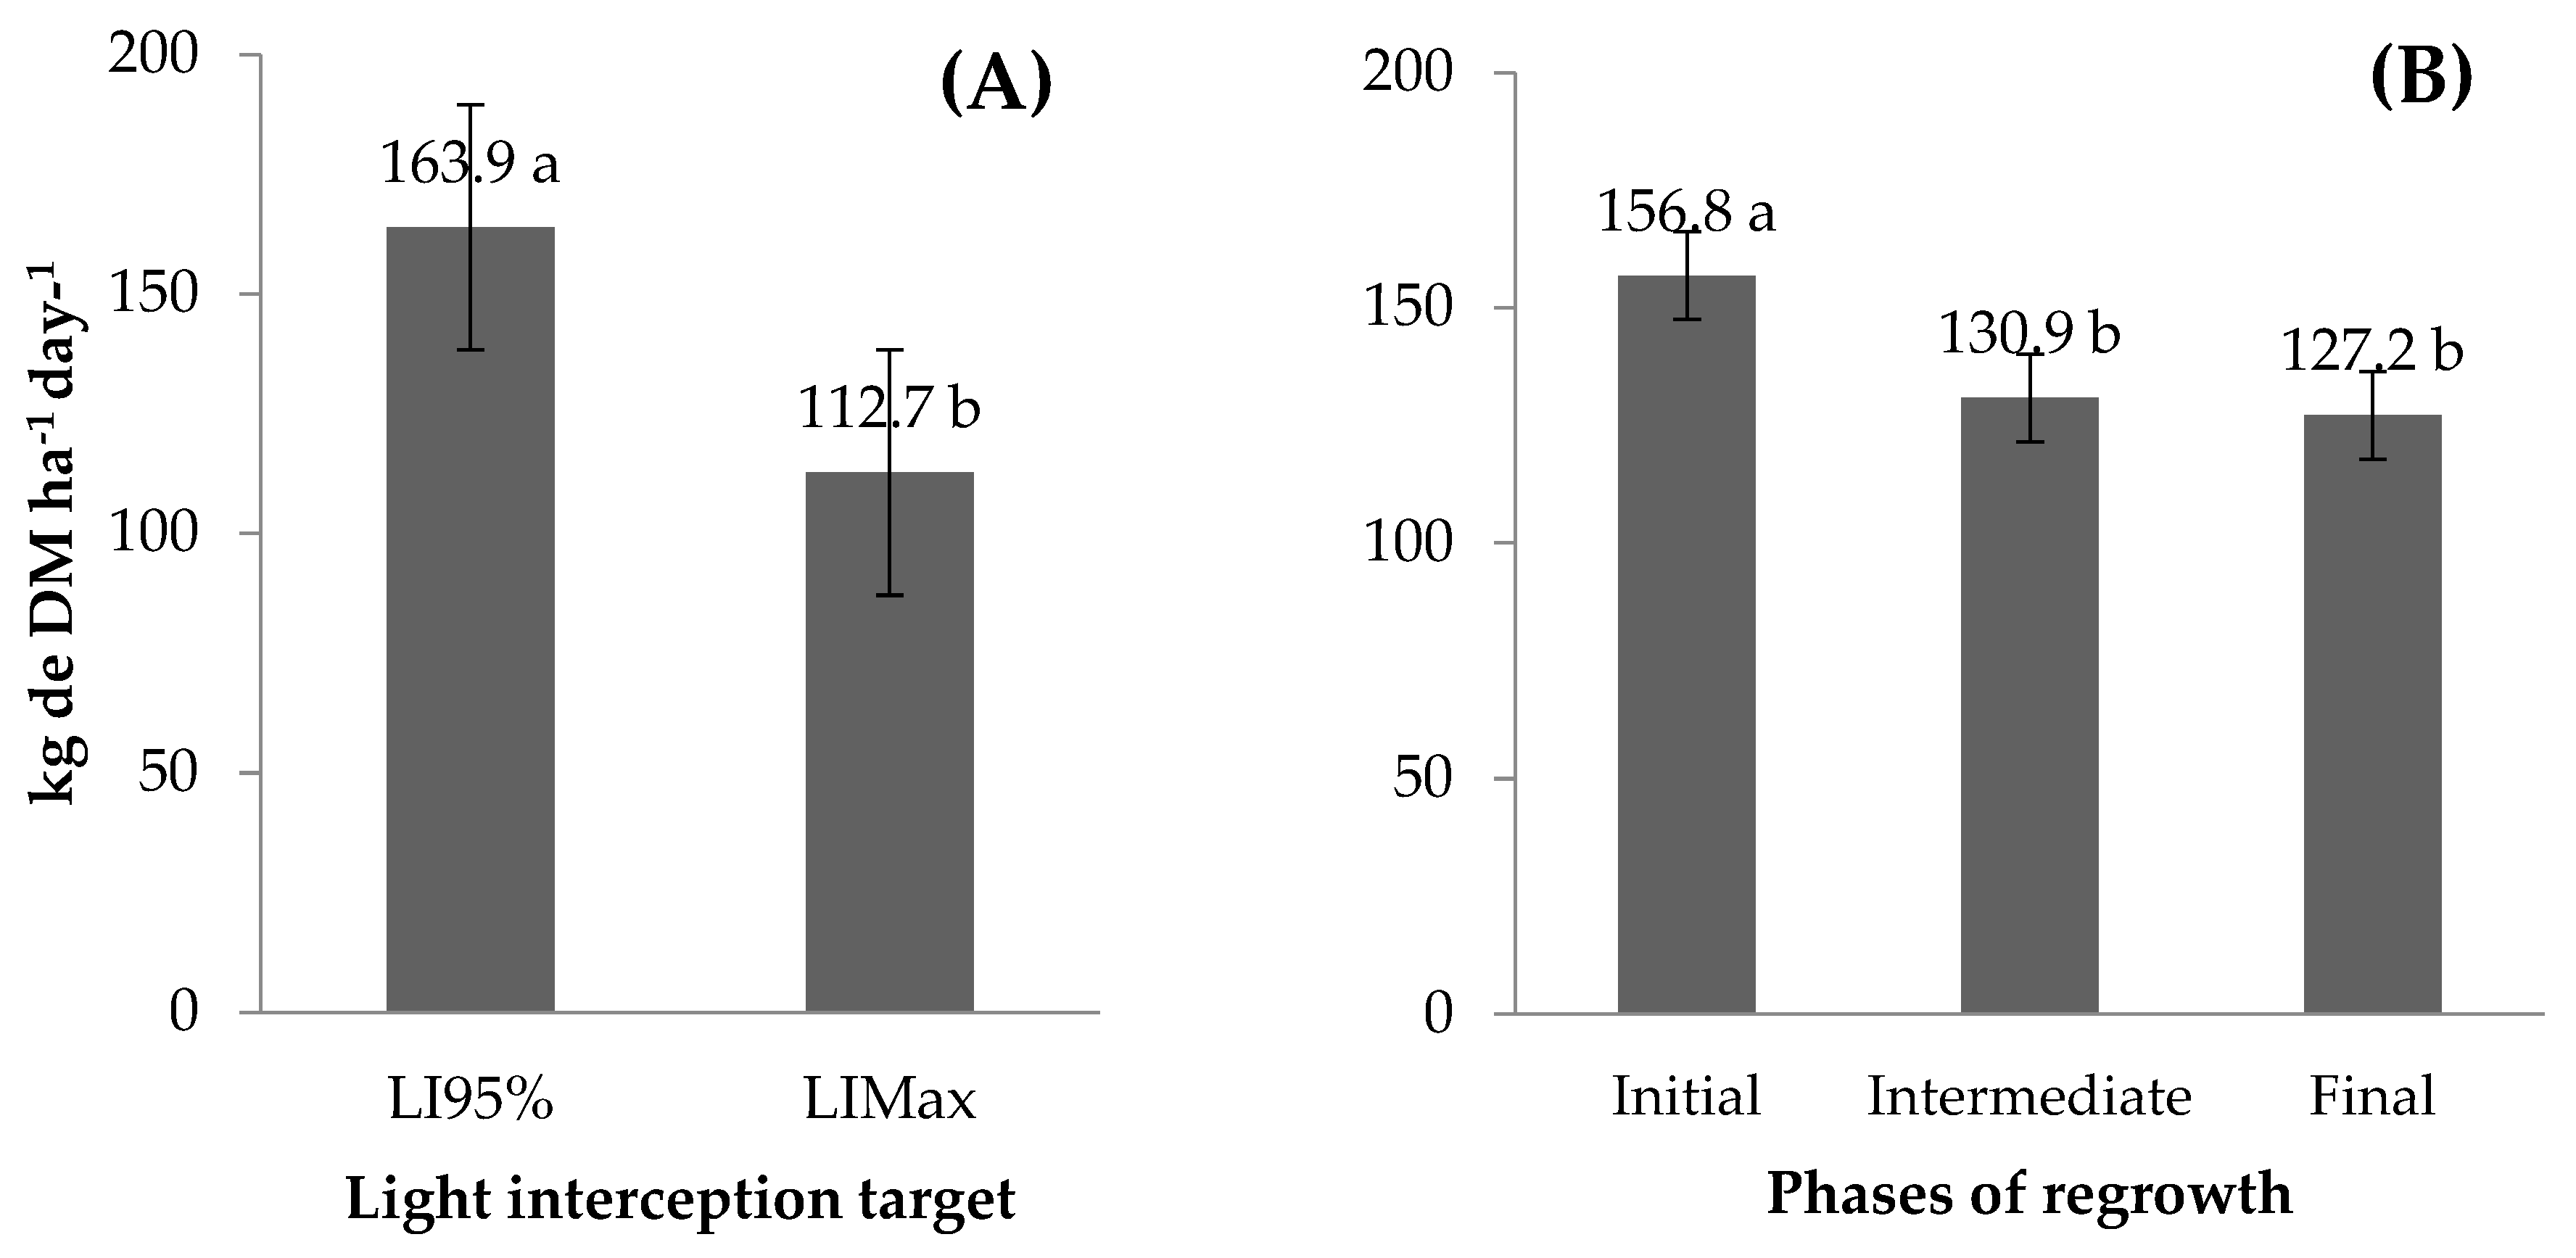
The forage accumulation rate varied with the pre-grazing LI (p = 0.0307) and with the regrowth phase (p = 0.0138). Pastures managed with the LI95% target had higher values than pastures managed with the LIMax target (Figure 7A). During the regrowth phases, higher values were recorded in the initial phase, reducing in the intermediate phase and remaining stable until the end of regrowth (Figure 7B).
The senescence/growth ratio varied as a function of pre-grazing LI (p = 0.0054), regrowth phase (p = 0.0104), and pre-grazing LI interaction × regrowth phase (p = 0.0008). In the pastures managed with the LI95% target, the values remained stable throughout the regrowth period. In the pastures managed with the LIMax target, higher values were recorded in the intermediate and final phases of regrowth (Table 6).

4. Discussion

The dynamics of forage accumulation comprise plant growth and senescence processes, which are a function of light interception and leaf area index of the forage canopy [15,38]. In this sense, strategies of grazing management under intermittent stocking modify the dynamics of forage accumulation. So, it affects the frequency and severity of defoliation. Consequently, there is a change in the binomial amount and quality of leaf area, which is a determinant of the canopy’s photosynthetic capacity.
The evaluated canopy height and light interception targets were, in general, effectively reached (Table 1 and Table 2). The contrast imposed by the treatments allowed a wide variation in the leaf area index of the canopy, from 1.0 to 6.0, and a similar pattern of light interception response as a function of the leaf area index. As the LAI of the forage canopy increased during regrowth, there was an increase in the light interception by the canopy (Figure 3), a classic pattern of response and similar to several species reported in the literature [26,27,39,40,41,42,43,44]. The quadratic response pattern between the light interception and the LAI is a result of increasing shading in the canopy interior, so the higher the LAI, the lower the light-interception efficiency, justified by the alteration in the leaves’ architecture and modifications that impact the growth and senescence as shading within the canopy intensifies. However, the height measurements of the forage canopy corresponding to the LI95% and LIMax targets were 28.7 cm and 42.5 cm, independent of the post-grazing height goal, demonstrating the consistency and robustness of the canopy height as a field indicator for the determination of the appropriate time to stop regrowth [22].
The total growth rate corresponds to the increase in herbage mass in a given time, being influenced by the quality and quantity of leaf area available for photosynthesis. Although the management strategies evaluated altered the magnitude of the LAI of the forage canopy, there was no difference between the pre-grazing LI targets evaluated (217.7 + 51.6 and 169.9 + 83.62 kg ha−1 day−1 for the LI95% and LIMax targets, respectively). However, the total growth rate is a result of the sum of the growth from leaves and stems, so that the same total growth rate can occur in different ways due to differences in contribution to each morphological component’s total growth. The leaf growth rate was higher in the grazing managed with the LI95% target compared to those managed with the LIMax target (Figure 6A). The highest leaf growth rate is a desirable condition for providing better forage yield and greater ease of grip by the animal since stalks represent a physical barrier and make it challenging to grazing [45,46,47,48,49]. On the other hand, in the pastures managed with the LIMax target, due to the lower frequency of defoliation, the remaining leaves are less adapted to high luminosity. This condition happens because they grew under conditions of low light incidence, contributing to their photosynthetic capacity [50,51].
During the regrowth period, the total growth rate was higher in the initial and final phases (Figure 5). This may characterize the strategy for the recovery of LAI after defoliation as a way of adapting to defoliation impacts, in an attempt to re-establish and maintain an optimal balance of growth [14]. This pattern of variation in total growth is consistent with high leaf growth rates (Figure 6B) and stems (Table 3) at the beginning of the regrowth of managed grasses with the LI95% target. The stem elongation evaluations performed in this experiment did not distinguish between stem and pseudostem, with the high elongation of shoots in the initial phase of regrowth managed with the LI95% target most likely due to the elongation of foliar sheaths associated to the high rate of appearance of leaves relative to pastures managed with the LIMax target.
The growth rate of stalks was lower in the intermediate and final periods of the regrowth of the pastures managed with the target LI95% (Table 3), reflecting the efficient control of the accumulation of stalks and favoring the supply of forage with a lower proportion of this morphological component in the mass of pre-grazing forage, as reported by Silveira et al. [48] and Carnevalli et al. [21]. In pastures managed with the LI95% target, the post-grazing height of 15 cm goal resulted in a lower shoot growth rate in the early regrowth phase when compared to the 20 cm target (Table 4), possibly due to the greater severity of defoliation, which may have favored the reduction in the growth rate of stems and prioritization of resources for the production of leaves. This type of behavior is characteristic of the mechanisms of resistance and adaptation to grazing denominated phenotypic plasticity [52]. So, plants condition the supply of carbohydrates primarily for the production of photosynthetic tissues, i.e., leaves, to favor the rapid recovery of the leaf area during the regrowth period. On the other hand, in pastures managed with the LIMax target, the highest shoot growth rate occurred in the final regrowth stage, which is probably a way to position new leaves in a better light incidence condition at the top of the canopy [22]. The stem elongation is a vital shade avoidance mechanism. It involves morphological adaptations that favor the photosynthetic capacity of the plants as the newly emerged leaves are positioned in the upper part of the canopy [52]. However, it also has practical implications for animal production, with a reduction in the nutritional value of forage [53].
The rate of forage accumulation is a function of the balance between growth and senescence processes [54]. Tissue senescence and death occur concomitantly to growth, compromising the accumulation and quality of the forage produced. The leaf senescence rate in the canopy is directly influenced by the light availability, which was altered as a function of the interaction between the pre-grazing LI target and the regrowth phase (Table 5). The leaf senescence rate in the pastures managed with the LIMax target was higher in the final phase of the regrowth period, with increases in the order of 70% compared to the initial phase, reaching almost 50% of the leaf growth (Table 6). A similar pattern was recorded by Carnevalli et al. [45] in pastures of Mombasa grassland (Panicum maximum Jacq. Cv. Mombaça) managed with the LIMax target, with a 366% increase in senescence rate from the beginning to the end of the regrowth period. In severe shading conditions, there is a rapid and marked senescence of the leaves positioned closer to the forage canopy’s base. This situation characterizes the strategy to optimize the partition of resources (internal nutrient cycling) and adaptation to the environment [55]. However, increased senescence provides a reduction in the nutritional value of forage, with an increase in the proportion of sclerenchymatic tissues and lignin accumulation [53].
As a result of the balance between canopy growth and senescence, the forage accumulation rate was higher in the grazing managed with the LI95% target compared to those managed with the LIMax target (Figure 7A), mainly due to the higher senescence rate in the pastures managed with the LIMax target and the highest foliar growth rate in the grazing managed with the LI95% target (Figure 6A).
Ratifying this fact, the pastures managed with the LI95% target presented higher residual LAI, providing rapid regrowth after defoliation, resulting in a higher post-grazing light interception. During the regrowth period, the forage accumulation rate was high in the initial phase, reducing the intermediate, and remaining stable until the final regrowth phase (Figure 7B). The stabilization of the forage accumulation rate in the canopy in the final regrowth phase is associated with an increase in the rate of forage accumulation in aerial tillers in this phase, a fact that can be evidenced by the increase in the growth rate and the population density of aerial tiller in the pre-grazing recorded by Da Silva et al. [32] in a contemporary study in the same experimental area.
Thus, the forage accumulation is maximized when the forage LAI is lower than the maximum possible LAI value to be reached, coinciding with the condition in which 95% interception of the incident radiation occurs, the critical LAI. Therefore, this situation would be the ideal moment to interrupt the regrowth process of Mulatto grasses, as reported in the literature for other forage species [56,57,58,59]. After this time, an increase in senescence and stem-elongation rates associated with decreased leaf elongation rates is evident [22]. In the pastures managed with the target LI95%, the LAI in the pre-grazing condition was approximately 3.6, which is 40% smaller than that of the pastures managed with the LIMax target. The results demonstrate the consistency of the criterion of interruption of the regrowth process to the 95% of interception of light by the forage canopy and reinforce the potential use of the height of the pasture as a field indicator to monitor this condition. For Mulatto grass, the target of the ideal height of entry corresponds to 30 cm and one of the heights of exit to 15 or 20 cm.

5. Conclusions

Grazing management strategies alter the dynamics of forage accumulation throughout the regrowth period. Mulatto grass pastures managed with the LI95% target, corresponding to approximately 30 cm in height, present a higher rate of forage accumulation, with a higher leaf growth rate, concerning pastures managed with the LIMax target. Also, pastures managed with the LI95% target ensure low stem growth and low foliar senescence rates during the regrowth period, contributing to high forage yield and high utilization efficiency. Therefore, in a practical way, it is recommended to manage Mulatto grass, under rotational grazing by cattle, with a grass height of 30 cm for the animals to enter the paddocks, and animals to exit the paddocks with a grass height of 15 or 20 cm for post-grazing grasses.

Author Contributions

Conceptualization, S.C.d.S., M.C.T.d.S., D.d.N.J. and C.S.R.; methodology S.C.d.S., M.C.T.d.S., D.d.N.J. and C.S.R.; software, S.C.d.S., C.S.R., D.d.N.J. and G.P.S.; validation, S.C.d.S., M.C.T.d.S., D.d.N.J. and C.S.R.; formal analysis, C.S.R., M.C.T.d.S., D.d.N.J. and G.P.S.; investigation, C.S.R., M.C.T.d.S., L.M.B., S.J.S.J., D.d.N.J. and V.A.L.; resources S.C.d.S., M.C.T.d.S., D.d.N.J. and C.S.R.; data curation, S.C.d.S., M.C.T.d.S., C.S.R., D.d.N.J. and. G.P.S.; writing—original draft preparation, C.S.R., D.d.N.J. and M.C.T.d.S.; writing—review and editing, S.C.d.S., C.S.R., M.C.T.d.S., D.d.N.J. and. G.P.S.; visualization, S.C.d.S., M.C.T.d.S., D.d.N.J. and C.S.R.; supervision, S.C.d.S., M.C.T.d.S., D.d.N.J. and C.S.R.; project administration S.C.d.S., M.C.T.d.S., D.d.N.J. and C.S.R. All authors have read and agreed to the published version of the manuscript.

Funding

This research received no external funding.

Institutional Review Board Statement

Not applicable.

Informed Consent Statement

Not applicable.

Data Availability Statement

The original contributions presented in the study are included in the article, further inquiries can be directed to the corresponding author.

Acknowledgments

Authors would like to thank the National Council for Scientific and Technological Development (CNPq) for the fellowship grant. Also, the authors are thankful to the postgraduate support program of Federal University of Viçosa (UFV) and the Superior School of Agriculture “Luiz de Queiroz” (ESALQ).

Conflicts of Interest

The authors declare no conflicts of interest.

References

  1. Saugier, B.; Roy, J.; Mooney, H.A. Estimations of global terrestrial productivity: Converging towards a single number? In Terrestrial Global Productivity; Roy, J., Saugier, B., Mooney, H.A., Eds.; Academic Press: San Diego, CA, USA, 2001; pp. 543–557. [Google Scholar]
  2. Still, C.J.; Berry, J.A.; Collatz, G.J.; DeFries, R.S. Global distribution of C 3 and C 4 vegetation: Carbon cycle implications. Glob. Biogeochem. Cycles 2003, 17, 6-1–6-14. [Google Scholar] [CrossRef]
  3. Edwards, E.J.; Smith, S.A. Phylogenetic analyses reveal the shady history of C4 grasses. Proc. Natl. Acad. Sci. USA 2010, 107, 2532–2537. [Google Scholar] [CrossRef]
  4. Lambers, H.; Chapin, F.S., III; Pons, T.L. Plant Physiological Ecology; Springers: New York, NY, USA, 2008. [Google Scholar]
  5. Christin, P.A.; Osborne, C.P. The evolutionary ecology of C 4 plants. New Phytol. 2014, 204, 765–781. [Google Scholar] [CrossRef] [PubMed]
  6. Jank, L.; Braz TG, S.; Martuscello, J.A. Tropical climate grasses. In Forage Farming: Science, Technology and Management of Forage Resources, 1st ed.; Reis, R.A., Bernardes, T.F., Siqueira, G.R., Eds.; Print shop Multipress: Jaboticabal, Brazil, 2014; pp. 109–124. [Google Scholar]
  7. Valle, C.B.; Simeão, R.M.; Barrios, S.C.L. Selection and improvement of forage plants. In Forage Farming: Science, Technology and Management of Forage Resources, 1st ed.; Reis, R.A., Bernardes, T.F., Siqueira, G.R., Eds.; Print shop Multipress: Jaboticabal, Brazil, 2014; pp. 109–124. [Google Scholar]
  8. Argel, M.; Pedro, J.; Miles John, W.; Guiot, G.; Jorge, D.; Lascano, C.E. Cultivar Mulato (Brachiaria Híbrido CIAT 36061): Gramínea de Alta Producción y Calidad Forrajera para los Trópicos. Centro Internacional de Agricultura Tropical (CIAT), Cali, CO. 24p. (Boletim). 2006. Available online: http://ciat-library.ciat.cgiar.org/Articulos_Ciat/CV%20Mulato.pdf (accessed on 13 September 2018).
  9. Nanamori, M.; Shinano, T.; Wasaki, J.; Yamamura, T.; Rao, I.M.; Osaki, M. Low Phosphorus Tolerance Mechanisms:Phosphorus Recycling and Photosynthate Partitioning in the Tropical Forage Grass, Brachiaria Hybrid Cultivar Mulato Compared with Rice. Plant Cell Physiol. 2004, 45, 460–469. [Google Scholar] [CrossRef]
  10. Mesquita, E.E.; Neres, M.A.; Oliveira, P.S.R.; Mesquita, L.P.; Schneider, F.; Teodoro Júnior, J.R. Forage yield and growth of “Panicum maximum” cvs. Mombaça and Tanzania-1 and Mulato hybrid Brachiaria under phosphorus application. Rev. Bras. De Saúde E Produção Anim. 2010, 11, 292–302. [Google Scholar]
  11. Bauer, M.D.O.; Pacheco, L.P.A.; Chichorro, J.F.; Vasconcelos, L.V.; Pereira, D.F.C. Herbage yield and structural characteristics of five Brachiaria genus forages under intermittently defoliation sward. Ciência Anim. Bras. 2011, 12, 17–25. [Google Scholar] [CrossRef]
  12. Silveira, M.C.T.; Da Silva, S.C.; Souza Júnior, S.J.; Barbero, L.M.; Rodrigues, C.S.; Limão, V.A.; Pena, K.S.; Nascimento Júnior, D. Herbage accumulation and grazing losses on Mulato grass subjected to strategies of rotational stocking management. Sci. Agric. 2013, 70, 242–249. [Google Scholar] [CrossRef]
  13. Portugal, T.B.; Szymczak, L.S.; de Moraes, A.; Fonseca, L.; Mezzalira, J.C.; Savian, J.V.; Zubieta, A.S.; Bremm, C.; de Faccio Carvalho, P.C.; Monteiro, A.L.G. Low-Intensity, High-Frequency Grazing Strategy Increases Herbage Production and Beef Cattle Performance on Sorghum Pastures. Animals 2022, 12, 13. [Google Scholar] [CrossRef]
  14. Lemaire, G.; Chapman, D. Tissue flows in grazed plant communities. In The Ecology and Management of Grazing Systems; Hodgson, J., Illius, A.W., Eds.; CAB International, cap.1: Guildford, UK, 1996; pp. 3–36. [Google Scholar]
  15. Brougham, R.W. A study in rate of pasture growth Australian. J. Agric. Res. 1955, 6, 804–812. [Google Scholar] [CrossRef]
  16. Voltolini, T.V.; Santos, F.A.P.; Martinez, J.C.; Clarindo, R.L.; Penati, M.A.; Imaizumi, H. Productive and qualitative characteristics of elephant grass pasture grazed in fixed and intermittent intervals according to interception of active photosynthetic radiation. Rev. Bras. De Zootec. 2010, 39, 1002–1010. [Google Scholar] [CrossRef]
  17. Gomide, C.A.D.M.; Paciullo, D.S.C.; Costa, I.D.A.; Lima, A.M.; Castro, C.R.T.D.; Lédo, F.J.D.S. Morphogenesis of dwarf elephant grass clones in response to intensity and frequency of defoliation in dry and rainy seasons. Rev. Bras. De Zootec. 2011, 40, 1445–1451. [Google Scholar] [CrossRef]
  18. Sousa, B.M.L.; Nascimento, D., Jr.; Monteiro, H.C.F.; Fonseca, D.M. Dynamics of production and forage utilization on elephant grass pastures managed with different post-grazing heights. Rev. Bras. De Zootec. 2012, 41, 1840–1847. [Google Scholar] [CrossRef]
  19. Chaves, C.S.; Gomide, C.A.D.M.; Ribeiro, K.G.; Paciullo, D.S.C.; Ledo, F.J.D.S.; Costa, I.D.A.; Campana, L.L. Forage production of elephant grass under intermittent stocking. Pesqui. Agropecuária Bras. 2013, 48, 234–240. [Google Scholar] [CrossRef]
  20. Pereira, L.E.T.; Paiva, A.J.; Geremia, E.V.; Da Silva, S.C. Components of herbage accumulation in elephant grass cvar Napier subjected to strategies of intermittent stocking management. J. Agric. Sci. 2014, 152, 954–966. [Google Scholar] [CrossRef]
  21. Pereira, L.E.T.; Paiva, A.J.; Geremia, E.V.; Da Silva, S.C. Grazing management and tussock distribution in elephant grass. Grass Forage Sci. 2014, 70, 406–417. [Google Scholar] [CrossRef]
  22. Da Silva, S.; Sbrissia, A.; Pereira, L. Ecophysiology of C4 Forage Grasses—Understanding Plant Growth for Optimising Their Use and Management. Agriculture 2015, 5, 598–625. [Google Scholar] [CrossRef]
  23. Gomide, C.A.; Chaves, C.S.; Ribeiro, K.G.; Sollenberger, L.E.; Paciullo, D.S.; Pereira, T.P.; Morenz, M.J. Structural traits of elephant grass (Pennisetum purpureum Schum.) genotypes under rotational stocking strategies. Afr. J. Range Forage Sci. 2015, 32, 51–57. [Google Scholar] [CrossRef]
  24. Congio, G.F.S.; Batalha, C.D.A.; Chiavegato, M.B.; Berndt, A.; Oliveira, P.P.; Frighetto, R.T.; Maxwell, T.M.R.; Gregorini, P.; Da Silva, S.C. Strategic grazing management towards sustainable intensification at tropical pasture-based dairy systems. Sci. Total Environ. 2018, 636, 872–880. [Google Scholar] [CrossRef]
  25. Geremia, E.V.; Crestani, S.; Mascheroni, J.D.C.; Carnevalli, R.A.; Mourão, G.B.; da Silva, S.C. Sward structure and herbage intake of Brachiaria brizantha cv. Piatã in a crop-livestock-forestry integration area. Livest. Sci. 2018, 212, 83–92. [Google Scholar] [CrossRef]
  26. Martins, C.D.M.; Schmitt, D.; Duchini, P.G.; Miqueloto, T.; Sbrissia, A.F. Defoliation intensity and leaf area index recovery in defoliated swards: Implications for forage accumulation. Sci. Agric. 2021, 78, e20190095. [Google Scholar] [CrossRef]
  27. Aparecida, C.R.; de Souza, C.G.F.; Fischer, S.A.; Carneiro, S.S. Growth of Megathyrsus maximus cv. Mombaça as affected by grazing strategies and environmental seasonality. II. Dynamics of herbage accumulation. Crop Pasture Sci. 2021, 72, 66–74. [Google Scholar] [CrossRef]
  28. Van Raij, B.; Quaggio, J.A.; Da Silva, N.M. Extração de fósforo, potássio, cálcio e magnésio dos solos por um procedimento de resina de troca iônica. Comun. Em Ciência Do Solo E Análise De Plantas 1986, 17, 547–566. [Google Scholar]
  29. Thornthwaite, C.W.; Mather, R.J. The Water Balance; Laboratory of Climatology: Centerton, NJ, USA, 1955; Version 8; 104p. [Google Scholar]
  30. Gildersleeve, R.R.; Ocumpaugh, W.R.; Quesenberry, K.H.; Moore, J.E. Mob-grazing morphologically different Aeschynomene species. Trop. Grassl. 1987, 21, 123–132. [Google Scholar]
  31. Grant, S.A.; Marriot, C.A. Detailed studies of grazed sward-techniques and conclusions. J. Agric. Sci. 1994, 122, 1–6. [Google Scholar] [CrossRef]
  32. Da Silva, S.; Chiavegato, M.; Pena, K.; Silveira, M.; Barbero, L.; Junior, S.; Pereira, L. Tillering dynamics of Mulato grass subjected to strategies of rotational grazing management. J. Agric. Sci. 2017, 155, 1082–1092. [Google Scholar] [CrossRef]
  33. Bircham, J.S.; Hodgson, J. The influence of sward condition on rates of herbage growth and senescence in mixed swards under continuous stocking management. Grass Forage Sci. 1983, 38, 323–331. [Google Scholar] [CrossRef]
  34. SAS. SAS/STAT® 9.2 User’s Guide; SAS Institute Inc.: Cary, NC, USA, 2008. [Google Scholar]
  35. Wolfinger, R.D. Covariance structure selection in general mixed models. Commun. Stat. Simul. Comput. 1993, 22, 1079–1106. [Google Scholar] [CrossRef]
  36. Littel, R.C.; Pendergast, J.; Natarajan, R. Modelling covariance structure in the analysis of repeated measures data. Stat. Med. 2000, 19, 1793–1819. [Google Scholar] [CrossRef]
  37. R Development Core Team. R: A Language and Environment for Statistical Computing; R Foundation for Statistical Computing: Vienna, Austria, 2014. [Google Scholar]
  38. Parsons, A.J.; Johnson, I.R.; Harvey, A. Use of a model to optimize the interaction between frequency and severity of intermittent desfoliation and to provide a fundamental comparison of the continuous and intermittent desfoliation of grass. Grass Forage Sci. 1988, 43, 49–59. [Google Scholar] [CrossRef]
  39. Asner, G.P.; Scurlock, J.M.O.; Hicke, J. Global synthesis of leaf area index observations: Implications for ecological and remote sensing studies. Glob. Ecol. Biogeogr. 2003, 12, 191–205. [Google Scholar] [CrossRef]
  40. Ali, M.; Jeffers, D.L.; Henderlong, P.R. Interrelationship between leaf area, light interception and growth rate in a soybean-wheat system. Asian J. Plant Sci. 2003, 2, 605–612. [Google Scholar] [CrossRef]
  41. Faurie, O.; Soussana, J.F.; Sinoquet, H. Radiation Interception, Partitioning and Use in Grass—Clover Mixtures. Ann. Bot. 1996, 77, 35–45. [Google Scholar] [CrossRef]
  42. Vargas, L.A.; Andersen, M.N.; Jensen, C.R.; Jorgensen, U. Estimation of leaf area index, light interception and biomass accumulation of Miscanthus sinensis “Goliath” from radiation measurements. Biomass Bioenergy 2002, 22, 1–14. [Google Scholar] [CrossRef]
  43. Maddonni, G.A.; Otegui, M.E. Leaf area, light interception, and crop development in maize. Field Crops Res. 1996, 48, 81–87. [Google Scholar] [CrossRef]
  44. Firman, D.M.; Allen, E.J. Relationship between light interception, ground cover and leaf-area index in potatoes. J. Agric. Sci. 1989, 113, 355–359. [Google Scholar] [CrossRef]
  45. Carnevalli, R.A.; Da Silva, S.C.; Bueno, A.A.O.; Uebele, M.C.; Bueno, F.O.; Hodgson, J.; Silva, G.N.; Morais, J.P.G. Herbage production and grazing losses in Panicum maximum cv. Mombaça under four grazing managements. Trop. Grassl. 2006, 40, 165–176. [Google Scholar]
  46. Fonseca, L.; Mezzalira, J.C.; Bremm, C.; Filho, R.S.A.; Gonda, H.L.; Carvalho, P.C.F. Management targets for maximizing the short-term herbage intake rate of cattle grazing in Sorghum bicolor. Livest. Sci. 2012, 145, 205–211. [Google Scholar] [CrossRef]
  47. Fonseca, L.; Carvalho, P.C.F.; Mezzalira, J.C.; Bremm, C.; Galli, J.R.; Gregorini, P. Effect of sward surface height and level of herbage depletion on bite features of cattle grazing Sorghum bicolor swards. J. Anim. Sci. 2013, 91, 4357–4365. [Google Scholar] [CrossRef]
  48. Silveira, M.C.T.; Nascimento Júnior, D.; Rodrigues, C.S.; Pena, K.S.; Souza Júnior, S.J.; Barbero, L.M.; Limão, V.A.; Euclides, V.P.B.; Da Silva, S.C. Forage sward structure of Mulato grass (Brachiaria hybrid ssp.) subjected to rotational stocking strategies. Autralian J. Crop Sci. 2016, 10, 864–873. [Google Scholar] [CrossRef]
  49. Vera, G.E.; José, P.A.; Techio, P.L.E.; Barbosa, C.M.; Carneiro, S.S. Sward structure and forage intake rate of elephant grass cv. Napier subjected to strategies of intermittent stocking management. Crop Pasture Sci. 2022, 73, 692–703. [Google Scholar] [CrossRef]
  50. Woledge, J. The photosynthesis of ryegrass leaves growth in a simulated sward. Ann. Appl. Bot. 1973, 73, 229–237. [Google Scholar] [CrossRef]
  51. Lemaire, G. Ecophysiology of Grasslands: Dynamic Aspects of Forage Plant Populations in Grazed Swards. In International Grassland Congress, 19°, São Pedro, 2001. Proceedings; Fealq: Piracicaba, Brazil, 2001; pp. 29–37. [Google Scholar]
  52. Briske, D.D. Strategies of Plant Survival in Grazed Systems: A Functional Interpretation. In The Ecology; Hodgson, J., Illius, A.W., Eds.; CAB International: Wallingford, UK, 1996. [Google Scholar]
  53. Hernández Álvarez, U.M.; López Colomba, E.; Bollati, G.P.; Carloni, E.J.; Reutemann, A.G.; Grunberg, K.A. Effects of leaf and stem maturation on nutritional value in Megathyrsus maximus. J. Sci. Food Agric. 2024, 104, 2937–2946. [Google Scholar] [CrossRef] [PubMed]
  54. Hodgson, J.; Jamieson, W.S.; Kirby, E.J.M. Variations in herbage mass and digestibility and the behaviour and herbage intake of adult cattle and weaned calves. Grass Forage Sci. 1981, 36, 39–48. [Google Scholar] [CrossRef]
  55. Liebsch, D.; Keech, O. Dark-induced leaf senescence: New insights into a complex light-dependent regulatory pathway. New Phytol. 2016, 212, 563–570. [Google Scholar] [CrossRef] [PubMed]
  56. Korte, C.J.; Watkin, B.R.; Harris, W. Use of residual leaf area index and light interception as criteria for spring-grazing management of a ryegrass-dominant pasture. N. Z. J. Agric. Res. 1982, 25, 309–319. [Google Scholar] [CrossRef]
  57. Barbosa, R.A.; Nascimento, D., Jr.; Euclides, V.P.B.; Da Silva, S.C.; Zimmer, A.H.; Torres, R.A.A., Jr. Tanzânia grass subjected to combinations of intensity and frequency of grazing. Pesqui. Agropecuária Bras. 2007, 42, 329–340. [Google Scholar] [CrossRef]
  58. Zanini, G.D.; Santos, G.T.; Sbrissia, A.F. Frequencies and intensities of defoliation in Aruana guineagrass swards: Morphogenetic and structural characteristics. Rev. Bras. De Zootec. 2012, 41, 1848–1857. [Google Scholar] [CrossRef]
  59. Sbrissia, A.F.; Duchini, P.G.; Zanini, G.D.; Santos, G.T.; Padilha, D.A.; Schmitt, D. Defoliation strategies in pastures submitted to intermittent stocking method: Underlying mechanisms buffering forage accumulation over a range of grazing heights. Crop Sci. 2018, 58, 945–954. [Google Scholar] [CrossRef]
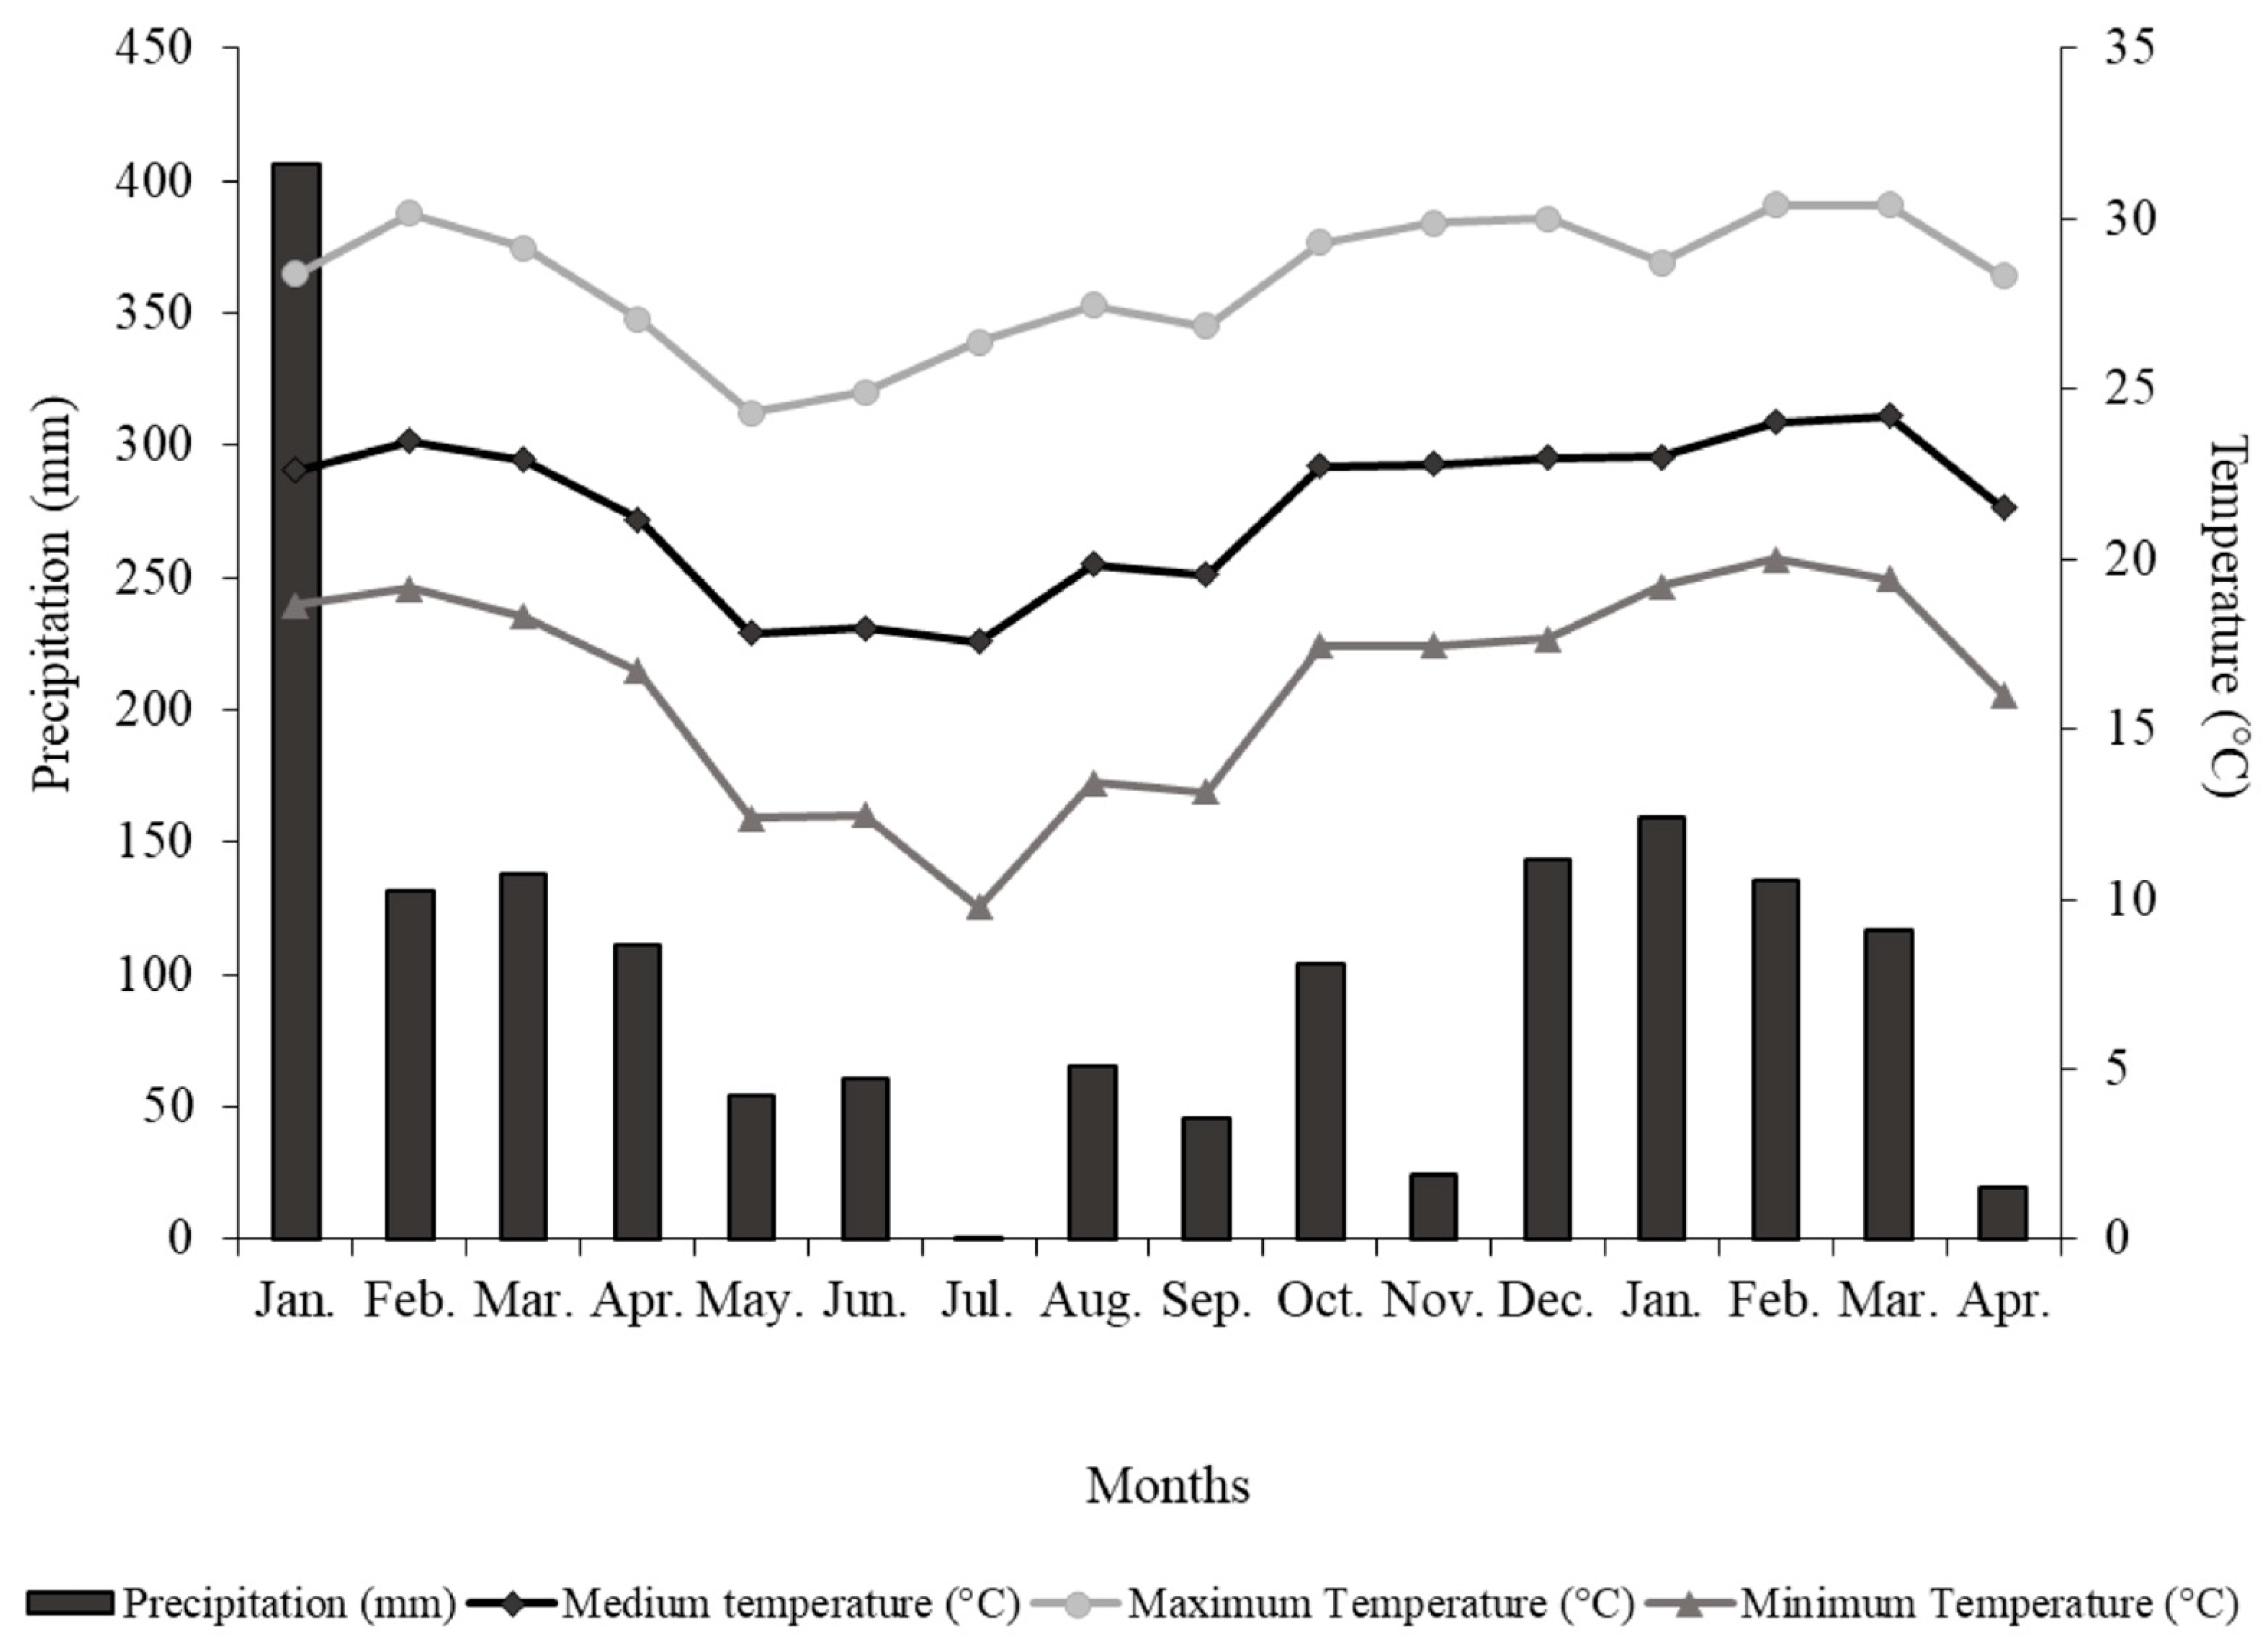
Figure 1. Monthly averages of precipitation, maximum temperature, average temperature, and minimum temperature, January to April 2009, in the experimental area.
Grasses 03 00013 g001
Figure 2. Monthly water balance extract in the experimental area from January to April 2009.
Grasses 03 00013 g002
Figure 3. Relationship between light interception and leaf area index during regrowth depending on rotational cattle grazing management.
Grasses 03 00013 g003
Figure 4. Pre-grazing height during regrowth of Mulatto grass depending on rotational cattle grazing management characterized by pre-grazing targets LI95% and LIMax from January to April 2009. Averages followed by the same letter do not differ from each other (p > 0.05).
Grasses 03 00013 g004
Figure 5. Total growth rate (TGR) during regrowth of Mulatto depending on rotational cattle grazing management. Averages followed by the same letter do not differ from each other (p > 0.05).
Grasses 03 00013 g005
Figure 6. Leaf growth rate (LGR) of Mulatto grass managed with pre-grazing targets LI95% and LIMax (A) during the regrowth period, (B) depending on rotational cattle grazing management. Averages followed by the same letter do not differ from each other (p > 0.05).
Grasses 03 00013 g006
Figure 7. Mulatto grass accumulation rate (GAR) managed with pre-grazing targets LI95% and LIMax (A) during the regrowth period (B) depending on rotational cattle grazing management. Averages followed by the same letter did not differ (p > 0.05).
Grasses 03 00013 g007
Table 1. Light interception in Mulatto grass during regrowth depending on rotational cattle grazing management.
Post-Grazing Height (cm)Pre-Grazing LI Target
LI95%LIMax
Initial phase (SEM = 0.70)
1580.964.3
2082.778.0
Intermediate phase (SEM = 0.27)
1590.595.0
2093.294.4
Final phase (SEM = 0.04)
1595.199.3
2095.199.2
Standard error of the mean. light interception.
Table 2. Post-grazing height (cm) during regrowth depending on rotational cattle grazing management.
Post-Grazing Height (cm)Pre-Grazing LI Target
LI95%LIMax
Initial phase (SEM = 0.20)
1514.820.8
2020.020.5
Intermediate phase (SEM = 0.43)
1522.632.8
2025.833.4
Final phase (SEM = 0.36)
1527.740.9
2029.844.2
Standard error of the mean. light interception.
Table 3. Stem growth rate during regrowth of Mulatto grass depending on rotational cattle grazing management characterized by pre-grazing targets LI95% and LIMax from January to April 2009.
Regrowth PhasePre-Grazing LI Targets SEM
LI95%LIMax
(kg ha−1·day−1)
Initial71.0 Aa46.3 Bab4.2
Intermediate51.7 Ab40.4 Bb4.2
Final45.2 Bb53.5 Aa5.4
Averages followed by the same capital letter in the rows and lower case in the columns do not differ (p > 0.05). Standard error of the mean. light interception.
Table 4. Stem growth rate during regrowth of Mulatto depending on rotational cattle grazing management characterized by post-grazing height targets 15 and 20.
Regrowth PhasePost-Grazing Height (cm)SEM
1520
(kg ha−1·day−1)
Initial45.5 Ba71.8 Aa4.2
Intermediate43.2 Aa48.8 Ab4.2
Final48.2 Aa50.5 Ab5.4
Averages followed by the same capital letter in the rows and lower case in the columns do not differ (p > 0.05). Standard error of the mean.
Table 5. Leaf senescence rate during regrowth of Mulatto grass depending on rotational cattle grazing management characterized by pre-grazing targets LI95% and LIMax.
Regrowth PhasePre-Grazing LI Targets SEM
LI95%LIMax
(kg ha−1 day−1)
Initial60.9 Aa42.4 Bc5.5
Intermediate46.7 Aa56.8 Ab5.0
Final53.9 Ba72.3 Aa5.0
Averages followed by the same capital letter in the rows and lower case in the columns do not differ (p > 0.05). Standard error of the mean. light interception.
Table 6. Senescence/growth ratio during regrowth of Mulatto grass depending on rotational cattle grazing management characterized by pre-grazing targets of LI95% and LIMax.
Regrowth PhasePre-Grazing LI Targets SEM
LI95%LIMax
Initial0.27 Aa0.30 Ab0.03
Intermediate0.23 Ba0.44 Aa0.03
Final0.27 Ba0.47 Aa0.03
Averages followed by the same capital letter in the rows and lower case in the columns do not differ (p > 0.05). Standard error of the mean. light interception.
Disclaimer/Publisher’s Note: The statements, opinions and data contained in all publications are solely those of the individual author(s) and contributor(s) and not of MDPI and/or the editor(s). MDPI and/or the editor(s) disclaim responsibility for any injury to people or property resulting from any ideas, methods, instructions or products referred to in the content.