Article

Evolutionary Conservation and Diversification of Five Pax6 Homologs in the Horseshoe Crab Species Cluster

by
Tanay Dakarapu
1 and
Markus Friedrich
1,2,*
1
Department of Biological Sciences, Wayne State University, 5047 Gullen Mall, Detroit, MI 48202, USA
2
Department of Ophthalmological, Visual, and Anatomical Sciences, School of Medicine, Wayne State University, 540 East Canfield Avenue, Detroit, MI 48201, USA
*
Author to whom correspondence should be addressed.
Arthropoda 2024, 2(1), 85-98; https://doi.org/10.3390/arthropoda2010007
Submission received: 1 September 2023 / Revised: 25 February 2024 / Accepted: 28 February 2024 / Published: 4 March 2024

Abstract

:
Horseshoe crabs represent the most ancestral chelicerate lineage characterized by marine ecology and the possession of lateral compound eyes. While considered living fossils, recent studies reported an unusual number of Pax6 genes in the Atlantic horseshoe crab Limulus polyphemus. Pax genes encode ancient metazoan transcription factors, which comprise seven subfamilies. Among these, the members of the Pax6 subfamily confer critical functions in the development of the head, the visual system, and further body plan components. Arthropods are generally characterized by two Pax6 subfamily homologs that were discovered in Drosophila and named eyeless (ey) and twin of eyeless (toy). However, whole genome sequence searches uncovered three homologs of ey and two homologs of toy in L. polyphemus. These numbers are explained by the occurrence of likely three whole genome duplications in the lineage to the last common ancestor of L. polyphemus and the three additional members of the extant horseshoe crab species cluster. Here, we report that all five L. polyphemus Pax6 paralogs are conserved in the approximately 135-million-year-old horseshoe crab species cluster and that they evolve under strong purifying selection. Largely homogenous protein sequence diversification rates of ey and toy paralogs suggest subfunctionalization as the likeliest preservation trajectory. However, our studies further revealed evidence that the horseshoe crab ey1 and ey2 paralogs share a derived splice isoform that encodes a unique five amino acid-long insertion in helix 3 of the homeodomain. This suggests that the exceptional expansion of the horseshoe crab Pax6 gene family repertoire was also associated with regulatory diversification and possibly innovation.

1. Introduction

Together with Myriapoda and Pancrustacea, chelicerates constitute one of the three monophyletic subphyla of the arthropods. Best known for fear-instilling terrestrial taxa like harvestmen, scorpions, and spiders [1], chelicerate biodiversity also includes two ancient marine lineages, i.e., sea spiders and horseshoe crabs (Xiphosura). Among these two, horseshoe crabs stand out by the conservation of canonical arthropod compound eyes [2,3,4] as part of an overall body plan design that is famous for qualifying as a “living fossil” [5].
The Atlantic horseshoe crab Limulus polyphemus has played a pivotal role in early vision research [2]. Two vision-related gene families received exceptional attention in L. polyphemus: opsins, an ancient family of light-sensitive transmembrane receptors [6], and the equally ancient developmental transcription factor subfamily Pax6 [7]. The first arthropod homologs of the Pax6 gene family were discovered in the fruit fly Drosophila melanogaster, which possesses two homologs of Pax6 named eyeless (ey) and twin of eyeless (toy) [8]. Comparative analyses of the past 15 years revealed that the presence of two Pax6 genes in Drosophila and other arthropods is due to a gene duplication that must have taken place over 500 million years ago in the arthropod stem lineage [9]. Given this deep conservation of singleton homologs of ey and toy in arthropods, it came as a surprise to find not only one Pax6 ortholog in L. polyphemus that was originally uncovered by gene cloning efforts [7] but three orthologs of ey and two orthologs of toy in the whole genome assembly of L. polyphemus [10].
While unexpected, given the generally limited range of Pax transcription factor gene family size variation in arthropods, these findings align with the comparative genomic reconstruction of whole genome duplication (WGD) events in the xiphosuran stem lineage. Initial evidence of this exceptional trajectory emerged from the analysis of the first genome assemblies for L. polyphemus [6,11]. In addition to L. polyphemus, extant Xiphosura include the Mangrove horseshoe crab Carcinoscorpius rotundicauda, the Chinese horseshoe crab Tachypleus tridentatus, and the Indo-Pacific horseshoe crab Tachypleus gigas [12,13]. Comparative genomic analyses timed the earliest split of L. polyphemus from the other three species to approximately 135 million years ago and the split of C. rotundicauda from the last common ancestor of T. tridentatus and T. gigas to about 50 million years ago [14,15].
The comparative analysis of the organization of the homeobox (Hox) gene clusters in L. polyphemus, C. rotundicauda, and T. tridentatus revealed evidence of at least one WGD in the xiphosuran lineage to the last common ancestor of extant horseshoe crabs [6,11]. Subsequent analyses of high-quality whole-genome assemblies for all four xiphosuran species, however, suggested a total of three WGDs in the xiphosuran lineage [16,17,18]. Horseshoe crabs thus stand out by having been molded by more WGDs compared to the two rounds of WGD in the early vertebrates [19,20,21,22] and the independent WGD discovered for terrestrial chelicerates [23], i.e., the Arachnopulmonata (Figure 1).
While these insights shed light into the cause for the large number of Pax6 homologs in horseshoe crab species, it is unknown which evolutionary forces led to their final numbers and whether these paralogous loci serve novel or ancestral functions. Novel functions can be acquired by a process that is referred to as neofunctionalization following gene duplication [24,25]. Alternatively, the duplication of highly pleiotropic genes frequently results in the differential inheritance of ancestral functions in the descendant gene duplicates, i.e., subfunctionalization [24,25]. These basic scenarios can be distinguished by comparative analysis of substitution rates both at the amino acid and nucleotide sequence levels. Neofunctionalized paralogs, for instance, are generally characterized by transiently increased amino acid substitution rates as a result of positive selection on function-optimizing amino acid residue replacements [26]. In the case of subfunctionalization, by contrast, sister paralogs are less likely to differ dramatically in their protein sequence substitution rates. The release of constraints resulting from the reduction of pleiotropy, however, can lead to moderate but detectable transient increases in protein substitution rates [27]. Last but not least, paralogous genes can also maintain genetically redundant functions, thereby buffering the impacts of environmental or gene regulatory variation [28,29]. A case in point is the deeply conserved redundant specification of the ocular segment region by ey and toy in arthropods [9].
An alternative approach to probing for innovative versus conservative sequence evolution trajectories is the comparison of non-synonymous versus synonymous sequence changes at the nucleotide sequence level [30]. Grounded in the neutral theory of molecular evolution [31], strong positive selection on coding sequences is predicted to lead to a higher rate in the fixation of non-synonymous nucleotide substitutions (dN) compared to the base rate of silent substitution accumulation (dS). By the same token, strong purifying selection on coding sequences is indicated by a lower dN compared to the dS.
In this study, we pursued two aims. First, we asked whether all five Pax6 paralogs discovered in L. polyphemus were conserved in other horseshoe crab species. Our second aim was to probe for sequence evidence of innovative versus conservative gene duplication outcomes by analyzing dN/dS ratios along the horseshoe crab species cluster tree. Our efforts revealed the conservation of Pax6 gene subfamily size in the horseshoe crabs and that all five xiphosuran Pax6 homologs have evolved under strong purifying selection, identifying subfunctionalization as their likeliest post-WGD trajectories. However, in addition, our efforts detected evidence of derived alternative splice sites that are predicted to facilitate the expression of isoforms with modified binding capacities in two of the three ey paralogs. This finding raises the possibility of the post-WGD emergence of novel, possibly innovative regulatory mechanisms.

2. Materials and Methods

2.1. Genome Assembly Sources

Homolog searches were conducted in the GenBank assembly GCF_000517525.1 of L. polyphemus, GenBank assembly GCA_011833715.1 for the IMCB_SINMHF_001 isolate of C. rotundicauda, GenBank assembly GCA_004102145.1 for T. tridentatus isolate BBG1, and GenBank assembly GCA_014155125.1 for T. gigas isolate IMCB_SINCHF_001. See Table S1 for details.

2.2. Homolog Searches

BLASTp searches were conducted in the NCBI genome assembly environments for all four xiphosuran species applying default settings, i.e., expected partition of chance matches set to threshold 0.05, word size 5, BLOSUM62 protein sequence evolution model-based alignment score determination, and gap costs existence 11 vs. extension ratio set at 11:1.

2.3. Gene Model Annotation

Gene models were produced by hand-annotation of transcription start sites and exon/intron borders in downloaded chromosome and scaffold text files (Text Document S1). The putative mRNA sequence models for T. tridentatus were compared with their corresponding transcripts in previously released embryonic T. tridentatus transcriptomes [32].

2.4. Gene Tree Reconstruction

We generated a multiple sequence alignment of the conceptual protein sequences with T-Coffee at default settings [33]. The Pax6 homolog NP_001231130 of mouse (Mus musculus) and the ey and toy singleton homologs XP_015903847 and XP_042898599 of the common house spider Parasteatoda tepidariorum (Arachnopulmonata: Araneae) and XP_015834313 and XP_008192127 of the red flour beetle Tribolium castaneum (Insecta: Coleoptera) were included to root the xiphosuran ey and toy paralog clusters. Given the high degree of overall sequence conservation, the alignment was used as direct input for gene tree estimation with Randomized Accelerated Maximum Likelihood (RAxML) [34] as made available in the CIPRES Science Gateway online user interface [35]. We applied the Jones–Taylor–Thornton (JTT) model of amino acid sequence evolution and implemented gamma-distributed substitution rates across sites with 3 categories.

2.5. dN/dS Analysis

dN/dS ratios were computed using the online Ka/Ks Calculation tool (https://services.cbu.uib.no/tools/kaks, accessed on 16 August 2023) [36,37]. We submitted complete open reading frame nucleotide sequences and the species tree (Figure 1) and applied the discrete Grantham submatrix option without codon bias.

2.6. Molecular Clock Analysis

Tests for departure from molecular clock rate constancy of L. polyphemus ey and toy paralog protein sequences were conducted using Tajima’s relative rate test as implemented in the Molecular Evolutionary Genetics Analysis suite version 11 [38,39]. The singleton orthologs of ey (XP_015903847) and toy (XP_042898599) of the common house spider P. tepidariorum were used as outgroups. Sequences were aligned with Clustal Omega provided by the European Molecular Biology Laboratory-European Bioinformatics Institute online interface [40,41]. Alignment regions with gaps were excluded, and the JTT model was chosen as the protein sequence evolution model.

2.7. Phylogenetic Analysis of Interparalog Amino Acid Residue Differences

To determine amino acid residue changes that accumulated in paralogs before the split of the last common ancestor of the horseshoe crab species cluster from amino acid changes that accumulated in select paralogs following the emergence of the four horseshoe crab species, we generated separate protein sequence alignments for the ey and toy paralogs from all four horseshoe crab species and included the respective singleton orthologs of the common house spider P. tepidariorum and the Arizona bark scorpion Centruroides sculpturatus for outgroup-based ancestral state determination (Figures S1 and S2). Amino acid residue differences between paralogs that were shared among all four species representatives were designated to be of putative pre-speciation origin in contrast to amino acid residue differences that were unique to select species and, therefore, designated of post-speciation origin.

3. Results

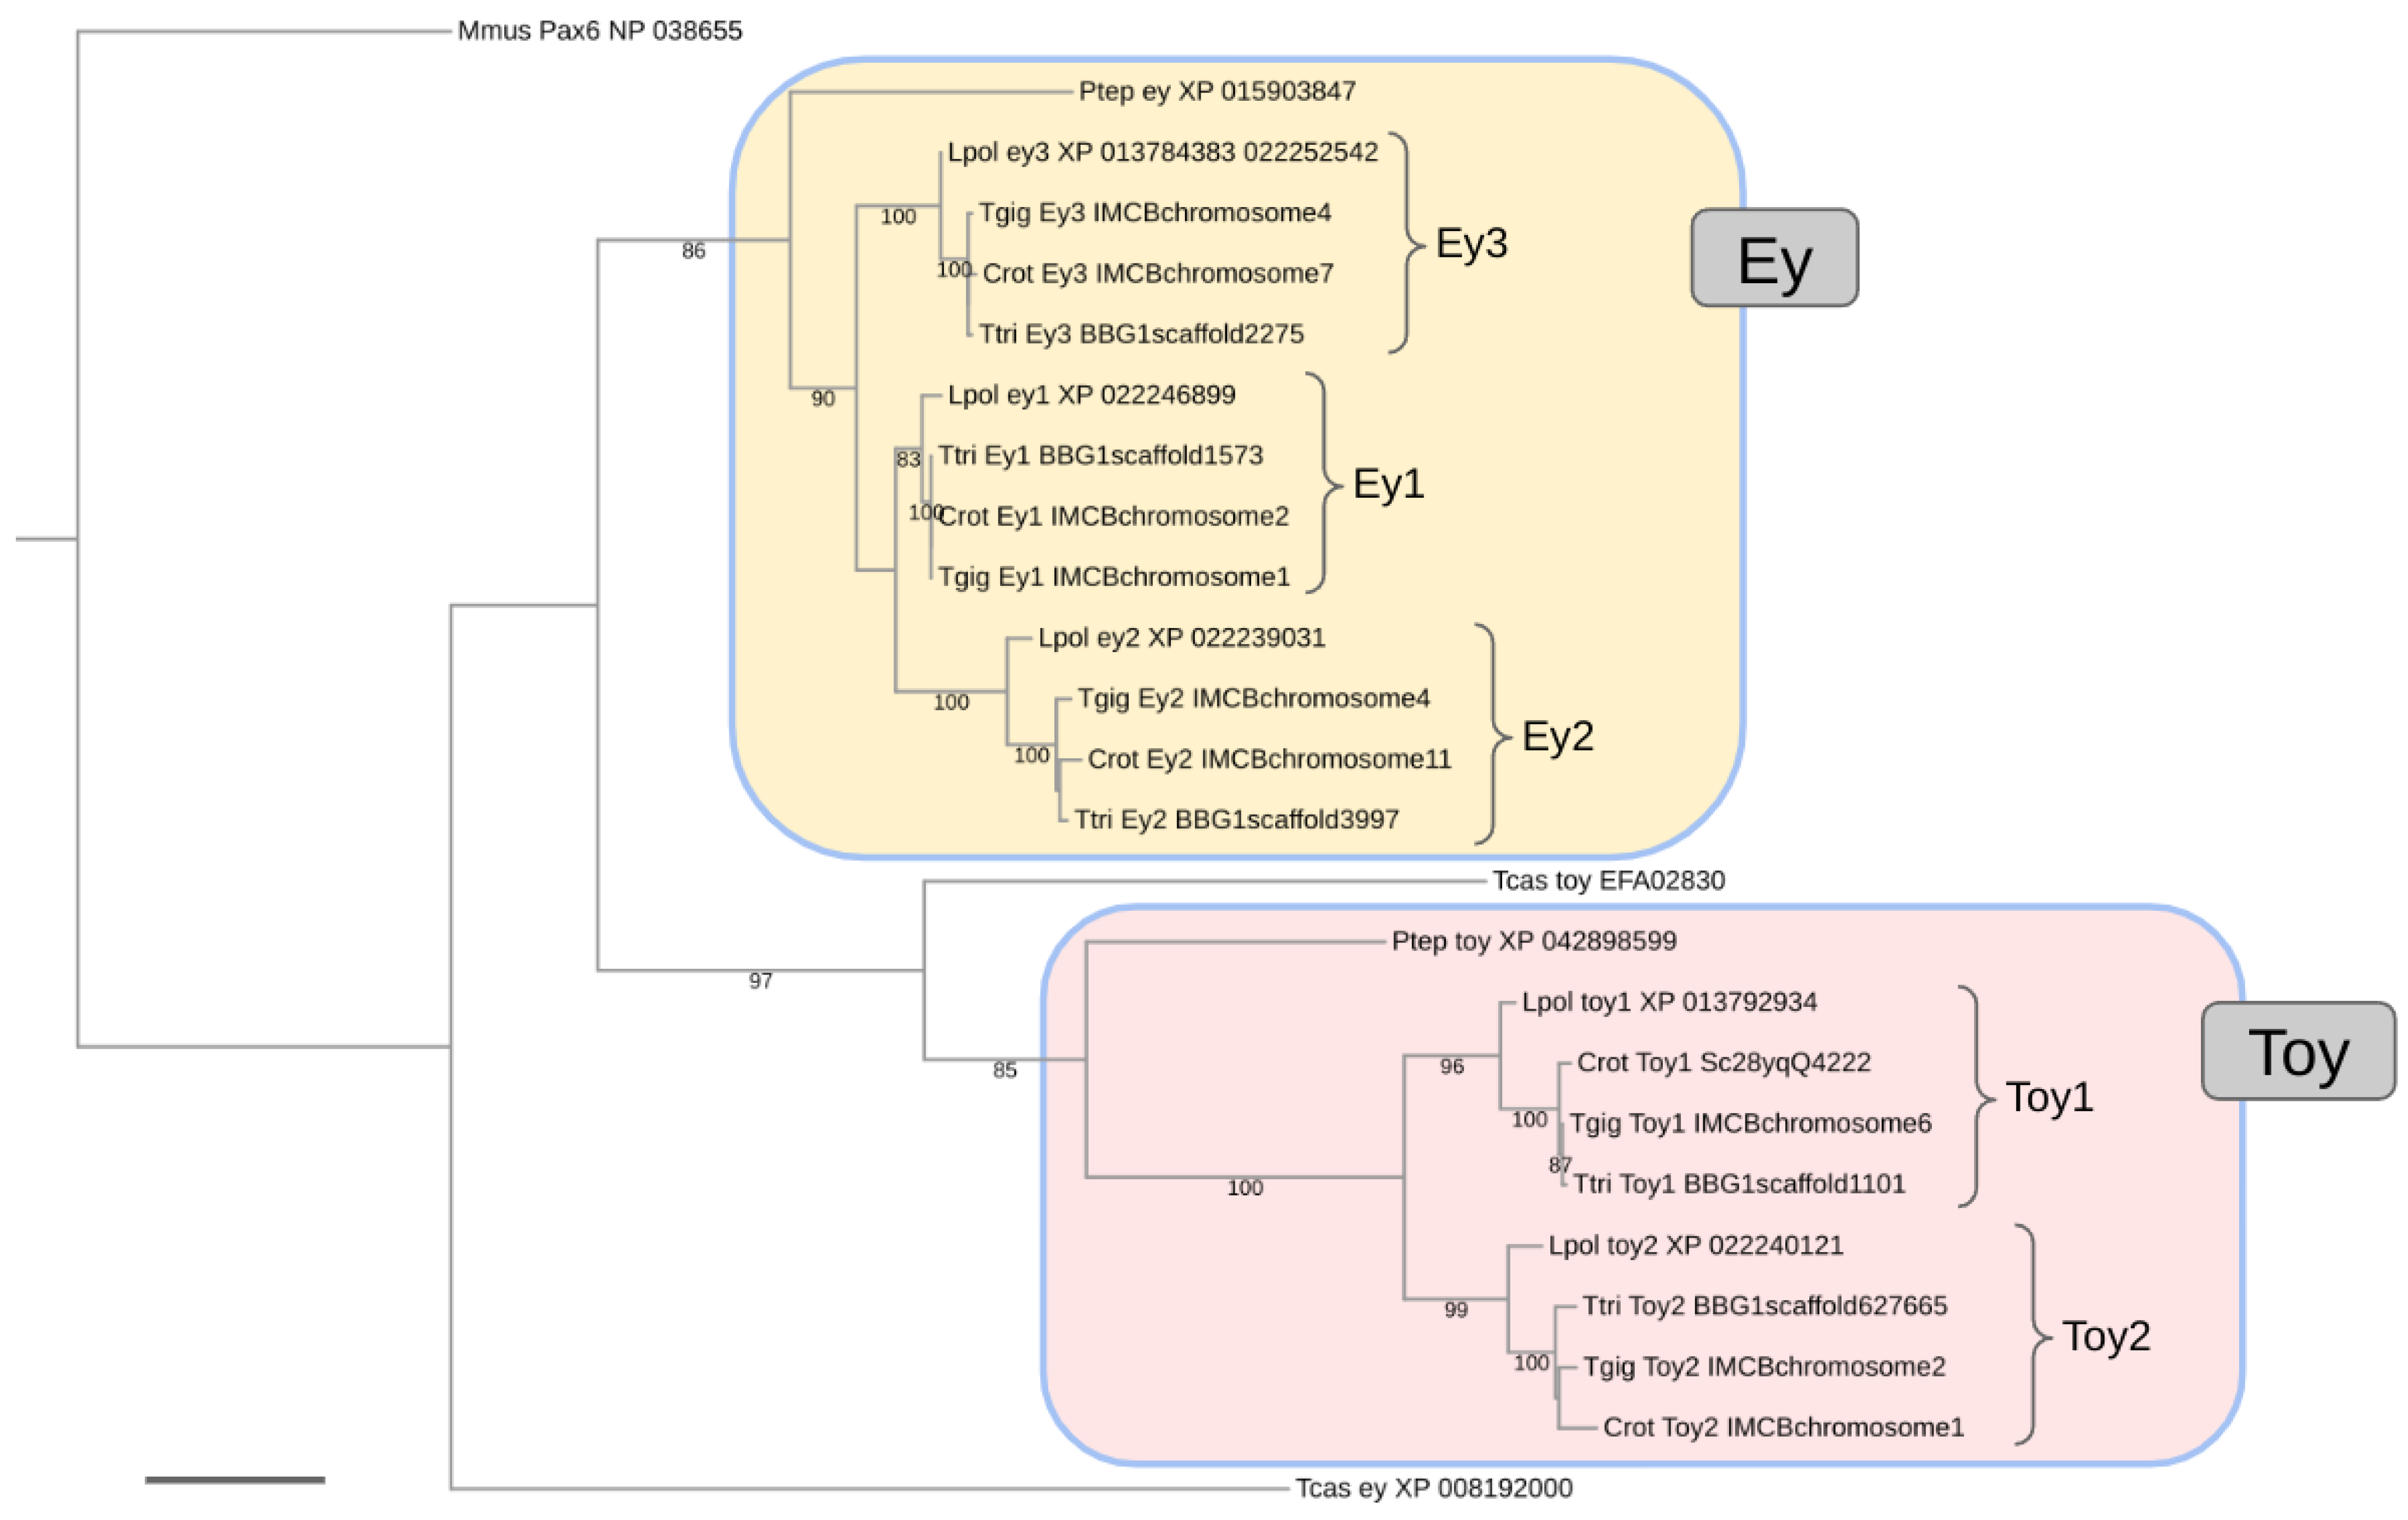
3.1. Conservation of Three Homologs of ey in Horseshoe Crabs

Previous BLAST searches identified three distinct homologs of ey in L. polyphemus, which contrasted with the conservation of a singleton homolog of ey throughout all other arthropods investigated so far, including other chelicerates [10]. To probe for the conservation of all three L. polyphemus ey homologs in other horseshoe crab species, we searched the genome assemblies of C. rotundicauda, T. tridentatus, and T. gigas by tBLASTn with the L. polyphemus ey1, ey2, and ey3 homologs as queries. Candidate homologs were re-BLASTed against reference protein databases of L. polyphemus and D. melanogaster to filter false-positive orthology assignments. These efforts and preliminary gene tree analyses identified 1:1 orthologs of L. polyphemus ey1, ey2, and ey3 in all of the other three horseshoe crab species (Table S1). Of note, all of the putative ey homologs were characterized by the previously described lysine residue at position 64 of the Pax domain, which is diagnostic for ey throughout arthropods (Figure S1) [9,10].
Subsequently, we hand-annotated all of the relevant loci to produce complete conceptual transcripts, open reading frames, and protein sequences for ey1, ey2, and ey3 of C. rotundicauda, T. tridentatus, and T. gigas (Text Documents S1 and S2). In the process, we noticed that the NCBI model of L. polyphemus ey3 (LOC106468500) was incomplete by missing the first exon, which was erroneously annotated as linked separate upstream locus (LOC106468499) (Table S1).
Multiple sequence alignment of the protein sequences revealed a high level of sequence conservation between xiphosuran ey1, ey2, and ey3 orthologs (Figure S1). Most sequence differences stemmed from single amino acid residue replacements. The ey2 homolog of L. polyphemus stood out by a five amino acid-long deletion close to the N-terminal end of the Pax domain and a two-alanine-residue-long insertion following the N-terminal end of the homeodomain (HD). Both of these larger scale differences mapped to sequence variable regions of ey based on outgroup comparisons with the singleton ey orthologs of the common house spider P. tepidariorum and the red flour beetle T. castaneum (Figure S1).
The global protein sequence-based gene tree analysis confirmed the presumed orthology relationships of the individual ey homologs (Figure 2). Moreover, the closer relationship of C. rotundicauda, T. tridentatus, and T. gigas with respect to L. polyphemus was robustly resolved in all ortholog clusters. No robust resolution, however, was obtained for the relationships between the C. rotundicauda, T. tridentatus, and T. gigas 1:1 orthologs or the relationships between the ey1, ey2, and ey3 ortholog clusters (Figure 2).

3.2. Conservation of Two Homologs of toy in Horseshoe Crabs

Previous studies also identified two homologs of toy in L. polyphemus [10]. To probe for their conservation in the horseshoe crab species assembly, we proceeded in the same way as in the investigation of the conservation of the three homologs of ey. As a result of this effort, we also found that both L. polyphemus homologs of toy were conserved in C. rotundicauda, T. tridentatus, and T. gigas (Table S1). All toy homologs were consistently characterized by the previously described diagnostic arginine residue at position 64 of the Pax domain (Figure S2) [9,10]. The global gene tree analysis confirmed the presumed orthology relationships of all individual toy homologs (Figure 2).
As in the case of the ey homologs, multiple sequence alignment of the xiphosuran toy protein sequences revealed a high level of sequence conservation (Figure S2). Most sequence differences between 1:1 orthologs of toy1 or toy2 stemmed from single amino acid residue replacements. The toy1 homolog of T. gigas was characterized by the deletion of a proline residue in a sequence variable region 54 residues C-terminal of the HD (Figure S2). In addition, the toy1 homologs of C. rotundicauda, T. tridentatus, and T. gigas were characterized by a shared insertion of three amino acid residues in a variable sequence region 23 amino acid residues C-terminal of the above-mentioned T. gigas variable site (Figure S2).

3.3. Strong Purifying Selection on All Horseshoe Crab Pax6 Homologs

The conservation of complete open reading frames for all xiphosuran Pax6 transcription factor homologs provided compelling evidence of their continued functionality in the horseshoe species cluster. To further scrutinize for functional conservation, we took advantage of the overall high conservation at the nucleotide sequence level of the horseshoe crab toy and ey homologs and conducted selection pressure analysis by dN/dS ratio analysis (Figure 3).
Consistent with functional conservation, all five horseshoe crab Pax6 paralogs were characterized by dN/dS values below zero. Averaged across the phylogeny of the xiphosuran species tree, the dN/dS ratios of toy1 and toy2 were very similar, with values of 0.08 and 0.12, respectively (Table S2). The dN/dS values of 0.02 for ey1 and 0.04 for ey3 suggested a slightly higher strength of purifying selection compared to toy1 and toy2. The ey2 homolog, finally, stood out with the highest across phylogeny dN/dS value of 0.22, indicating a possibly weaker degree of purifying selection.

3.4. Largely Homogenous Protein Sequence Diversification Rates among the Xiphosuran ey and toy Paralogs

The high levels of purifying selection on all five horseshoe crab Pax6 transcription factor paralogs since the diversification of the four modern horseshoe crab lineages were compatible with preservation due to subfunctionalization or conserved functional redundancy in the aftermath of the xiphosuran WGDs. A third possibility was that one or more of the new paralogs acquired evolutionarily novel functions, i.e., underwent neofunctionalization, before the diversification of the four modern horseshoe crab lineages.
Neofunctionalization trajectories can be indicated by accelerated rates of amino acid change. To probe for possibly significant amino acid diversification rate differences among the xiphosuran ey and toy paralogs, we conducted Tajima relative rate tests on the L. polyphemus ey and toy paralogs using the singleton ey and toy orthologs of the spider P. tepidariorum as outgroup sequences (Figure 4 and Table S3). This approach produced only marginally significant evidence of diverged amino acid substitution rates between L. polyphemus ey1 and L. polyphemus ey2 (p = 0.0186). None of the other pairwise relative rate test combinations rejected clock-like diversification rates (Figure 4). Overall, these findings favored subfunctionalization or conserved functional redundancy as explanations for the persistence of the increased numbers of Pax6 paralogs in the modern horseshoe crabs.

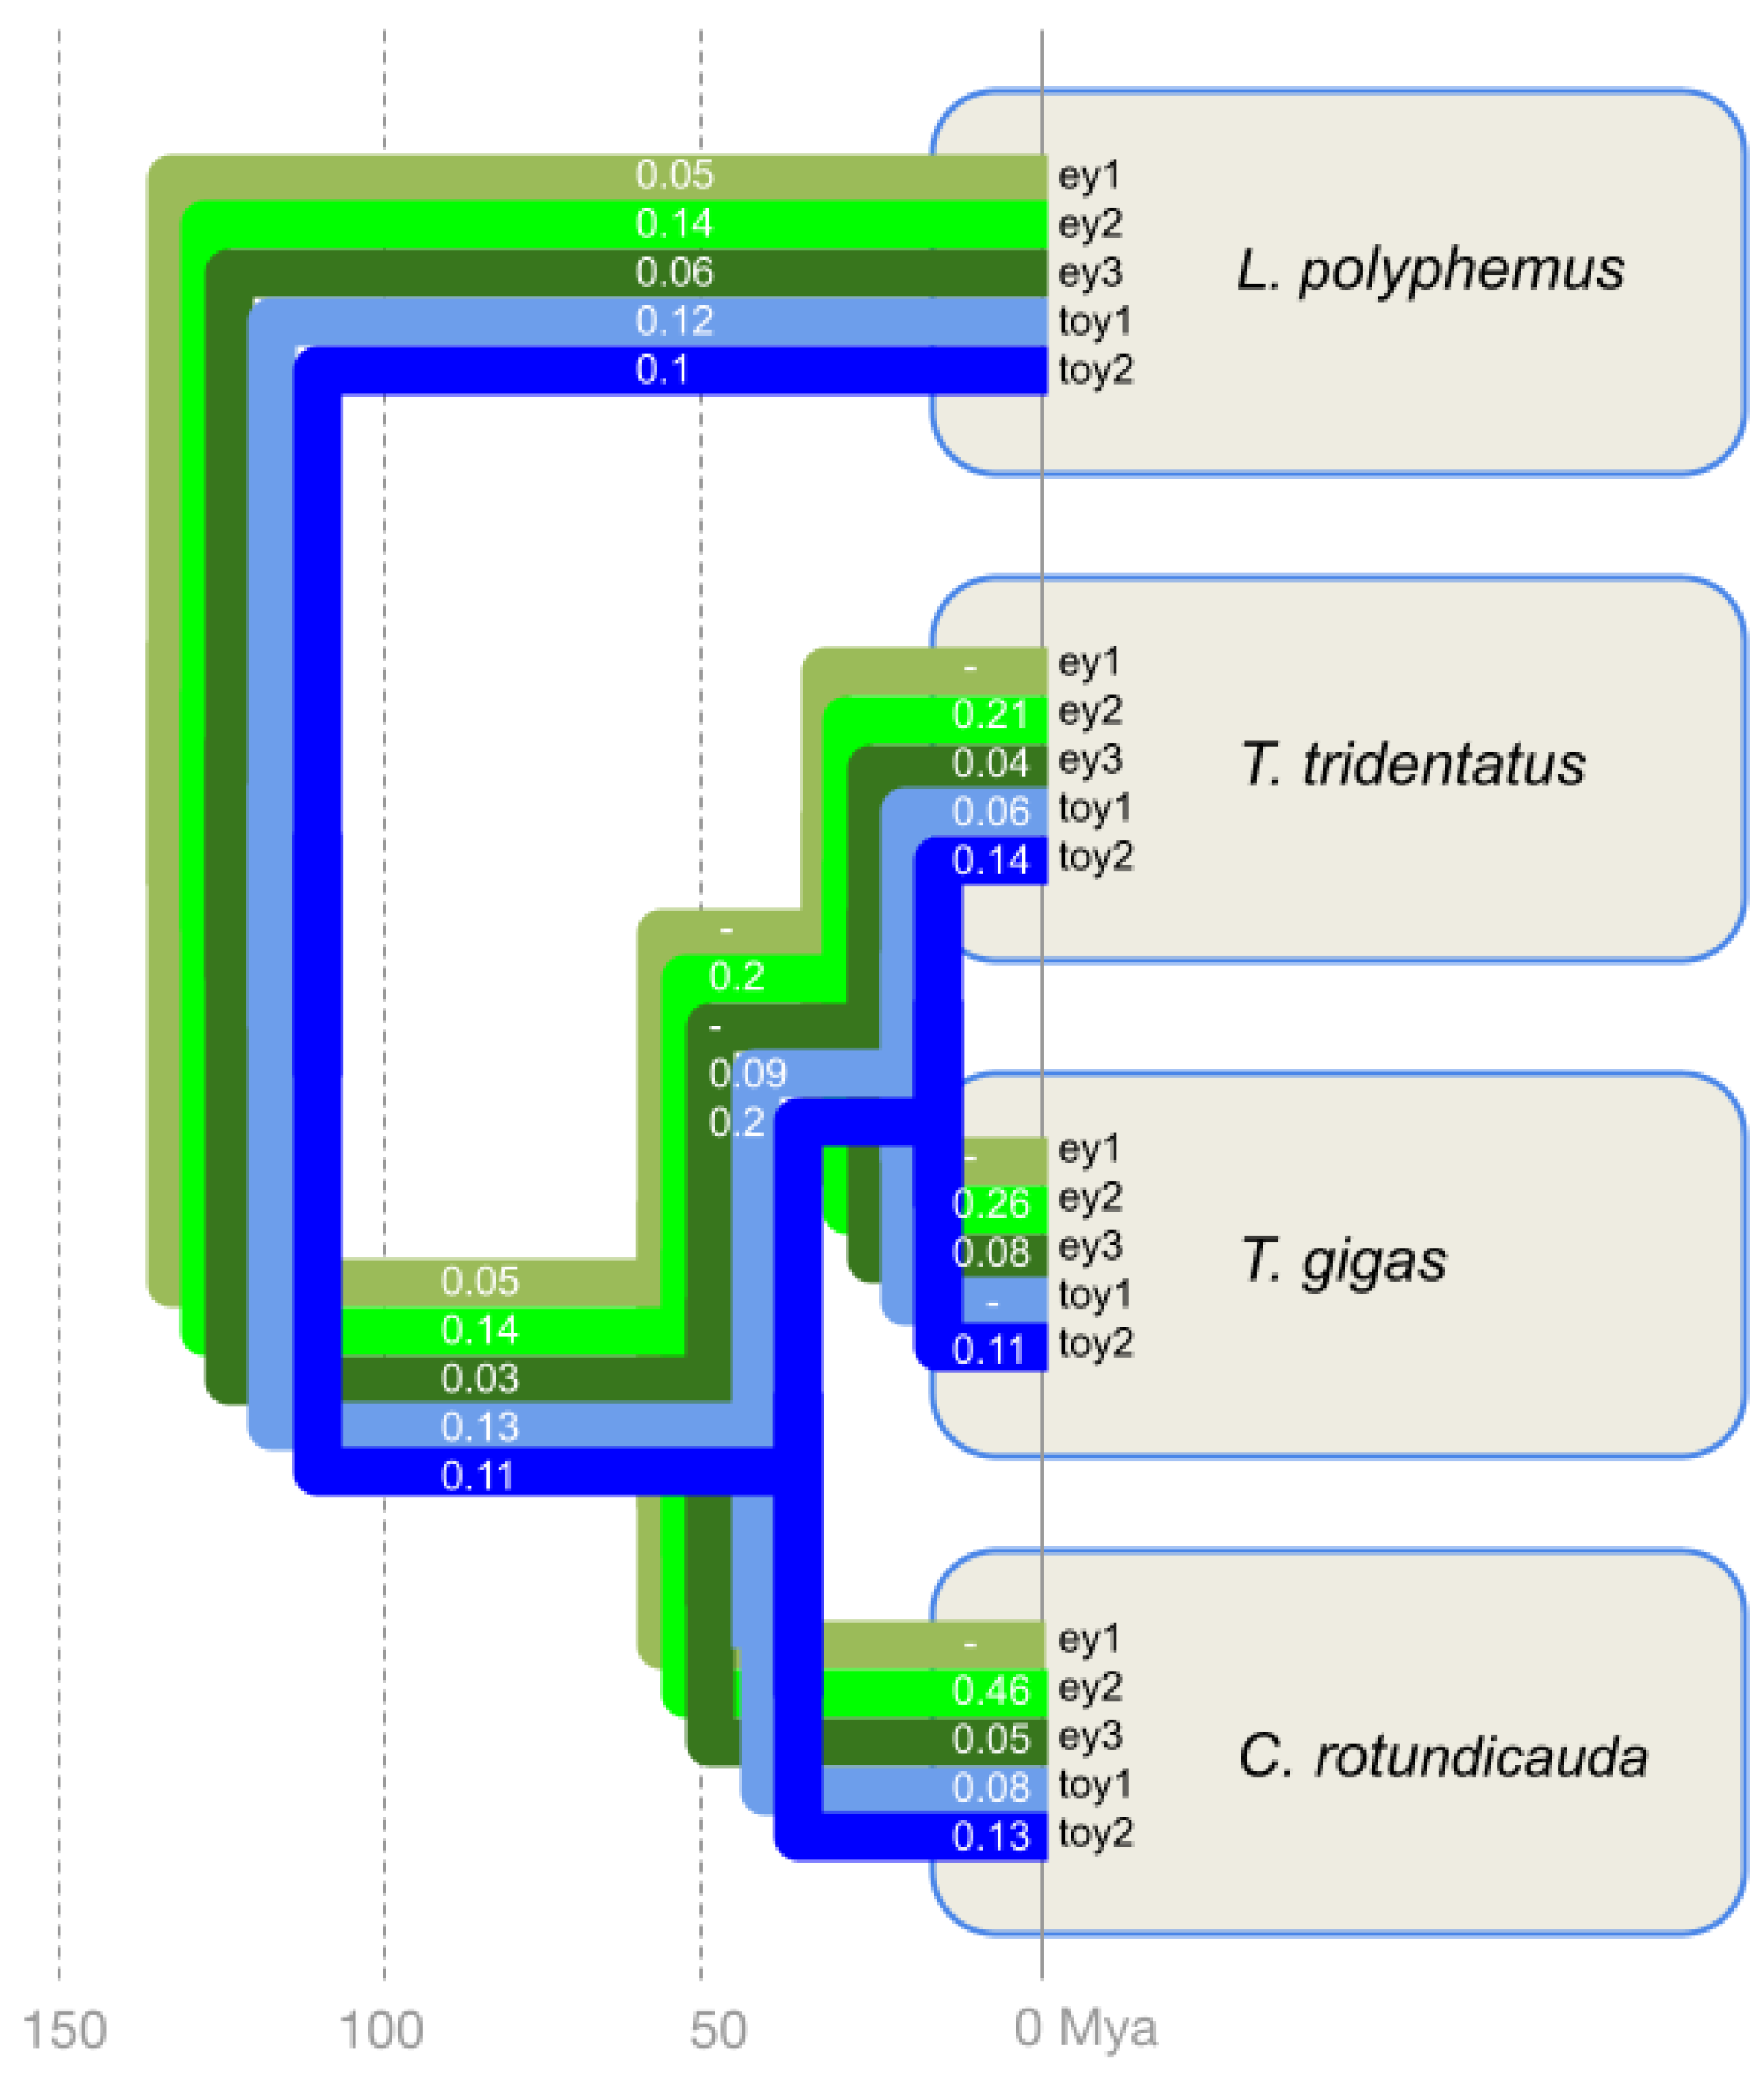
3.5. Evidence of Higher Paralog Protein Sequence Diversification Rates Preceding Lineage Separation in the Horseshoe Crab Species Cluster

As a complementary approach to characterizing the protein sequence diversification dynamics of the xiphosuran ey and toy paralogs, we tallied the number of amino acid residue changes preceding and following species separation. To this end, we analyzed amino acid states in multiple sequence alignments of the ey and toy paralogs using the ey and toy singleton orthologs of P. tepidariorum and the Arizona bark scorpion C. sculpturatus for outgroup-based ancestral state determination (Figures S1 and S2). This effort revealed consistently higher numbers of pre- vs. post-speciation amino acid replacements (Table 1). Equally notable, the amino acid change differences between paralogs correlated with the differences detected in purifying selection strengths estimated by dN/dS analysis. Specifically, ey1, which was characterized by the highest degree of purifying selection, was also characterized by the lowest amount of amino acid change (Table 1). Conversely, ey2, which was characterized by the lowest degree of purifying selection, was characterized by the highest amount of amino acid change compared to ey1 and ey3 paralogs. Finally, the lower levels of purifying selection detected for toy1 and toy2 compared to ey1 and ey3 correlated with higher numbers of both pre- and post-speciation amino acid replacements (Table 1).

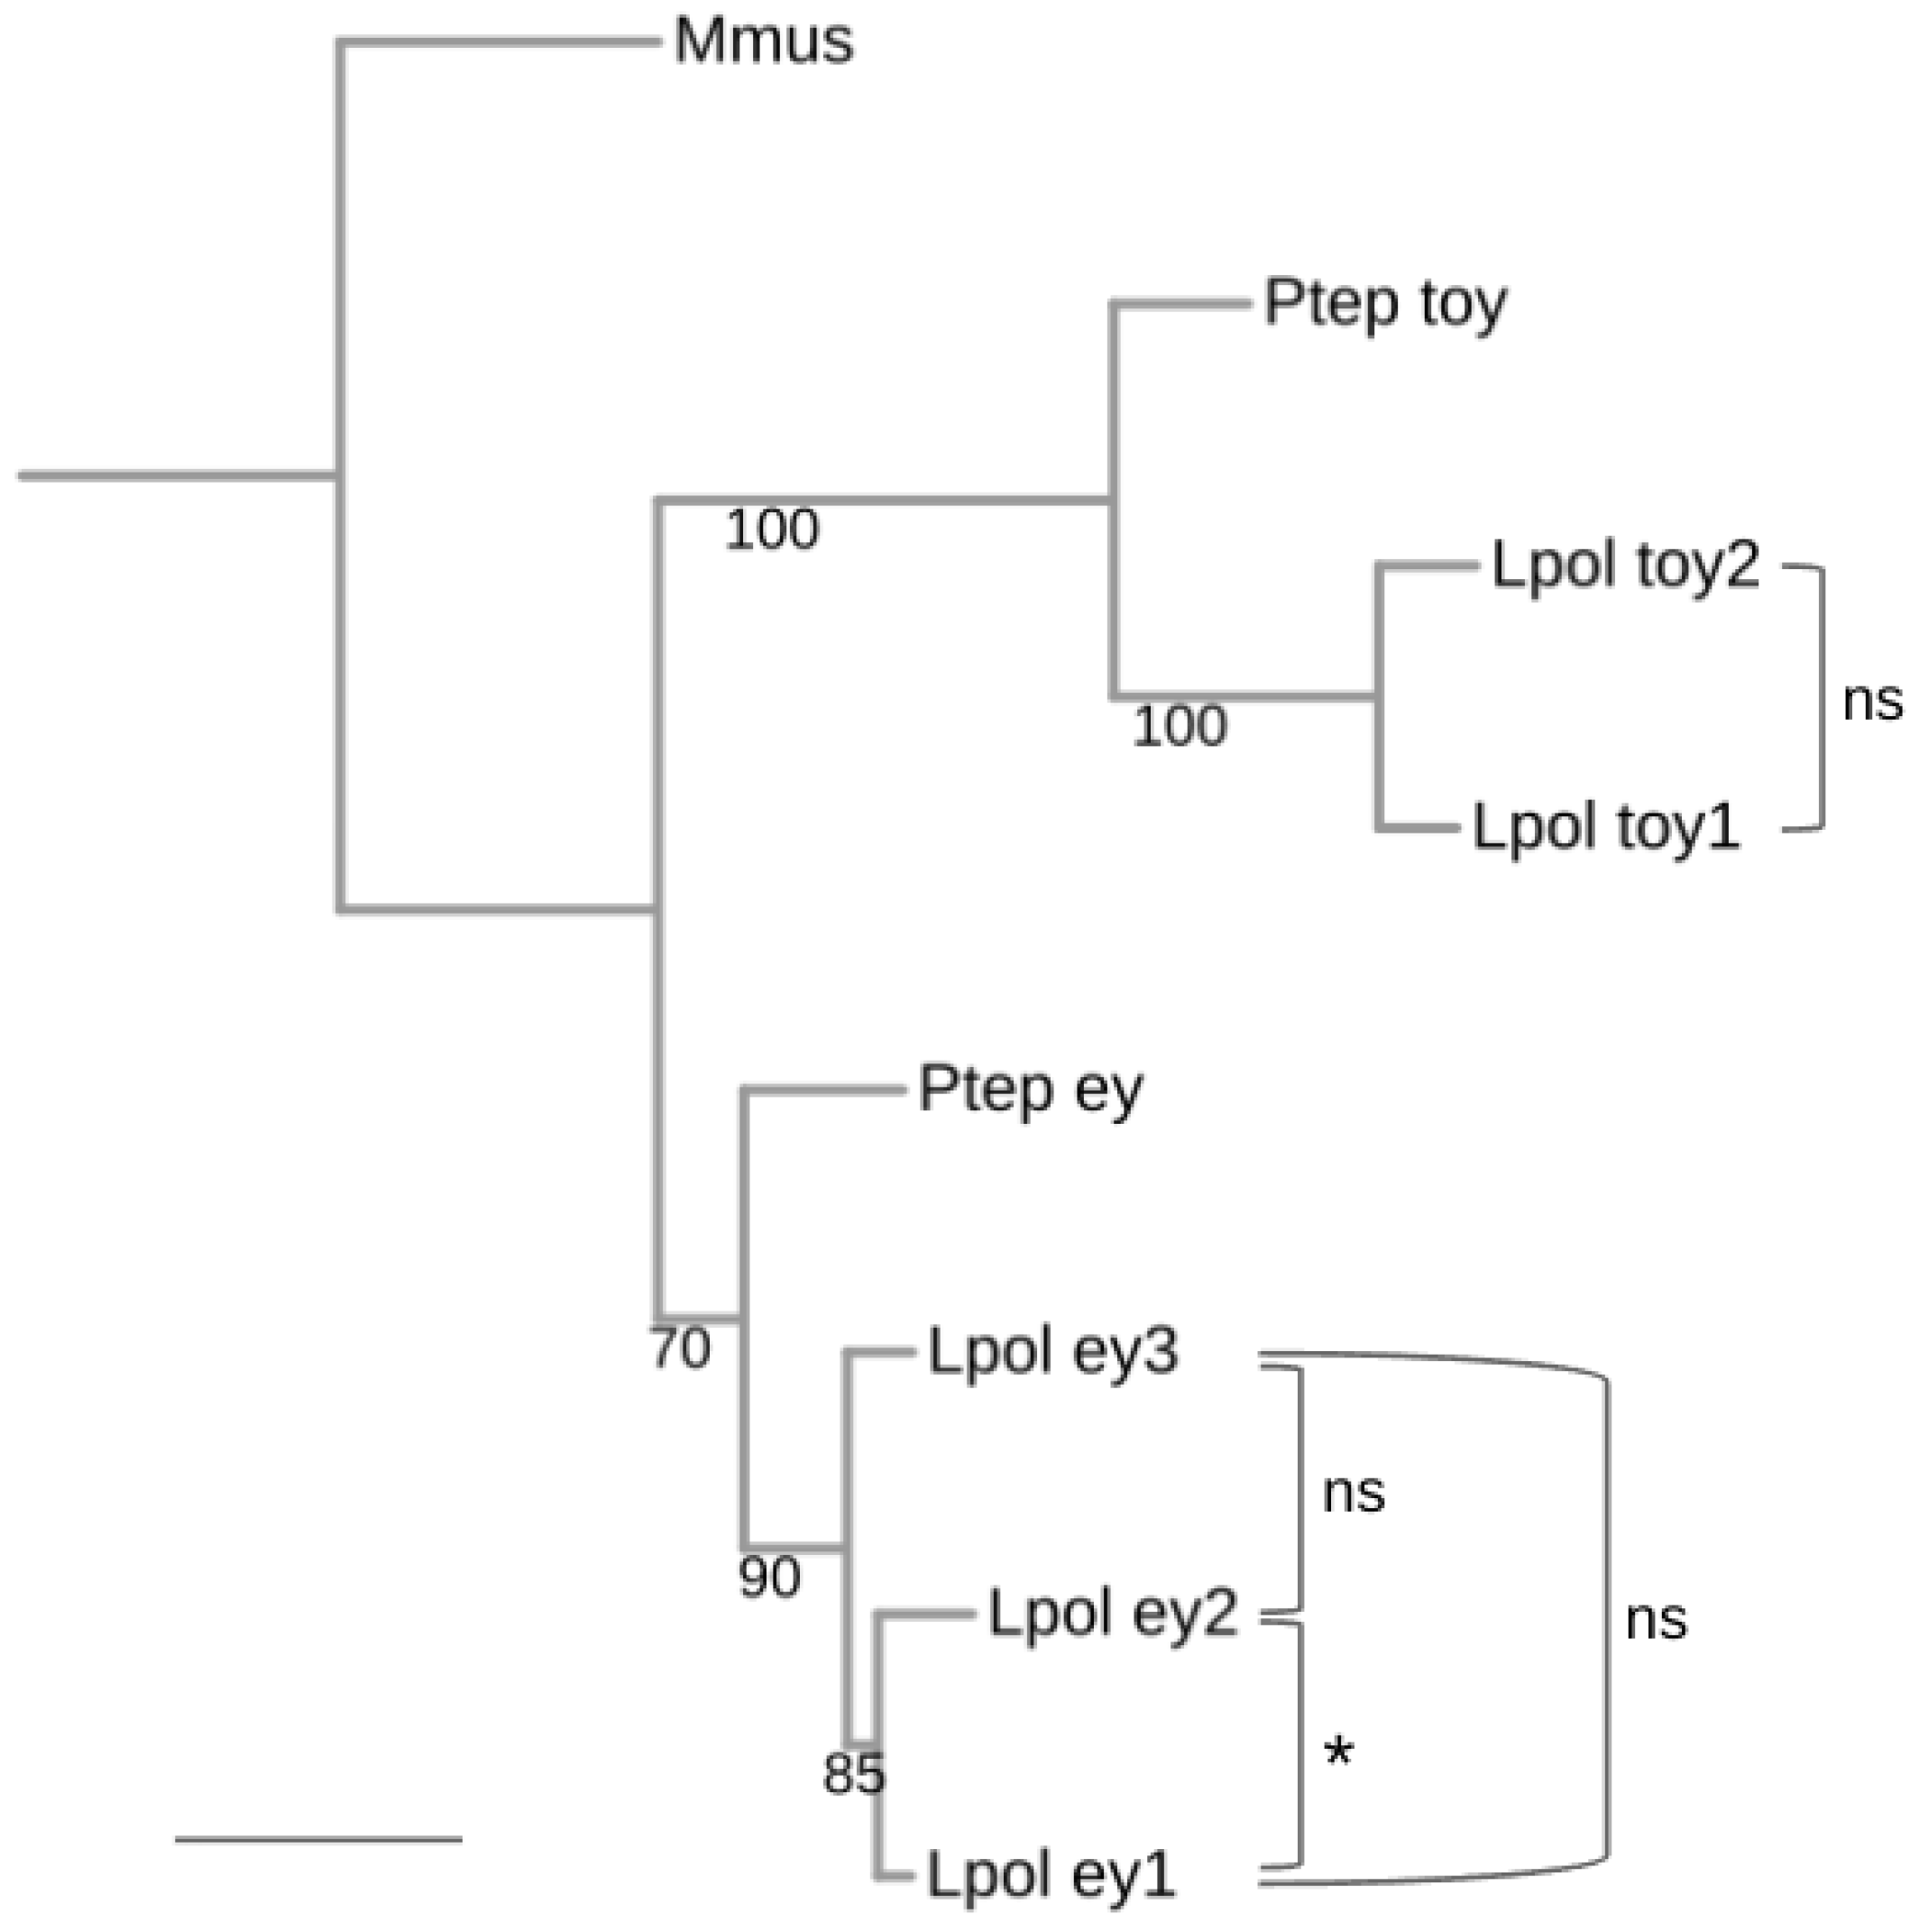
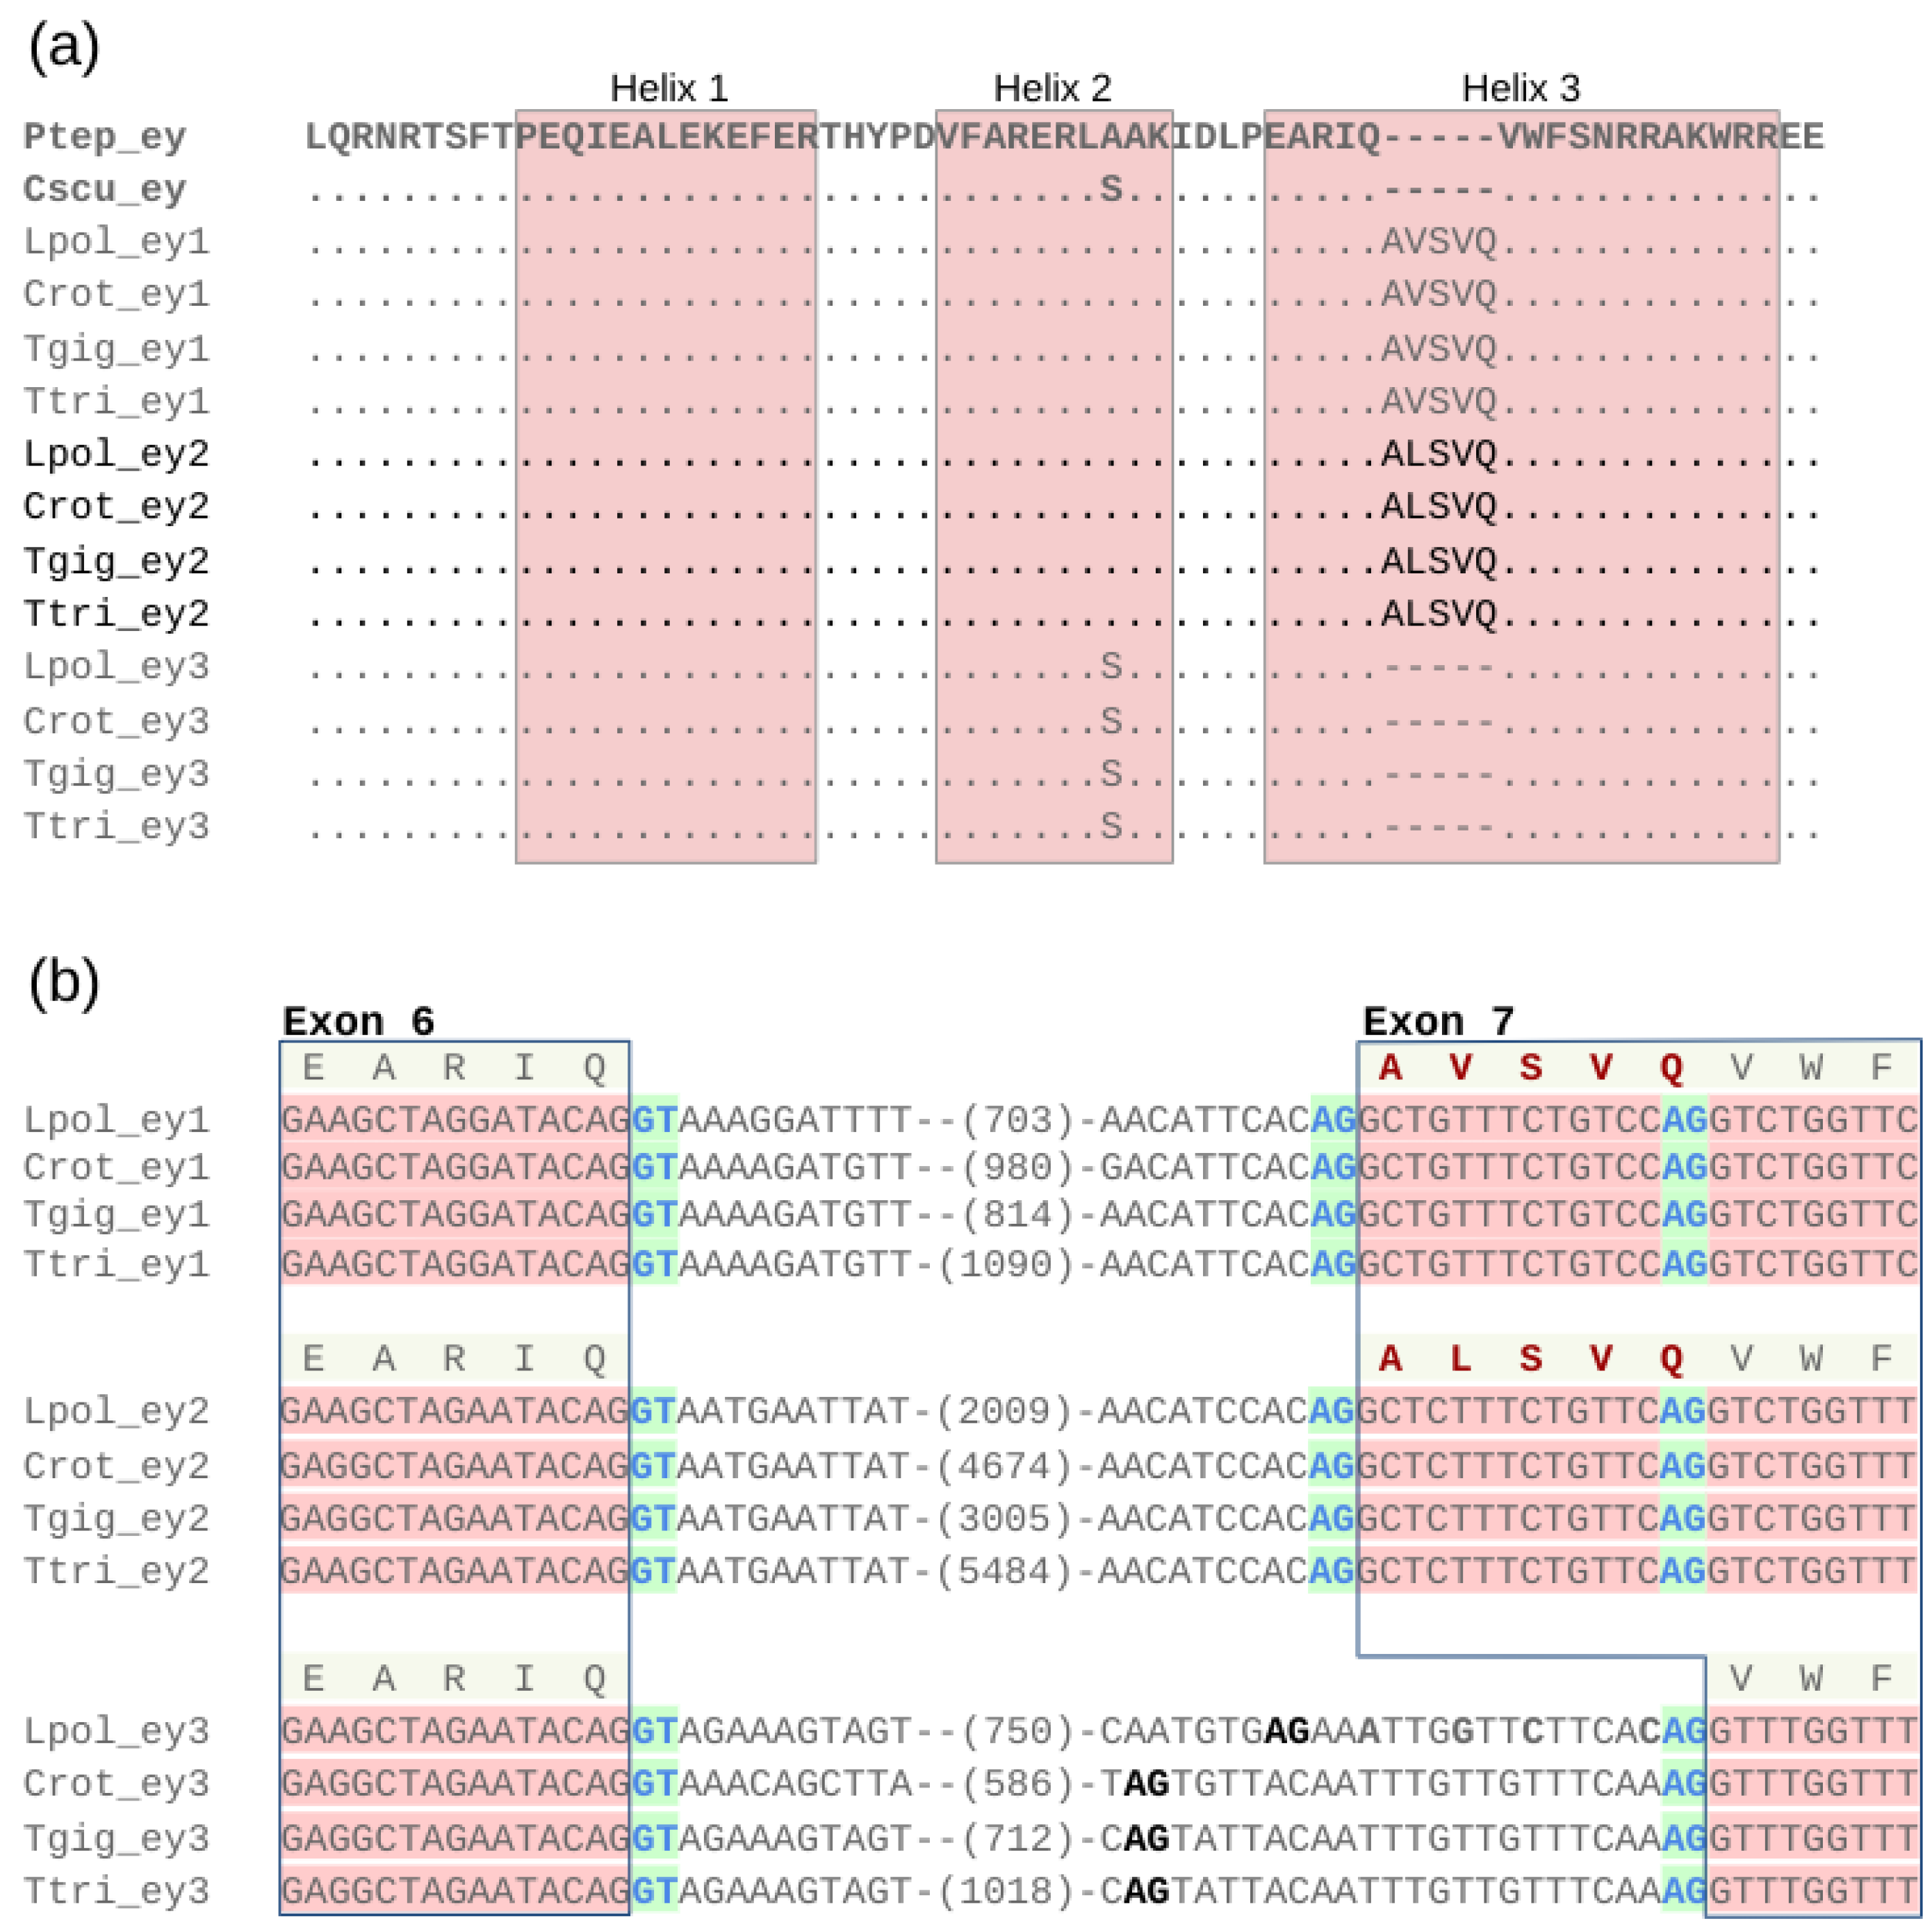
3.6. Conservation of a Homeodomain Expanding Splice Isoform in ey1 and ey2

Examining protein sequence changes in the Pax- and HD regions of the xiphosuran ey and toy paralogs, we noticed that the gene models of ey1 and ey2 were characterized by an unusual five amino acid-long insertion in the third helix of the HD (Figure 5a and Figure S1). A detailed examination of the related L. polyphemus gene models in the NCBI genome browser revealed that these insertions represented RNAseq expression evidence-supported alternative splice isoforms. Based on comparison with ey3, we found that ey1 and ey2 possess ancestral splice acceptor sites, which facilitate the expression of transcripts that encode the canonical HD consensus sequence of helix 3 (Figure 5b). In addition, however, the two paralogs also share an upstream splice acceptor site, the use of which leads to the production of transcripts coding for the expanded HD helix 3 (Figure 5b). In the case of the ey1 locus of L. polyphemus (LOC106463340), six predicted NCBI transcript models (XM_022391191, XM_022391186, XM_022391210, XM_022391182, XM_022391203, XM_022391176) represented splice isoforms with the expanded HD vs. one (XM_0223912001) that was predicted to code for an isoform with the ancestral HD. In the case of L. polyphemus ey2 (LOC106457408), three predicted transcript models (XM_022383323, XM_022383325, XM_022383322) represented splice isoforms with the expanded HD, while one (XM_022383324) was predicted to code for the ancestral HD.
The derived alternative exon 7 splice acceptor sites were conserved among all ey1 and ey2 paralogs across the horseshoe crab species phylogeny (Figure 5b). Moreover, all four horseshoe crab species orthologs of ey1 and ey2 were sequence identical in the derived exon 7 add-on sequence region. Also, the immediately adjacent intron sequences exhibited little sequence differences, while overall intron lengths varied consistently (Figure 5b). The xiphosuran ey3 paralogs, in contrast, lacked open reading frame-compatible alternative splice acceptor sites upstream of the ancestral exon 7 splice acceptor site (Figure 5b). Moreover, the ey3 homolog of L. polyphemus differed by four nucleotide substitutions from ey3 of C. rotundicauda, T. tridentatus, and T. gigas in the region corresponding to the derived exon 7 add-on sequence of ey1 and ey2 (Figure 5b), representing tentative evidence that purifying selection preserved the HD-extending alternative splice acceptor sites of ey1 and ey2. Further consistent with this inference, the shared HD helix 3 insertions of ey1 and ey2 differed by only a single conservative amino acid substitution, with valine occupying the second site of the insertion in ey1 vs. alanine in ey2 (Figure 5a).

4. Discussion

As part of the bilaterian gene toolkit [42], most members of the Pax transcription factor gene family perform essential regulatory gene network functions during embryonic and postembryonic tissue and cell specification processes [43]. Successful execution of these pivotal functions depends on precisely regulated expression in time and tissue context. In the specific case of the arthropod Pax transcription factor paralogs ey and toy, these aspects are highlighted by the extreme nature of lack of function and gene misexpression consequences. Both ey and toy mutant Drosophila strains are characterized by depletion of prominent components of the peripheral visual system, i.e., the compound eyes and ocelli, respectively [44]. Opposite outcomes are observed as the consequence of misexpressing ey and toy, which famously causes the formation of extra-compound eye retinal tissues in antennae and leg appendages [8,45].
A third critical variable underlying proper Pax transcription factor function is defined by the level of gene expression, i.e., dosage. This variable is particularly relevant in the context of gene duplication. This is because the complete duplication of the cis-regulatory content of a gene locus is predicted to result in the duplication of overall expression levels in the absence of dosage-compensating mechanisms or preceding allelic differentiation. Considering these implications, it is of little surprise that Arachnopulmonata possess only a single homolog of each ey and toy despite the duplication of gene content through one round of WGD in this lineage (Figure 1) [10,46,47,48]. Indeed, even the relatively high number of five Pax6 genes in the horseshoe crab lineage represents indirect evidence of the assumed fitness-reducing effects resulting from Pax homolog number increases. Three WGD events in the early xiphosuran lineage must have spawned an initial total of eight paralogs for each ey and toy, the majority of which must have been subsequently selected against toward extinction (Figure 1) [18].
The fact that none of the ey and toy paralogs are tandem linked but spread out over different chromosomes or scaffolds in all four horseshoe crab species cluster genomes is consistent with their origins in the wake of WGDs. Applying the terminology of ohnologs for paralogous genes that originated via WGD [49], it is safe to conclude that toy1 and toy2 represent ohnologs with respect to each other and that the same is the case for ey1, ey2, and ey3. In the latter case, however, the unique splice variant of exon 7 shared by ey1 and ey2 further implies that these paralogs descended from a similarly organized ancestral precursor paralog during the second or third round of WGD. Of note, the closer relationship of ey1 and ey2 with respect to ey3 is also supported in our gene tree estimation results (Figure 2 and Figure 4).
The existence of three ohnologs of ey and two ohnologs of toy in the Xiphosura raises two interrelated questions. How were the likely fitness-reducing effects of gene duplication on expression levels resolved, and which mechanisms explain the subsequent long-term conservation of the persisting ohnologs?
Both ey and toy are highly pleiotropic factors with critical roles in a large number of cell- and tissue-specification processes [8,46,47,48,50,51,52,53]. This background leads to the prediction that the xiphosuran ey and toy ohnologs underwent subfunctionalization. Indeed, this scenario is supported by the early puzzling finding of the presumed lack of Pax6 homolog expression in the developing visual organs of L. polyphemus, which led to the speculation that additional paralogs may exist [7]. Subsequent efforts revealed that the Pax6 homolog that was initially cloned by Blackburn et al. (2008) represented L. polyphemus toy1 [10]. At this point, it is reasonable to hypothesize that other xiphosuran Pax6 homologs are expressed in the developing visual system [54]. It is further tempting to speculate that this is most likely the case for ey1 or ey3, given the lower strength of purifying selection on ey2. Tissue expression studies, ideally conducted by embryonic whole-mount hybridization, will be required to probe these predictions.
The second possibility that awaits testing by expression studies and, ultimately, functional analyses is that some of the five xiphosuran Pax6 transcription factors engage redundantly in specific gene regulatory networks. This scenario is predicted by the deeply conserved redundant roles of ey and toy in the specification of the ocular segment during arthropod embryonic development [9]. The third possibility of neofunctionalization is not strongly supported by our analysis of protein sequence diversification rates. At the same time, it is not possible to rule out neofunctionalization trajectories, for instance, through cis-regulatory evolution. While this possibility seems remote given the ancestral and deep time-conserved body plan organization of horseshoe crabs, the HD helix 3 expanding splice variants of ey1 and ey2 leave room to speculate about a correlated emergence of novel regulatory mechanisms. Further experimental studies will be required to conclusively verify the alternative splicing of exon 7 in ey1 and ey2 and to explore whether the extended HD is associated with modified DNA-binding specificities or protein–protein interactions. Whatever the mechanistic nature of HD-modifying alternative splicing in ey1 and ey2, its functional significance is documented by over 100 million years of evolutionary conservation in the two ohnologs. Of note, the singleton ey locus of the common house spider P. tepidariorum (LOC107436595) also contains an open reading frame-compatible splice acceptor site upstream of the ancestral exon 7 splice acceptor site (not shown). However, expression of this potential 10 amino acid sites extending region is not supported by RNAseq data (LOC107436595). While more outgroup reference points will be desirable, it is most reasonable to assume that the shared HD helix 3 expanding isoform of ey1 and ey2 is evolutionarily derived and originated in the aftermath of the first WGD in the xiphosuran lineage. Of note, to the best of our knowledge, the horseshoe crab HD helix 3 expanded splice variant of ey1 and ey2 represents the first example of an “atypical” HD with extra sites within a helix region as opposed to a loop region [55].
Our study complements previous analyses of the effects of the xiphosuran WGDs on other gene families, i.e., opsins [6], the Hox gene complex members [11,16,17], the components of the JAK-STAT signaling pathway [14], and micro RNAs [18,56]. Combined, these efforts produced ample testimony of the unexpectedly eventful genomic history of horseshoe crabs, which will continue to serve as an important paradigm for genome evolution studies.
Looking ahead, the next obvious question is how the duplication and conservation histories of other Pax transcription factor subfamilies compare to the Pax6 subgroup in the horseshoe crabs. Our ongoing analyses indicate a wide range of preservation outcomes. Therefore, we predict that the horseshoe crab lineage will emerge as particularly useful for studying constraints and innovative opportunities in the evolutionary diversification of Pax transcription factors.

Supplementary Materials

The following supporting information can be downloaded at: https://www.mdpi.com/article/10.3390/arthropoda2010007/s1, Figure S1: Multiple protein sequence alignment of ey homologs; Figure S2: Multiple protein sequence alignment of toy homologs; Table S1: Genomic locations of xiphosuran Pax6 homologs; Table S2: dN/dS values; Table S3: Tajima’s relative rate test values; Text Document S1: Annotated xiphosuran Pax6 loci; Text Document S2: Protein sequences.

Author Contributions

Conceptualization, supervision, writing—review and editing, M.F.; Investigation, data curation, and analysis, T.D. All authors have read and agreed to the published version of the manuscript.

Funding

This research received no external funding.

Data Availability Statement

All data are provided in the Supplementary Materials.

Acknowledgments

We thank the members of the Friedrich lab horseshoe crab genomics group for comments and encouragement, Chuanzhu Fan and Weilong Hao for discussion of the alternative splicing evidence, Zbynek Kozmik and Ales Zveckl for comments on the extension of helix 3 in the homeodomains of ey1 and ey2, and the four anonymous reviewers for their diligent comments.

Conflicts of Interest

The authors declare no conflicts of interest.

References

  1. Sharma, P.P. Chelicerates. Curr. Biol. 2018, 28, R774–R778. [Google Scholar] [CrossRef]
  2. Battelle, B.-A. The Eyes of Limulus polyphemus (Xiphosura, Chelicerata) and Their Afferent and Efferent Projections. Arthropod Struct. Dev. 2006, 35, 261–274. [Google Scholar] [CrossRef]
  3. Harzsch, S.; Hafner, G. Evolution of Eye Development in Arthropods: Phylogenetic Aspects. Arthropod Struct. Dev. 2006, 35, 319–340. [Google Scholar] [CrossRef]
  4. Strausfeld, N.J.; Ma, X.; Edgecombe, G.D.; Fortey, R.A.; Land, M.F.; Liu, Y.; Cong, P.; Hou, X. Arthropod Eyes: The Early Cambrian Fossil Record and Divergent Evolution of Visual Systems. Arthropod Struct. Dev. 2016, 45, 152–172. [Google Scholar] [CrossRef]
  5. Kin, A.; Błażejowski, B. The Horseshoe Crab of the Genus Limulus: Living Fossil or Stabilomorph? PLoS ONE 2014, 9, e108036. [Google Scholar] [CrossRef]
  6. Battelle, B.-A.; Ryan, J.F.; Kempler, K.E.; Saraf, S.R.; Marten, C.E.; Warren, W.C.; Minx, P.J.; Montague, M.J.; Green, P.J.; Schmidt, S.A.; et al. Opsin Repertoire and Expression Patterns in Horseshoe Crabs: Evidence from the Genome of Limulus polyphemus (Arthropoda: Chelicerata). Genome Biol. Evol. 2016, 8, 1571–1589. [Google Scholar] [CrossRef]
  7. Blackburn, D.C.; Conley, K.W.; Plachetzki, D.C.; Kempler, K.; Battelle, B.-A.; Brown, N.L. Isolation and Expression of Pax6 and Atonal Homologues in the American Horseshoe Crab, Limulus polyphemus. Dev. Dyn. 2008, 237, 2209–2219. [Google Scholar] [CrossRef]
  8. Czerny, T.; Halder, G.; Kloter, U.; Souabni, A.; Gehring, W.J.; Busslinger, M. Twin of Eyeless, a Second Pax-6 Gene of Drosophila, Acts Upstream of Eyeless in the Control of Eye Development. Mol. Cell 1999, 3, 297–307. [Google Scholar] [CrossRef]
  9. Friedrich, M. Ancient Genetic Redundancy of Eyeless and Twin of Eyeless in the Arthropod Ocular Segment. Dev. Biol. 2017, 432, 192–200. [Google Scholar] [CrossRef]
  10. Friedrich, M. Coming into Clear Sight at Last: Ancestral and Derived Events during Chelicerate Visual System Development. Bioessays 2022, 44, e2200163. [Google Scholar] [CrossRef]
  11. Kenny, N.J.; Chan, K.W.; Nong, W.; Qu, Z.; Maeso, I.; Yip, H.Y.; Chan, T.F.; Kwan, H.S.; Holland, P.W.H.; Chu, K.H.; et al. Ancestral Whole-Genome Duplication in the Marine Chelicerate Horseshoe Crabs. Heredity 2016, 116, 190–199. [Google Scholar] [CrossRef]
  12. Tanacredi, J.T.; Botton, M.L.; Smith, D. Biology and Conservation of Horseshoe Crabs; Springer Science & Business Media: New York, NY, USA, 2009; ISBN 9780387899596. [Google Scholar]
  13. Lamsdell, J.C. The Phylogeny and Systematics of Xiphosura. PeerJ 2020, 8, e10431. [Google Scholar] [CrossRef]
  14. Zhou, Y.; Liang, Y.; Yan, Q.; Zhang, L.; Chen, D.; Ruan, L.; Kong, Y.; Shi, H.; Chen, M.; Chen, J. The Draft Genome of Horseshoe Crab Tachypleus Tridentatus Reveals Its Evolutionary Scenario and Well-Developed Innate Immunity. BMC Genom. 2020, 21, 137. [Google Scholar] [CrossRef]
  15. Obst, M.; Faurby, S.; Bussarawit, S.; Funch, P. Molecular Phylogeny of Extant Horseshoe Crabs (Xiphosura, Limulidae) Indicates Paleogene Diversification of Asian Species. Mol. Phylogenet. Evol. 2012, 62, 21–26. [Google Scholar] [CrossRef]
  16. Shingate, P.; Ravi, V.; Prasad, A.; Tay, B.-H.; Garg, K.M.; Chattopadhyay, B.; Yap, L.-M.; Rheindt, F.E.; Venkatesh, B. Chromosome-Level Assembly of the Horseshoe Crab Genome Provides Insights into Its Genome Evolution. Nat. Commun. 2020, 11, 2322. [Google Scholar] [CrossRef]
  17. Shingate, P.; Ravi, V.; Prasad, A.; Tay, B.-H.; Venkatesh, B. Chromosome-Level Genome Assembly of the Coastal Horseshoe Crab (Tachypleus gigas). Mol. Ecol. Resour. 2020, 20, 1748–1760. [Google Scholar] [CrossRef]
  18. Nong, W.; Qu, Z.; Li, Y.; Barton-Owen, T.; Wong, A.Y.P.; Yip, H.Y.; Lee, H.T.; Narayana, S.; Baril, T.; Swale, T.; et al. Horseshoe Crab Genomes Reveal the Evolution of Genes and microRNAs after Three Rounds of Whole Genome Duplication. Commun. Biol. 2021, 4, 83. [Google Scholar] [CrossRef]
  19. Simakov, O.; Marlétaz, F.; Yue, J.-X.; O’Connell, B.; Jenkins, J.; Brandt, A.; Calef, R.; Tung, C.-H.; Huang, T.-K.; Schmutz, J.; et al. Deeply Conserved Synteny Resolves Early Events in Vertebrate Evolution. Nat. Ecol. Evol. 2020, 4, 820–830. [Google Scholar] [CrossRef]
  20. Ohno, S. Evolution by Gene Duplication; Springer Science & Business Media: New York, NY, USA, 1970. [Google Scholar]
  21. Sacerdot, C.; Louis, A.; Bon, C.; Berthelot, C.; Roest Crollius, H. Chromosome Evolution at the Origin of the Ancestral Vertebrate Genome. Genome Biol. 2018, 19, 166. [Google Scholar] [CrossRef]
  22. Nakatani, Y.; Shingate, P.; Ravi, V.; Pillai, N.E.; Prasad, A.; McLysaght, A.; Venkatesh, B. Reconstruction of Proto-Vertebrate, Proto-Cyclostome and Proto-Gnathostome Genomes Provides New Insights into Early Vertebrate Evolution. Nat. Commun. 2021, 12, 4489. [Google Scholar] [CrossRef]
  23. Schwager, E.E.; Sharma, P.P.; Clarke, T.; Leite, D.J.; Wierschin, T.; Pechmann, M.; Akiyama-Oda, Y.; Esposito, L.; Bechsgaard, J.; Bilde, T.; et al. The House Spider Genome Reveals an Ancient Whole-Genome Duplication during Arachnid Evolution. BMC Biol. 2017, 15, 62. [Google Scholar] [CrossRef]
  24. Birchler, J.A.; Yang, H. The Multiple Fates of Gene Duplications: Deletion, Hypofunctionalization, Subfunctionalization, Neofunctionalization, Dosage Balance Constraints, and Neutral Variation. Plant Cell 2022, 34, 2466–2474. [Google Scholar] [CrossRef]
  25. Kuzmin, E.; Taylor, J.S.; Boone, C. Retention of Duplicated Genes in Evolution. Trends Genet. 2022, 38, 59–72. [Google Scholar] [CrossRef]
  26. Weadick, C.J.; Chang, B.S.W. Complex Patterns of Divergence among Green-Sensitive (RH2a) African Cichlid Opsins Revealed by Clade Model Analyses. BMC Evol. Biol. 2012, 12, 206. [Google Scholar] [CrossRef]
  27. Des Marais, D.L.; Rausher, M.D. Escape from Adaptive Conflict after Duplication in an Anthocyanin Pathway Gene. Nature 2008, 454, 762–765. [Google Scholar] [CrossRef]
  28. Vavouri, T.; Semple, J.I.; Lehner, B. Widespread Conservation of Genetic Redundancy during a Billion Years of Eukaryotic Evolution. Trends Genet. 2008, 24, 485–488. [Google Scholar] [CrossRef]
  29. Nowak, M.A.; Boerlijst, M.C.; Cooke, J.; Smith, J.M. Evolution of Genetic Redundancy. Nature 1997, 388, 167–171. [Google Scholar] [CrossRef]
  30. Liberles, D.A.; Kolesov, G.; Dittmar, K. Understanding Gene Duplication through Biochemistry and Population Genetics. In Evolution after Gene Duplication; Dittmar, K., Liberles, D.A., Eds.; John Wiley & Sons, Inc.: Hoboken, NJ, USA, 2010; pp. 1–21. [Google Scholar]
  31. Kimura, M. The Neutral Theory of Molecular Evolution. Sci. Am. 1979, 241, 98–129. [Google Scholar] [CrossRef]
  32. Liao, Y.Y.; Xu, P.W.; Kwan, K.Y.; Ma, Z.Y.; Fang, H.Y.; Xu, J.Y.; Wang, P.L.; Yang, S.Y.; Xie, S.B.; Xu, S.Q.; et al. Draft Genomic and Transcriptome Resources for Marine Chelicerate Tachypleus Tridentatus. Sci. Data 2019, 6, 190029. [Google Scholar] [CrossRef]
  33. Notredame, C.; Higgins, D.G.; Heringa, J. T-Coffee: A Novel Method for Fast and Accurate Multiple Sequence Alignment. J. Mol. Biol. 2000, 302, 205–217. [Google Scholar] [CrossRef]
  34. Stamatakis, A. RAxML Version 8: A Tool for Phylogenetic Analysis and Post-Analysis of Large Phylogenies. Bioinformatics 2014, 30, 1312–1313. [Google Scholar] [CrossRef]
  35. Miller, M.A.; Pfeiffer, W.; Schwartz, T. Creating the CIPRES Science Gateway for Inference of Large Phylogenetic Trees. In Proceedings of the 2010 Gateway Computing Environments Workshop (GCE), New Orleans, LA, USA, 14 November 2010; IEEE: Piscataway, NJ, USA, 2010; pp. 1–8. [Google Scholar]
  36. Roth, C.; Liberles, D.A. A Systematic Search for Positive Selection in Higher Plants (Embryophytes). BMC Plant Biol. 2006, 6, 12. [Google Scholar] [CrossRef]
  37. Liberles, D.A. Evaluation of Methods for Determination of a Reconstructed History of Gene Sequence Evolution. Mol. Biol. Evol. 2001, 18, 2040–2047. [Google Scholar] [CrossRef]
  38. Kumar, S.; Nei, M.; Dudley, J.; Tamura, K. MEGA: A Biologist-Centric Software for Evolutionary Analysis of DNA and Protein Sequences. Brief. Bioinform. 2008, 9, 299–306. [Google Scholar] [CrossRef]
  39. Tajima, F. Simple Methods for Testing the Molecular Evolutionary Clock Hypothesis. Genetics 1993, 135, 599–607. [Google Scholar] [CrossRef]
  40. Madeira, F.; Park, Y.M.; Lee, J.; Buso, N.; Gur, T.; Madhusoodanan, N.; Basutkar, P.; Tivey, A.R.N.; Potter, S.C.; Finn, R.D.; et al. The EMBL-EBI Search and Sequence Analysis Tools APIs in 2019. Nucleic Acids Res. 2019, 47, W636–W641. [Google Scholar] [CrossRef]
  41. Sievers, F.; Wilm, A.; Dineen, D.; Gibson, T.J.; Karplus, K.; Li, W.; Lopez, R.; McWilliam, H.; Remmert, M.; Söding, J.; et al. Fast, Scalable Generation of High-quality Protein Multiple Sequence Alignments Using Clustal Omega. Mol. Syst. Biol. 2011, 7, 539. [Google Scholar] [CrossRef]
  42. Carroll, S.B.; Grenier, J.K.; Weatherbee, S.D. From DNA to Diversity: Molecular Genetics and the Evolution of Animal Design; John Wiley & Sons: Oxford, UK, 2013. [Google Scholar]
  43. Chi, N.; Epstein, J.A. Getting Your Pax Straight: Pax Proteins in Development and Disease. Trends Genet. 2002, 18, 41–47. [Google Scholar] [CrossRef]
  44. Blanco, J.; Pauli, T.; Seimiya, M.; Udolph, G.; Gehring, W.J. Genetic Interactions of Eyes Absent, Twin of Eyeless and Orthodenticle Regulate Sine Oculis Expression during Ocellar Development in Drosophila. Dev. Biol. 2010, 344, 1088–1099. [Google Scholar] [CrossRef]
  45. Halder, G.; Callaerts, P.; Gehring, W.J. Induction of Ectopic Eyes by Targeting Expression of the Eyeless Gene in Drosophila. Science 1995, 267, 1788. [Google Scholar] [CrossRef]
  46. Baudouin-Gonzalez, L.; Harper, A.; McGregor, A.P.; Sumner-Rooney, L. Regulation of Eye Determination and Regionalization in the Spider Parasteatoda Tepidariorum. Cells 2022, 11, 631. [Google Scholar] [CrossRef]
  47. Schomburg, C.; Turetzek, N.; Schacht, M.I.; Schneider, J.; Kirfel, P.; Prpic, N.-M.; Posnien, N. Molecular Characterization and Embryonic Origin of the Eyes in the Common House Spider Parasteatoda Tepidariorum. Evodevo 2015, 6, 15. [Google Scholar] [CrossRef]
  48. Samadi, L.; Schmid, A.; Eriksson, B.J. Differential Expression of Retinal Determination Genes in the Principal and Secondary Eyes of Cupiennius Salei Keyserling (1877). Evodevo 2015, 6, 16. [Google Scholar] [CrossRef]
  49. Singh, P.P.; Isambert, H. OHNOLOGS v2: A Comprehensive Resource for the Genes Retained from Whole Genome Duplication in Vertebrates. Nucleic Acids Res. 2020, 48, D724–D730. [Google Scholar] [CrossRef]
  50. Yang, X.; Weber, M.; Zarinkamar, N.; Posnien, N.; Friedrich, F.; Wigand, B.; Beutel, R.; Damen, W.G.M.; Bucher, G.; Klingler, M.; et al. Probing the Drosophila Retinal Determination Gene Network in Tribolium (II): The Pax6 Genes Eyeless and Twin of Eyeless. Dev. Biol. 2009, 333, 215–227. [Google Scholar] [CrossRef]
  51. Luan, Q.; Chen, Q.; Friedrich, M. The Pax6 Genes Eyeless and Twin of Eyeless Are Required for Global Patterning of the Ocular Segment in the Tribolium Embryo. Dev. Biol. 2014, 394, 367–381. [Google Scholar] [CrossRef]
  52. Halder, G.; Callaerts, P.; Flister, S.; Walldorf, U.; Kloter, U.; Gehring, W.J. Eyeless Initiates the Expression of Both Sine Oculis and Eyes Absent during Drosophila Compound Eye Development. Development 1998, 125, 2181–2191. [Google Scholar] [CrossRef]
  53. Cvekl, A.; Callaerts, P. PAX6: 25th Anniversary and More to Learn. Exp. Eye Res. 2017, 156, 10–21. [Google Scholar] [CrossRef]
  54. Clements, J.; Hens, K.; Francis, C.; Schellens, A.; Callaerts, P. Conserved Role for the Drosophila Pax6 Homolog Eyeless in Differentiation and Function of Insulin-Producing Neurons. Proc. Natl. Acad. Sci. USA 2008, 105, 16183–16188. [Google Scholar] [CrossRef]
  55. Bürglin, T.R.; Affolter, M. Homeodomain Proteins: An Update. Chromosoma 2016, 125, 497–521. [Google Scholar] [CrossRef]
  56. Peterson, K.J.; Beavan, A.; Chabot, P.J.; McPeek, M.A.; Pisani, D.; Fromm, B.; Simakov, O. MicroRNAs as Indicators into the Causes and Consequences of Whole-Genome Duplication Events. Mol. Biol. Evol. 2022, 39, msab344. [Google Scholar] [CrossRef]
Figure 1. Phylogenetic framework of whole genome duplication events in Arachnopulmonata, Xiphosura, and vertebrates. The fruit fly D. melanogaster represents the arthropod lineage to Tracheata, Pancrustacea, and insects. The vertebrate lineage is represented by the common house mouse M. musculus. The Arachnopulmonata lineage is represented by the common house spider P. tepidariorum. Horseshoe crab species relationships and divergence times based on [15]. Approximate timing of the WGD event in the Arachnopulmonata based on [23]. Approximate timing of the WDG events in the early vertebrate lineage based on [19]. R: round of WDG.
Arthropoda 02 00007 g001
Figure 2. Maximum likelihood protein sequence-based gene tree of xiphosuran Pax6 homologs. Numbers at branches represent nonparametric bootstrap support from 100 replications. Scale bar corresponds to 0.1 substitutions per amino acid site. Species name abbreviations: Crot = C. rotundicauda, Lpol = L. polyphemus, Mmus = Mus musculus (Vertebrata), Ptep = P. tepidariorum (Araneae), Tcas = T. castaneum (Coleoptera), Tgig = T. gigas, Ttri = T. tridentatus.
Arthropoda 02 00007 g002
Figure 3. Selection pressure on the five xiphosuran Pax6 homologs along the horseshoe crab cluster species tree quantified by dN/dS ratios. The tree visualizes the homolog-specific dN/dS values mapped along the horseshoe crab species diversification. The branch-specific dN and dS values are provided in Table S2. The ey paralogs are distinguished by light to dark green colors. The toy paralogs are highlighted by light and dark blue. Species tree and divergence times based on [14,15].
Arthropoda 02 00007 g003
Figure 4. Pairwise molecular clock test analysis of L. polyphemus Pax6 paralog diversification. Maximum likelihood protein sequence-based gene tree of the L. polyphemus Pax6 homologs. Numbers at branches represent nonparametric bootstrap support from 100 replications. Scale bar corresponds to 0.1 substitutions per amino acid site. Molecular clock-like evolution was tested by Tajima’s pairwise relative rate tests. ns = not significant, asterisk = significant at p < 0.05 level. See Table S3 for details. Species name abbreviations: Lpol = L. polyphemus, Mmus = Mus musculus (Vertebrata), Ptep = P. tepidariorum (Araneae).
Arthropoda 02 00007 g004
Figure 5. Shared alternative splice variants in the homeodomain regions of ey1 and ey2. (a) Multiple protein sequence alignment of the ey1, ey2, and ey2 homeodomain regions from all four horseshoe crab species. Dots represent amino acid identity compared to top sequence. Dashes represent sequence gaps. Bolted light grey highlights the sequences of the ey singleton genes from the outgroup species P. tepidariorum (Araneae) and C. sculpturatus (Scorpiones). The horseshoe crab ey2 paralog group sequences are visually separated by black font from the ey1 and ey3 paralog group sequences. The five amino acid-long insertions in the helix 3 regions of the ey1 and ey2 represent outcomes of alternative splicing. (b) Nucleotide sequence alignment of the exon 6 donor splice site and exon 7 acceptor splice site regions for ey1, ey2, and ey3 of all four horseshoe crab species. Red nucleotide sequence background indicates coding sequence. Clear nucleotide sequence backdrop indicates intronic sequence. Numbers in parentheses indicate length of additional intervening intron sequence. RNAseq-supported splice donor and acceptor sites are indicated by blue font against green background. Out-of-frame candidate splice acceptor sites are indicated by black bold font. Conceptual amino acid sequences are given on top of each paralog group alignment. The amino acid insertions created by the additional exon 7 splice acceptor sites in ey1 and ey2 are highlighted in bold font. Species name abbreviations: Cscu = C. sculpturatus, Crot = C. rotundicauda, Lpol = L. polyphemus, Ptep = P. tepidariorum, Tgig = T. gigas, Ttri = T. tridentatus.
Arthropoda 02 00007 g005
Table 1. Comparison of purifying selection pressure levels (dN/dS) with pre- and post-speciation amino acid residue replacement numbers among horseshoe crab Pax6 homologs. See Figures S1 and S2 and Table S3 for details.
HomologAverage dN/dSPre-Speciation Amino Acid ChangesPost-Speciation Amino Acid Changes
ey10.01692
ey20.219249
ey30.041125
toy10.0832412
toy20.1152716
Disclaimer/Publisher’s Note: The statements, opinions and data contained in all publications are solely those of the individual author(s) and contributor(s) and not of MDPI and/or the editor(s). MDPI and/or the editor(s) disclaim responsibility for any injury to people or property resulting from any ideas, methods, instructions or products referred to in the content.

