Abstract
Currently, there are no known human biomonitoring studies that concurrently examine biomarkers of dicamba and 2,4-D. We sought to compare biomarkers of exposure to herbicides in pregnant women residing in the US Midwest before and after the adoption of dicamba-tolerant soybean technology using urine specimens obtained in 2010–2012 from the Nulliparous Pregnancy Outcomes Study: Monitoring Mothers-to-be (N = 61) and in 2020–2022 from the Heartland Study (N = 91). Specific gravity-standardized concentration levels for each analyte were compared between the cohorts, assuming data are lognormal and specifying values below the LOD as left-censored. The proportion of pregnant individuals with dicamba detected above the LOD significantly increased from 28% (95% CI: 16%, 40%) in 2010–2012 to 70% (95% CI: 60%, 79%) in 2020–2022, and dicamba concentrations also significantly increased from 0.066 μg/L (95% CI: 0.042, 0.104) to 0.271 μg/L (95% CI: 0.205, 0.358). All pregnant individuals from both cohorts had 2,4-D detected. Though 2,4-D concentration levels increased, the difference was not significant (p-value = 0.226). Reliance on herbicides has drastically increased in the last ten years in the United States, and the results obtained in this study highlight the need to track exposure and impacts on adverse maternal and neonatal outcomes.
1. Introduction
The commercial launch of genetically engineered, glyphosate-tolerant soybean and cotton varieties in 1996 and corn in 1998 initiated a transformation in weed management systems in the US. The so-called “Roundup Ready” (RR) system simplified herbicide-based weed management systems and was highly effective [1]. From 1991 to 2010, the percentage of soybean and corn acres treated with glyphosate-based herbicides in the Midwest went up 30-fold and 20-fold, respectively [2]. Widespread and repeated applications of glyphosate-based herbicides over time triggered the emergence and spread of multiple glyphosate-resistant weeds [3,4]. As glyphosate efficacy waned, additional herbicides were needed to target glyphosate-resistant phenotypes. By 2010, multiple glyphosate-resistant weeds had become an economic problem on many farms. The pesticide –seed industry responded by engineering soybean and cotton cultivars to tolerate post-emergence, “over the top” applications of additional herbicides that could be used in conjunction with glyphosate-based herbicides within the RR seed system [5].
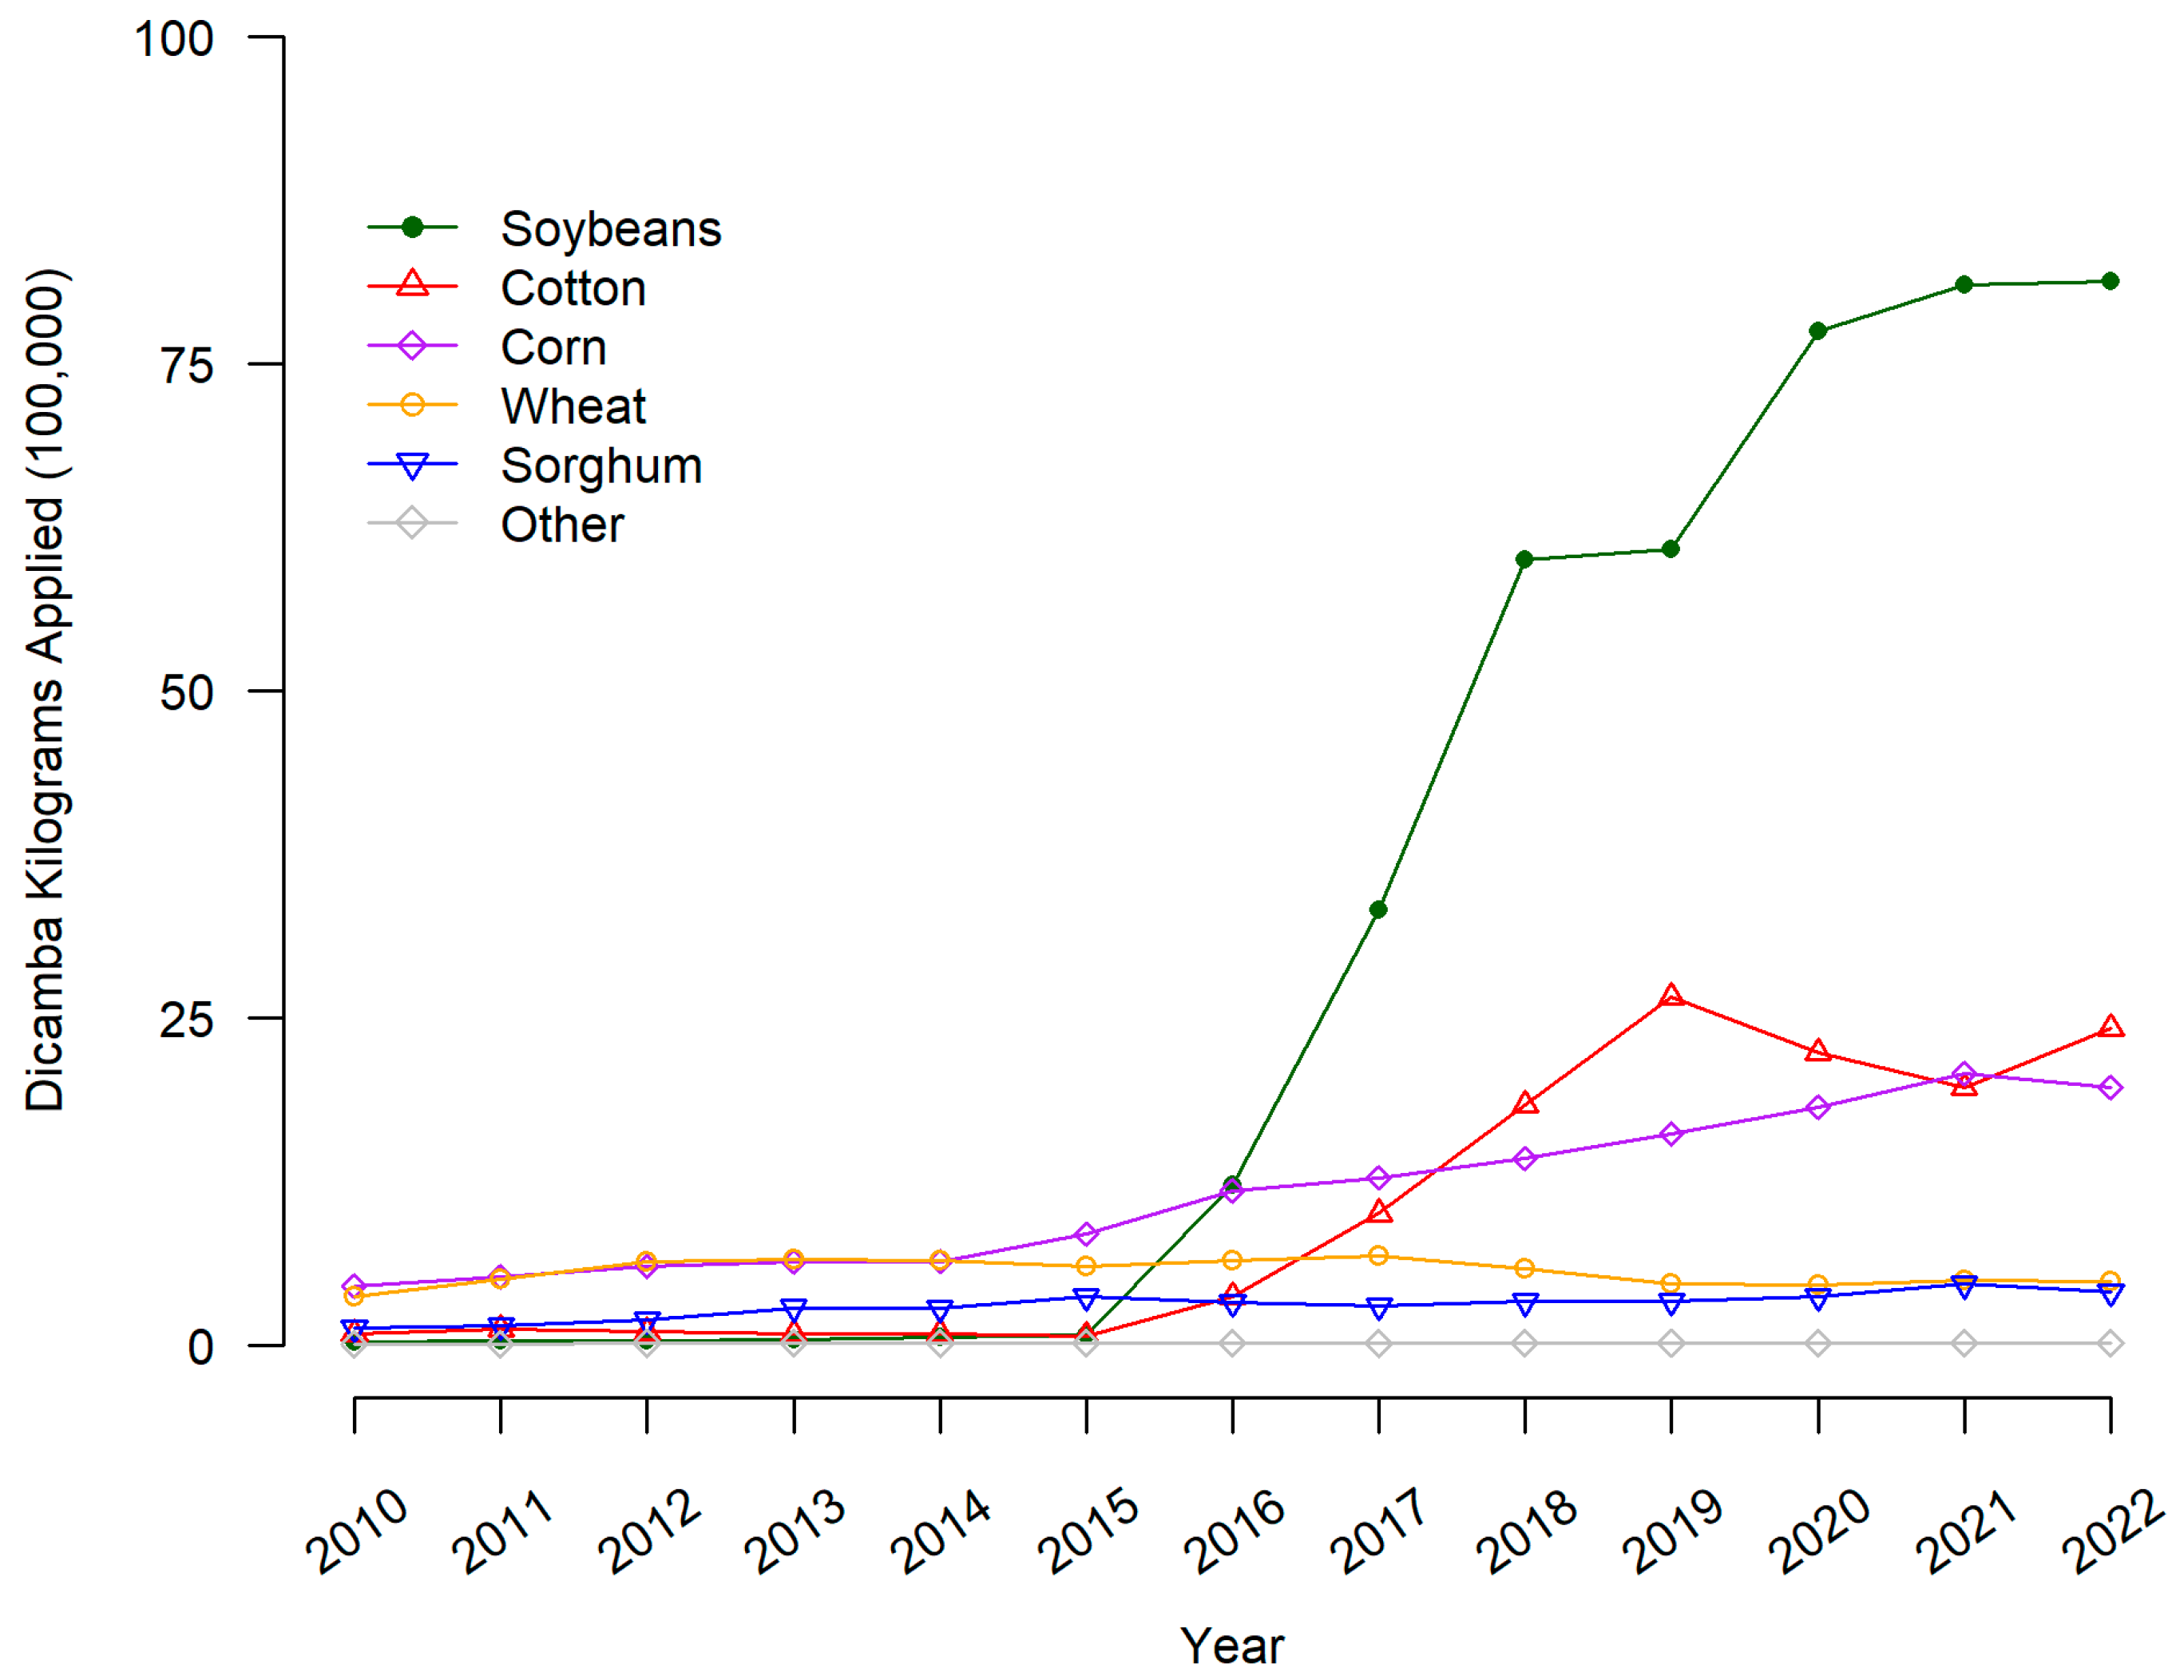
The majority of soybean and cotton seeds sold in the US are now genetically engineered to tolerate combinations of glyphosate, glufosinate, dicamba, 2,4-D (2,4-dichlorophenoxyacetic acid), and the “fop” chemical family of ACCase (acetyl-CoA carboxylase) inhibitor herbicides. As a result, reliance on dicamba and 2,4-D has risen 10-fold or more compared to 2010 [6]. To further demonstrate the increase in dicamba and 2,4-D, we present the estimated kilograms (in 100,000 s) of dicamba applied each year to surveyed US cropland for the years 2010 to 2022 obtained from the Pesticide Use Data System (PUDS) [7]. The system utilizes data issued by the USDA’s National Agricultural Statistics Service via QuickStats [8]. Values for years lacking NASS survey results are interpolated using the methodology developed by the Economic Research Service to produce a continuous temporal dataset from periodic survey results. Of note, the year 2022 is a forecasted level. From Figure 1, the overall level of dicamba use (kilograms applied in one hundred thousands) in the US has increased for soybeans since 2015 and slightly increased for cotton and corn. Levels do not indicate an increase in wheat, sorghum, or other crops.
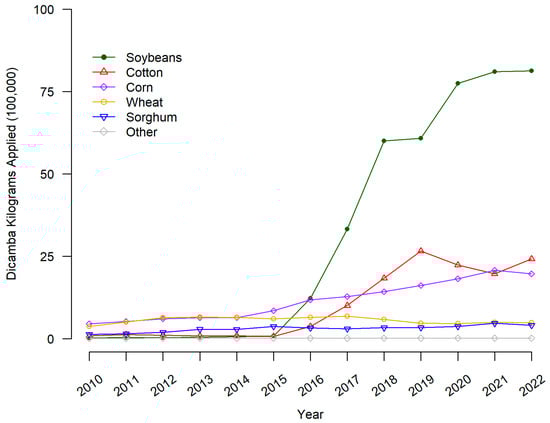
Figure 1.
Dicamba applied to major crops on US surveyed hectares. Dicamba pounds applied is the sum of all forms of the herbicide reported in USDA-NASS surveys. Pounds applied was converted to kilograms by multiplying by 0.453592.
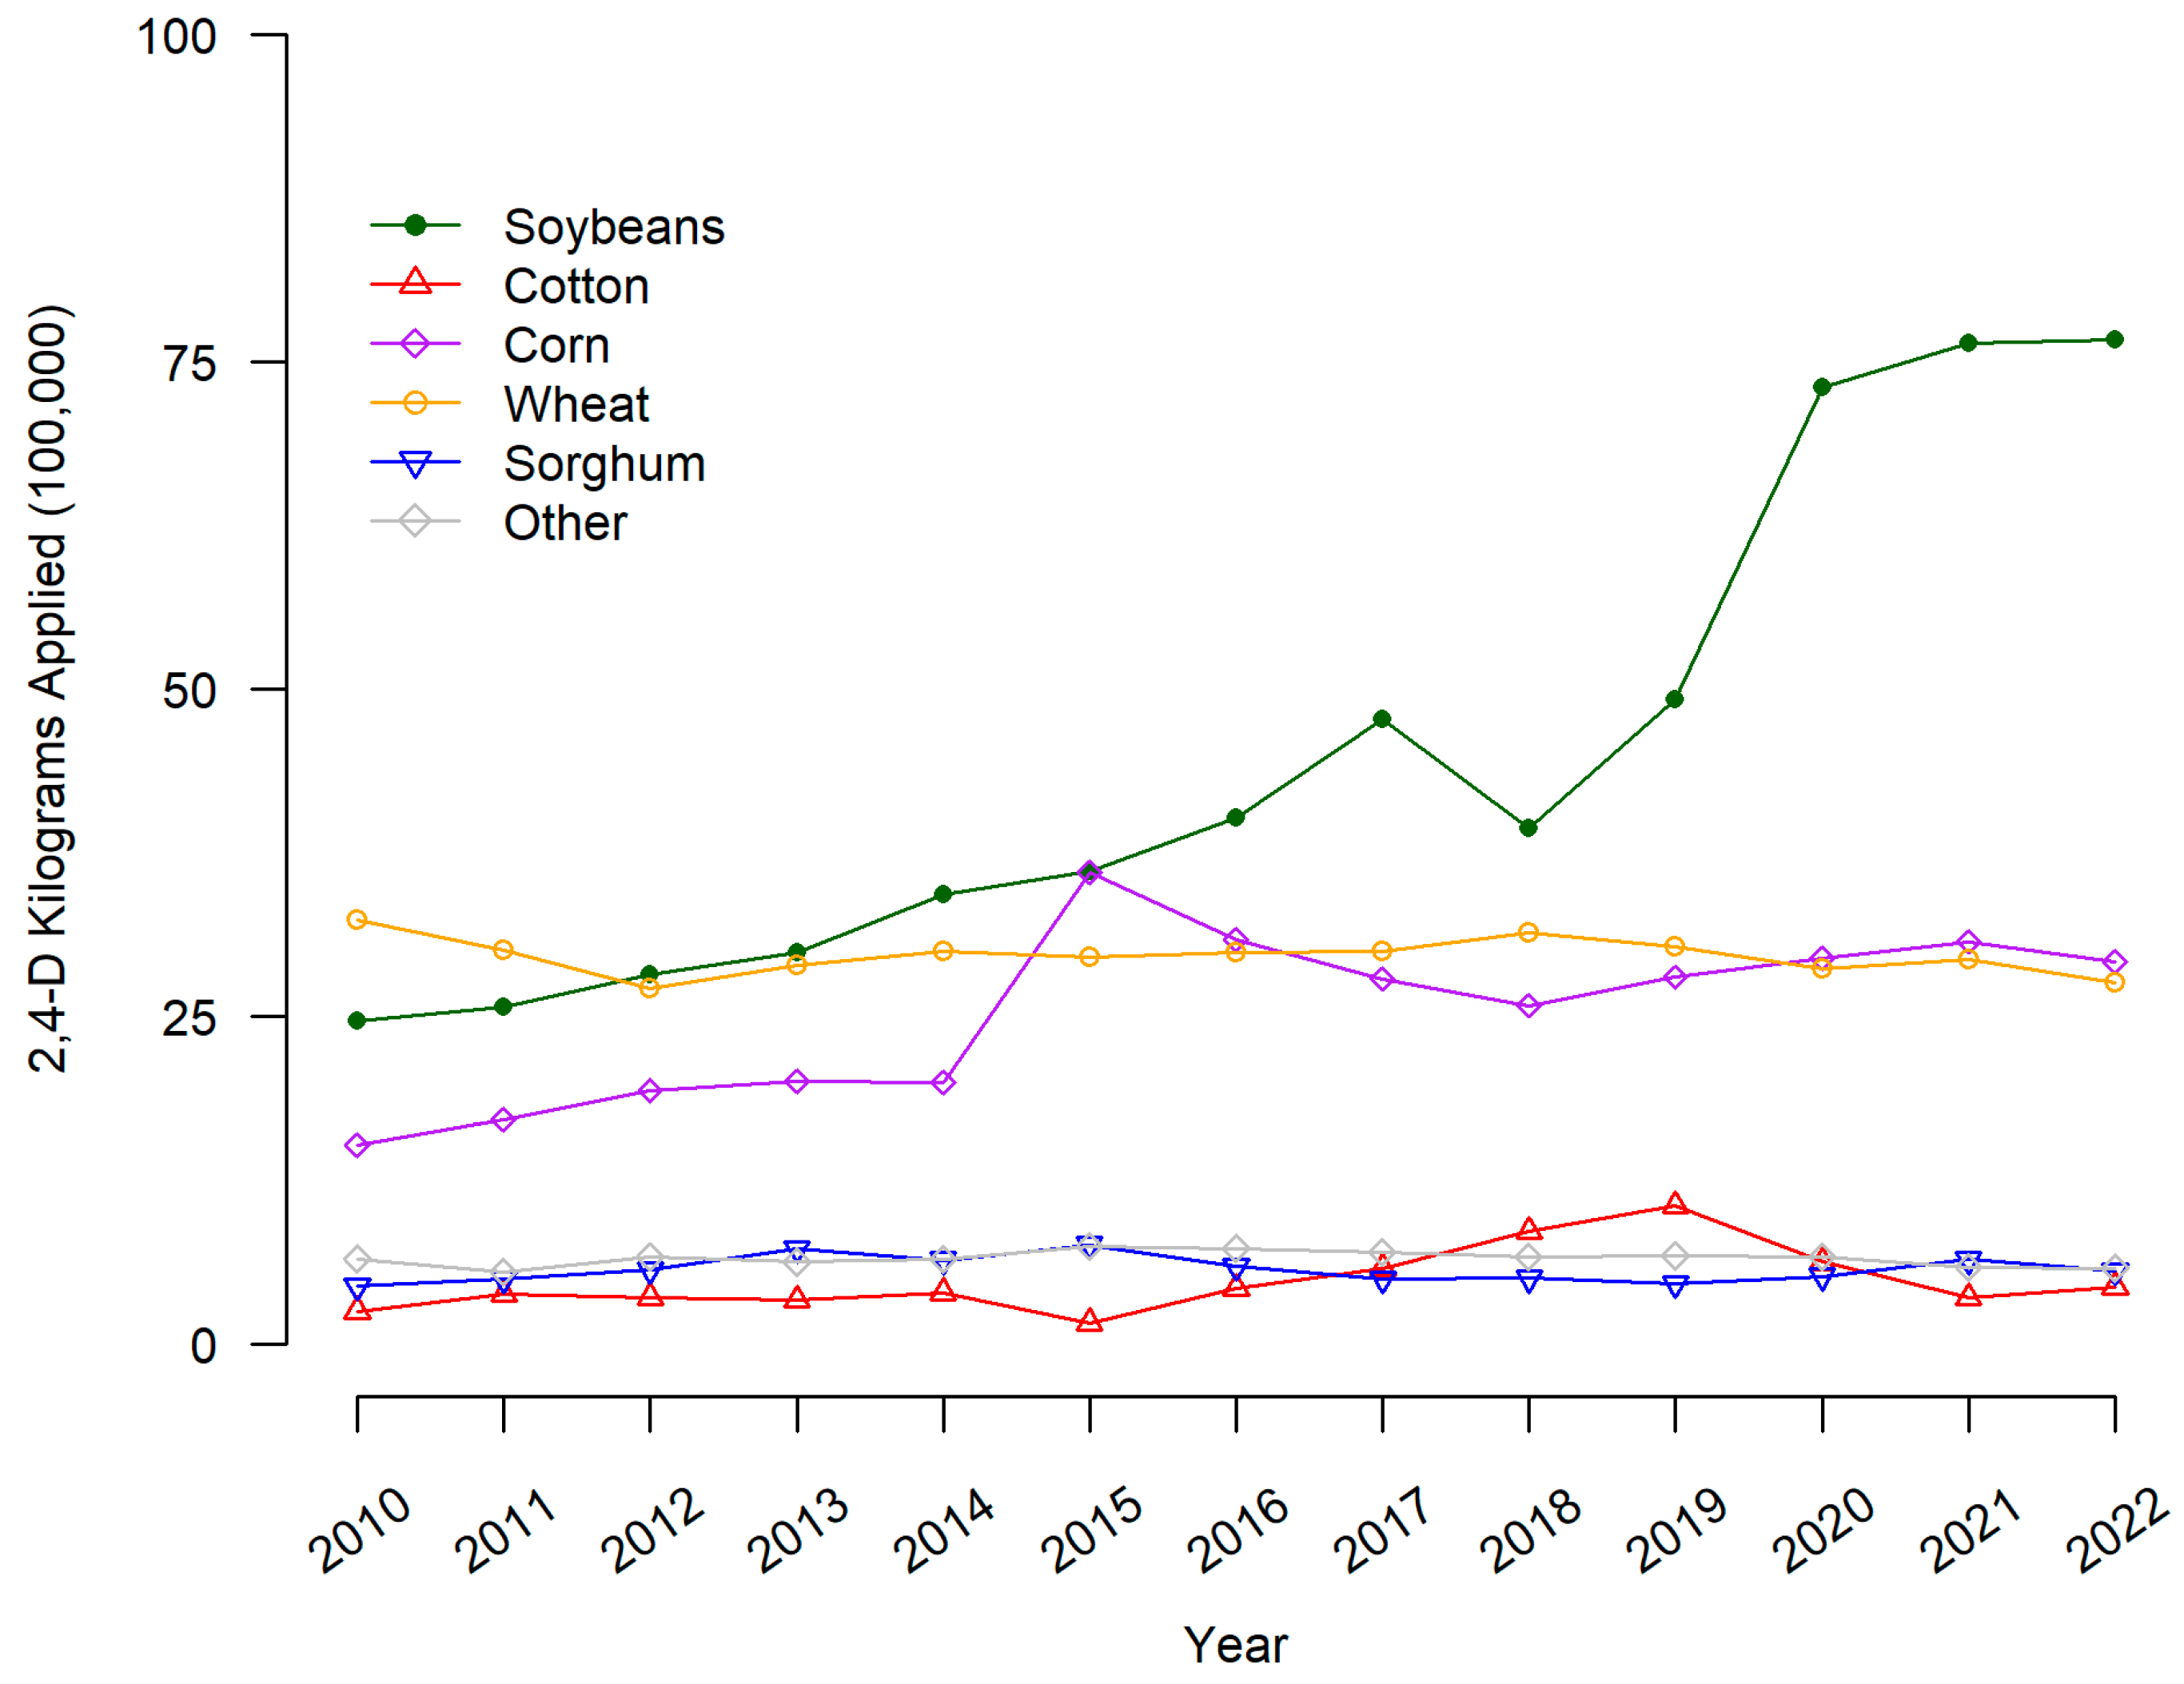
From Figure 2, the overall level of 2,4_D use (kilograms applied in one hundred thousands) in the US was highest in 2010 for wheat, soybeans, and corn. The amount of 2,4-D applied increased the most for soybeans and corn from 2010 to 2020 but remained relatively stable for wheat, sorghum, cotton, and other crops.
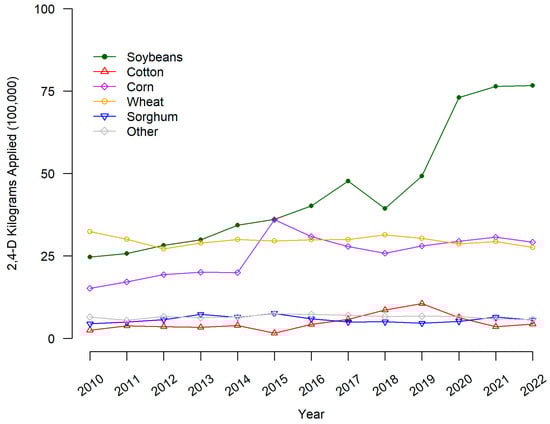
Figure 2.
2,4-D applied to major crops on US surveyed hectares. 2,4-D pounds applied is the sum of all forms of the herbicide reported in USDA-NASS surveys. Pounds applied was converted to kilograms by multiplying by 0.453592.
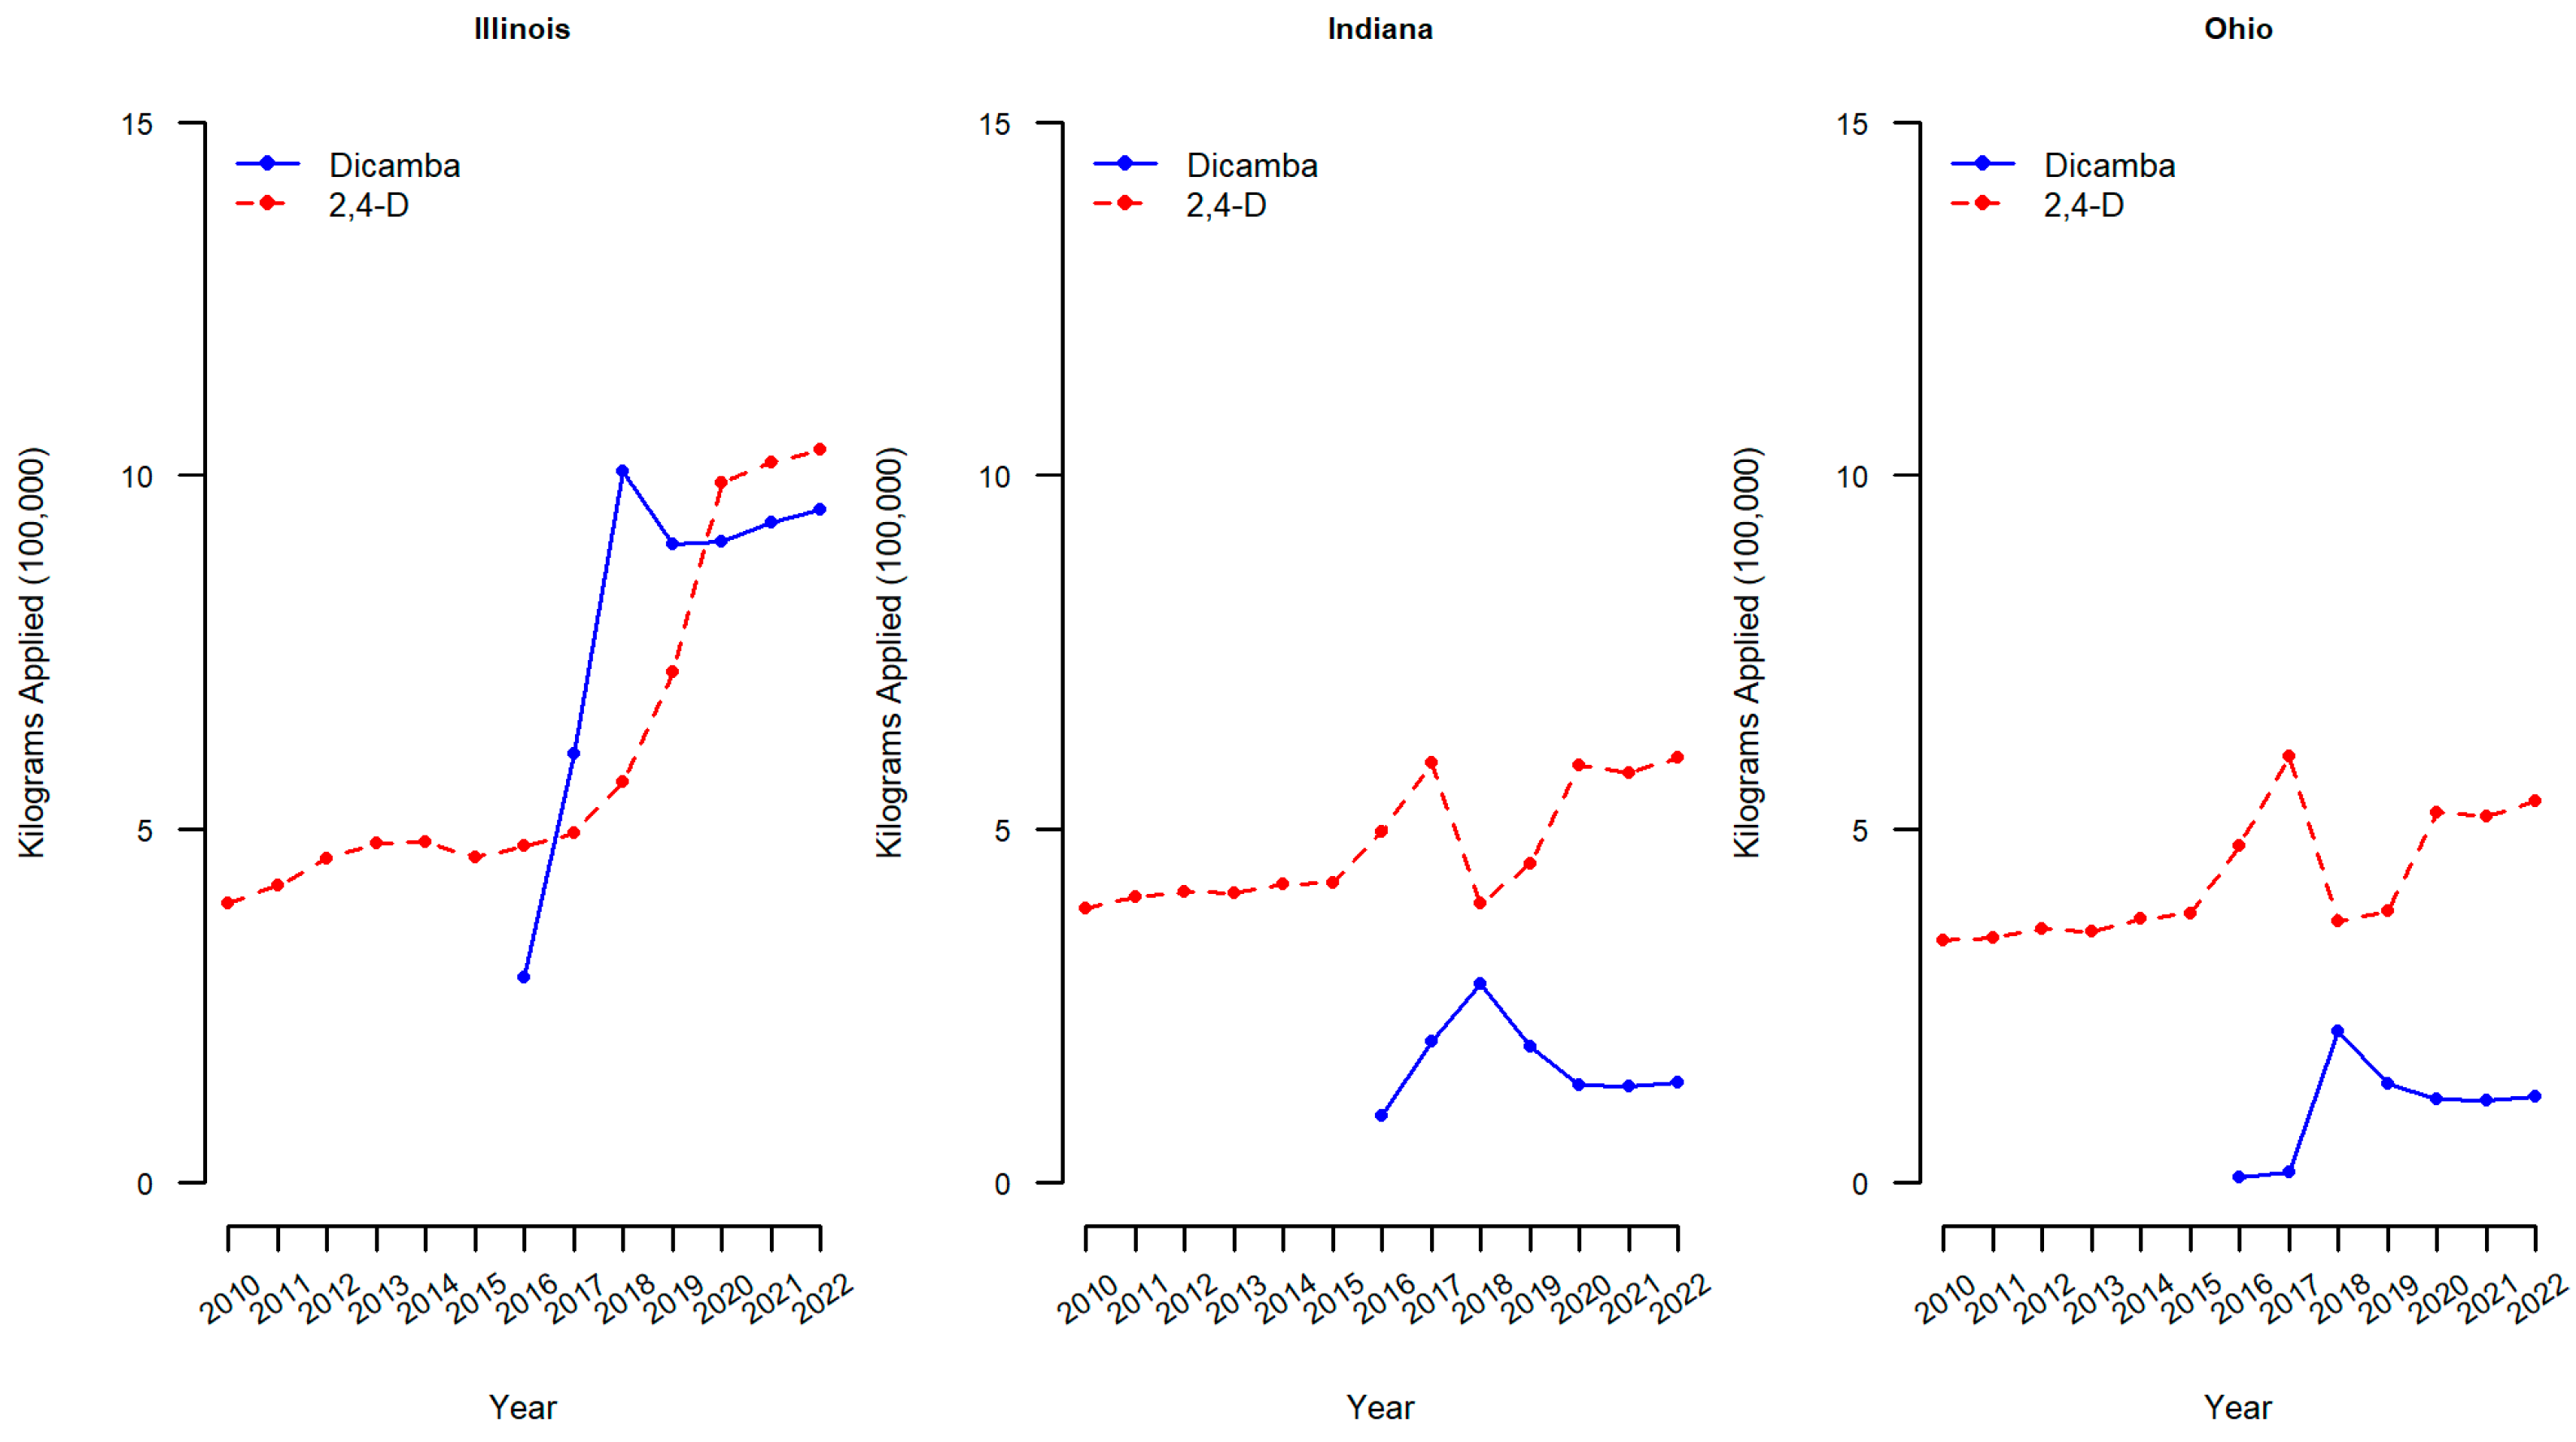
Similar figures of kilograms applied of dicamba and 2,4-D in 100,000 s of kgs to soybean crops are reported for the three midwestern states of the region where participants of the current study were enrolled (Illinois, Indiana, and Ohio).
Within the three midwestern states of interest, the kilograms of dicamba applied to soybean crops also has increased substantially (Figure 3). In Illinois, the amount of dicamba applied annually rose from approximately 2.9 kg (in one hundred thousands) in 2016 to over 9 kg (in one hundred thousands) by 2020, and 2,4-D increased also from 4.8 to 9.9 kg (in one hundred thousands) over the same time period. The increases in dicamba applied to soybean crops in Indiana and Ohio were also both observed but not as drastically as in Illinois. For example, in Indiana, the amount of dicamba applied annually rose from approximately 0.9 kg (in one hundred thousands) in 2016 to over 1.3 kg (in one hundred thousands) by 2020. The levels of 2,4-D applied to soybean crops within these midwestern states have varied with a continued increase in the amount of 2,4-D applied in Illinois over the years and a marked increase in Indiana and Ohio in 2017, followed by a drop in 2018 and an increase thereafter. Across all three states, the amount of 2,4-D applied to soybeans has increased from 2010 to 2020, which is consistent with the US figure (Figure 2). As the use of genetically modified weed control methods increases, human exposure is also expected to increase [9]. If the increased use of dicamba and 2,4-D in the Midwest is reflected in the concentrations of analytes in the urine of pregnant individuals, this should result in a difference between the first cohort (2010–2012 prior to the initial use of dicamba-tolerant soybean technology) and the second cohort (2020–2022).
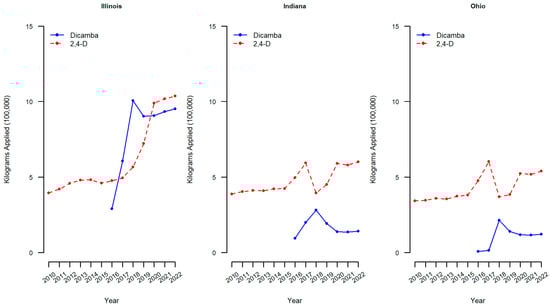
Figure 3.
Dicamba and 2,4-D applied to soybean crops in midwestern states. Dicamba and 2,4-D pounds applied is the sum of all forms of herbicide reported in USDA-NASS surveys. Pounds applied was converted to kilograms by multiplying by 0.453592.
Although some studies have found associations between exposure levels of 2,4-D and adverse effects on maternal and/or neonatal outcomes, the results are limited. Urinary biomarkers of 2,4-D in 269 women were found to be associated with decreased head circumference [10], and biomarkers of 2,4-D measured in umbilical cord blood plasma in 232 women were found to be associated with deficits in auditory processing in infants [11]. However, another study of 858 mother–infant pairs found no association of 2,4-D measured in urine with outcomes of birth weight, gestational length, and abdominal circumference [12]. A more recent study measured levels of 2,4-D in urine collected longitudinally on 1225 pregnant women in China and found that approximately 97.4% of the urine samples contained 2,4-D and the levels were associated with biomarkers of oxidative stress [13]. The association of exposure to 2,4-D and biomarkers of oxidative stress has also been documented previously [14]. This is highly important since oxidative stress may be an underlying mechanism leading to adverse pregnancy outcomes [15].
Even fewer studies have explored the level of exposure to dicamba and the impact of exposure on adverse outcomes. Dicamba at low levels has similar hormonal properties to a class of plant hormones involved in cellular plant developmental processes [16], and at high concentrations, dicamba causes abnormal cell division and growth, disrupting normal plant functions, which results in death [17,18]. Previous studies that have examined levels of dicamba found in urine are relatively outdated and used assays that were not as accurate [19]; for example, only 1.4% of 400 urine samples obtained from a representative sample of the United States general population from 1976 to 1980 had quantifiable dicamba detected [20]. Our study is the first biomonitoring study with this level of accuracy to evaluate levels of dicamba in urine. Research is also still needed on the potential health effects of exposure to dicamba. From 3412 pregnancies from the Ontario farm study, exposure to dicamba 3 months prior to conception by self-report was found to be associated with an increased risk of birth defects in male offspring, although no association was found among all offspring [21]. Also, a case–control study of over 40,000 pesticide applicators found those in the highest quartile of exposure to dicamba had an increased risk of liver and intrahepatic bile duct cancer relative to those not exposed to dicamba [22]. However, no studies have examined the association of dicamba measured in urine with adverse pregnancy outcomes, hence the need for more research on the relationship between biomarkers of exposure and adverse effects on maternal and neonatal outcomes.
The Heartland Study (HS) was designed to fill this gap and is an ongoing Midwest-based birth cohort study that began in 2019. The goal of the study is to enroll at least 2000 mother–infant pairs to examine the association of prenatal herbicide exposure on pregnancy and childbirth outcomes as well as early childhood development [23]. The lack of a verified, sensitive, and cost-effective method to detect dicamba was identified as a key analytical gap. The fiscal sponsor of the HS, the Heartland Health Research Alliance (hh-ra.org), asked the Laboratoire du Centre de Toxicologie du Québec (CTQ) to develop a robust, selective, and sensitive method capable of detecting both 2,4-D and dicamba, along with other pesticide analytes, in urine, thereby producing a method suitable for biomonitoring in the general population. The new method was developed and validated by CTQ [19] and is coupled with CTQ’s glyphosate-glufosinate method, which allows the HS team to quantify 17 pesticide analytes in urine samples.
The objective of this biomonitoring analysis was to assess whether biomarkers (concentration levels in urine) of dicamba and 2,4-D collected during pregnancy have increased in the Midwest (a geographic area where the use of these herbicides has increased substantially) by comparing a 2010–2012 cohort (i.e., nuMoM2b Study participants) to a 2020–2022 cohort (i.e., Heartland Study) using the newly validated 13-analyte method developed by CTQ. The method measures three analytes associated with herbicides (dicamba, 2,4-D, and 2,4-T), but 2,4-T is no longer registered for use in the United States; thus, dicamba and 2,4-D are the focus of the current analysis. Our results provide preliminary information on whether and to what degree 2,4-D and dicamba exposures have changed in the wake of the adoption of dicamba-tolerant soybean technology. Examining the association of maternal herbicide exposure with adverse maternal and neonatal outcomes is beyond the scope of the present paper but is part of the overall goal of the ongoing Heartland Study [23].
2. Materials and Methods
2.1. Study Population
The HHRA accessed frozen urine samples collected in 2010–2012 as part of the NIH-funded (nuMoM2b) Nulliparous Pregnancy Outcomes Study: Monitoring Mothers-to-be project [24]. The full nuMoM2b study was an observational cohort from 8 study sites that enrolled 10,037 pregnant individuals. The current study used 61 samples collected in the first trimester from women enrolled in nuMoM2b from 3 of the study sites located in the Midwest as part of a smaller nested case–control study (Indiana University, Case Western University/Ohio State University, and Northwestern University). Specifically, cases were selected as participants in which any of the following occurred: hypertensive disorders of pregnancy, spontaneous preterm birth, gestational diabetes, stillbirth, or fetal demise < 20 weeks. Cases were matched to controls by participant characteristics such as age and smoking status. For the more recent cohort, samples of urine collected in 2020–2022 from pregnant individuals in their first trimester enrolled in the Heartland Study from Indiana were collected. Although the Heartland Study is ongoing, the earliest available 91 samples were analyzed for pesticide concentrations in the analysis.
The nuMoM2b study (ClinicalTrials.gov Identifier: NCT01322529) was approved by institutional review boards at all participating study sites. The urine specimens were obtained from a smaller substudy of this primary trial and received approval from the Indiana University Institutional Review Board on 24 May 2021 (protocol # 11666). The Heartland Study was approved by the Indiana University Institutional Review Board on 27 June 2019 (protocol # 1906366316).
2.2. Sample Collection
NuMoM2b urine samples were obtained during the first trimester from participants with a viable singleton gestation who were between 6 weeks + 0 days gestation and 13 weeks + 6 days gestation during an in-person study visit by trained research staff members. Samples were transferred to the laboratory for temporary storage until being sent to the central repository. Maternal urine specimens for Heartland participants were obtained during the first trimester (defined as up to 13 weeks + 6 days gestation) either during routine obstetrical visits by trained research staff members or self-collected remotely. Samples were allowed to be collected at any time of day. Frozen samples from both cohorts were shipped to Centre de Toxicologie du Québec (CTQ) for analysis.
2.3. Lab Methods
Urine specimens from both cohorts were analyzed using a validated method developed by the Centre de Toxicologie du Québec (CTQ) [19]. This method measures 13 biomarkers of pesticides exposure, including herbicides (dicamba, 2,4-D, and 2,4,5-trichlorophenoxyacetic acid (2,4,5-T)), organophosphates insecticides (malathion dicarboxylic acid (MDA), para-nitrophenol (PNP), 3,5,6-trichloro-2-pyridinol (TCPy), 2-diethylamino-6-methylpyrimidin-4-ol (DEAMPY), and 2-isopropyl-6-methyl-4-pyrimidinol (IMPY)), and synthetic pyrethroids insecticides (cis-3-(2,2-Dichlorovinyl)-2,2-dimethylcyclopropane carboxylic acid (cis-DCCA), trans-3-(2,2-Dichlorovinyl)-2,2-dimethylcyclopropane carboxylic acid (trans-DCCA), 3-Phenoxybenzoic acid (3-PBA), 4-Fluoro-3-phenoxybenzoic acid (4-F-3-PBA), and cis-3-(2,2-Dibromovinyl)-2,2-dimethylcyclopropane carboxylic acid (cis-DBCA)).
Briefly, the metabolites in urine samples (250 µL) were hydrolyzed using 200 µL of a β-glucuronidase enzyme solution (6300 units/mL) in a pH 5.0 acetate buffer. After overnight incubation at 37 °C, a solid-phase extraction (SPE) of the pesticides’ biomarkers was performed using Strata-X cartridges (30 mg/3 mL; Phenomenex, Torrance, CA, USA). The extracts were then analyzed by liquid chromatography–tandem mass spectrometry (LC-MS/MS) in the multiple reaction monitoring mode (MRM) using an Acquity I-Class UPLC system (Waters, Milford, MA, USA) coupled to a Triple Quad 7500 System from AB Sciex (Concord, Ontario, Canada). The analytical column used was an Acquity Premier BEH C18 Column with VanGuard FIT (100 mm × 2.1 mm, 1.7 µm; Waters, Milford, MA, USA).
Specific gravity was measured using a refractometer.
2.4. Sample Size and Power
Prior to testing the hypothesis of whether there was an increase in pesticide concentrations in the more recent cohort, a power analysis was conducted. The number of available independent urine samples that had both dicamba and specific gravity measured was 57 in the nuMoM2b cohort and 86 in the Heartland Study cohort (Total N = 143). As the planned analysis was to compare the two cohorts on the specific gravity-adjusted log-transformed dicamba concentrations, power was based on a two-sample two-sided t-test, which provides 80% power to detect a standardized mean difference effect size (ES) of 0.48 at the 0.05 significance level, assuming the transformed measure is approximately normal. Because fewer urine samples were missing specific gravity for urine samples that also had 2,4-D concentrations, the available sample size for the 2,4-D outcome was N = 61 and N = 91 (Total N = 152), yielding 80% power to detect an ES = 0.47. As Cohen defines a medium effect size of ES = 0.50 [25], our hypotheses are appropriately powered to detect meaningful differences in concentration levels with the available sample sizes.
2.5. Statistical Methods
Machine-read herbicide analyte concentrations (µg/L) in the nuMoM2b and Heartland Study urine samples were provided by CTQ to the Heartland Study Data Coordinating and Analytics (DCA) core. The concentrations were normalized for dilution by a specific gravity adjustment using the formula Concentration × [(SGreference − 1)/(SGi − 1)], where SGreference is a specified value derived from the cohort or a population value and SGi is the specific gravity of the urine sample.
Potential ways to normalize for specific gravity include using the median (or mean) of either the cohort or some standard population-based cohort for reference. The most recent CDC-NIOSH manual references a specific gravity value of 1.020 as representative of the US population [26,27,28]. In the present analysis, we used a fixed value of 1.020 for the population value (SGreference), which maintains consistency of standardization across cohorts and trimesters of pregnancy. Concentration values below the limit of detection were censored at the specific gravity-standardized limit of detection. Descriptive statistics for the specific gravity by cohort were also estimated.
To verify that the two cohorts represent a similar population of pregnant individuals, descriptive statistics for available demographic characteristics in both cohorts were provided. Spray season was defined as urine being collected between April and October. Although the exact date of sample collection was not available for nuMoM2b, most were collected at their Visit 1 assessment in the first trimester. Therefore, we assumed the collection date was the Visit 1 date. Quantiles (25th percentile, median, 75th percentile, 95th percentile) were estimated for dicamba and 2,4-D by cohort using machine-read values of concentrations that are not specific gravity (SG)-standardized, as well as SG-standardized values, assuming the data are lognormal.
For concentrations below the limit of detection (LOD), parameter estimates were obtained assuming data are lognormally distributed and specifying these values as left-censored [29]. To test our hypothesis that there is an increase in both analytes (dicamba; 2,4-D) in the most recent cohort (Heartland Study) compared to the historical cohort (nuMoM2b), which represents the pre-dicamba tolerant soybean period, the p-value is reported from the likelihood ratio test for comparing the two cohorts, assuming the data are lognormal. As spray season may influence exposure [13], the comparison of concentrations between cohorts was also conducted after adjusting for spray season to verify that the results were not affected.
The primary outcomes of interest are the specific gravity-adjusted concentration levels, although we also report the geometric mean and 95% confidence interval for the unadjusted concentration values. The proportion of participants (and 95% confidence intervals) with concentration values above the LOD and concentration values above the limit of quantification (LOQ) was estimated for each analyte by cohort. Additionally, empirical quantiles for dicamba, 2,4-D, and specific gravity are provided in the supplemental material with values below the limit of detection replaced with LOD/√2. The nuMoM2b samples were obtained as part of a nested case–control study from three study sites. Therefore, a sensitivity analysis was conducted where the primary comparison of SG-adjusted concentration levels between cohorts was re-estimated using inverse-probability weighting to account for the case–control status in the nuMoM2b participants. p-values < 0.05 were considered statistically significant. Statistical analyses were conducted in SAS Software, V9.4 (Cary, NC, USA).
3. Results
3.1. Descriptive Information of Pregnant Participants
For cohorts used in the dicamba comparison, most pregnant participants in this analysis were non-Hispanic with a mean age of 29, Table 1. A similar distribution of participants’ race, ethnicity, education, and income was observed in both cohorts, although the mean gestational age at the first trimester was slightly higher in the nuMoM2b cohort (mean = 81.7 days, SD = 10.4 vs. mean = 73.3 days, SD = 15.5). Urine sample collection during the spray season was also comparable (68.4% of nuMoM2b samples and 60.5% of Heartland Health samples). Thus, the two cohorts are similar with respect to available demographic characteristics.

Table 1.
Demographic characteristics of participants with urine samples included in dicamba comparison.
The nuMoM2b cohort for the dicamba comparison was obtained from participants enrolled in Illinois (64.9%, 37/57), Indiana (28.1%, 16/57), and Ohio (7%, 4/57). The Heartland cohort contained missing data for characteristics of race, ethnicity, education, and income ranging from 16% to 38% for the smaller cohort of 86 used in the dicamba comparison. As most of the participants for the comparison of 2,4-D concentrations overlap with the presented dicamba participants, the differences in demographic characteristics between the nuMoM2b and Heartland cohorts are similar, Appendix A (Table A1). A similar distribution by state was also observed for the nuMoM2b participants in which 2,4-D was measured: Illinois (63.9%, 39/61), Indiana (26.2%, 16/61), and Ohio (9.8%, 6/61), with all Heartland participants recruited from Indiana sites.
3.2. Dicamba and 2,4-D Measured in Urine
Dicamba was detected in urine samples at levels above the LOD (0.1 µg/L) for 28% (95% CI: 16%, 40%) of the nuMoM2b cohort and 70% (95% CI: 60%, 79%) of the Heartland Study cohort; therefore, the proportion of women with dicamba detected in their urine is significantly higher in the more recent cohort (Table 2). Concentration levels were detected above the LOQ (0.33 µg/L) in 5% (95% CI: 0%, 11%) and 45% (95% CI: 35%, 56%) of the nuMoM2b and Heartland Study cohorts, respectively, Table 2. Participant urine samples for 2,4-D concentrations were all above the LOD (0.01 µg/L) for both cohorts. Almost all, 99% (95% CI: 97%, 100%), of the 2,4-D concentrations from the Heartland Study cohort were above the LOQ (0.034 µg/L). The median specific gravity for the Heartland Study cohort was 1.020 for both dicamba and 2,4-D samples and was 1.017 for both dicamba and 2,4-D in the historical nuMoM2b cohort; that is, both cohorts had values very near the US population value we used as our reference (i.e., 1.020), Appendix A (Table A2).
Table 2.
Proportions of concentration levels of dicamba and 2,4-D in urine samples above thresholds by cohort.
The specific gravity (SG)-standardized geometric mean of each for the two analyte concentrations is reported for the two cohorts, assuming data are approximately lognormal. For levels of dicamba concentrations below the LOD, parameter estimates were obtained, considering these values to be left-censored. A significant increase in dicamba concentration was observed in the most recent Heartland cohort as compared to the historical nuMoM2b cohort. The SG-standardized geometric mean of dicamba concentration was 0.066 μg/L (95% CI: 0.042, 0.104) in the nuMoM2b cohort and 0.271 μg/L (95% CI: 0.205, 0.358) in the Heartland Study cohort, with a statistically significant difference in dicamba concentrations (p-value < 0.001), Table 3. The difference in the SG-standardized geometric mean concentrations for 2,4-D between the two cohorts was not statistically different (p-value = 0.226); the 2,4-D concentrations were 0.383 μg/L (95% CI: 0.321, 0.458) in the nuMoM2b cohort and 0.442 μg/L (95% CI: 0.382, 0.511) in the Heartland Study cohort, Table 4.
Table 3.
Distribution of concentration levels (µg/L) of dicamba in urine samples estimated assuming lognormal.
Table 4.
Distribution of concentration levels (µg/L) of 2,4-D in urine samples estimated assuming lognormal.
As spray season could be a potential confounder, the models were also fit including cohort and spray season as explanatory variables. Spray season was not statistically significant in either the model for dicamba (p-value = 0.483) or 2,4-D (p-value = 0.998). The estimated geometric means and associated 95% confidence intervals by spray season and cohort are reported (Table 5). The results still hold in that the SG-standardized geometric mean of dicamba concentrations was still significantly higher in the more recent Heartland Study cohort (p-value < 0.0001) after adjusting for spray season. Similarly, the results for 2,4-D were also similar in that concentrations were not found to significantly differ by cohort even after adjusting for spray season (p-value = 0.227).
Table 5.
Concentration levels (µg/L) of dicamba and 2,4-D in urine samples by spray season and cohort estimated assuming lognormal.
As the urine samples for nuMoM2b were part of a nested case–control study, a sensitivity analysis was conducted to verify the robustness of the results accounting for the study design. The SG-adjusted concentration values of the nuMoM2b cohort were reweighted to reflect the full cohort of women from the three study sites. The prevalence of cases (hypertensive disorders of pregnancy, spontaneous preterm birth, gestational diabetes, stillbirth, or fetal demise < 20 weeks) in the full nuMoM2b study cohort from the three study sites was 7.8% (207/2669), whereas the prevalence of cases for the nuMoM2b urine samples was higher (36.8% (21/57) and 37.7% (23/61) for dicamba and 2,4-D samples, respectively) due to the case–control design. After accounting for the case–control status of the nuMoM2b study population by using inverse-probability weighting, the results were similar, Appendix A (Table A3). Specifically, dicamba concentrations were still significantly different (p < 0.0001) and 2,4-D concentrations were not statistically different (p = 0.118) between the two cohorts. The empirical quantiles (i.e., sample quantiles) for dicamba and 2,4-D are provided in Appendix A (Table A4) with values below the LOD replaced with LOD/√2.
4. Discussion
To our knowledge, no new dicamba human biomonitoring data have been generated since the substantial increase in dicamba use worldwide, brought about by the global launch in 2016 of dicamba-tolerant soybeans and cotton. The percent of pregnant women with detectable levels of dicamba in their urine in the 2020–2022 cohort is 2.5 times higher than in the earlier cohort (2010–2012), and a four-fold increase in mean concentration levels of dicamba was also observed over the same time period. This increase suggests the presence of a substantial new source of exposure.
In its most recent dicamba human health risk assessment, the US Environmental Protection Agency (EPA) [30] addressed the propensity of dicamba to volatilize and move with the wind. The pesticide manufacturers who won approval for dicamba formulations to be used “over the top” of soybeans and cotton invested heavily in the search for less volatile formulations, with some success. Based on the very limited field data quantifying dicamba movement from treated fields, the EPA concluded that “over the top” applications of dicamba on dicamba-tolerant soybean and cotton fields would not lead to more frequent or higher levels of human exposure to dicamba.
Residues of dicamba in food are minimal according to the United States Department of Agriculture’s pesticide data program, which collects data on pesticide residues in multiple sampled food items [31]; thus, it is likely that a combination of inhalation exposure and the presence of dicamba in drinking water accounts for the changes in the frequency and levels of dicamba reported herein. As more urine samples are collected and tested by the Heartland Study team, we will explore the individual and joint impacts of characteristics such as place of residence (urban versus rural) and time of year (spray season, not spray season) on the frequency of detections and the distribution of concentration levels in urine. The results will help sharpen insights into the likely major sources of exposure to these herbicides in the midwestern US, a key step in mitigating exposures if any are deemed to be above acceptable risk thresholds.
Our work assessing the impacts of dicamba, 2,4-D, and other pesticide exposures on reproduction and children’s development is ongoing. Securing accurate pesticide exposure metrics is a key challenge and step because the magnitude of changes in the last decade in herbicide use patterns and intensity in the Midwest is unprecedented. This is the reason the Heartland Study is collecting and storing ample urine and buccal swabs for each mother–infant pair—to allow additional, future research when, for example, data on developmental outcomes are available and/or new tools to track markers of epigenetic impacts are developed.
The sequencing of DNA from infants born in the study and their parents is a particularly promising next step that will hopefully advance the identification and application of markers of genetic and epigenetic changes stemming from prenatal pesticide exposure. Within one or a few years of exposure, such markers can then be used to identify the presence of impacts known to be associated with neurodevelopmental problems or adult-onset disease. Such insights have the potential to markedly reduce the time required to link prenatal pesticide exposure to a heightened risk of adverse birth and health outcomes, thereby supporting regulatory interventions, when deemed necessary, a decade or more earlier than typically would be the case.
The EPA should continue monitoring newly published studies shedding light on herbicide-driven changes in reproductive outcomes and children’s development and place more weight on published, high-quality studies. As described previously [32], greater reliance on published, peer-reviewed science can accelerate progress in pesticide risk assessment science. Revisiting the data accessible to the EPA to project the movement of phenoxy herbicides in the air should also be considered. Given that inhalation exposure is a likely cause of the substantial increase in exposure documented herein, a reassessment of dicamba volatility is needed to empirically evaluate the conclusion that there is no significant increase in exposure to dicamba as a result of the approval of dicamba-tolerant soybeans and cotton.
One limitation to note is that the Heartland Study participants were all obtained from study sites within Indiana, whereas the historical nuMoM2b participants were obtained from Indiana, Ohio, and Illinois; thus, the regions do not completely overlap. However, based on Figure 2, we would expect participants from Illinois to have the highest exposure levels, and these participants are only in the earlier cohort. Therefore, if Illinois participants had been in the more recent cohort, the levels of dicamba and 2,4-D may have been even higher in the more recent cohort. We did not limit the nuMoM2b analysis to Indiana due to sample size issues. Although participants were all enrolled in the Midwest region, due to the inability to obtain residential addresses for the nuMoM2b cohort, determining whether participants resided in an urban or rural setting was not feasible. Another limitation is that the time of day of urine collection was also not documented in either cohort.
In conclusion, using the newly validated method developed by the Laboratoire du Centre de Toxicologie du Québec to quantify dicamba and 2,4-D concentration levels in urine, we found that dicamba in pregnant study participants increased significantly in the more recent Midwest cohort from 2020 to 2022 relative to the earlier cohort from 2010 to 2012. Concentration levels of 2,4-D also increased in the more recent cohort, but the difference was not statistically significant. These results were maintained when further adjusting for whether the sample was obtained during spray season. Importantly, 100% of the pregnant study participants had 2,4-D detected in their urine in both the 2010–2012 cohort and the 2020–2022 cohort. This mimics what was recently found in China, with 98.6% of urine samples obtained in the first trimester from 1225 pregnant women in Wuhan, central China, containing 2,4-D, though concentration levels were higher in our US Midwest cohort (0.442 µg/L vs. 0.14 µg/L [ng/mL]) [13]. Although animal studies indicate negative health impacts on perinatal exposure to both 2,4-D and dicamba, human studies are still limited [33]. Epidemiologic studies have reported health impacts on adults, but the results are mixed. There is also a large amount of variability in how exposures have been measured (e.g., self-report, proximity to crops, urine, etc.). Additional research is still needed to elucidate the health implications of exposures to dicamba and 2,4-D on adverse pregnancy outcomes and the health of the offspring.
Author Contributions
Conceptualization, D.M.H., C.M.B., J.K.D., and P.O.M.; development and validation of 13-analyte method, É.G. and J.L.; statistical analysis, J.K.D. and Y.Y.; data curation, D.G.; writing—original draft preparation, J.K.D.; writing—review and editing, D.M.H., C.M.B., J.K.D., and P.O.M. All authors have read and agreed to the published version of the manuscript.
Funding
Funding from the Heartland Health Research Alliance (hh-ra.org) covered the costs of collecting and testing urine samples from individuals enrolled in the Heartland Study, the testing of nuMoM2b samples, and the analytical contributions of the Data Coordinating and Analytics Core for the Heartland Study. The nuMoM2b study was supported by funding from the Eunice Kennedy Shriver National Institute of Child Health and Human Development: U10 HD063036, RTI, Indiana University: U10 HD063037, Northwestern University: U10 HD063020, and Case Western Reserve University: U10 HD063072.
Institutional Review Board Statement
The nuMoM2b study (ClinicalTrials.gov Identifier: NCT01322529) was approved by institutional review boards at all participating study sites. The urine specimens were obtained from a smaller substudy of this primary trial. The study was conducted in accordance with the Declaration of Helsinki and with approval from the Indiana University Institutional Review Board (protocol code 11666 and date of approval, 24 May 2021). The Heartland Study was conducted in accordance with the Declaration of Helsinki and approved by the Indiana University Institutional Review Board (protocol code 1906366316 and date of approval, 27 June 2019).
Informed Consent Statement
Written informed consent was obtained from all subjects in the Heartland Study. A waiver of authorization criteria was approved for the nuMoM2b study (protocol #11666) in accordance with 45 CFR 164.512(i).
Data Availability Statement
The datasets used and/or analyzed during the current study are available from the corresponding author upon reasonable request.
Conflicts of Interest
Charles Benbrook has served as an expert witness in litigation involving herbicides and was originally the Executive Director of the Heartland Health Research Alliance but stepped down to avoid any further conflicts of interest. He had no role in the analyses or interpretation of the data. No other author declares a conflict of interest.
Appendix A
Table A1.
Demographic characteristics for participants with urine samples included in 2,4-D comparison.
Table A1.
Demographic characteristics for participants with urine samples included in 2,4-D comparison.
| Characteristic | Overall N = 152 | nuMoM2b N = 61 | Heartland N = 91 |
|---|---|---|---|
| Age, Mean ± SD | 29.3 ± 5.7 | 29.3 ± 6.6 | 29.3 ± 5.1 |
| Gestational Age (Days), Mean ± SD | 76.6 ± 14.1 | 81.7 ± 10.2 | 73.1 ± 15.4 |
| Maternal Race, N (%) | |||
| - Black | 32 (23.4%) | 12 (19.7%) | 20 (26.3%) |
| - White | 83 (60.6%) | 36 (59.0%) | 47 (61.8%) |
| - Other | 22 (16.1%) | 13 (21.3%) | 9 (11.8%) |
| - Missing, N | 15 | 15 | |
| Maternal Ethnicity, N (%) | |||
| - Hispanic | 27 (19.6%) | 10 (16.4%) | 17 (22.1%) |
| - Non-Hispanic | 111 (80.4%) | 51 (83.6%) | 60 (77.9%) |
| - Missing, N | 14 | 14 | |
| Education, N (%) | |||
| - Less than HS grad, HS grad, or GED | 34 (26.4%) | 12 (19.7%) | 22 (32.4%) |
| - Some college or Assoc/Tech degree | 28 (21.7%) | 11 (18.0%) | 17 (25.0%) |
| - Completed college | 25 (19.4%) | 14 (23.0%) | 11 (16.2%) |
| - Degree work beyond college | 42 (32.6%) | 24 (39.3%) | 18 (26.5%) |
| - Missing, N | 23 | 23 | |
| Income, N (%) | |||
| - USD 0–24,999 | 17 (15.0%) | 6 (10.9%) | 11 (19.0%) |
| - USD 25,000–49,999 | 18 (15.9%) | 6 (10.9%) | 12 (20.7%) |
| - USD 50,000–99,999 | 27 (23.9%) | 13 (23.6%) | 14 (24.1%) |
| - USD 100,000–149,000 | 22 (19.5%) | 11 (20.0%) | 11 (19.0%) |
| - USD 150,000–199,999 | 14 (12.4%) | 11 (20.0%) | 3 (5.2%) |
| - USD 200,000 or more | 15 (13.3%) | 8 (14.5%) | 7 (12.1%) |
| - Missing, N | 39 | 6 | 33 |
| Spray Season, N (%) | |||
| - Yes | 96 (63.2%) | 41 (67.2%) | 55 (60.4%) |
| - No | 56 (36.8%) | 20 (32.8%) | 36 (39.6%) |
Table A2.
Distribution of specific gravity in urine samples from study cohorts.
Table A2.
Distribution of specific gravity in urine samples from study cohorts.
| Cohort | N | 25th %ile | 50th %ile | 75th %ile | 95th %ile |
|---|---|---|---|---|---|
| Specific gravity (dicamba samples) | |||||
| nuMoM2b | 57 | 1.011 | 1.017 | 1.020 | 1.028 |
| Heartland | 86 | 1.012 | 1.020 | 1.025 | 1.030 |
| Specific gravity (2,4-D samples) | |||||
| nuMoM2b | 61 | 1.011 | 1.017 | 1.021 | 1.028 |
| Heartland | 91 | 1.012 | 1.020 | 1.025 | 1.030 |
Note: %ile = percentile.
Table A3.
Distribution of concentration levels of dicamba and 2,4-D (µg/L) accounting for case–control status.
Table A3.
Distribution of concentration levels of dicamba and 2,4-D (µg/L) accounting for case–control status.
| Cohort | N | 25th %ile | 50th %ile | 75th %ile | 95th %ile | Geometric Mean (95% CI) | p-value |
|---|---|---|---|---|---|---|---|
| SG-standardized dicamba (assuming lognormal, accounting for case–control status of nuMoM2b) | |||||||
| nuMoM2b | 57 | 0.032 | 0.074 | 0.169 | 0.562 | 0.074 (0.048, 0.114) | <0.0001 |
| Heartland | 86 | 0.118 | 0.271 | 0.624 | 2.071 | 0.271 (0.205, 0.358) | |
| SG-standardized 2,4-D (assuming lognormal, accounting for case–control status of nuMoM2b) | |||||||
| nuMoM2b | 61 | 0.228 | 0.368 | 0.593 | 1.181 | 0.368 (0.308, 0.440) | 0.118 |
| Heartland | 91 | 0.274 | 0.442 | 0.713 | 1.419 | 0.442 (0.382, 0.511) | |
Note: %ile = percentile; SG: specific gravity. To account for the case–control status of the nuMoM2b, cohort inverse-probability weighting was used to weight the nuMoM2b sample so that the sample reflects the prevalence of cases (hypertensive disorders of pregnancy, spontaneous preterm birth, gestational diabetes, stillbirth, or fetal demise < 20 weeks) in the full cohort. Weights for Heartland health were kept at 1.
Table A4.
Empirical estimates of distribution of concentration levels of dicamba and 2,4-D (µg/L) by cohort.
Table A4.
Empirical estimates of distribution of concentration levels of dicamba and 2,4-D (µg/L) by cohort.
| Cohort | N | 25th %ile | 50th %ile | 75th %ile | 95th %ile |
|---|---|---|---|---|---|
| Not SG-standardized dicamba (values below LOD are substituted with LOD/√2) | |||||
| nuMoM2b | 57 | 0.071 | 0.071 | 0.119 | 0.521 |
| Heartland | 86 | 0.071 | 0.285 | 0.601 | 1.879 |
| SG-standardized dicamba (values below LOD are substituted with LOD/√2) | |||||
| nuMoM2b | 57 | 0.079 | 0.129 | 0.236 | 0.553 |
| Heartland | 86 | 0.141 | 0.309 | 0.757 | 1.632 |
| Not SG-standardized 2,4-D | |||||
| nuMoM2b | 61 | 0.158 | 0.253 | 0.418 | 1.081 |
| Heartland | 91 | 0.206 | 0.426 | 0.641 | 1.665 |
| SG-standardized 2,4-D | |||||
| nuMoM2b | 61 | 0.246 | 0.351 | 0.526 | 1.970 |
| Heartland | 91 | 0.271 | 0.404 | 0.676 | 1.422 |
Note: %ile = percentile; SG: specific gravity; LOD: limit of detection.
References
- Benbrook, C.M. Impacts of genetically engineered crops on pesticide use in the U.S.--The first sixteen years. Environ. Sci. Eur. 2012, 24, 24. [Google Scholar] [CrossRef]
- Benbrook, C. Trends in glyphosate herbicide use in the United States and globally. Environ. Sci. Eur. 2016, 28, 3. [Google Scholar] [CrossRef]
- Borel, B. Weeds Are Winning the War against Herbicide Resistance: Herbicides Are under Evolutionary Threat. Can Modern Agriculture Find a New Way to Fight Back? Scientific American: New York, NY, USA, 2018; Available online: https://www.scientificamerican.com/article/weeds-are-winning-the-war-against-herbicide-resistance1/ (accessed on 22 January 2024).
- Heap, I.; Duke, S.O. Overview of glyphosate-resistant weeds worldwide. Pest Manag. Sci. 2018, 74, 1040–1049. [Google Scholar] [CrossRef]
- Green, J.M.; Owen, M.D.K. Herbicide-Resistant Crops: Utilities and Limitations for Herbicide-Resistant Weed Management. J. Agric. Food Chem. 2011, 59, 5819–5829. [Google Scholar] [CrossRef]
- Wechsler, S.J.; Smith, D.; McFadden, J.; Dodson, L.; Williamson, S. The Use of Genetically Engineered Dicamba-Tolerant Soybean Seeds Has Increased Quickly, Benefiting Adopters but Damaging Crops in Some Fields. In Amber Waves: The Economics of Food, Farming, Natural Resources, and Rural America; USDA, Economic Research Service: Washington, DC, USA, 2019. [Google Scholar]
- Hygeia Analytics. PUDS—The Pesticide Use Data System. Available online: https://hygeia-analytics.com/pesticides/usage/puds-the-pesticide-use-data-system/ (accessed on 5 May 2021).
- United States Department of Agriculture. National Agricultural Statistics Service Quick Stats. Available online: https://quickstats.nass.usda.gov/ (accessed on 22 January 2024).
- Myers, J.P.; Antoniou, M.N.; Blumberg, B.; Carroll, L.; Colborn, T.; Everett, L.G.; Hansen, M.; Landrigan, P.J.; Lanphear, B.P.; Mesnage, R.; et al. Concerns over use of glyphosate-based herbicides and risks associated with exposures: A consensus statement. Environ. Health 2016, 15, 19. [Google Scholar] [CrossRef]
- Balalian, A.A.; Liu, X.; Herbstman, J.B.; Daniel, S.; Whyatt, R.; Rauh, V.; Calafat, A.M.; Wapner, R.; Factor-Litvak, P. Prenatal exposure to organophosphate and pyrethroid insecticides and the herbicide 2,4-dichlorophenoxyacetic acid and size at birth in urban pregnant women. Environ. Res. 2021, 201, 111539. [Google Scholar] [CrossRef] [PubMed]
- Silver, M.K.; Shao, J.; Li, M.; Ji, C.; Chen, M.; Xia, Y.; Lozoff, B.; Meeker, J.D. Prenatal exposure to the herbicide 2,4-D is associated with deficits in auditory processing during infancy. Environ. Res. 2019, 172, 486–494. [Google Scholar] [CrossRef] [PubMed]
- Dalsager, L.; Christensen, L.E.; Kongsholm, M.G.; Kyhl, H.B.; Nielsen, F.; Schoeters, G.; Jensen, T.K.; Andersen, H.R. Associations of maternal exposure to organophosphate and pyrethroid insecticides and the herbicide 2,4-D with birth outcomes and anogenital distance at 3 months in the Odense Child Cohort. Reprod. Toxicol. 2018, 76, 53–62. [Google Scholar] [CrossRef]
- Wang, Y.; Wan, Y.; Cao, M.; Wang, A.; Mahai, G.; He, Z.; Xu, S.; Xia, W. Urinary 2,4-dichlorophenoxyacetic acid in Chinese pregnant women at three trimesters: Variability, exposure characteristics, and association with oxidative stress biomarkers. Chemosphere 2022, 304, 135266. [Google Scholar] [CrossRef] [PubMed]
- Lerro, C.C.; Beane Freeman, L.E.; Portengen, L.; Kang, D.; Lee, K.; Blair, A.; Lynch, C.F.; Bakke, B.; De Roos, A.J.; Vermeulen, R.C. A longitudinal study of atrazine and 2,4-D exposure and oxidative stress markers among iowa corn farmers. Environ. Mol. Mutagen. 2017, 58, 30–38. [Google Scholar] [CrossRef]
- Duhig, K.; Chappell, L.C.; Shennan, A.H. Oxidative stress in pregnancy and reproduction. Obstet. Med. 2016, 9, 113–116. [Google Scholar] [CrossRef]
- Kelley, K.B.; Riechers, D.E. Recent developments in auxin biology and new opportunities for auxinic herbicide research. Pestic. Biochem. Physiol. 2007, 89, 1–11. [Google Scholar] [CrossRef]
- Caux, P.Y.; Kent, R.A.; Taché, M.; Grande, C.; Fan, G.T.; MacDonald, D.D. Environmental fate and effects of dicamba: A Canadian perspective. Rev. Environ. Contam. Toxicol. 1993, 133, 1–58. [Google Scholar] [CrossRef]
- Bunch, T.R.; Gervais, J.A.; Buhl, K.; Stone, D. Dicamba Technical Fact Sheet; National Pesticide Information Center, Oregon State University Extension Services. Available online: http://npic.orst.edu/factsheets/archive/dicamba_tech.html/ (accessed on 22 January 2024).
- Larose, J.; Bienvenu, J.-F.; Bélanger, P.; Gaudreau, É.; Yu, Y.; Guise, D.M. New sensitive LC-MS/MS method for the simultaneous determination of 13 phenolic and carboxylic acid pesticide biomarkers in human urine, including dicamba. Chemosphere 2023, 344, 140349. [Google Scholar] [CrossRef]
- Kutz, F.W.; Cook, B.T.; Carter-Pokras, O.D.; Brody, D.; Murphy, R.S. Selected pesticide residues and metabolites in urine from a survey of the U.S. general population. J. Toxicol. Environ. Health 1992, 37, 277–291. [Google Scholar] [CrossRef] [PubMed]
- Weselak, M.; Arbuckle, T.E.; Wigle, D.T.; Walker, M.C.; Krewski, D. Pre- and post-conception pesticide exposure and the risk of birth defects in an Ontario farm population. Reprod. Toxicol. 2008, 25, 472–480. [Google Scholar] [CrossRef] [PubMed]
- Lerro, C.C.; Hofmann, J.N.; Andreotti, G.; Koutros, S.; Parks, C.G.; Blair, A.; Albert, P.S.; Lubin, J.H.; Sandler, D.P.; Beane Freeman, L.E. Dicamba use and cancer incidence in the agricultural health study: An updated analysis. Int. J. Epidemiol. 2020, 49, 1326–1337. [Google Scholar] [CrossRef] [PubMed]
- Freisthler, M.; Winchester, P.D.; Young, H.A.; Haas, D.M. Perinatal health effects of herbicides exposures in the United States: The Heartland Study, a Midwestern Birth Cohort Study. BMC Public Health 2023, 23, 2308. [Google Scholar] [CrossRef] [PubMed]
- Haas, D.M.; Parker, C.B.; Wing, D.A.; Parry, S.; Grobman, W.A.; Mercer, B.M.; Simhan, H.N.; Hoffman, M.K.; Silver, R.M.; Wadhwa, P.; et al. A description of the methods of the Nulliparous Pregnancy Outcomes Study: Monitoring mothers-to-be (nuMoM2b). Am. J. Obstet. Gynecol. 2015, 212, 539.e1–539.e24. [Google Scholar] [CrossRef]
- Cohen, J. Statistical Power Analysis for the Behavioral Sciences; L. Erlbaum Associates: Hillsdale, NJ, USA, 1988. [Google Scholar]
- DeBord, D.G.; Shoemaker, D.; B’Hymer, C.; Snawder, J.; DABT; NIOSH. Application of Biological Monitoring Methods for Chemical Exposures in Occupational Health. In NIOSH Manual of Analytical Methods (NMAM), 5th ed.; CDC-National Institute for Occupational Safety and Health (NIOSH): Washington, DC, USA, 2022; pp. BI-1–BI-48. [Google Scholar]
- Cone, E.J.; Caplan, Y.H.; Moser, F.; Robert, T.; Shelby, M.K.; Black, D.L. Normalization of Urinary Drug Concentrations with Specific Gravity and Creatinine. J. Anal. Toxicol. 2009, 33, 1–7. [Google Scholar] [CrossRef]
- Goldberger, B.A.; Loewenthal, B.; Darwin, W.D.; Cone, E.J. Intrasubject variation of creatinine and specific gravity measurements in consecutive urine specimens of heroin users. Clin. Chem. 1995, 41, 116–117. [Google Scholar] [CrossRef] [PubMed]
- Jin, Y.; Hein, M.; Deddens, J.; Hines, C. Analysis of Lognormally Distributed Exposure Data with Repeated Measures and Values below the Limit of Detection Using SAS. Ann. Occup. Hyg. 2011, 55, 97–112. [Google Scholar] [CrossRef] [PubMed]
- Irwin, W.; Gavelek, A.; Lowe, K.M.; Savoia, P.; Kamel, A.; Nguyen, J.; Evironmental Protection Agency. Dicamba and Dicamba BAPMA Salt: Human-Health Risk Assessment for Proposed Section 3 New Uses on Dicamba-Tolerant Cotton and Soybean; United States Environmental Protection Agency: Washington, DC, USA, 2016; pp. 1–105. Available online: https://www.regulations.gov/document/EPA-HQ-OPP-2016-0223-0002 (accessed on 22 January 2024).
- Pesticide Data Program Annual Summary Reports, Calendar Year 2018. Available online: https://www.ams.usda.gov/sites/default/files/media/2018PDPAnnualSummary.pdf/ (accessed on 22 January 2024).
- Boone, M.D.; Bishop, C.A.; Boswell, L.A.; Brodman, R.D.; Burger, J.; Davidson, C.; Gochfeld, M.; Hoverman, J.T.; Neuman-Lee, L.A.; Relyea, R.A.; et al. Pesticide Regulation amid the Influence of Industry. BioScience 2014, 64, 917–922. [Google Scholar] [CrossRef]
- Troudi, A.; Soudani, N.; Mahjoubi Samet, A.; Ben Amara, I.; Zeghal, N. 2,4-Dichlorophenoxyacetic acid effects on nephrotoxicity in rats during late pregnancy and early postnatal periods. Ecotoxicol. Environ. Saf. 2011, 74, 2316–2323. [Google Scholar] [CrossRef]
Disclaimer/Publisher’s Note: The statements, opinions and data contained in all publications are solely those of the individual author(s) and contributor(s) and not of MDPI and/or the editor(s). MDPI and/or the editor(s) disclaim responsibility for any injury to people or property resulting from any ideas, methods, instructions or products referred to in the content. |
© 2024 by the authors. Licensee MDPI, Basel, Switzerland. This article is an open access article distributed under the terms and conditions of the Creative Commons Attribution (CC BY) license (https://creativecommons.org/licenses/by/4.0/).