Article

Enhanced Lung Cancer Therapy via Co-Encapsulation of Docetaxel and Betulinic Acid

1
School of Pharmaceutical Sciences, Girijananda Chowdhury University, Guwahati 781017, India
2
Department of Pharmaceutical Sciences, Dibrugarh University, Dibrugarh 786004, India
*
Author to whom correspondence should be addressed.
Drugs Drug Candidates 2024, 3(3), 566-597; https://doi.org/10.3390/ddc3030033
Submission received: 7 July 2024 / Revised: 17 August 2024 / Accepted: 22 August 2024 / Published: 29 August 2024
(This article belongs to the Section Preclinical Research)

Abstract

:
Docetaxel (DTX) and betulinic acid (BA) co-encapsulated poly-lactic co-glycolic acid (PLGA) nanoparticles (NPs) were developed for enhanced lung cancer activity in vitro. Poly (lactic-co-glycolic acid) (PLGA) was used as an encapsulating polymer along with polyvinyl alcohol (PVA) as a stabilizing base to formulate NPs with the double-emulsion solvent evaporation method to study the size and potential, along with the surface morphology and in vitro release, of NPs. Cell culture studies like in vitro cellular uptake, apoptosis, and cell cycle arrest were performed in an in vitro cytotoxicity study to access the NP’s effect in the A549 human lung cancer cell line. The emulsification solvent evaporation technique produced smooth spherical nanoparticles of small sizes with a relatively narrow size distribution (147.2 ± 12.29 nm). On the A549 cell line, the formulation showed higher cytotoxicity (6.43 ± 0.11, 4.21 ± 0.32, and 1.17 ± 0.23 µmol for 24, 48, and 72 h, respectively) compared to the free drug due to an increase in vitro cellular uptake. Apoptosis and cell cycle analysis also confirmed the effectiveness of the prepared NPs. In vitro studies have proven the tumor-targeting potential of DTX-BA-NPs in A549 cell lines and could be future medication for lung cancer treatment.

1. Introduction

Lung cancer remains a formidable challenge for public health, persistently ranking as one of the leading causes of cancer-related deaths worldwide. With lung cancer accounting for around 18% of all cancer-related fatalities globally, lung cancer is a serious public health concern. With a five-year survival rate of about 21% for individuals with advanced-stage disease, it is the primary cause of cancer-related death in both men and women [1]. The prognosis for individuals with lung cancer remains poor despite advancements in treatment modalities such as surgery, radiation, and chemotherapy. This is mostly because of the high rate of metastasis and the emergence of drug resistance [2]. The mainstay of treating lung cancer, chemotherapy, frequently has serious side effects and a low success rate. This calls for the creation of more potent therapeutic approaches. One technique that shows promise for improving medicine absorption, reducing adverse effects, and producing synergistic effects is co-encapsulating multiple medicinal chemicals into a single delivery vehicle [3]. Figure 1 shows various ways to overcome drug resistance in cancer.
Docetaxel (DTX), a well-established chemotherapeutic agent, is widely used in the treatment of various cancers, including lung cancer [4]. It functions by stabilizing microtubules, thereby inhibiting cell division and inducing apoptosis [5]. However, the clinical utility of DTX is limited by its poor solubility [6], rapid clearance, and systemic toxicity [7]. On the other hand, betulinic acid (BA), a naturally occurring pentacyclic triterpenoid, has garnered attention for its potent anticancer properties [8]. It exhibits targeted cytotoxicity to cancer cells while sparing healthy cells, inducing apoptosis through many mechanisms, including mitochondrial dysfunction and activation of the intrinsic apoptotic pathway [9]. Despite its potential, betulinic acid’s clinical application is hindered by its low aqueous solubility and bioavailability [10].
The co-encapsulation of DTX and BA presents a novel strategy to overcome the limitations associated with their individual use. It is feasible to take advantage of the complimentary modes of action of both drugs by combining them into a single delivery method, which could result in increased anticancer activity and decreased toxicity. Because of this, the application of nanotechnology offers a valuable platform for improving the solubility, stability, and targeted distribution of medicines [11]. Chemotherapeutics with better pharmacokinetic profiles and fewer adverse effects may be delivered by nanocarriers such as liposomes, polymeric nanoparticles, and lipid-based nanoparticles [12].
Previously, the co-encapsulation of cisplatin, an antitumor agent, and fisetin, an antiangiogenic molecule, into liposomes showed promise in treating lung cancer. This approach enhances fisetin solubility and reduces cisplatin toxicity. Freeze-drying improved drug storage, maintaining efficacy for 30 days. In vitro studies on Lewis lung carcinoma cells showed strong synergy between co-loaded liposomes (CI = 0.7). In vivo, the co-encapsulated formulation effectively treated an ectopic murine model of Lewis lung carcinoma, potentially reducing cisplatin toxicity through co-encapsulation with fisetin [13]. Another study showing the co-encapsulation of paclitaxel (PTX) and salinomycin (SAL) in lipid nanocapsules (LNCs) targets both bulk breast cancer cells (MCF-7) and cancer stem cells (bCSCs). LNCs, with nano-size (~90 nm) and high drug encapsulation efficiency, effectively release drugs and exhibit strong cytotoxicity. Co-loaded LNCs induced apoptosis in bCSCs, showing superior effects and reducing tumor growth, highlighting their potential for targeted breast cancer treatment [14]. Another study demonstrated a drug delivery system using nanovesicles co-encapsulating interleukin-2 (IL-2) and doxorubicin (DOX), which effectively suppresses melanoma growth with minimal toxicity. Extending this approach, cytokine cocktails, including interferon-γ (IFN-γ), were developed to enhance immune responses and inhibit lung metastasis in triple-negative breast cancer [15]. Another two studies highlight two strategies for co-encapsulation in cancer therapy. First, PLA-based nanoplatforms co-deliver salinomycin (SAL) and doxorubicin (DOX), targeting cancer stem cells and bulk tumors with reduced toxicity and improved efficacy. Second, niosomes co-encapsulating gemcitabine (GEM) and tocotrienols enhance the antiproliferative effects and cytotoxicity against pancreatic cancer cells. Both approaches demonstrate how combining drugs in nanocarriers can optimize treatment efficacy and reduce side effects, offering potential benefits for lung cancer therapy as well [16,17]. Based on these studies, it is clear that co-encapsulation is an effective strategy for enhancing lung cancer treatment outcomes.
In this study, we examine the co-encapsulation of BA and DTX via a delivery system based on poly-lactic-co-glycolic acid (PLGA) nanoparticles (NPs). Nanoencapsulation using PLGA, a biocompatible polymeric carrier, presents a promising approach. PLGA is a widely recognized biodegradable and biocompatible polymer that has been approved by both the US Food and Drug Administration (FDA) and the European Medicines Agency (EMA). PLGA nanoparticles and microparticles have been employed to encapsulate a range of therapeutics for purposes such as vaccination and treatments for cardiovascular diseases and cancer. Via the increased permeability and retention (EPR) effect, PLGA NPs are especially useful in binding medications with low solubility and promoting their extravasation via tumor vasculature [18,19].
This work aims to accomplish mainly two goals: first, to create and describe the co-encapsulated NPs in terms of their physicochemical characteristics, drug loading effectiveness, and release profiles; second, to assess the co-encapsulated formulation’s in vitro cytotoxicity and capacity to induce apoptosis against lung cancer cell lines. We hypothesize that the co-encapsulation of BA and DTX will synergistically boost their anticancer activity, leading to better therapeutic outcomes than if they were administered separately as BA triggers apoptosis and modifies the immunological response, whereas DTX stabilizes microtubules and prevents cancer cells from proliferating. It is anticipated that the nanoparticle formulation will reduce systemic toxicity, enhance both medicines’ solubility and bioavailability, and make it easier for them to be delivered to tumor locations together. When compared to administering each medication separately, co-encapsulation is anticipated to produce prolonged drug release, increased cellular absorption, and a more effective anticancer impact, which could potentially improve treatment outcomes and minimize adverse effects. With the use of nanotechnology’s special benefits, this research attempts to advance the creation of safer and more effective treatment alternatives for lung cancer patients.
In conclusion, by investigating a unique co-encapsulation strategy to improve the efficacy of currently available chemotherapeutic drugs, this research fills a key gap in the treatment of lung cancer. The results of this study may open the door to novel combination treatments that give people fighting this terrible illness better chances of survival and a higher standard of living.

2. Results

2.1. Design of Experiment and Optimization Using Design Expert Software Version 13

An actual 23 design was obtained after determining the actual value range of all independent variables “A” (PVA concentration), “B” (sonication time), and “C” (ultrasonic frequency), and eight total runs were observed. After determining the observed values of size (Y1) and poly dispersity index (PDI) (Y2), an analysis was performed using polynomial analysis with the 2FI process order along with ANOVA as a significance model (Supplementary Table S1 (A), S1 (B), S1 (C), S1 (D)). The equations in terms of coded factors are shown in Equations (1) and (2). Various combinations of independent variables A (PVA concentration), B (sonication time), and C (ultrasonic frequency), i.e., AB, AC, and BC, may satisfy any specific requirement (i.e., increased or decreased, the (Y1) size/(Y2) PDI or both) while taking into consideration various factors involved in NP formulations.
Size (Y1) = (+192) + (55.25 × A) − (11.5 × B) + (14.75 × C) + (0.75000000000001 × AB) + (0 × AC) − (0.74999999999998 × BC)
PDI (Y2) = (0.209125) + (0.077625 × A) − (0.011875 × B) + (0.027125 × C) + (0.006125 × AB) + (0.004625 × AC) − (0.010875 × BC)
The effect of factors A and B regarding Y1 is shown in Figure 2A. An increase in A and a decrease in B lead to an increase in Y1. An increase in A and C leads to an increase in Y1 (Figure 2B). The decrease in B and increase in C to some extent shows a minor increase in Y1 (Figure 2C). An increase in A and a decrease in B lead to an increase in Y2 (Figure 2D). Increases in A and C lead to an increase in Y2 (Figure 2E). The decrease in B and increase in C to some extent shows a small increase in Y2 (Figure 2F).
After considering all dependent variables (A, B, and C) in their range according to the actual design, the response goal value of Y1 and Y2 was set at the minimum possible outcome. A total of 68 solutions were given and solution 1 was selected for further formulation consideration (Supplementary Table S1 (E), S1 (F)). According to solution 1, to obtain minimum Y1 and Y2 based on the entire range of dependent variables A, B, and C should be 0.1% (w/v), 11.45 min, and 50 Hz, respectively. The perturbation plot (Figure 2G) shows all the actual factors based on selected optimized results. Overlay-optimized plots show the actual required values of A, B, and C to find optimized Y1 and Y2 (Figure 2H–J).

2.2. Study of Drug–Excipient Interactions by FTIR

An FTIR-spectrophotometric investigation was used to determine the interaction between different functional groups present in the active drugs, DTX and BA, and the excipients used for NPs. The spectra of DTX, BA, and the excipient (PLGA) and their physical mixture were recorded (Figure 3). The FTIR spectra of BA have characteristic peaks at 3789.01 (O-H, stretching, free hydroxyl group), 3451.18 (O-H, stretching, broad peak, hydroxyl group of carboxylic acid), 2942.20 (C-H, stretching, aliphatic), 1686.64 (C=O, stretching), 1450.91 (C-H, bending), 1236.59 (C-O, stretching, carboxylic acid), and 1130.42 (C-O, stretching, alcohol) cm−1. The FTIR spectra of DTX show peaks at 3792.35 ((N-H, stretching), 3437.73 (O-H, stretching), 2931.55 (C-H, stretching, aliphatic), 1715.90 (C=O, stretching of benzoate), 1710.94 (C=O, stretching of ketone), 1247.93 (C-O, stretch, benzoate), 1112.98 (C-O, stretch, lactone), and 1026.12 (C-O, stretching of free hydroxy of 8-membered ring) cm−1. The FTIR spectra of PLGA show remarkable peaks at 3434.50 (O-H, stretch), 2945.34 (C-H, stretch, aliphatic), 1774.61 (C=O, stretch, ester), and 1125.08 (C-O, stretch) cm−1. The drug-containing nanoparticles (DTX-BA-NPs) spectra contained only the polymer’s distinctive peaks. The presence of weak physicochemical interactions, such as the van der Waals force of attraction, the formation of weak H-bonds, the dipole–dipole or dipole–induced dipole interaction, etc., may be important in the formation of the spherical shape of the nanoparticles, as evidenced by some slight peak shifting of the formulation ingredients that was observed. This implies that there is no free drug present on the nanoparticle surface (Figure 3) (Supplementary Figure S1).

2.3. Characterization of DTX-BA-NP

2.3.1. Evaluation of Particle Size, Size Distribution, and Zeta Potential

The physical characteristics of DTX- and BA-encapsulated PLGA NPs were studied. Size ranged from 129 nm to 212 nm with an average of 178.85 ± 29.54 nm obtained by the dynamic light scattering method (Figure 4A). The polydispersity index ranged from 0.011 to 0.357, with an average of 0.142 ± 0.099 (Figure 4A) (Supplementary Table S2). The average surface charge of polymeric DTX–BA-encapsulated NPs was determined based on zeta potential and was recorded at −27.8 ± 4.13 (Figure 4B). This falls between −30 and +30 mV, indicating instability under long-term conditions in an aqueous medium. Therefore, it should ideally be kept in powder form so that it can be dissolved in a medium before being administered [20].

2.3.2. Study of Surface Morphology

The prepared DTX-BA-NPs’ surface shape is important for drug uptake by cells or organs since it first interacts with the biomembrane, which affects the drug’s distribution and effects. DTX-BA-NPs’ surface morphology was mainly examined using a (Field Emission Scanning Electron Microscopy) FESEM. The photos show that the nanoparticles created ranged in size from 59 nm to 220 nm, with a maximum particle size of 137.269 ± 16.47 (Figure 5A,B), (Supplementary Table S3), (Supplementary Figure S2). The majority of the particles were spherical in shape. The smooth surface of the nanoparticles, devoid of any visible pores or fissures, was confirmed by the high-resolution data, indicating mechanical and structural rigidity. The (High Resolution Transmission Electron Microscopy) HRTEM study describes the internal structure of the experimental nanoparticle. The homogeneous drug distribution in the nanoparticles is clinched by the dark black splatter seen throughout the nanoparticle in the HRTEM pictures (Figure 5C,D).

2.3.3. Estimation of Percentage Drug Loading and Drug Loading Efficiency

The standardized HPLC method was used to calculate the percentage of entrapment. By adjusting the water/acetonitrile (ACN) system mobile phase ratio, flow rate, and run time, the HPLC process was standardized. Based on the research, for DTX 45% ACN was run for 10 min to obtain a peak at 7.5 min (Figure 6A). For the BA, 90% ACN was run for 7 min to obtain a peak at 4.7 min (Figure 6B). So, for DTX and BA, the retention time (RT) was found to be 7.5 min and 4.7 min on average, respectively. Calibration curves with linearity y = 1.1758x − 1.7527, and R2 = 0.9945 and y = 1.5022x + 0.8913, and R2 = 0.9853 for DTX and BA, respectively, at different dilutions from 10 mg/mL to 400 mg/mL were obtained (Figure 6C,D), (Supplementary Table S4 (A), Supplementary Table S4 (B)). RSD < 2.0 was discovered in intraday and interday variation, accuracy, and precision studies, which is fully recognized by the ICH criteria.
By using HPLC, the drug loading of NPs was determined. For DTX and BA, the estimated loading percentages of the drugs in NPs were 4.21 ± 0.23% and 11.21 ± 0.17%, respectively. The amount of formulation required for administration is determined by the drug loading in the distributing vehicle, which is a crucial consideration when evaluating the therapeutic potential of the drug delivery system. The encapsulation efficiencies of DTX and BA in nanoparticles were found to be 67.12 ± 1.5% and 92. 32 ± 1.4%, respectively, indicating that the approach is capable of producing nanoparticles with minimal material loss.

2.3.4. In Vitro Drug Release Study of DTX-BA-NPs

The pH level is crucial for administering a medication with anti-tumor properties. The pH level of tumors is often between 4 and 5. Thus, we conducted in vitro release research at pH 5 and pH 7 to gain an understanding of the release pattern in the context of a tumor [21].
DTX and BA release from DTX-BA-NPs were dialyzed against PBS at pH 7.4 and pH 5 at 37 °C to ascertain the impact of pH on these reactions. The drugs completely diffused during the first 3 h when free DTX and BA were dissolved under identical circumstances. Initially, DTX-BA-NPs released the drug in a burst, with roughly 16% and 20% of the drug released in 1.5 h for DTX and BA at pH 7.4 and 21% and 26% at pH 5, respectively. After that, the release was slower and reached a plateau value at pH 7.4 (24% and 29%) and pH 5 (37% and 42%) for DTX and BA, respectively (Figure 7), (Supplementary Table S5).

2.3.5. Release Kinetic

The best curve-fitting technique was used to determine the drug release kinetics. Subsequently, the kinetic models were fitted to the release profiles of DTX and BA from the formulation to determine the drug’s mechanism of release. R2 values were used to decide the best-fitting model. For PLGA NPs and all the considered release media, the best R2 values were procured for the Higuchi model. This indicates that NP release is mainly controlled by diffusion. The experimental data suited the Korsmeyer–Peppas and Peppas–Sahlin models very well, with R2 values > 0.95. In addition, “n” values associated with the release of NPs were lower than 0.45 compared to the pH of the release medium, thus indicating that the release mechanism is predominantly controlled by Fickian diffusion. For the same NPs, the ratio of |k1|/|k2| was far greater than 1, confirming that the release is controlled by Fickian diffusion. Table 1 and Table 2 show these findings.

2.3.6. Long-Term Stability Study

Since zeta potential primarily regulates the electrostatic repulsion between particles, the net surface charge density, or zeta potential, significantly influences the stability of NPs in suspension [22]. In every scenario, the DTX-BA-NPs’ zeta potential values ranged from −23.81 mV to −24.84 mV. The negative net charge that forms on the surface of NPs in pH conditions is responsible for these negative values (Figure 8, Table 3).

2.4. In Vitro Cytotoxicity Assay

Using the A549 cell line, the DTX-BA-NP therapeutic potential was examined. The MTT colorimetric test was used to evaluate the rate of cell growth in cells treated with varying doses of samples. The findings showed that, in comparison to DTX-NPs, BA-NPs, and free drugs (DTX and BA), the cytotoxicity of drugs in DTX-BA-NPs was significantly enhanced (Figure 9). In A549 cells, the IC50 values for DTX-BA-NPs, DTX-NPs, and BA-NPs were found (Table 4). The findings are presented as mean ± SEM. Combinatorial NPs showed a notably lower IC50 value than the other groups, suggesting that DTX-BA-NPs are more effective.
The calculated Combination Index (CI) values for DTX-BA-NPs at different time points are found to be 0.80, 0.75, and 0.30 for 24, 48, and 72 h, respectively, using Python code (Supplementary Materials). Since the CI values are less than 1 at all time points, this indicates a synergistic effect of the combination (DTX-BA-NPs) compared to the individual treatments (DTX-NPs and BA-NPs). The synergy appears to increase over time, with the strongest synergy observed at 72 h.

2.5. Detection of Cell Death by Dual Cell Staining

Under fluorescence microscopy, the control cells showed up as blue with no orange or red spots, suggesting that the cells were alive and in a good condition (Figure 10, panel ‘control’). After 12 h of treatment with DTX-BA-NPs, a notable population of cells developed an orange nucleus on the outside. The number of orange cells increased as the treatment period increased to 24 h, and some cells became scarlet, signifying cell death. Certain cells’ cytoplasms showed noticeable orange patches upon high magnification, indicating the creation of acidic vacuoles. The quantity of apoptotic cells (from yellowish orange to orange) rose significantly after 48 h.

2.6. Cellular Uptake Study of FITC Labelled DTX-BA-NPs

FITC-labeled PLGA NPs were used in fluorescence microscopy to assess the in vitro cellular absorption of NPs. Fluorescence microscopy images of A549 cells after they were incubated with FITC-DTX-BA-NPs for 1, 4, and 8 h are shown in Figure 11A. FITC-DTX-BA-NPs were shown to accumulate in the cells at 1 h, with a higher concentration in the cytoplasm than the nucleus. The degree of green fluorescence in the vicinity of the cell nucleus after 8 h demonstrated the ability of NPs to enter the nucleus. Every image showed that NPs were endocytosed in A549 cells in a time-dependent manner.
Additionally, a strong increase in the median fluorescence intensity was seen in the flow cytometric analysis, indicating a corresponding increase in the intracellular uptake of FITC-DTX-BA-NPs (Figure 11B). The results of the flow cytometric and fluorescence analyses showed that FITC-DTX-BA-NPs were mostly endocytosed in A549 cells.

2.7. Apoptosis Detection and Cell Cycle Analysis

One key element in the prevention of cancer growth is the majority of chemotherapy drugs’ capacity to induce apoptosis. As a result, cellular apoptosis was also looked at in cells treated with DTX-BA-NPs. The Annexin V-FITC kit-stained cells’ flow cytometry analysis revealed a notably higher percentage of apoptotic cells in the cells treated with DTX-BA-NPs (Figure 12A). These findings validated the idea that DTX-BA-NPs can increase cancer cell cytotoxicity.
Cell death in a specific phase was seen at 0, 12, 24, and 48 h, and cell cycle analysis was monitored using a FITC single detector. Cell arrest occurs in the G2/M phase for both DTX and BA. Figure 12B shows us that at 0 h cells were in the G2 phase at a rate of 12.43%, rising progressively to 13.29%, 32.31%, and 43.90% after 12, 24, and 48 h, respectively. An extension of the treatment duration increased the G2/M ratio. This result suggested that, following DTX-BA-NPs therapy, cells are blocked in the interphase (G2), increasing the arrest of mitotic cell division. The primary means of obstruction at the cell cycle seems to be chromosomal vandalism, which is incapable of being redesigned and carried out to induce programmed cell death.

2.8. Molecular Docking Analysis

The molecular docking analysis can assist in predicting the binding orientations and affinities of DTX and BA for proteins and determine the binding potential of the drugs to the protein. The binding affinity is determined by the value of the docking score, with lower values for binding affinity indicating that a compound requires less energy to bind. In other words, compounds with lower scores have a higher potential to bind to the target receptor [23]. For DTX, the proteins Bcl-2 and PI3K have binding scores of −46.42 and −31.42 (−kcal/mol), respectively (Supplementary Table S6), while for Betulinic acid, the binding scores for Bcl-2 and PI3K are −88.20 and −24.95 (−kcal/mol), respectively. The binding conformation of the two ligands with both proteins and binding interactions showing the hydrophobic cloud is shown in Figure 13A–D.

3. Discussion

One of the significant challenges in the scientific community is developing safe and effective anticancer drugs. Nanotherapeutics can minimize the cytotoxic effects of these drugs on healthy cells. Recently, polymer-based nanoscale drug delivery systems (DDSs) have gained attention for their ability to maximize efficacy by minimizing drug degradation, reducing side effects through sustained release within a threshold concentration, and enabling targeted action due to their preferential uptake and retention in cancer cells [24,25].
In this study, combining DTX and BA in a single encapsulated formulation for lung cancer treatment can enhance therapeutic outcomes. DTX is a potent chemotherapeutic agent, while betulinic acid possesses anti-cancer and anti-inflammatory properties along with antioxidant properties. Encapsulation improves bioavailability, reduces toxicity, and ensures targeted delivery. This synergistic approach leverages the strengths of both compounds, potentially leading to more effective and less harmful lung cancer treatment [6,9,10]. Lyophilized PLGA-based DTX and BA nanoencapsulations were obtained using the double-emulsification solvent evaporation techniques. Before loading the drug into the NPs, optimization was performed based on 23 designs using Design Expert version 10. Blank NPs were optimized based on the dependent variable (PVA concentration % (w/v) = A, sonication time (min) = B, and ultrasonic frequency (Hz) = C) to obtain the desired results of Y1 = size and Y2 = PDI. As per polynomial analysis and the 2FI process order, optimized values of A, B, and C were determined. Formulations with the drug were prepared using the optimized values of A, B, and C (0.1% PVA w/
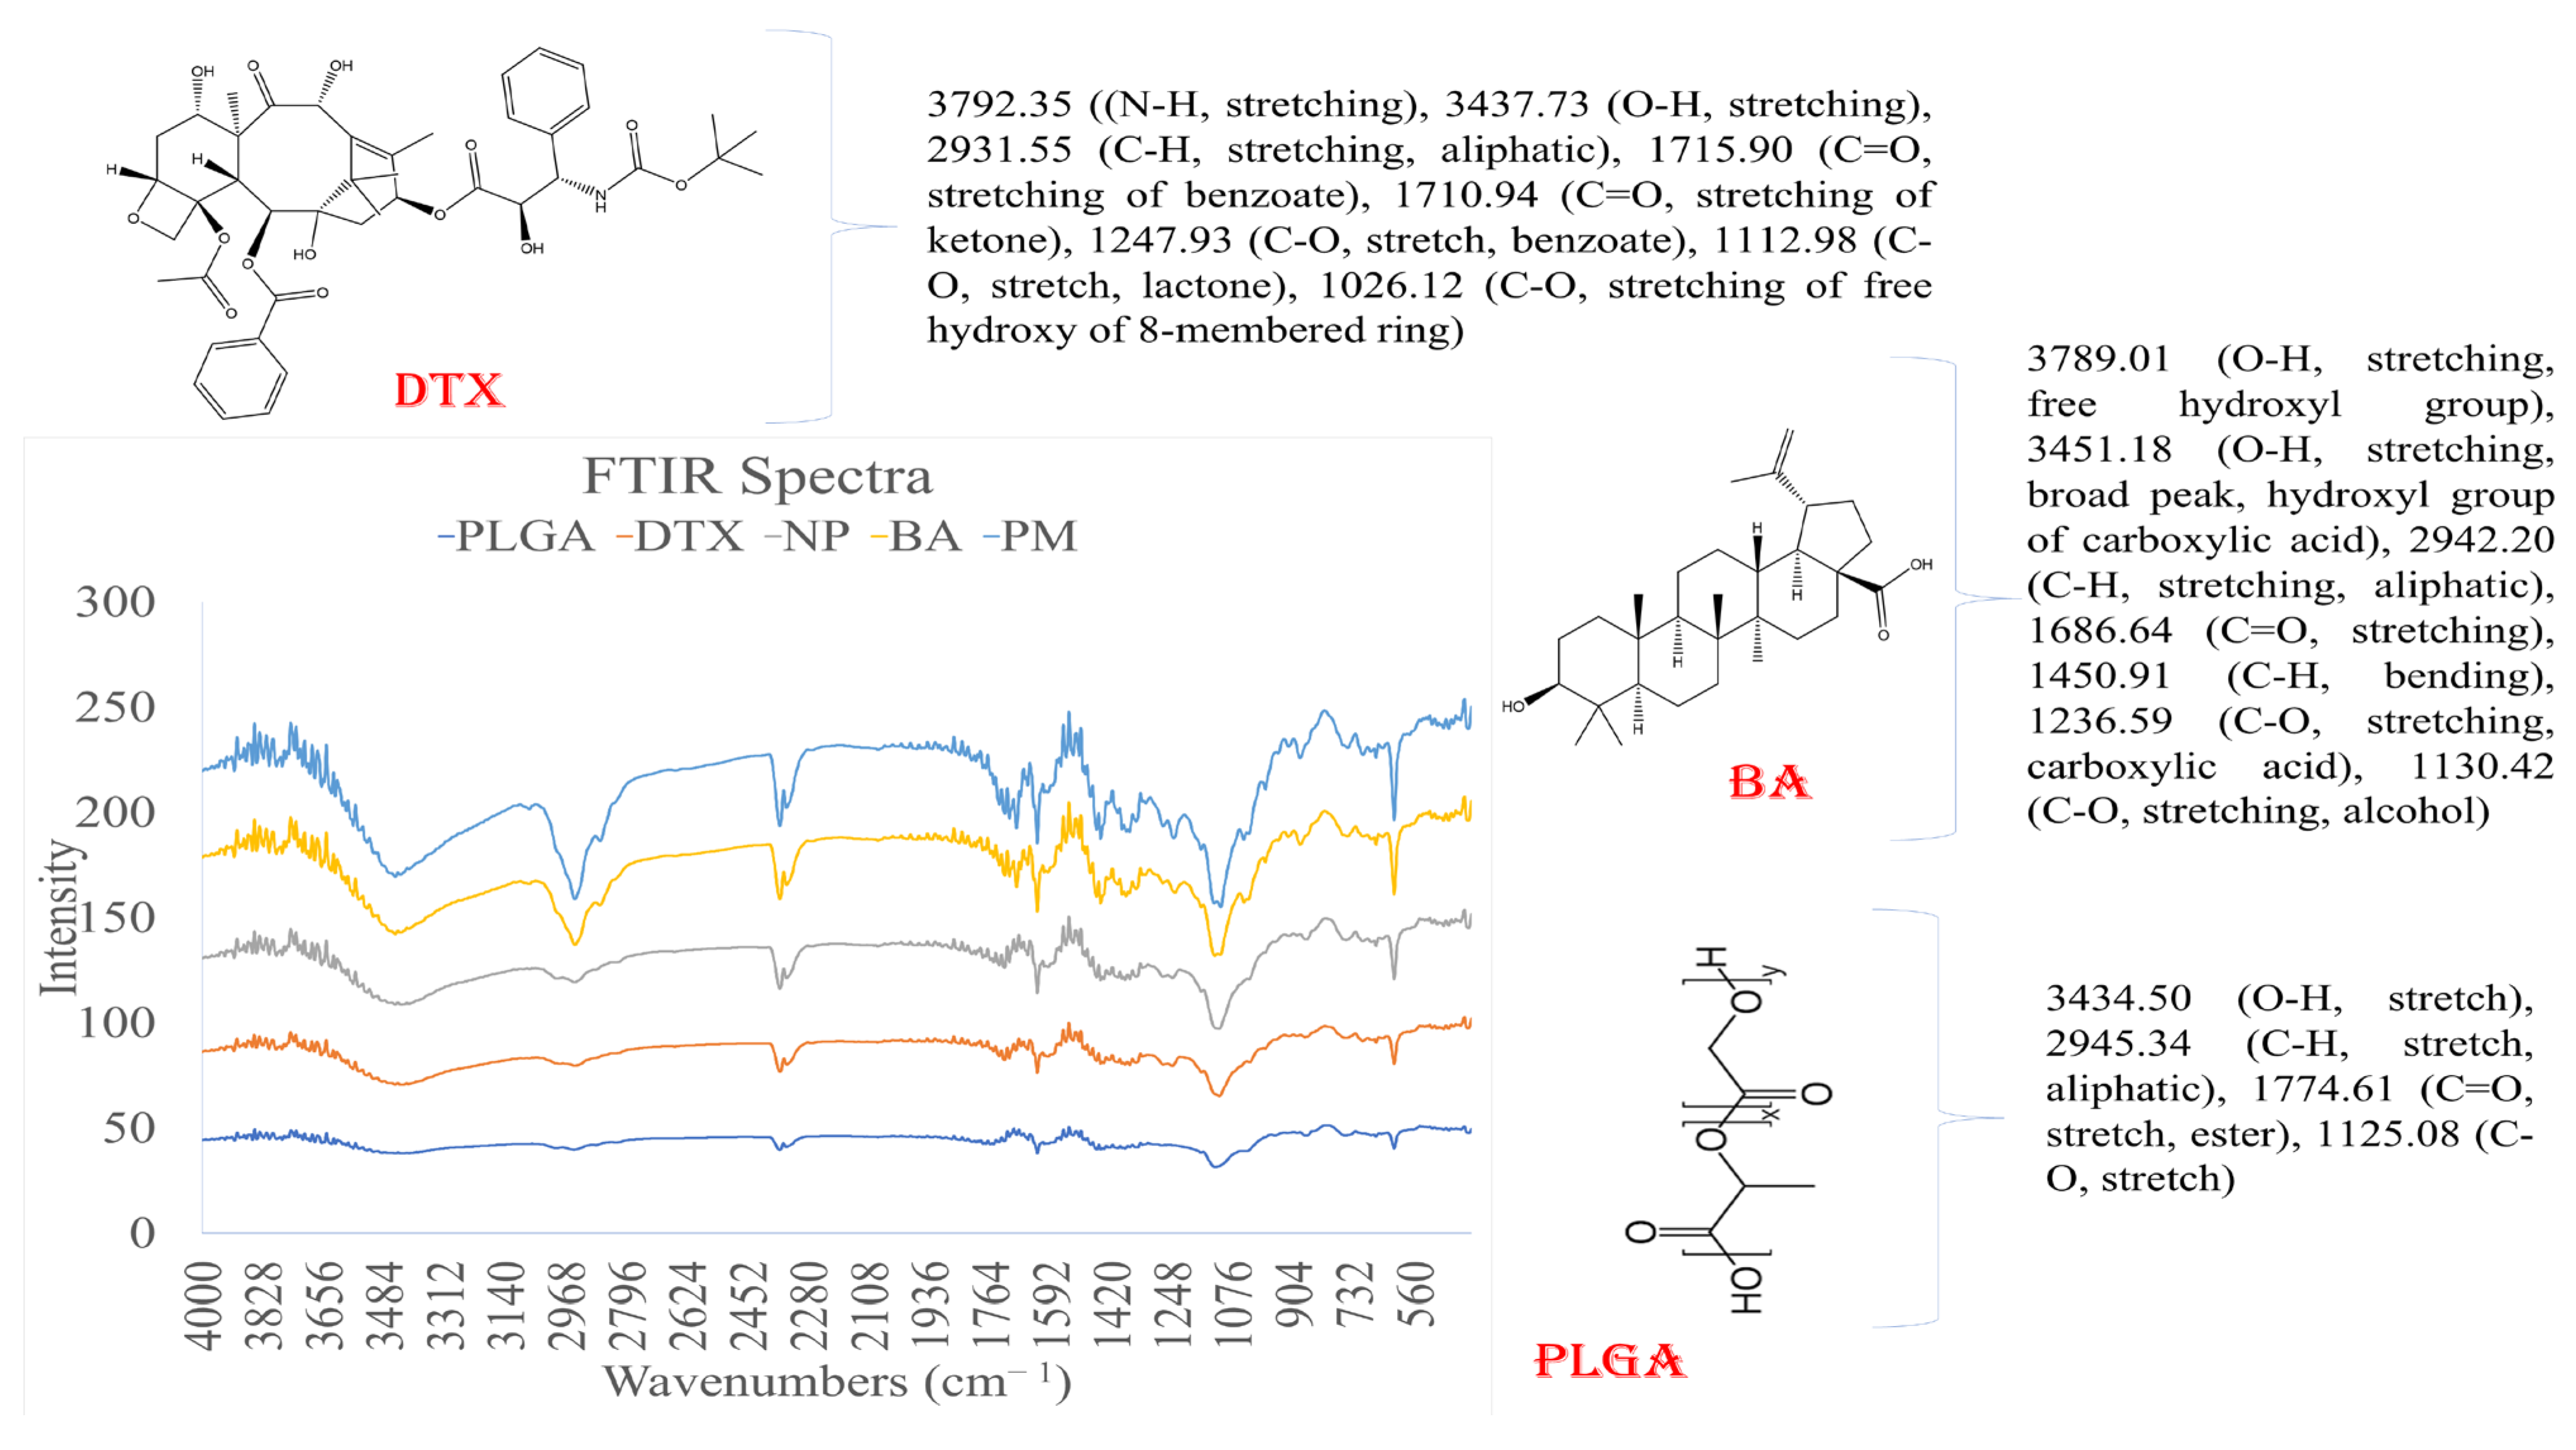
v, 11.45 min, and 50 Hz) for further studies. The slight shifting of non-characteristic peaks of DTX and BA in the drug-loaded formulation (DTX-BA-NPs) can be attributed to weak hydrogen bonds and electrical attractions, such as dipole moments and van der Waals forces. These interactions may prevent the crystallization of DTX and BA within the formulation, maintaining it in an amorphous state, which can lead to sustained drug release and prolonged bioavailability of DTX and BA from DTX-BA-NP. Nonetheless, the presence of all characteristic peaks of DTX-BA in DTX-BA-NP indicates that DTX and BA retain their chemical integrity within the formulation, essential for maintaining their biological activity upon release from the NPs.
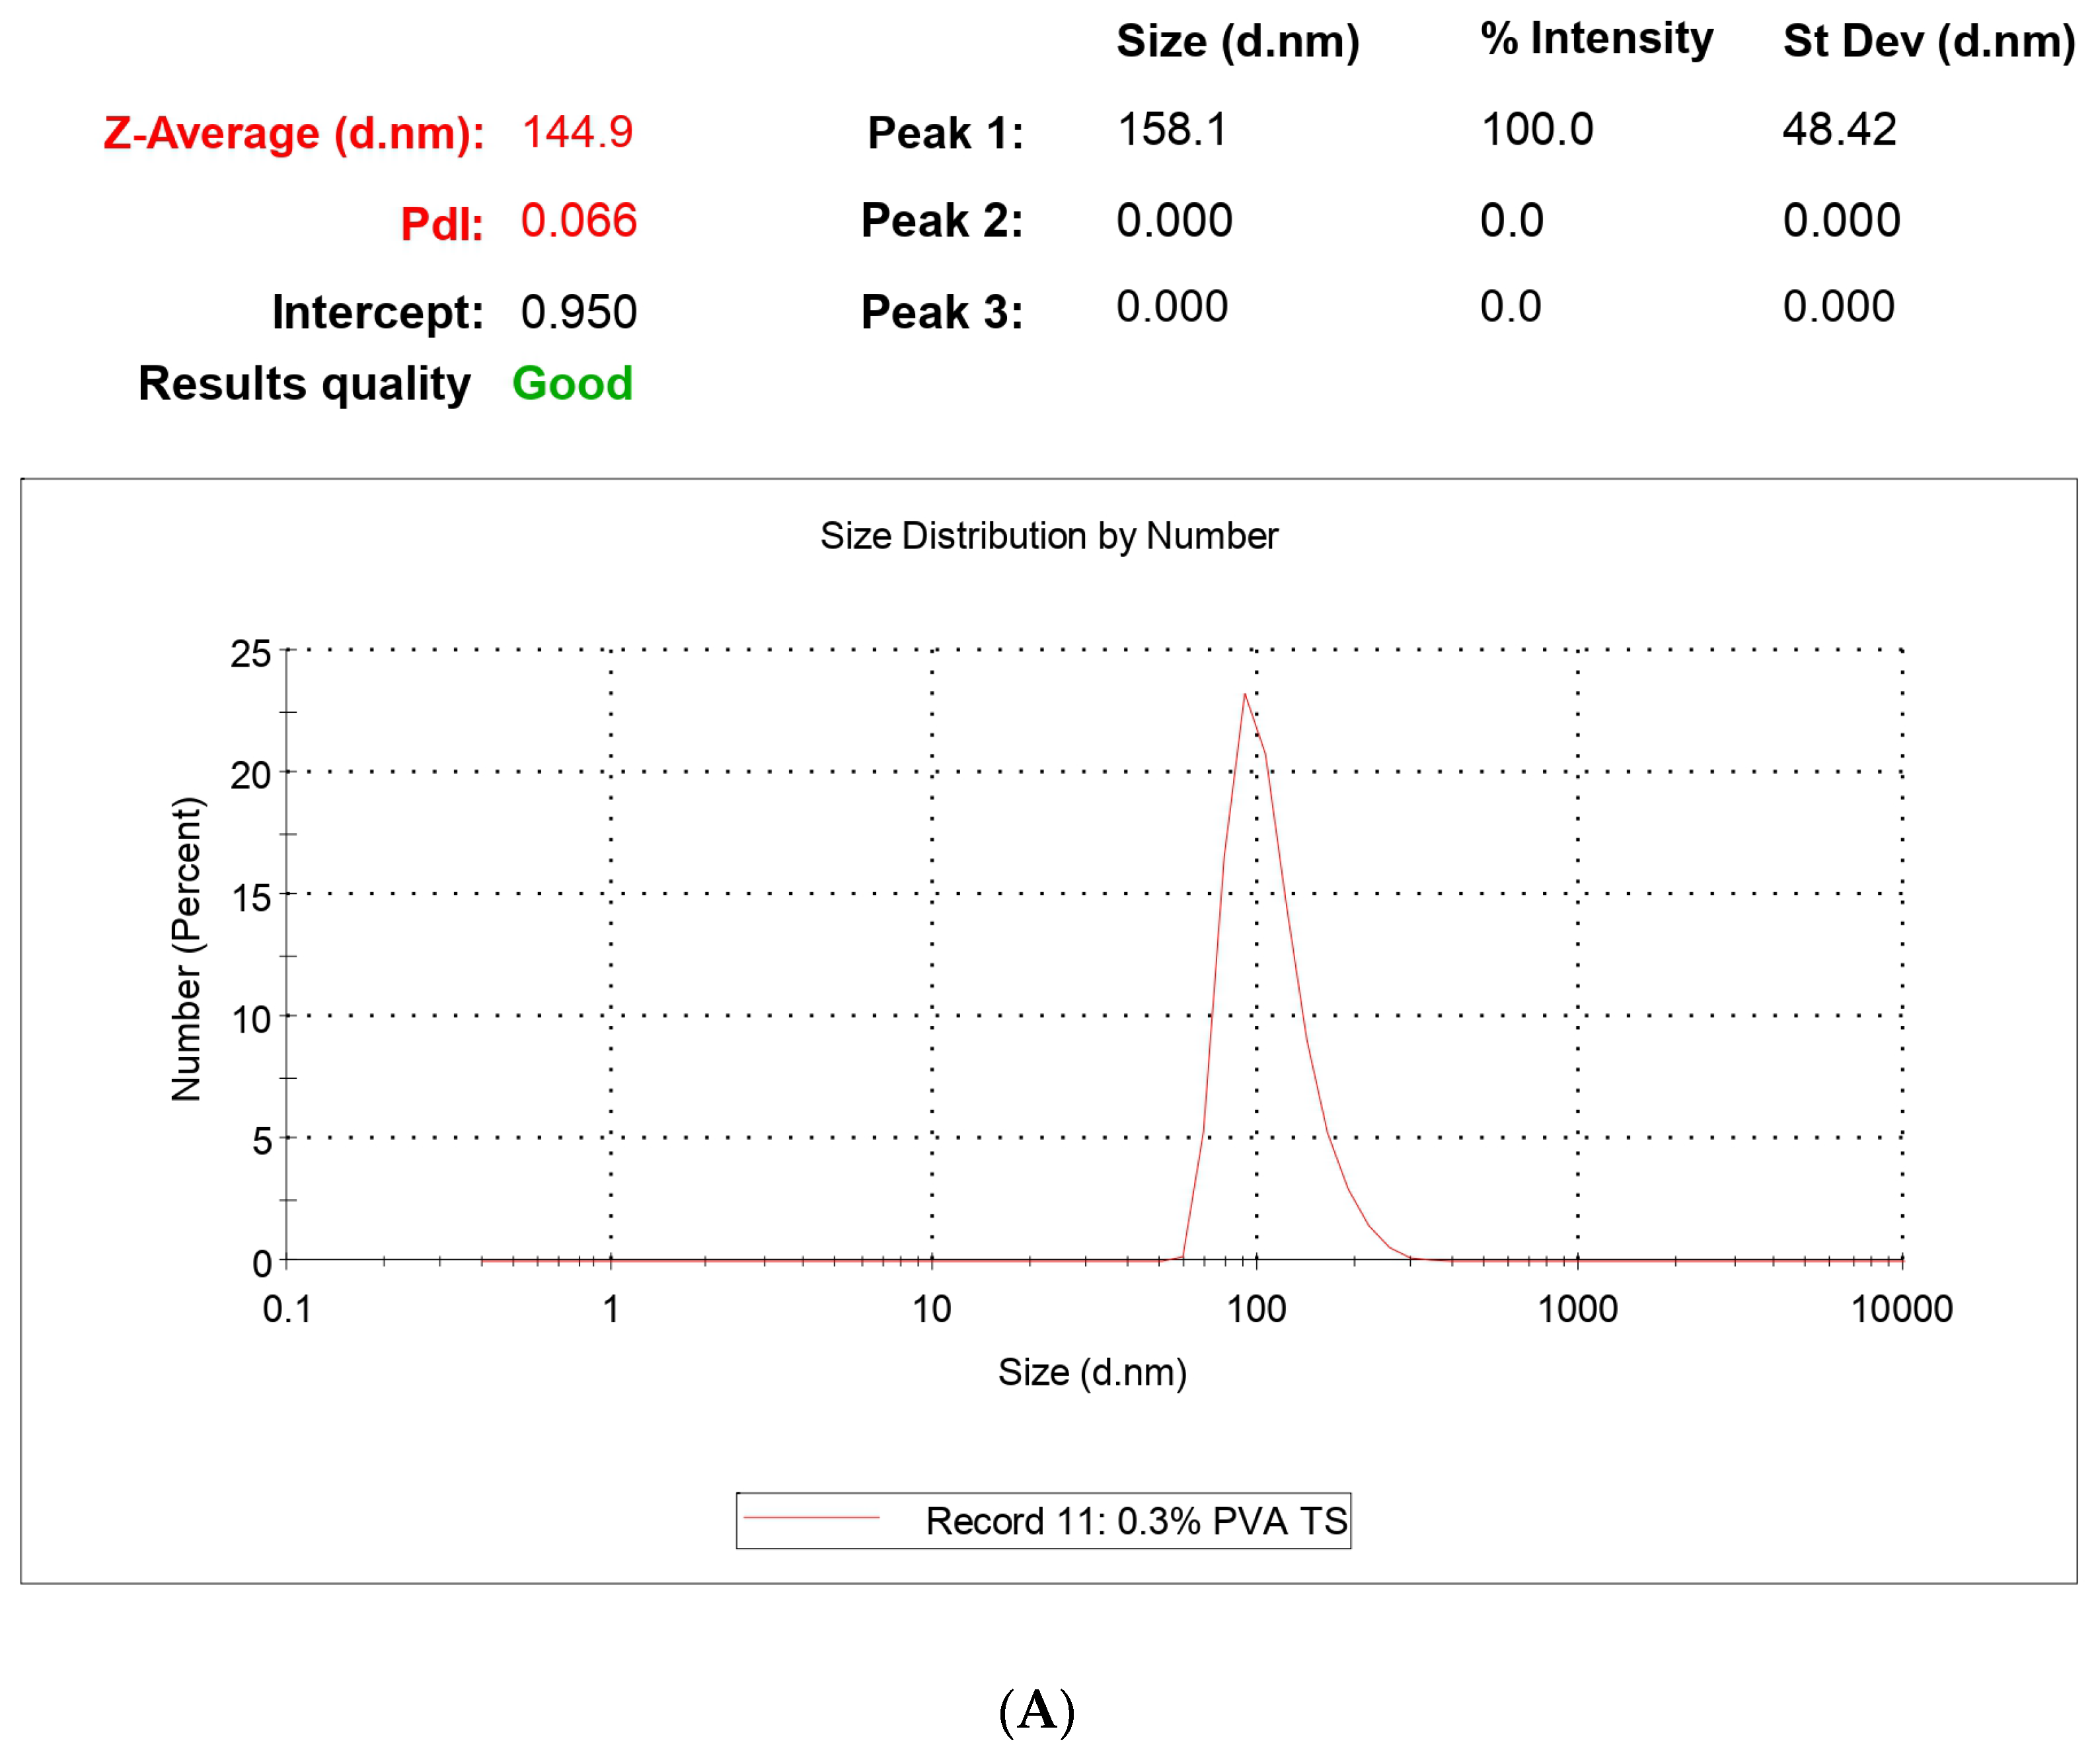
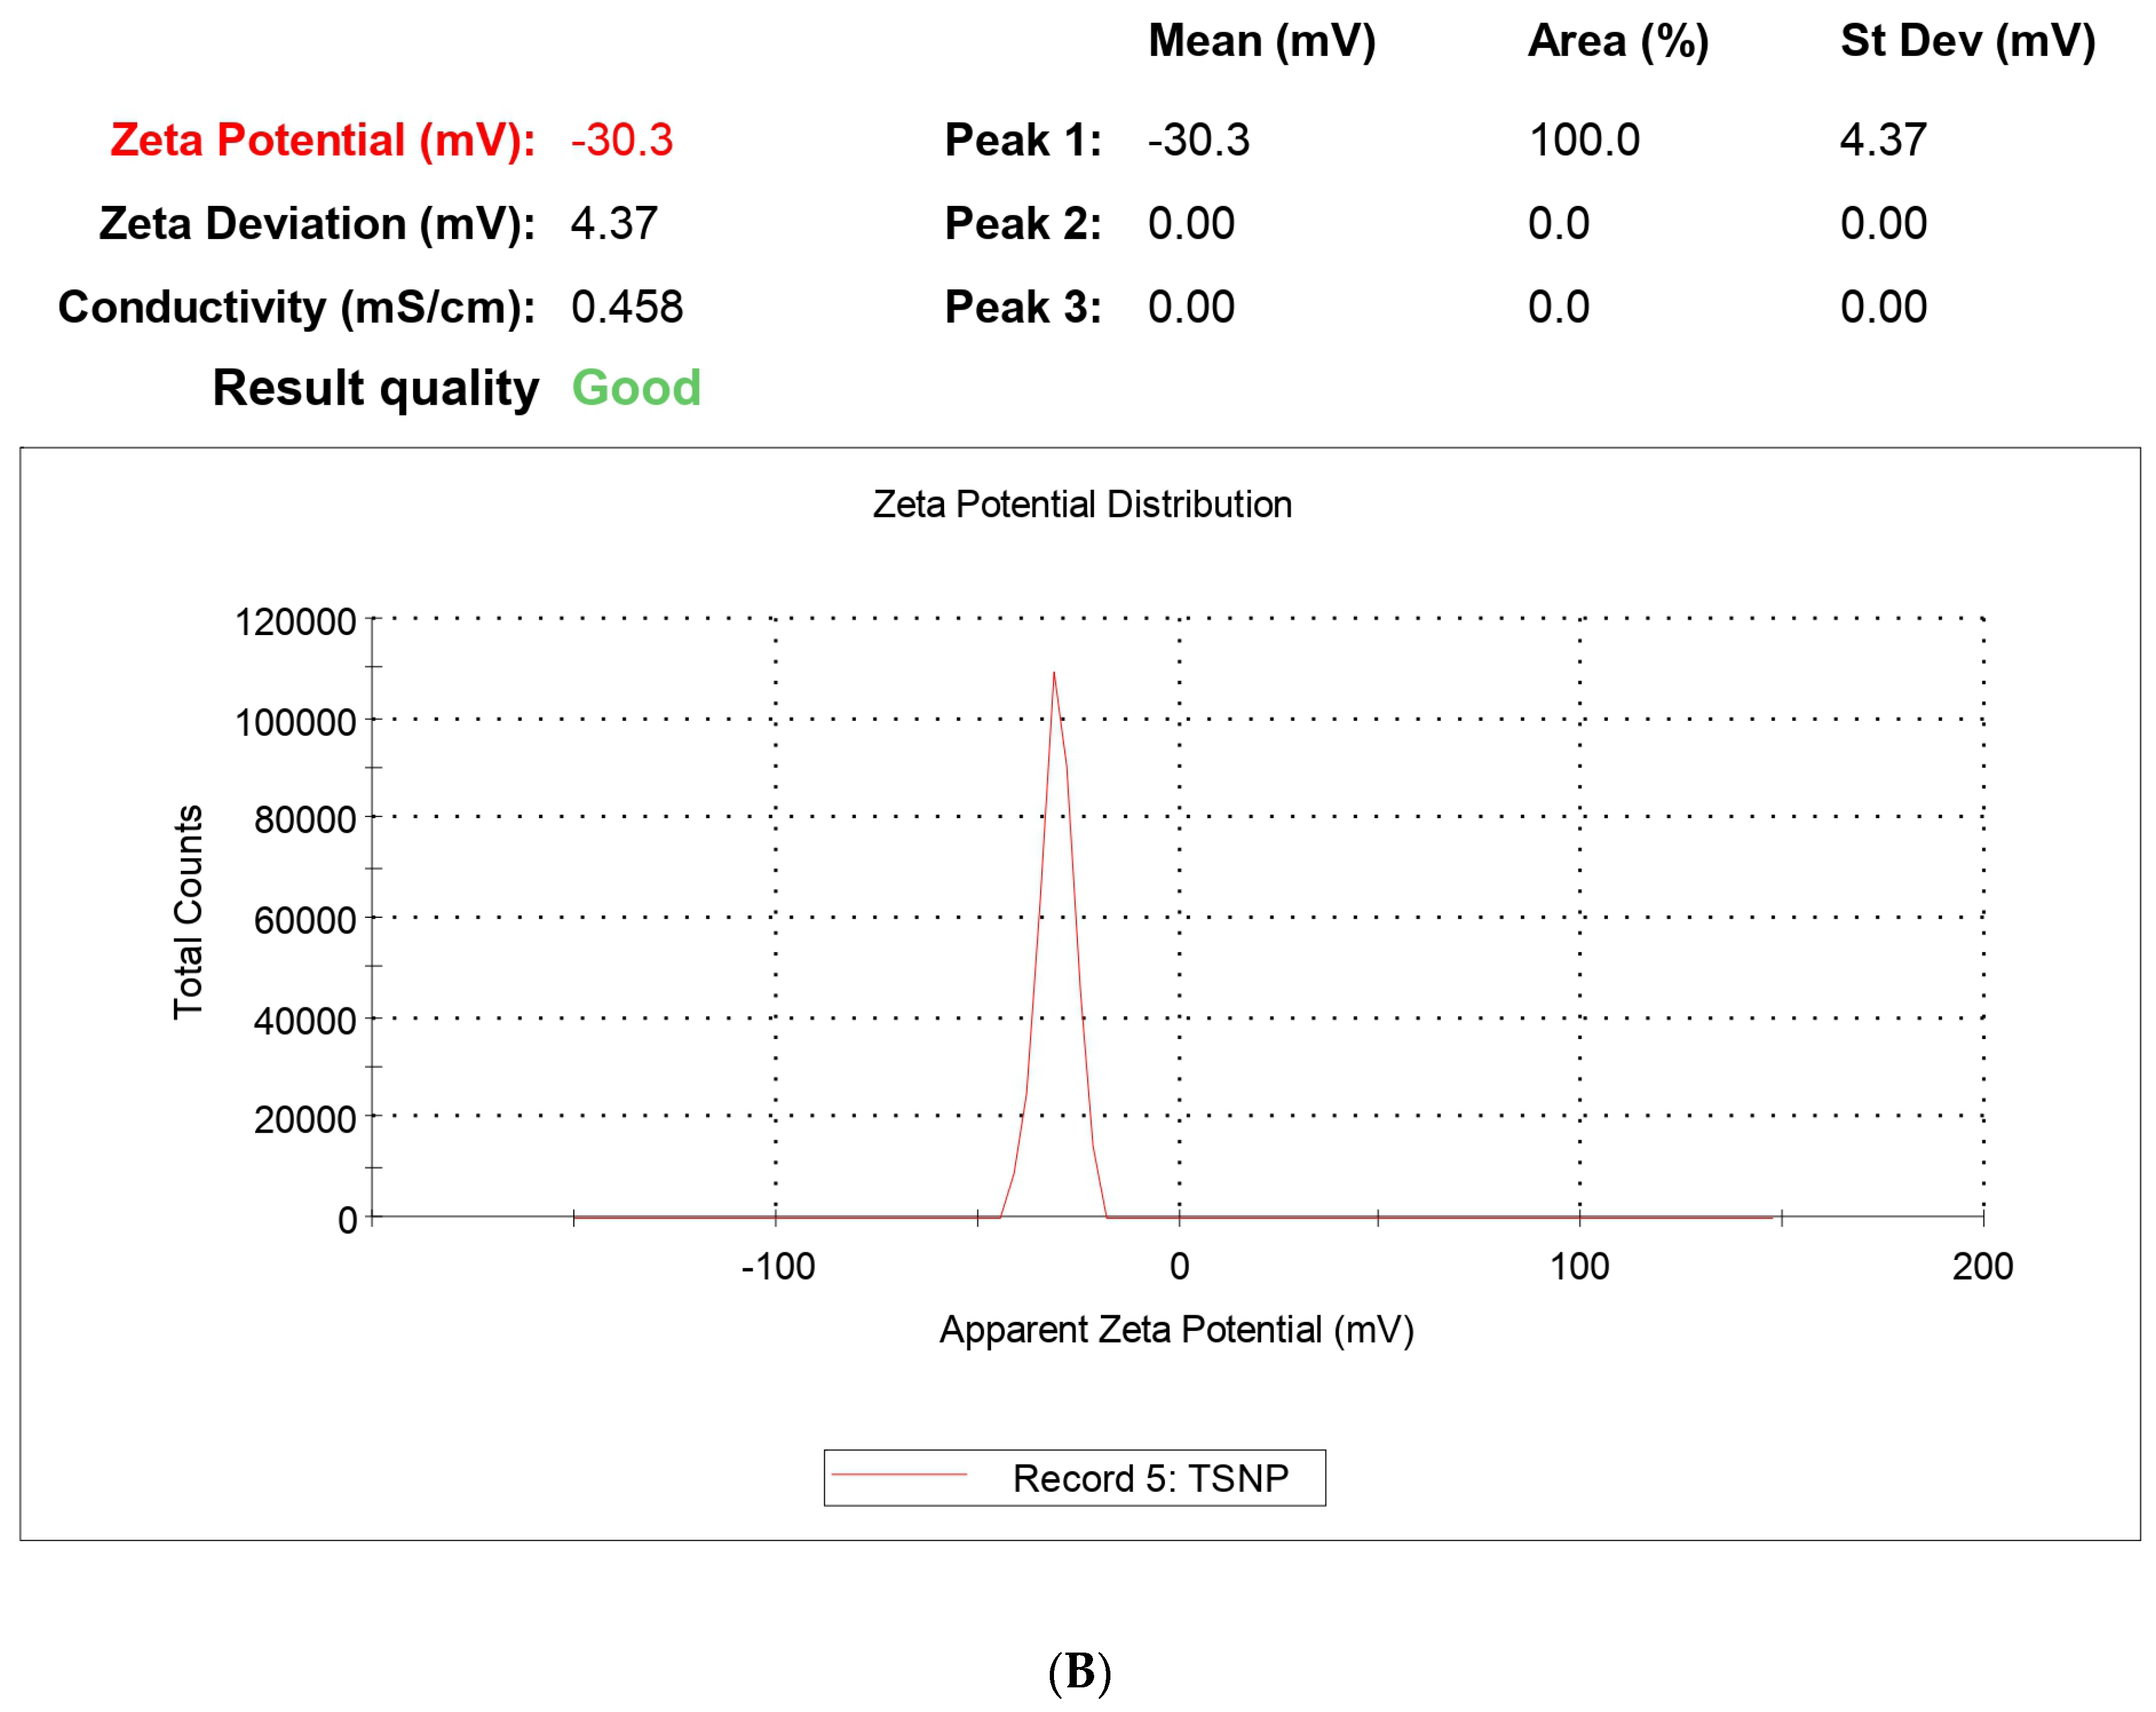
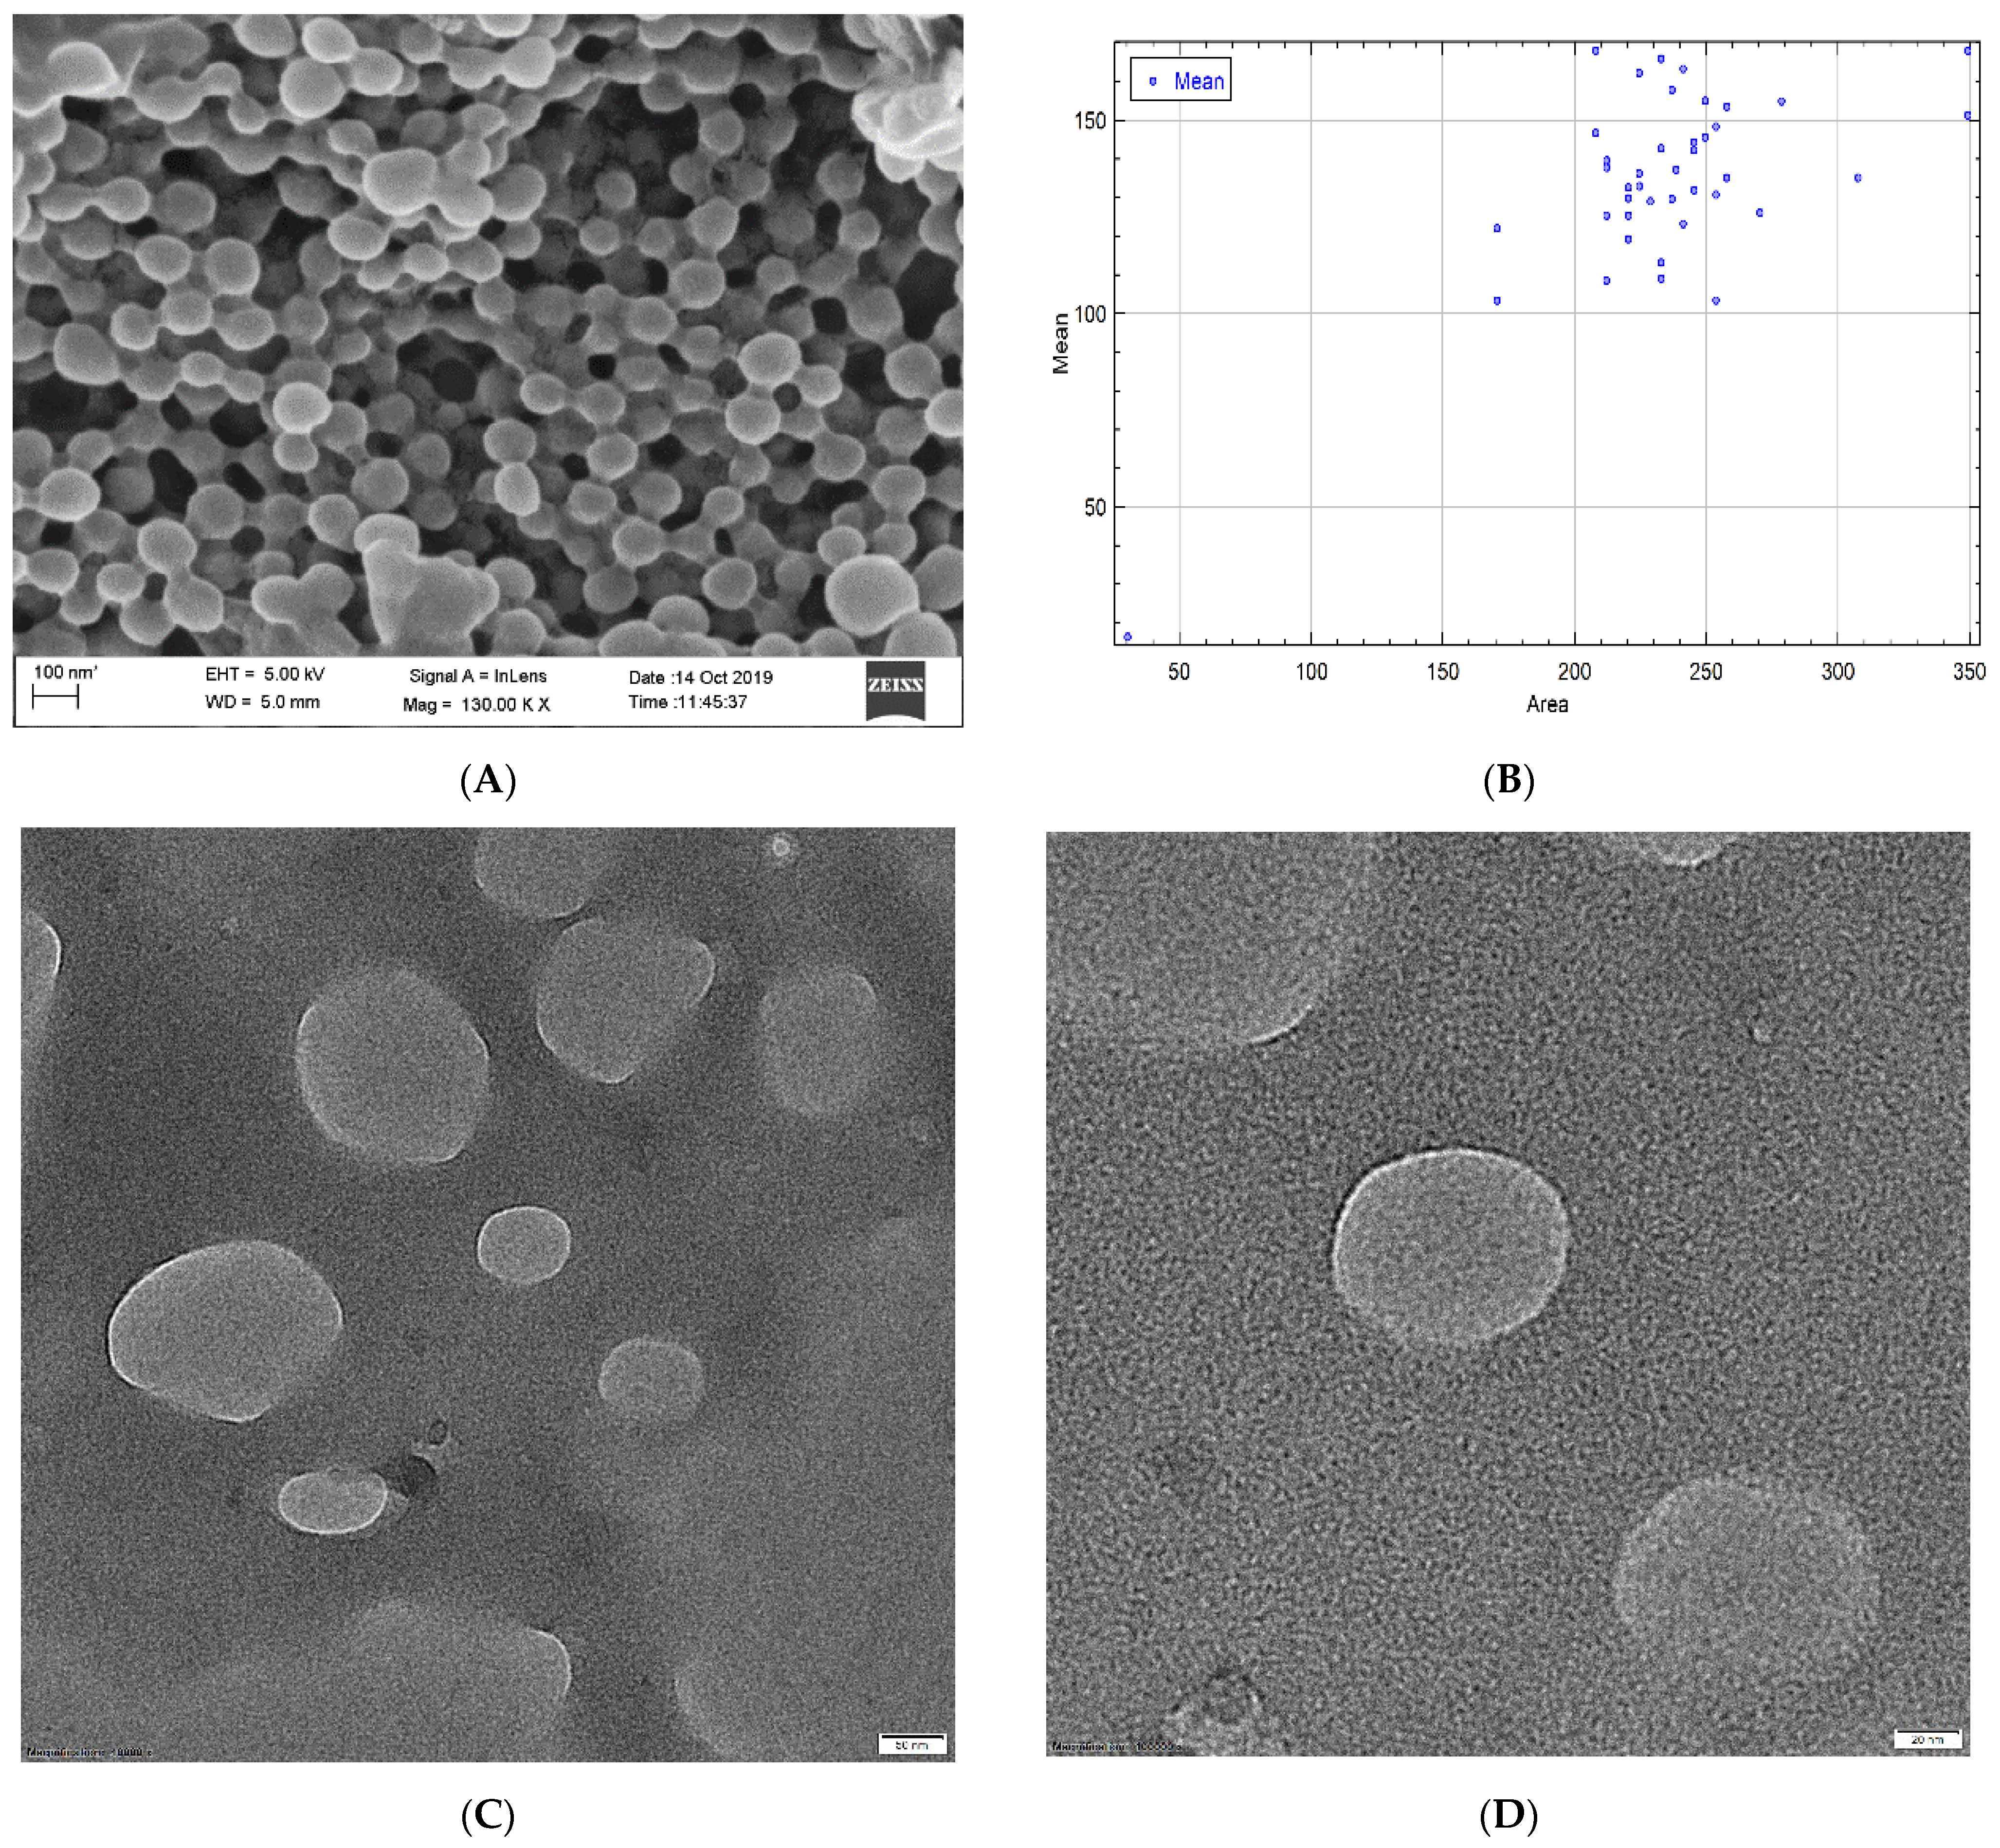
Surface morphology plays the most vital part in drug uptake by cells or organs due to the interaction with the biological membrane upon exposure to the biological system. Morphological analysis was performed using FESEM and HRTEM. The size of the NPs ranged between 59 and 220 nm, which fulfills the criteria for targeted nanoencapsulation. Morphological analysis was comparable to the size analysis with DLS as zeta size values ranged between 129 and 212 nm. The polydispersity index ranged from 0.011 to 0.357 for the NPs, confirming no aggregation in the formulation. PLGA contains the negative -COOH group and, for that, zeta potential has to have an average value of −27.8 ± 4.13 mv, which falls under the targeted −30 mv to +30 mv range. The potential values confirm that upon prolonged storage, NPs are prone to sedimentation and aggregation, so a lyophilized powder form is suitable for storage conditions and long-term stability. This study also confirms the stability of NPs with almost negligible changes in size and potential even after 3 months.
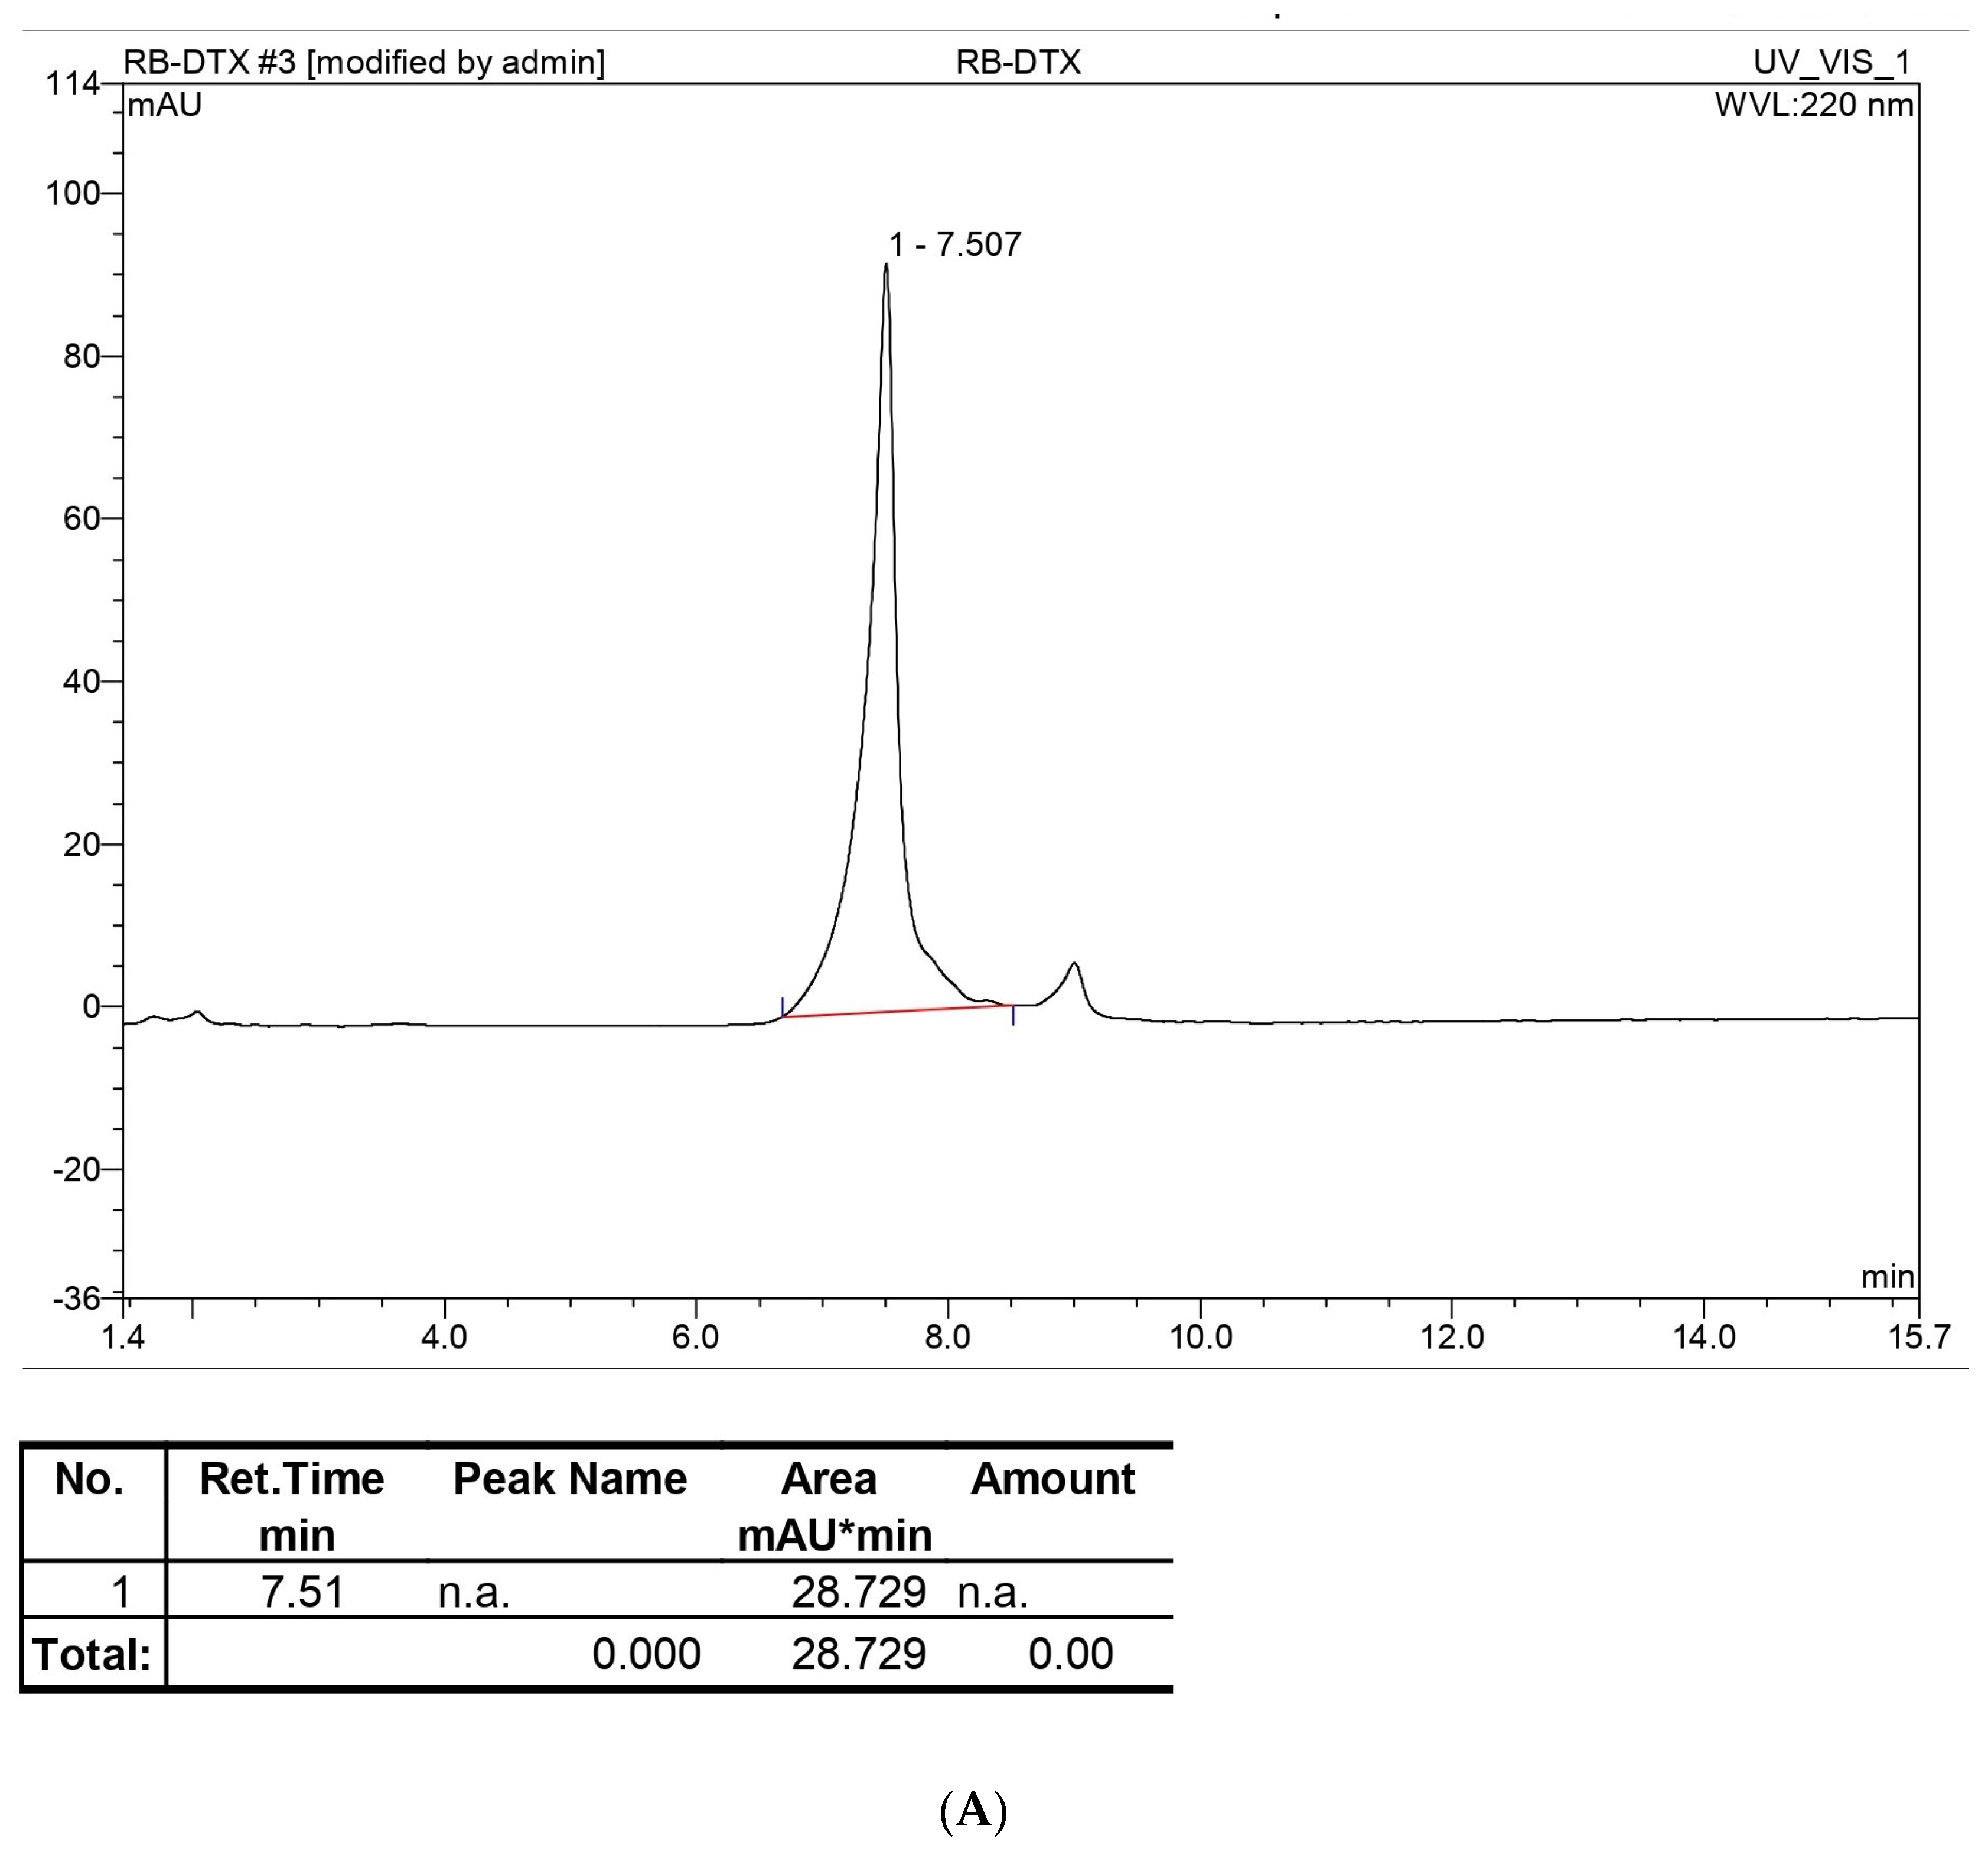
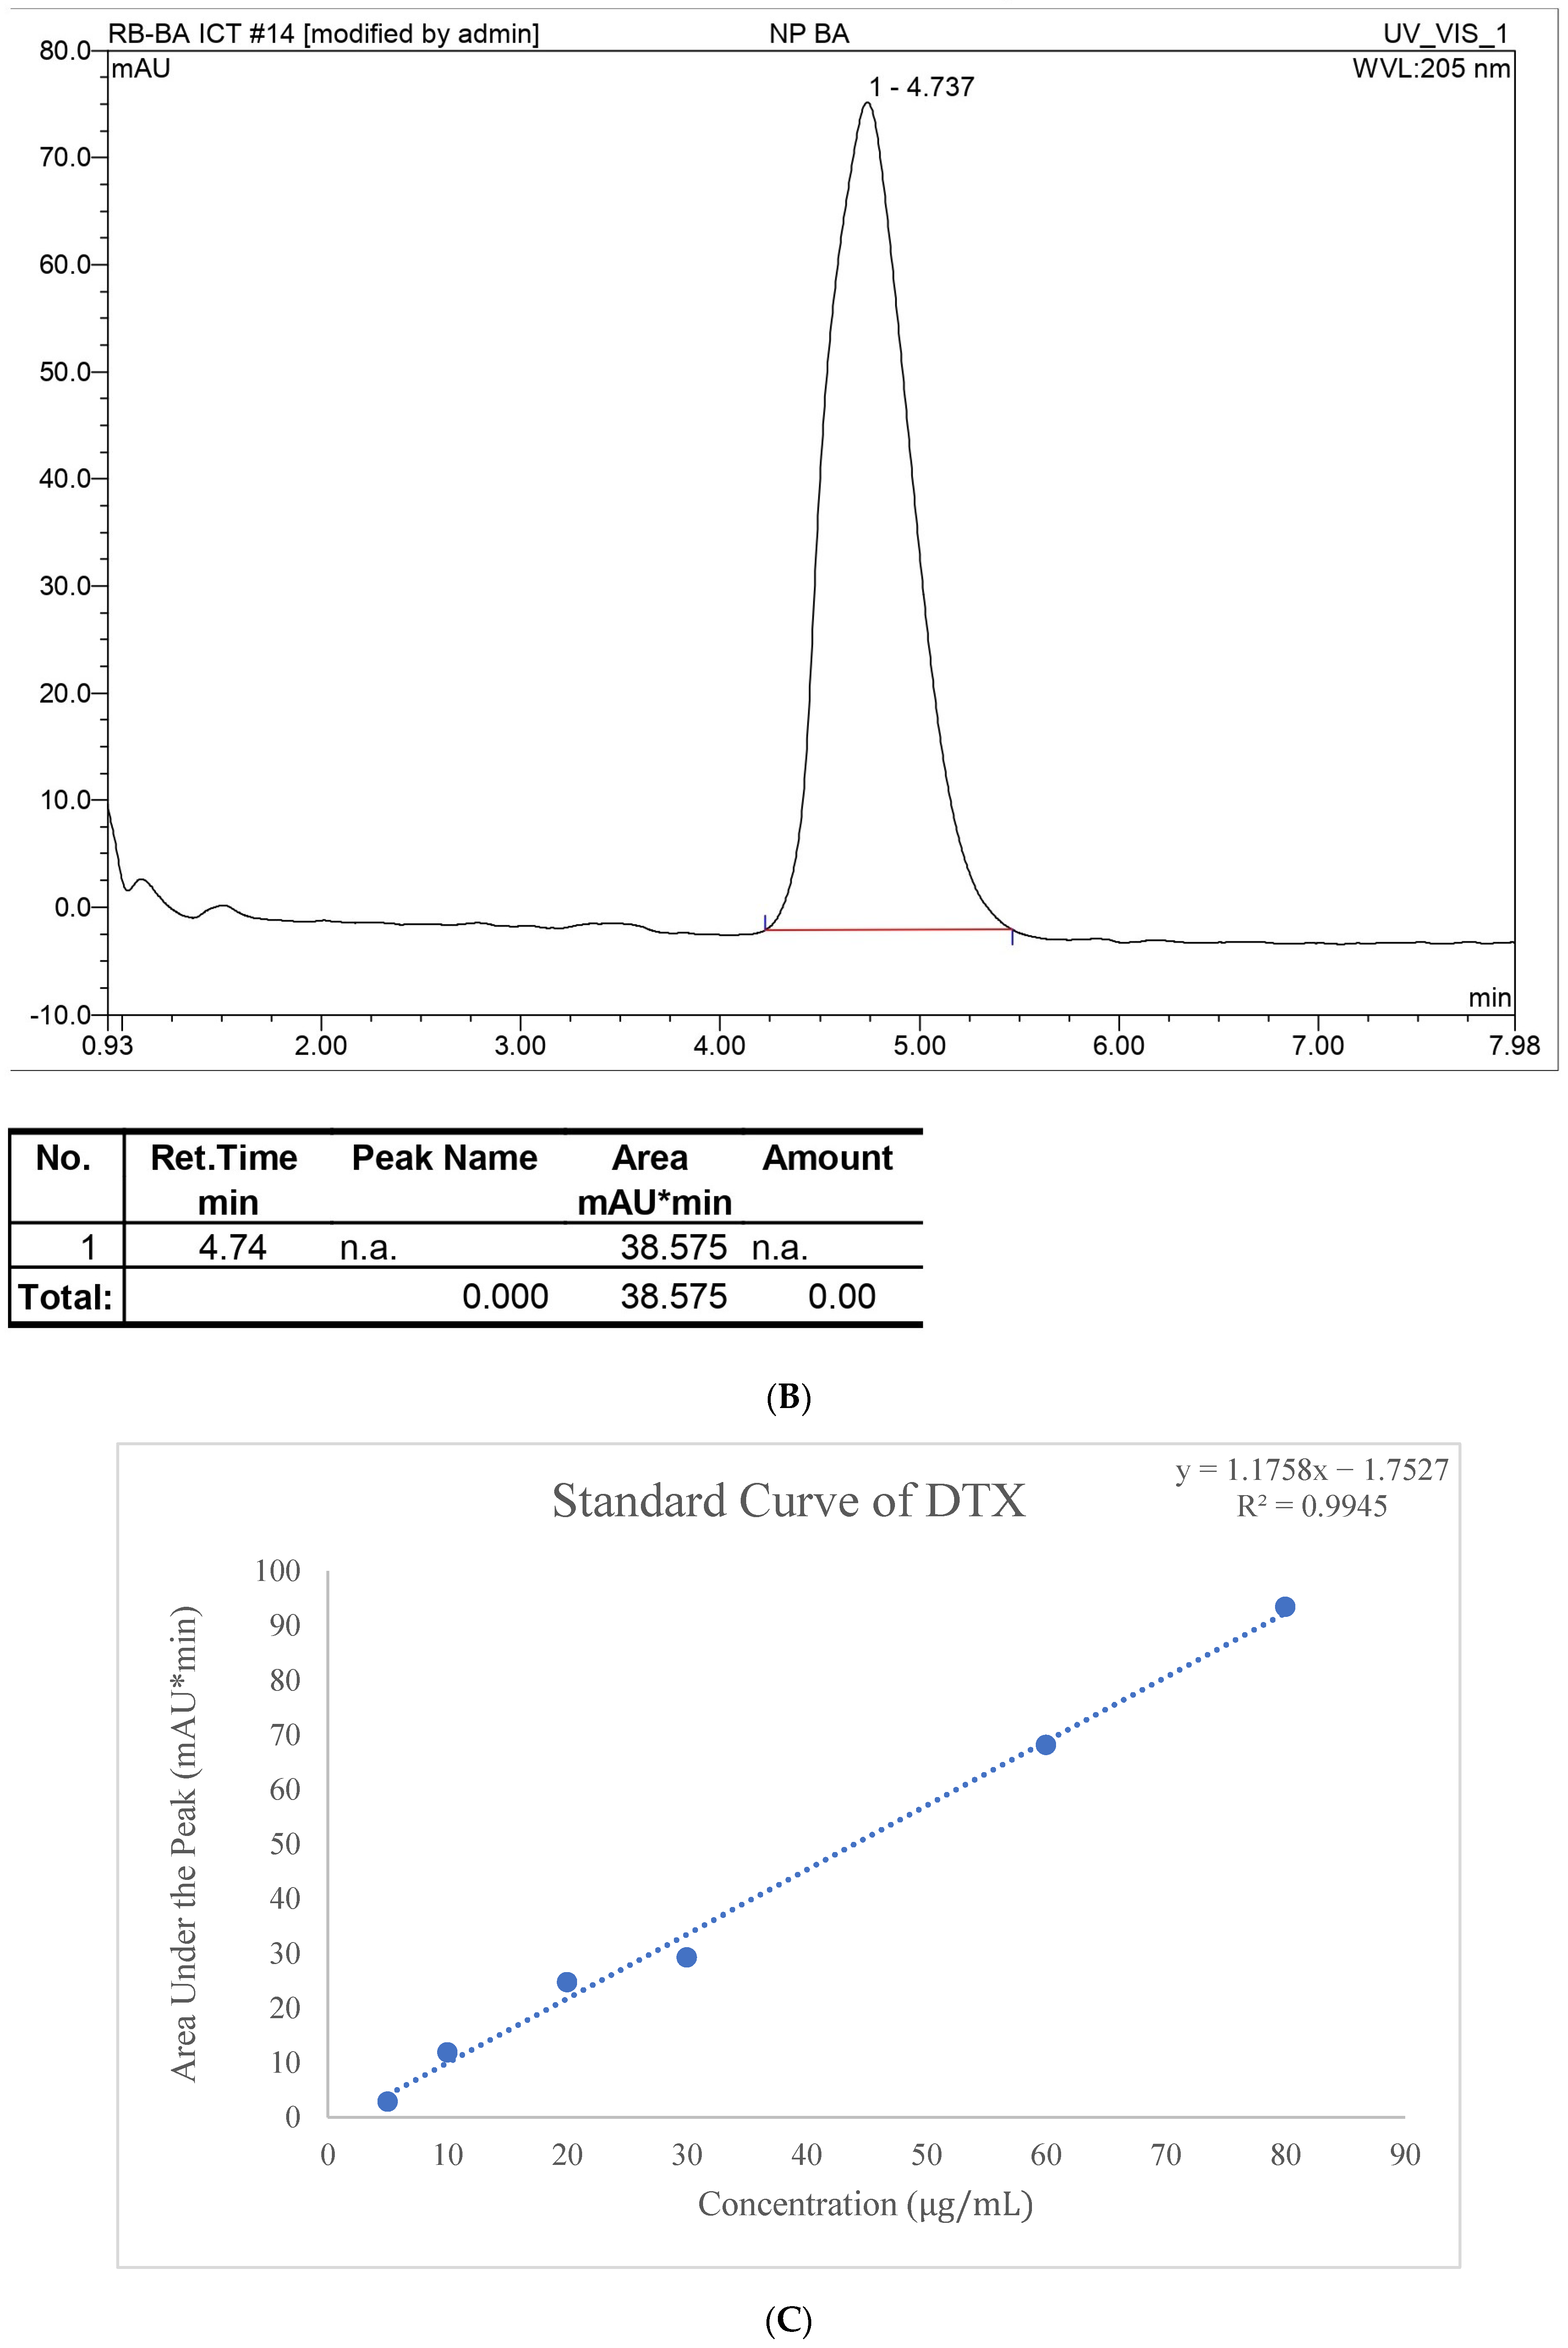
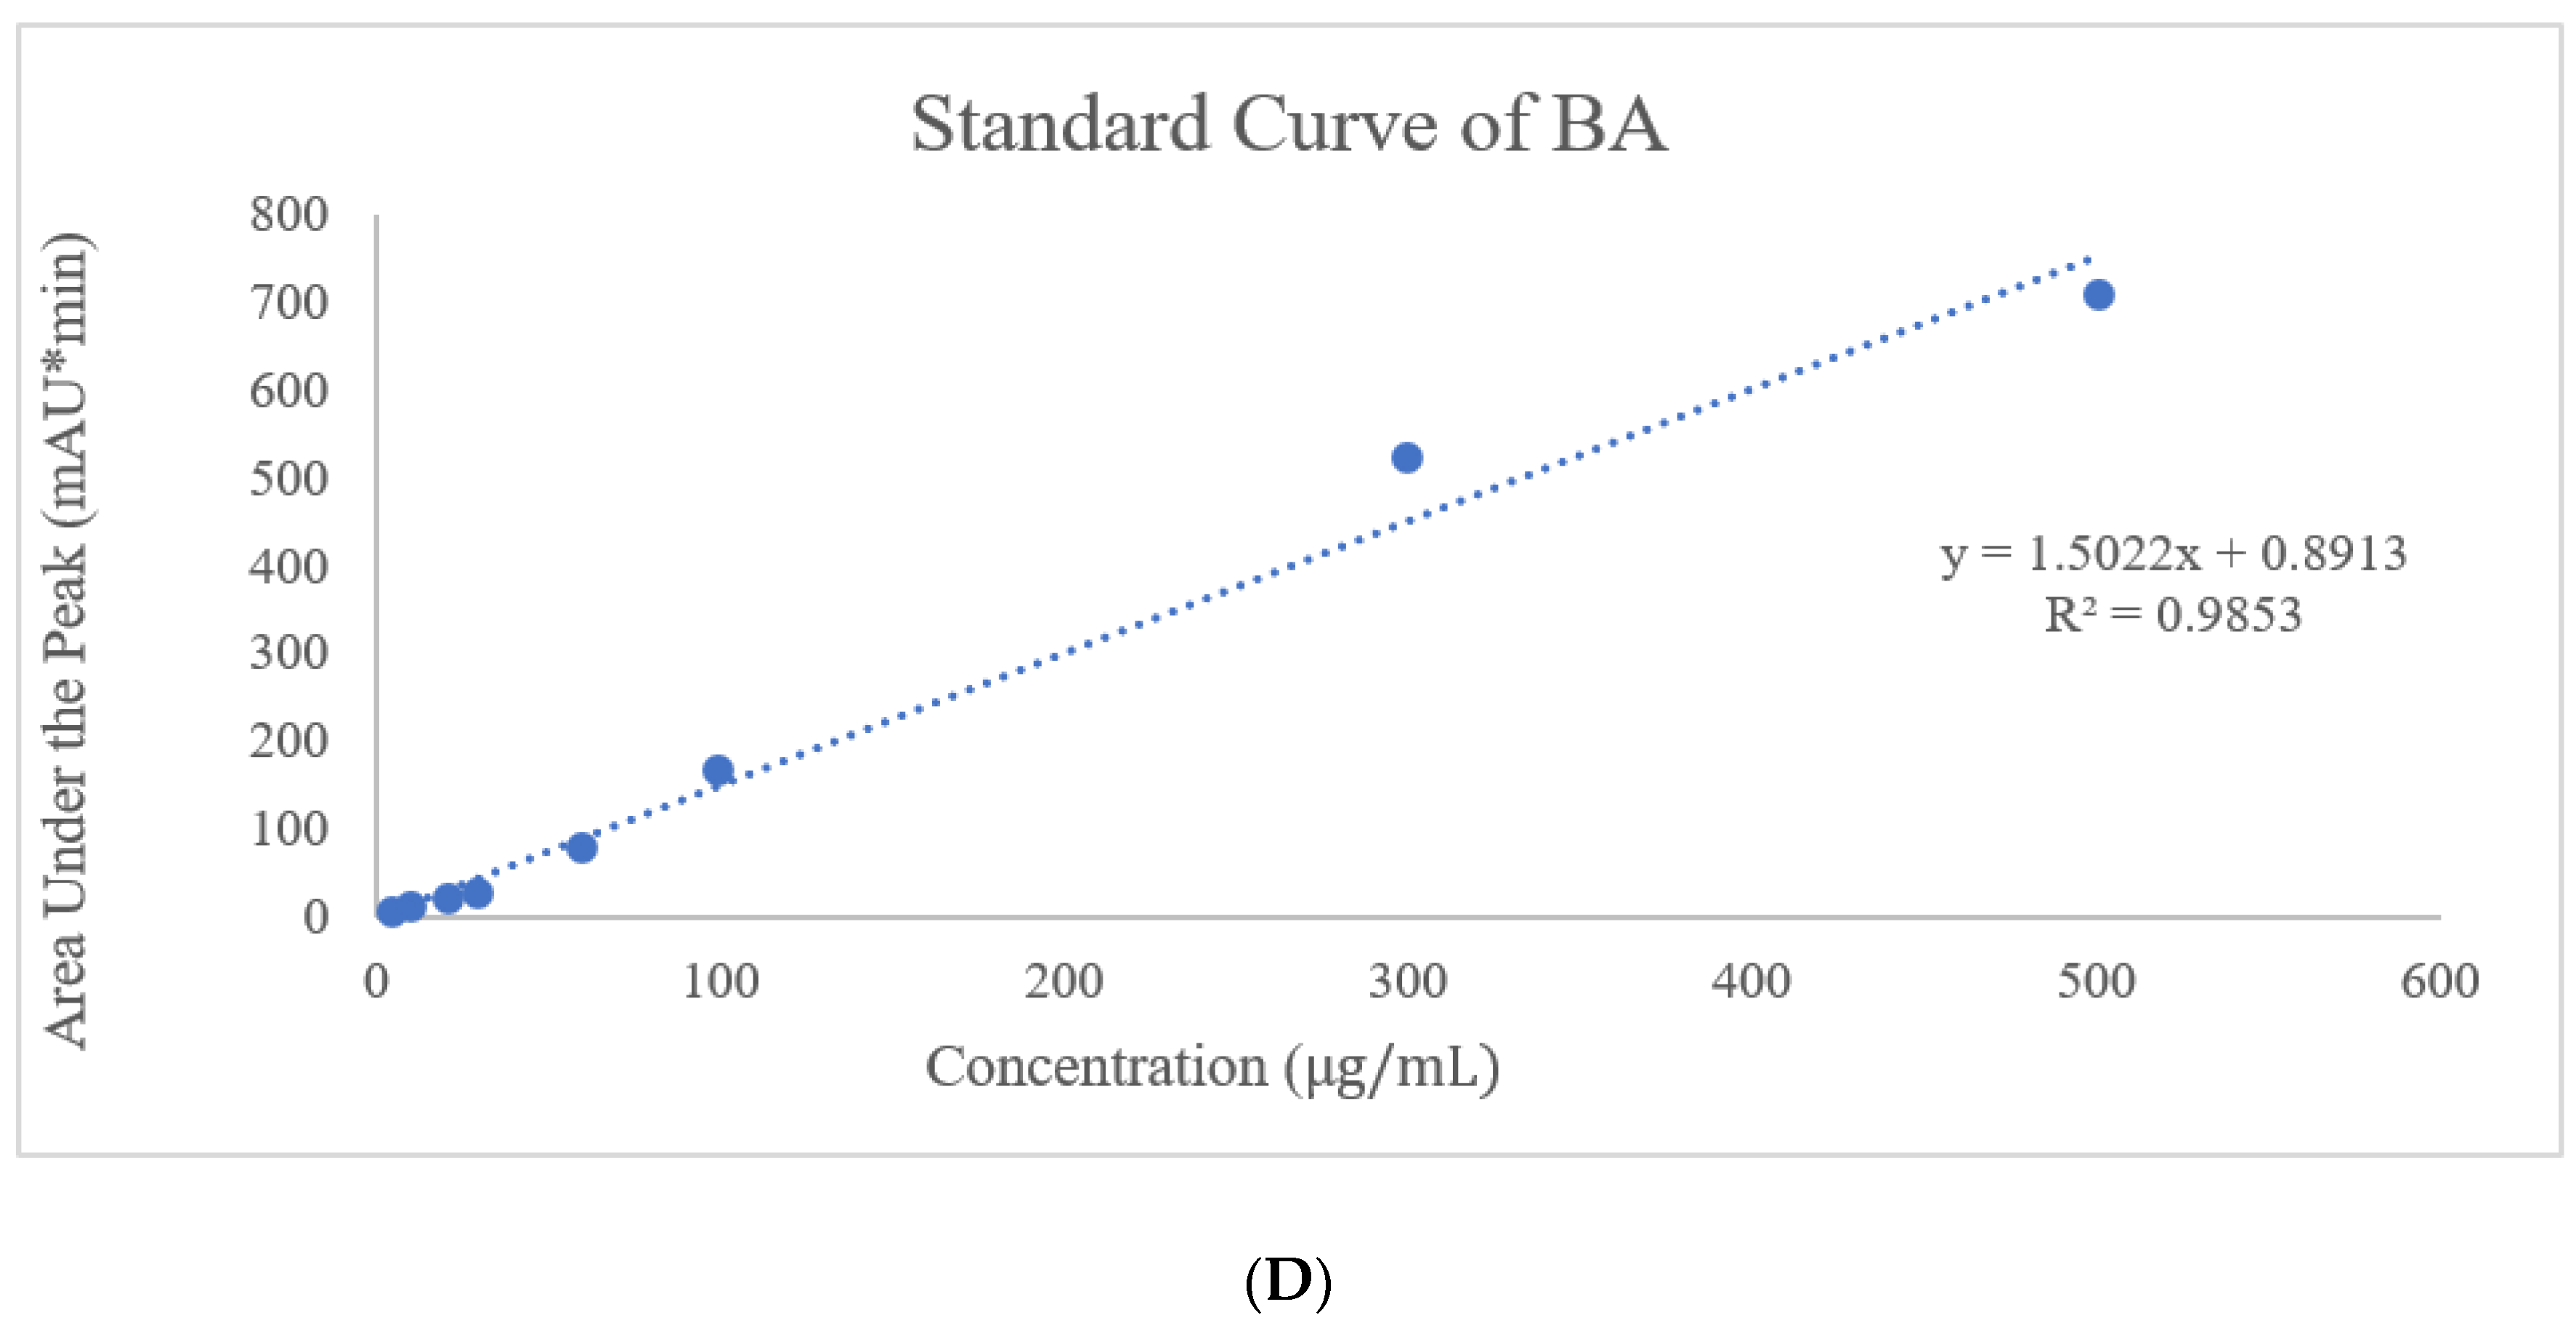
In the HPLC method, water and ACN were selected for the mobile phase at various ratios for the gradient system, and after further optimization, an isocratic system was developed at 45% ACN for DTX and 90% ACN for BA with a 1 mL/min flow rate. Along with the preparation of the standard curve with a range of 400, 200, 100, 80, 60, 40, 20, and 10 µg/mL, precession, accuracy, intraday, and interday analyses were performed. This method was used for entrapment and release behavior analysis, and those studies were perfectly suited for this method with LOD (Limit of detection) and LOQ (Limit of quantification) values of 3.072 µg/mL and 7.387 µg/mL, respectively, for DTX and 4.127 µg/mL and 7.527 µg/mL LOD and LOQ, respectively, for BA. The entrapment efficiency of DTX and BA was 67.12 ± 1.5% and 92. 32 ± 1.4%, respectively. The high entrapment of both drugs might be due to their lipophilic nature or the hydrogen bonding, hydrophobic interactions, and electrostatic interactions of the drugs [26].
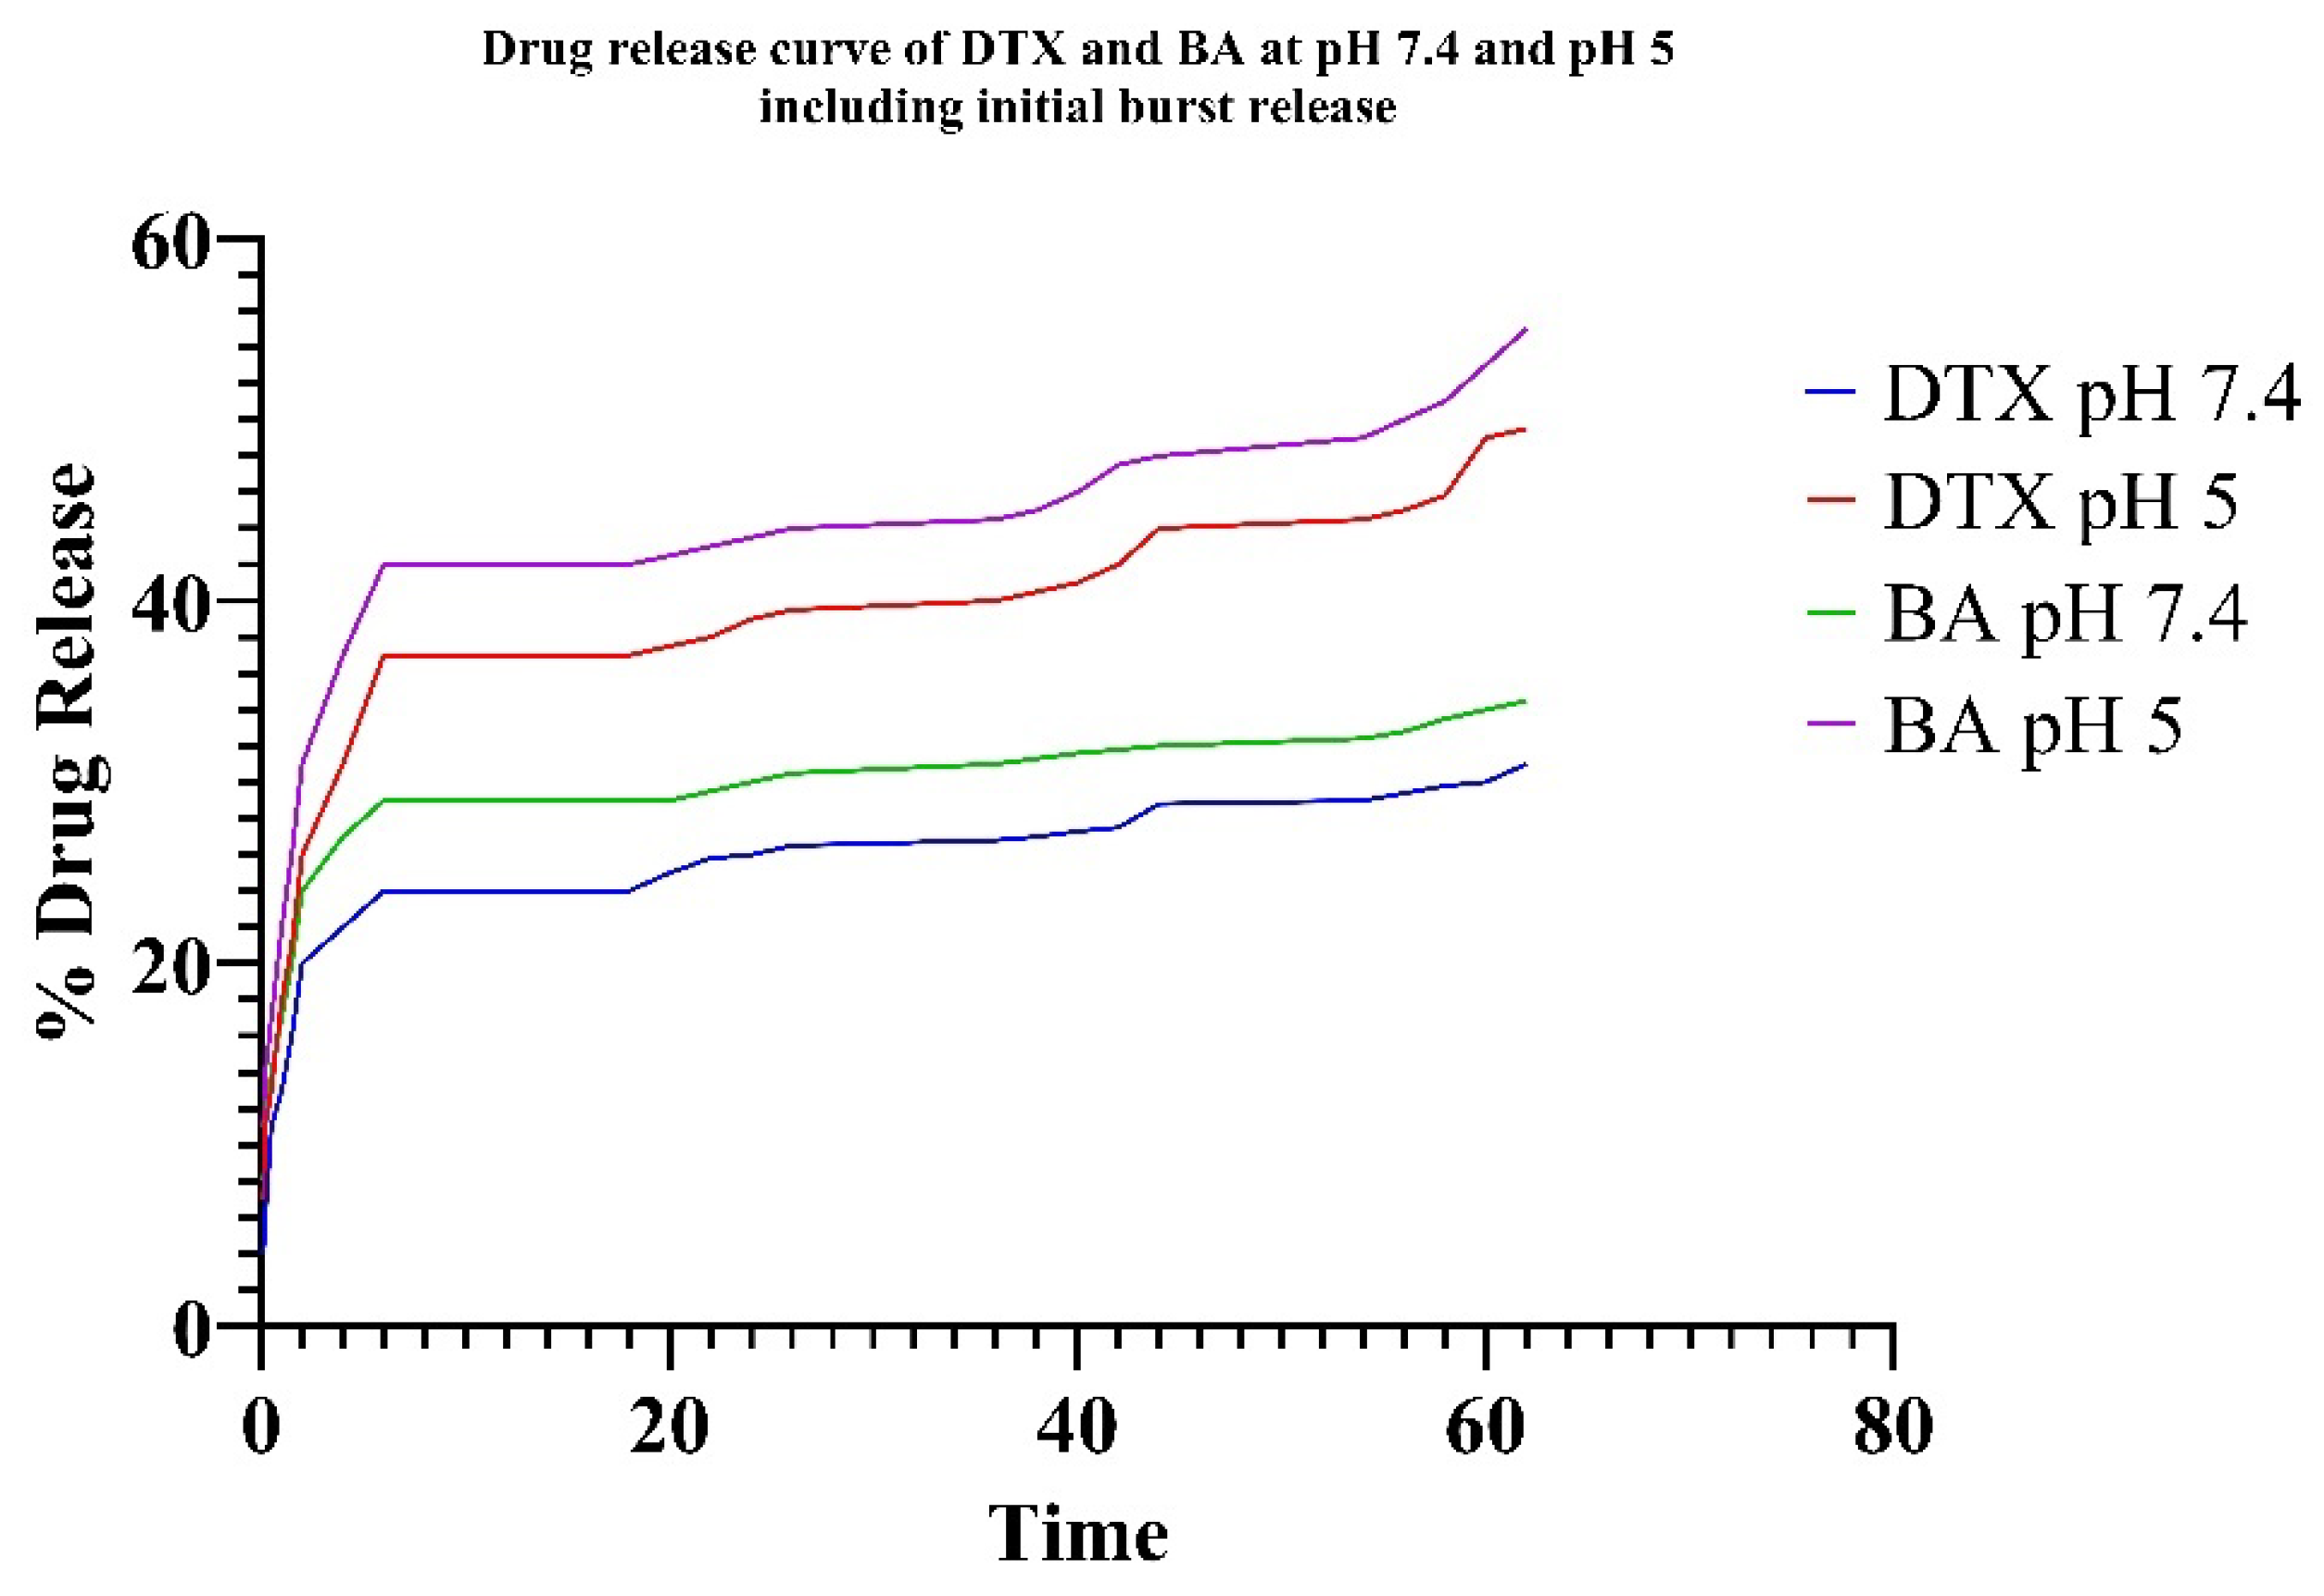
In vitro drug release was observed under two different conditions (pH 7.4 = physiological pH and pH 5 = tumor microenvironment pH). The pH of the tumor microenvironment is normally acidic (pH 5) due to the metabolic activities of cancer cells [27]. So, both pH values were considered to study the drug release. Drug release data show the sustained release nature of the formulation. Drug release data show the initial burst release of the drug, which leads to a fast initial concentration in the blood followed by reaching a plateau value after 1.5 h to confirm the sustained release. Also, both the drugs showed better release % in pH 5 compared to pH 7.4, confirming the suitability of the formulation in the tumor microenvironment. For PLGA NPs across all examined release media, the highest R2 values were obtained using the Higuchi model, indicating that the release from the NPs is primarily diffusion-controlled. Although empirical modeling confirms diffusion as the main release mechanism, semi-empirical models help to identify the type of diffusion. The Peppas–Sahlin model allows for the assessment of k1 and k2, which corresponds to the Fickian kinetic constant and the matrix swelling kinetic constant, respectively. If the ratio of |k1|/|k2| exceeds 1, drug release is primarily diffusion-driven; if it is less than 1, the release is predominantly influenced by matrix swelling. The experimental data fit well with both the Korsmeyer–Peppas and Peppas–Sahlin models, with R2 values exceeding 0.95. Additionally, the “n” values related to NP release are below 0.45, regardless of the pH of the release medium, indicating that Fickian diffusion predominantly controls the release mechanism. For the same NPs, the |k1|/|k2| ratio was significantly greater than 1, further confirming that the release is governed by Fickian diffusion [28].
By stabilizing microtubules and preventing their disintegration, DTX inhibits the division of lung cancer cells, resulting in cell cycle arrest and apoptosis. Through mitochondrial pathways, BA triggers apoptosis and strengthens the immune system’s defense against cancerous cells. When combined, they have a synergistic effect, as BA contains immunomodulatory and apoptotic induction qualities, along with DTX’s ability to stabilize microtubules, providing a powerful therapy option for lung cancer [29]. In vitro cytotoxicity analysis through an MTT assay showed a significant reduction in IC50 values of DTX-BA-NPs against the A549 cell line compared to the free DTX and BA and single-drug NPs, i.e., DTX-NPs and BA-NPs, as shown in the results. Combinatorial NPs of DTX and BA showed lower IC
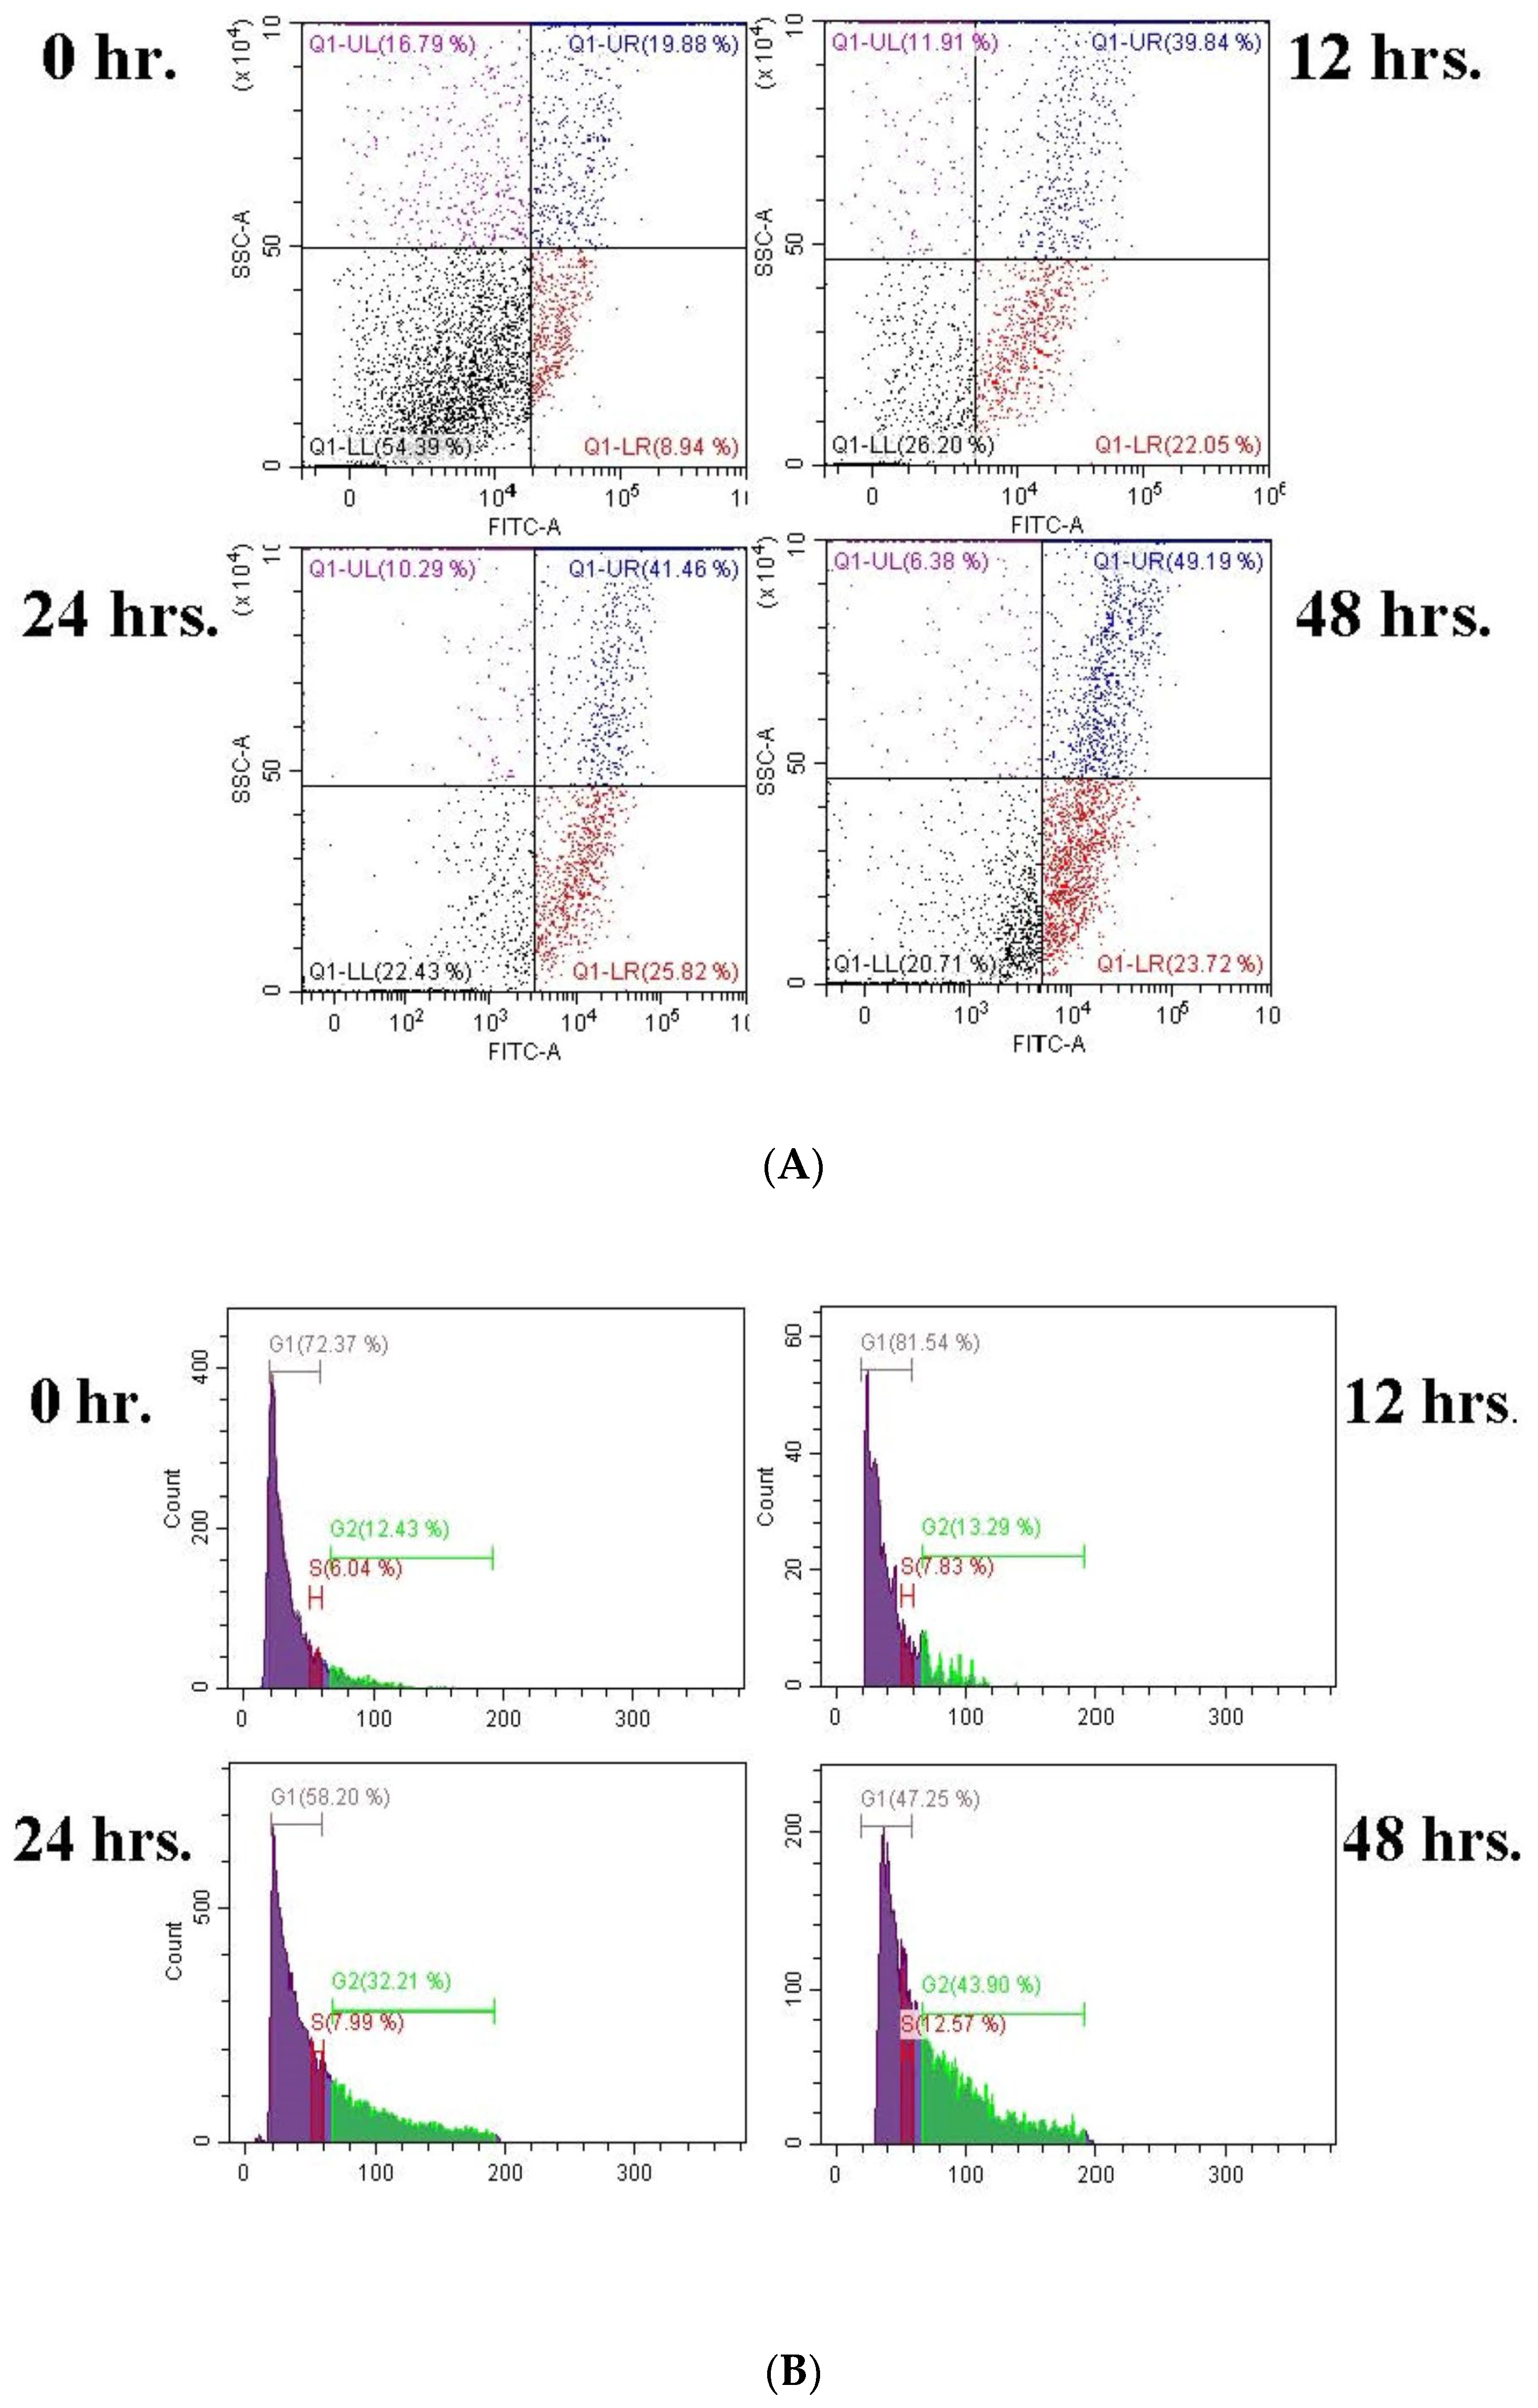
50 values compared to individual DTX-NPs and BA-NPs for 24, 48, and 72 h. For synergy calculation, a modified formula based on the Chou–Talalay method was used. The Combination Index (CI) values for DTX-BA-NPs show synergy at all time points (CI < 1). Notably, synergy intensifies over time, with CI values decreasing from 0.80 at 24 h to 0.30 at 72 h. This suggests that the combined treatment’s efficacy improves with prolonged exposure. For free DTX and BA free-drug solutions, passive diffusion may be the uptake route; however, NPs may be absorbed by cellular endocytic pathways and exhibit superior absorption [30].
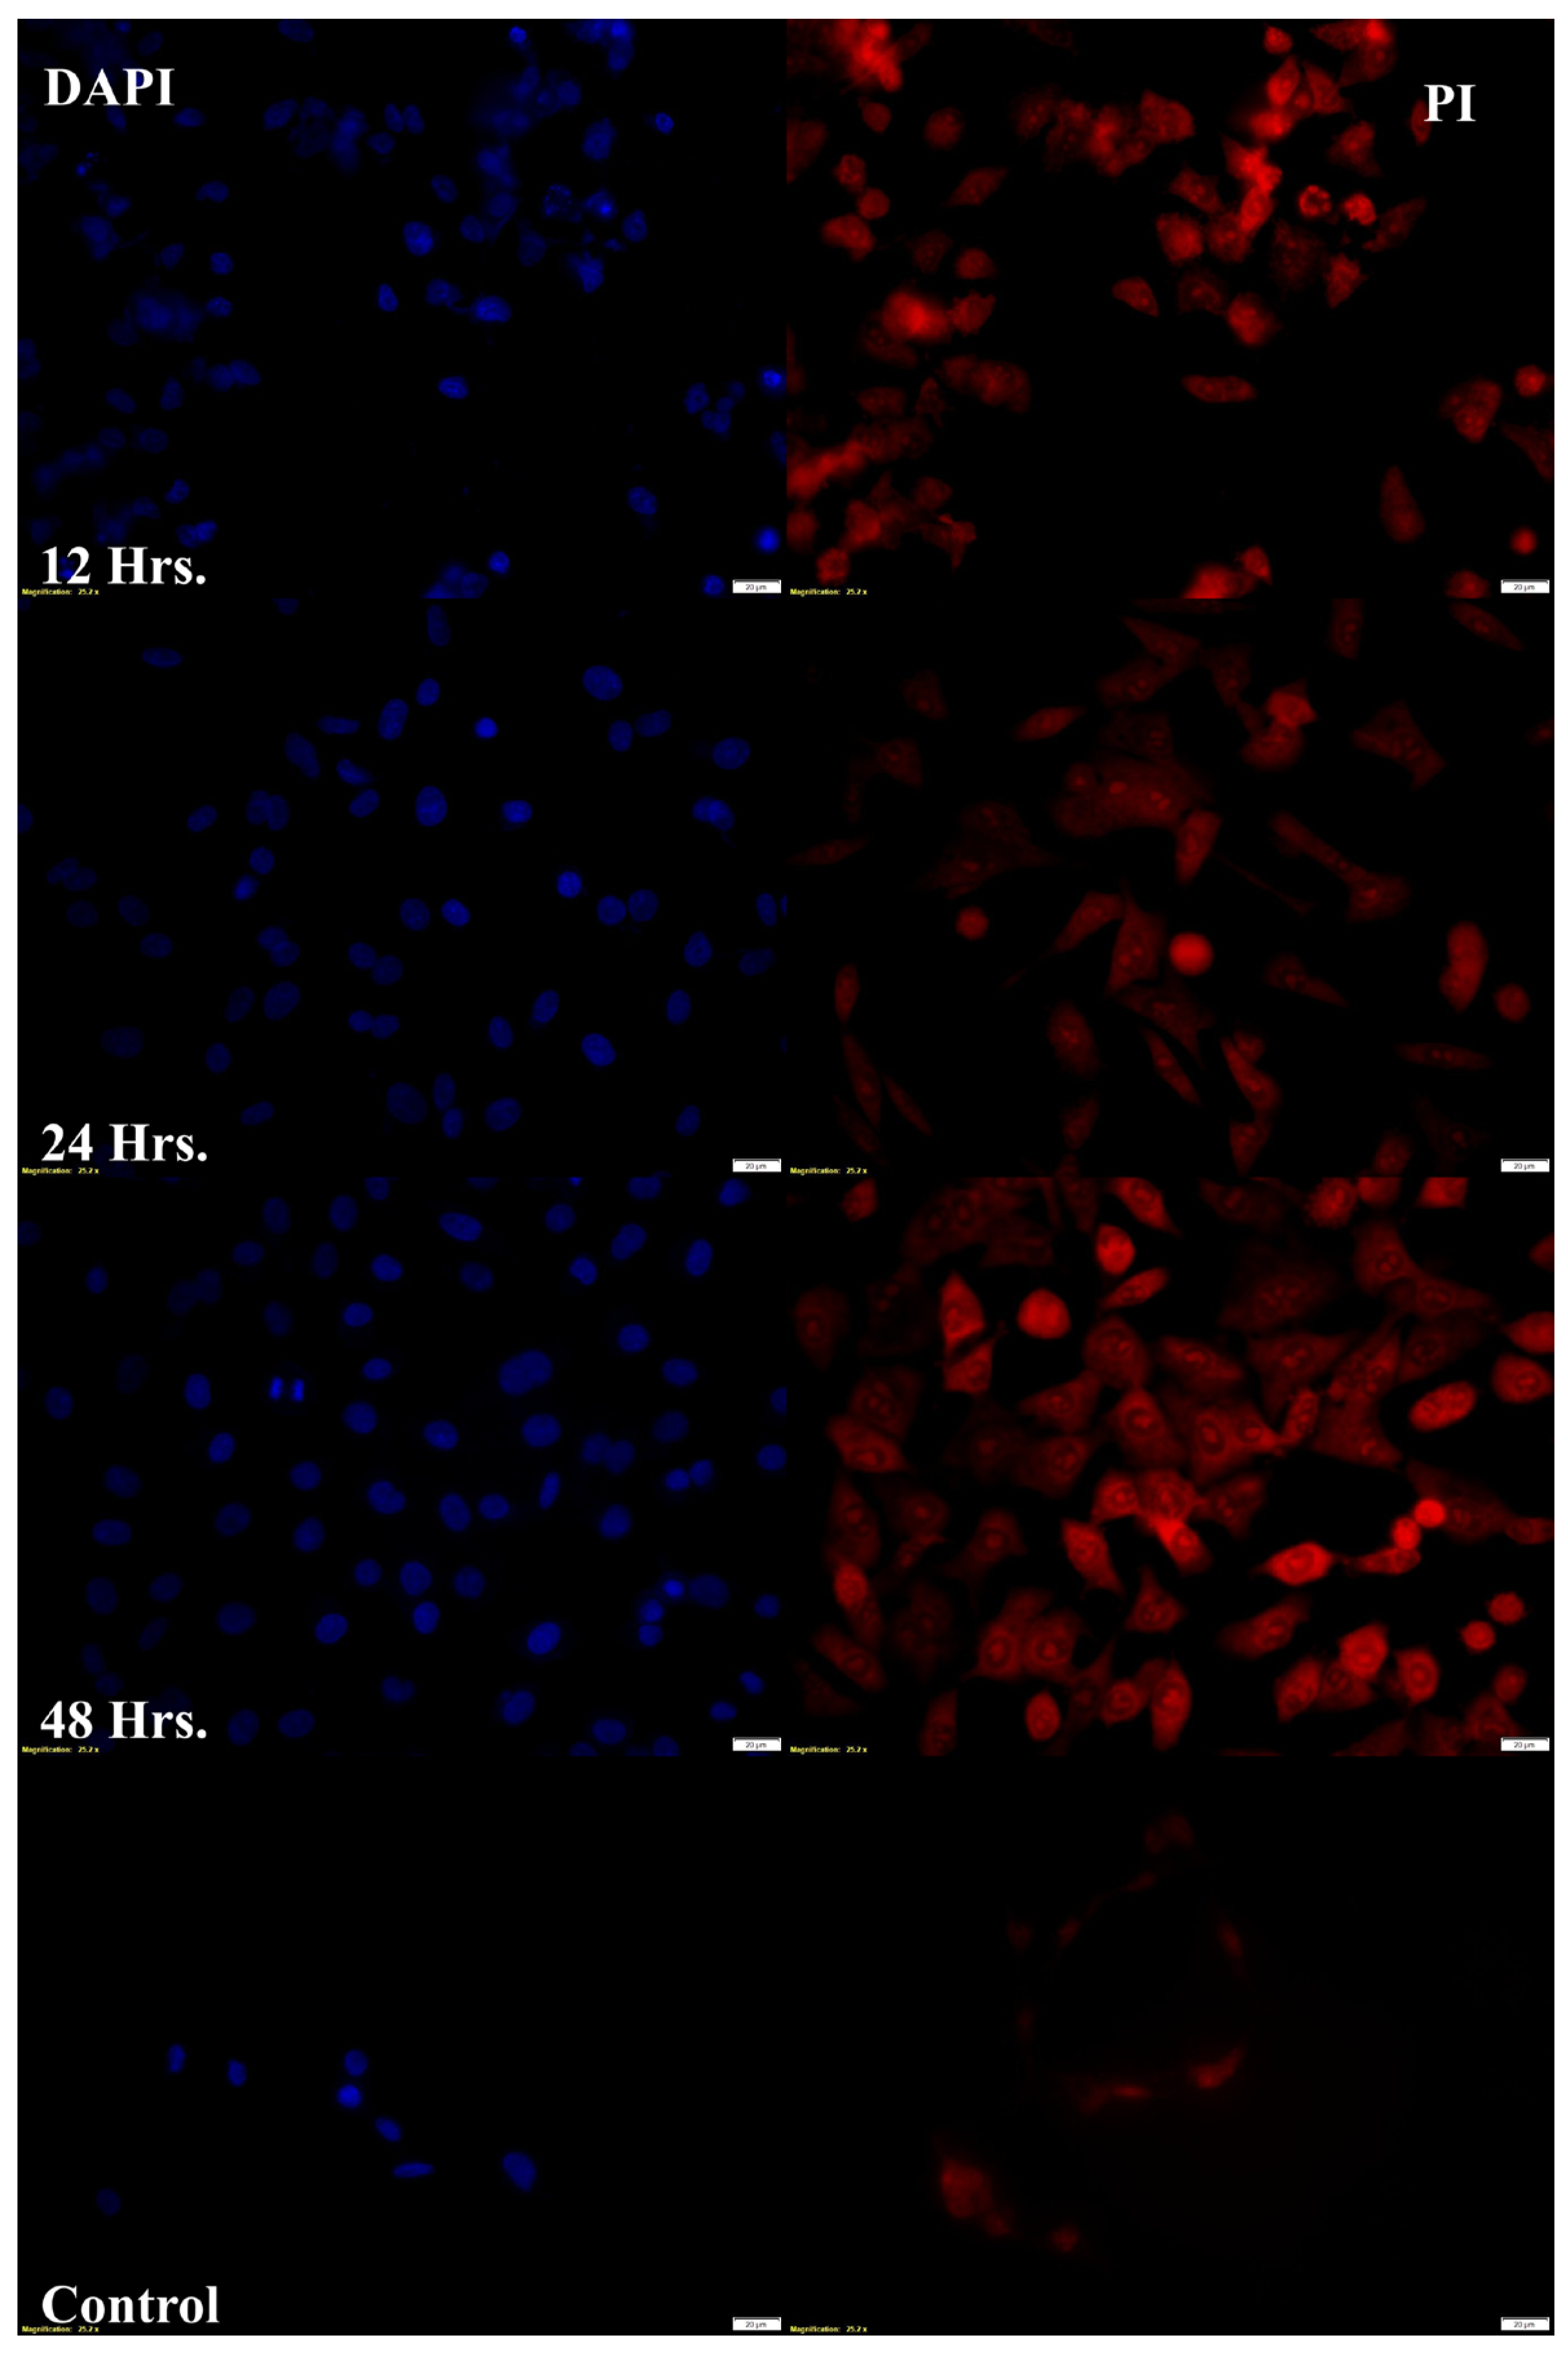
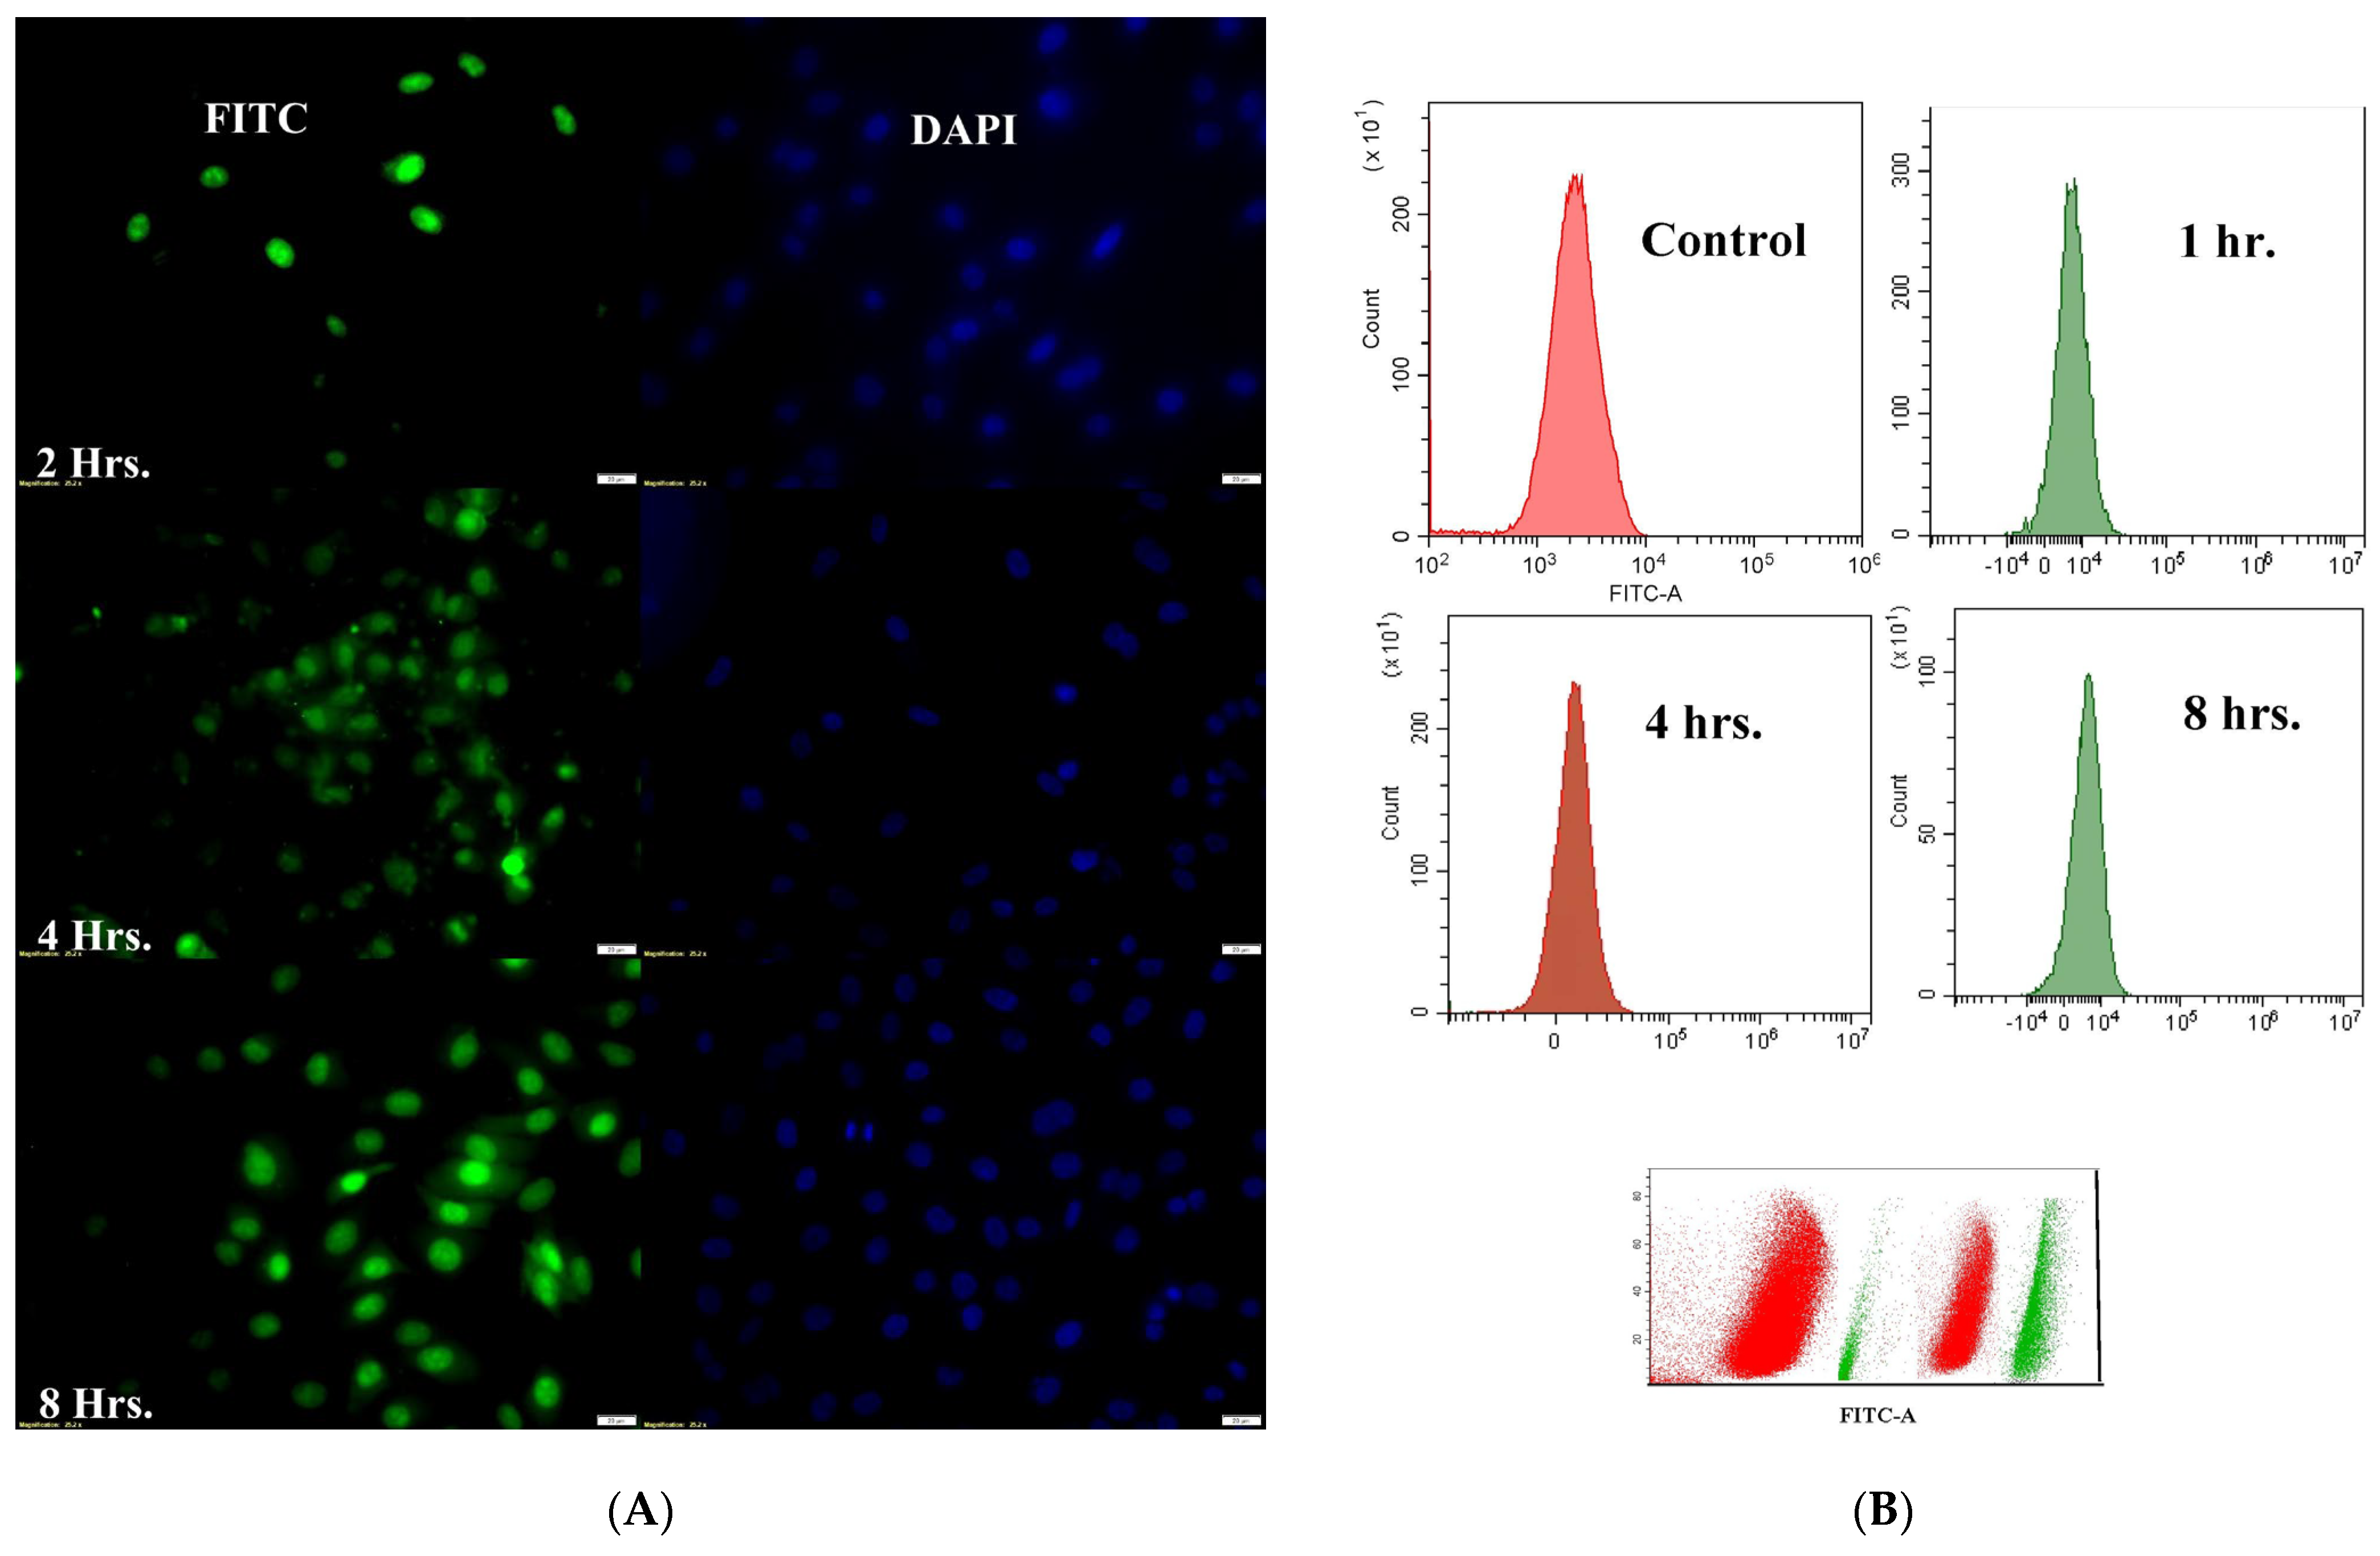
Target-specific cellular internalization is a critical challenge when using nanoformulation to deliver therapeutic molecules. The body’s natural defense mechanism, phagocytosis, removes micron-sized particulate compositions by classifying them as “foreign particles”. However, nanoparticles can stay in the bloodstream for much longer periods since macrophages generally do not identify them. Additionally, they can be pinocytosed inside macrophages, a behavior that depends on the extracellular concentration [31]. The capacity of DTX-BA-NPs to reach the nucleus was confirmed by fluorescence microscopic analysis, which showed a predominant accumulation of fluorescently labeled nanoparticles (FITC-DTX-BA-NP) in the perinuclear region (Figure 11A). Fluorescence image analysis confirms that PLGA nanoparticles successfully enter tumor cells. However, since PLGA lacks inherent specificity for tumor cells, further research is needed to enhance targeted delivery. Modifying PLGA nanoparticles with targeting ligands or antibodies, such as folic acid, LHRH, or hyaluronic acid, could improve specificity and enhance delivery to cancer cells. These modifications may help increase the therapeutic efficacy by ensuring that the nanoparticles preferentially target tumor cells, reducing off-target effects and improving overall treatment outcomes. An MTT assay was conducted on normal human bronchial epithelial cells (BEAS-2B) across a concentration range of 50 to 5 µM. The results showed that cell viability remained above 80% at all concentrations, indicating a favorable safety profile in normal cells (Supplementary Table S7). This suggests that the nanoparticles exhibit greater specificity toward tumor cell lines compared to normal cells, further supporting their potential as a targeted therapeutic option in cancer treatment while minimizing harm to healthy tissues. Fluorescence microscopy also confirmed cell death with red or orange spots (PI stain). Treatment with DTX-BA-NPs for 12, 24, and 48 h confirmed cell death with an orange color (Figure 10A). The quantity of orange cells increased as treatment duration increased, and some cells turned scarlet, signifying cell death. Certain cells’ cytoplasm showed noticeable orange patches upon high magnification and laser modification, indicating the creation of acidic vacuoles [32].
DTX and BA both cause cell cycle arrest in the G2/M phase. With the increase in treatment time, as shown in the results, the number of cells increases in the G2 phase. An extension of the treatment duration increased the G2/M ratio. This result suggested that, following treatment with DTX-BA-NPs, cells are blocked in the interphase (G2), facilitating the arrest of mitotic cell division. The primary means of obstruction in the cell cycle seems to be chromosomal vandalism, which is incapable of being redesigned and carried out to induce programmed cell death [33].
The potential of DTX and BA in treating lung cancer can be successfully assessed by molecular docking of the ligands with Bcl-2 protein and PI3K gamma and analyzing their binding affinities and interactions. DTX stabilizes microtubules and prevents cancer cell division, which can be ascertained by looking at the tubulin-associated protein Bcl-2. The ability of BA to trigger apoptosis in cancer cells can be demonstrated using the protein PI3K, which is associated with apoptotic pathways. By predicting the drug efficacy, specificity, and synergistic effects, the in silico approach offers important insights into improving targeted lung cancer therapy and co-encapsulating the drugs more effectively [23]. Both DTX and BA showed high negative binding scores with the two most probable lung cancer proteins (Bcl-2 and PI3K) confirming high binding with both proteins and thus proved effective in lung cancer treatment (Supplementary Table S6).
Future clinical studies should focus on optimizing nanoparticle formulations, assessing pharmacokinetics, and evaluating long-term safety and efficacy. Additionally, exploring combination therapies with immunotherapies could further enhance treatment responses in lung cancer patients. If successfully translated, DTX-BA-NPs could significantly advance the field of lung cancer therapy, offering a promising alternative to standard chemotherapy. The regulatory challenges surrounding the co-encapsulation of DTX and BA in NP-based formulations for lung cancer therapy are intricate, encompassing both safety and efficacy concerns. Rigorous toxicological and preclinical studies must address nanoparticle biodistribution, toxicity, and therapeutic superiority over conventional treatments. Ensuring batch consistency, sterility, and stability in compliance with Good Manufacturing Practices (GMPs) is crucial. Regulatory approval hinges on comprehensive data submissions covering chemistry, manufacturing, and control (CMC) aspects, with alignment with guidelines for combination therapies and nanomedicines. Early regulatory engagement through pre-IND meetings can streamline the process [3].

4. Materials and Methods

Poly-D, L-lactic-co-glycolic acid (PLGA) with a copolymer ratio of D, L-lactide to glycolide of 50:50 (molecular weight 50,000–75,000) was purchased from Sigma-Aldrich, (Mumbai, Maharastra, India) and betulinic acid was gifted by the natural product department, CSIR-NEIST, Jorhat. Polyvinyl alcohol (PVA) was purchased from Loba Chemie Pvt., Ltd. (Mumbai, India). HPLC-grade acetone and methanol were purchased from Sisco Research Laboratories Pvt., Ltd. (SRL), (Andheri (East), Mumbai, Maharastra, India). Fluorescein isothiocyanate (FITC) and 4′,6-diamidino-2-phenylindole (DAPI) were procured from Sigma Aldrich (Mumbai, Maharastra, India) and Invitrogen (Bengaluru, Karnataka, India), respectively. All other chemicals and solvents were of analytical grade and purchased from Merck India (Mumbai, Maharastra, India), and the A549 lung cancer cell line was from NCCS, Pune, Maharastra, India.

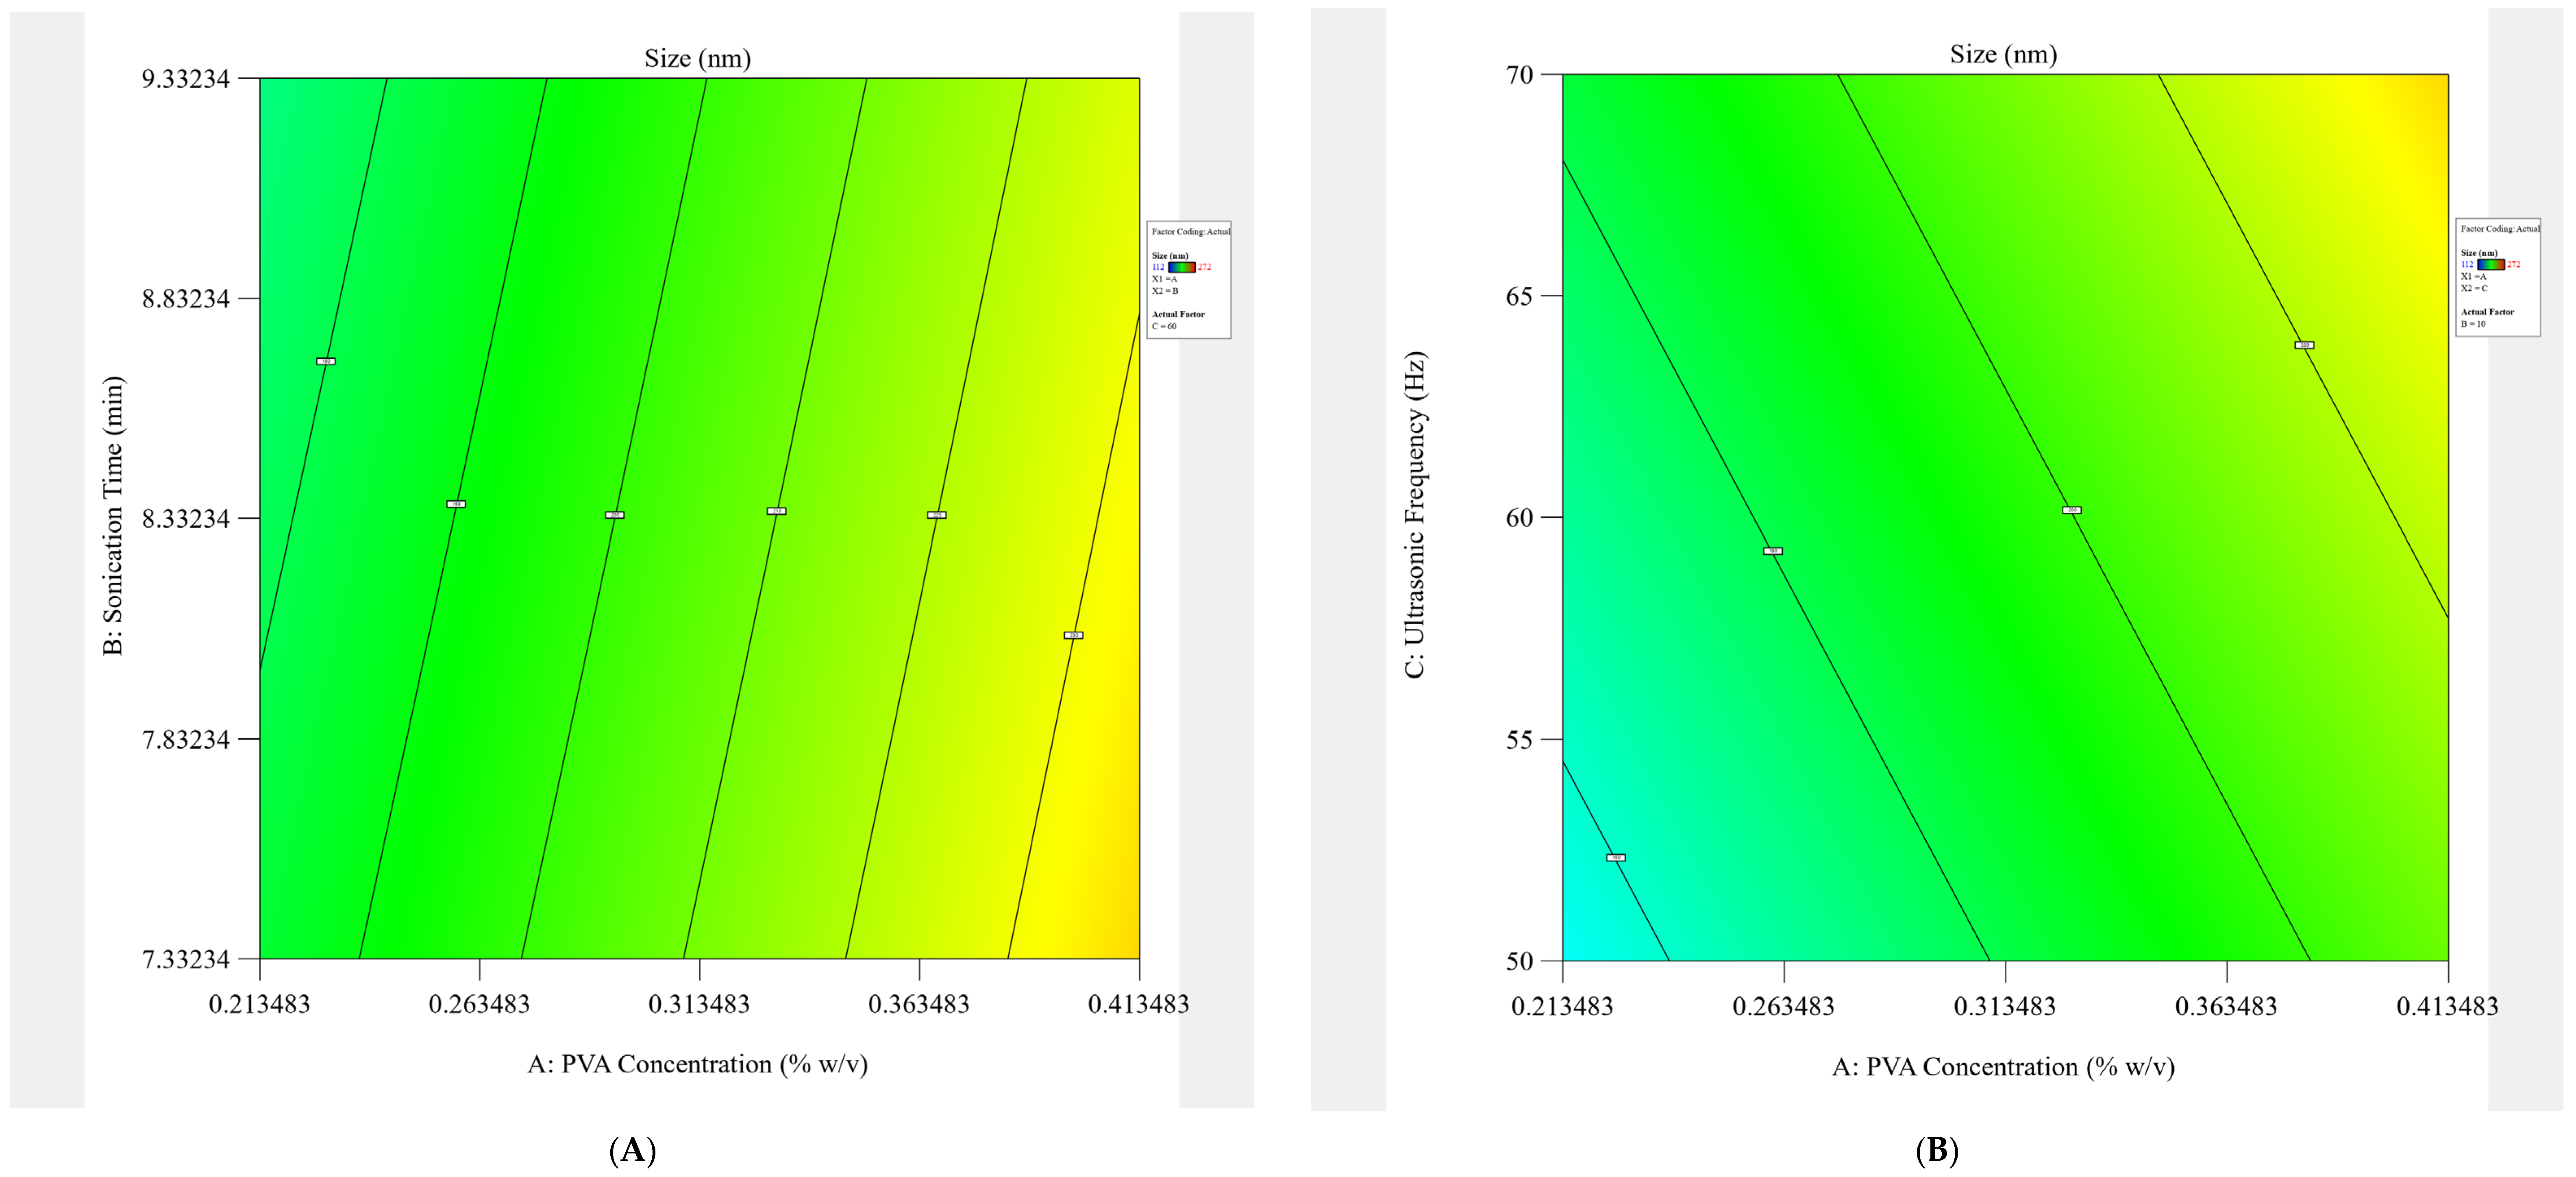
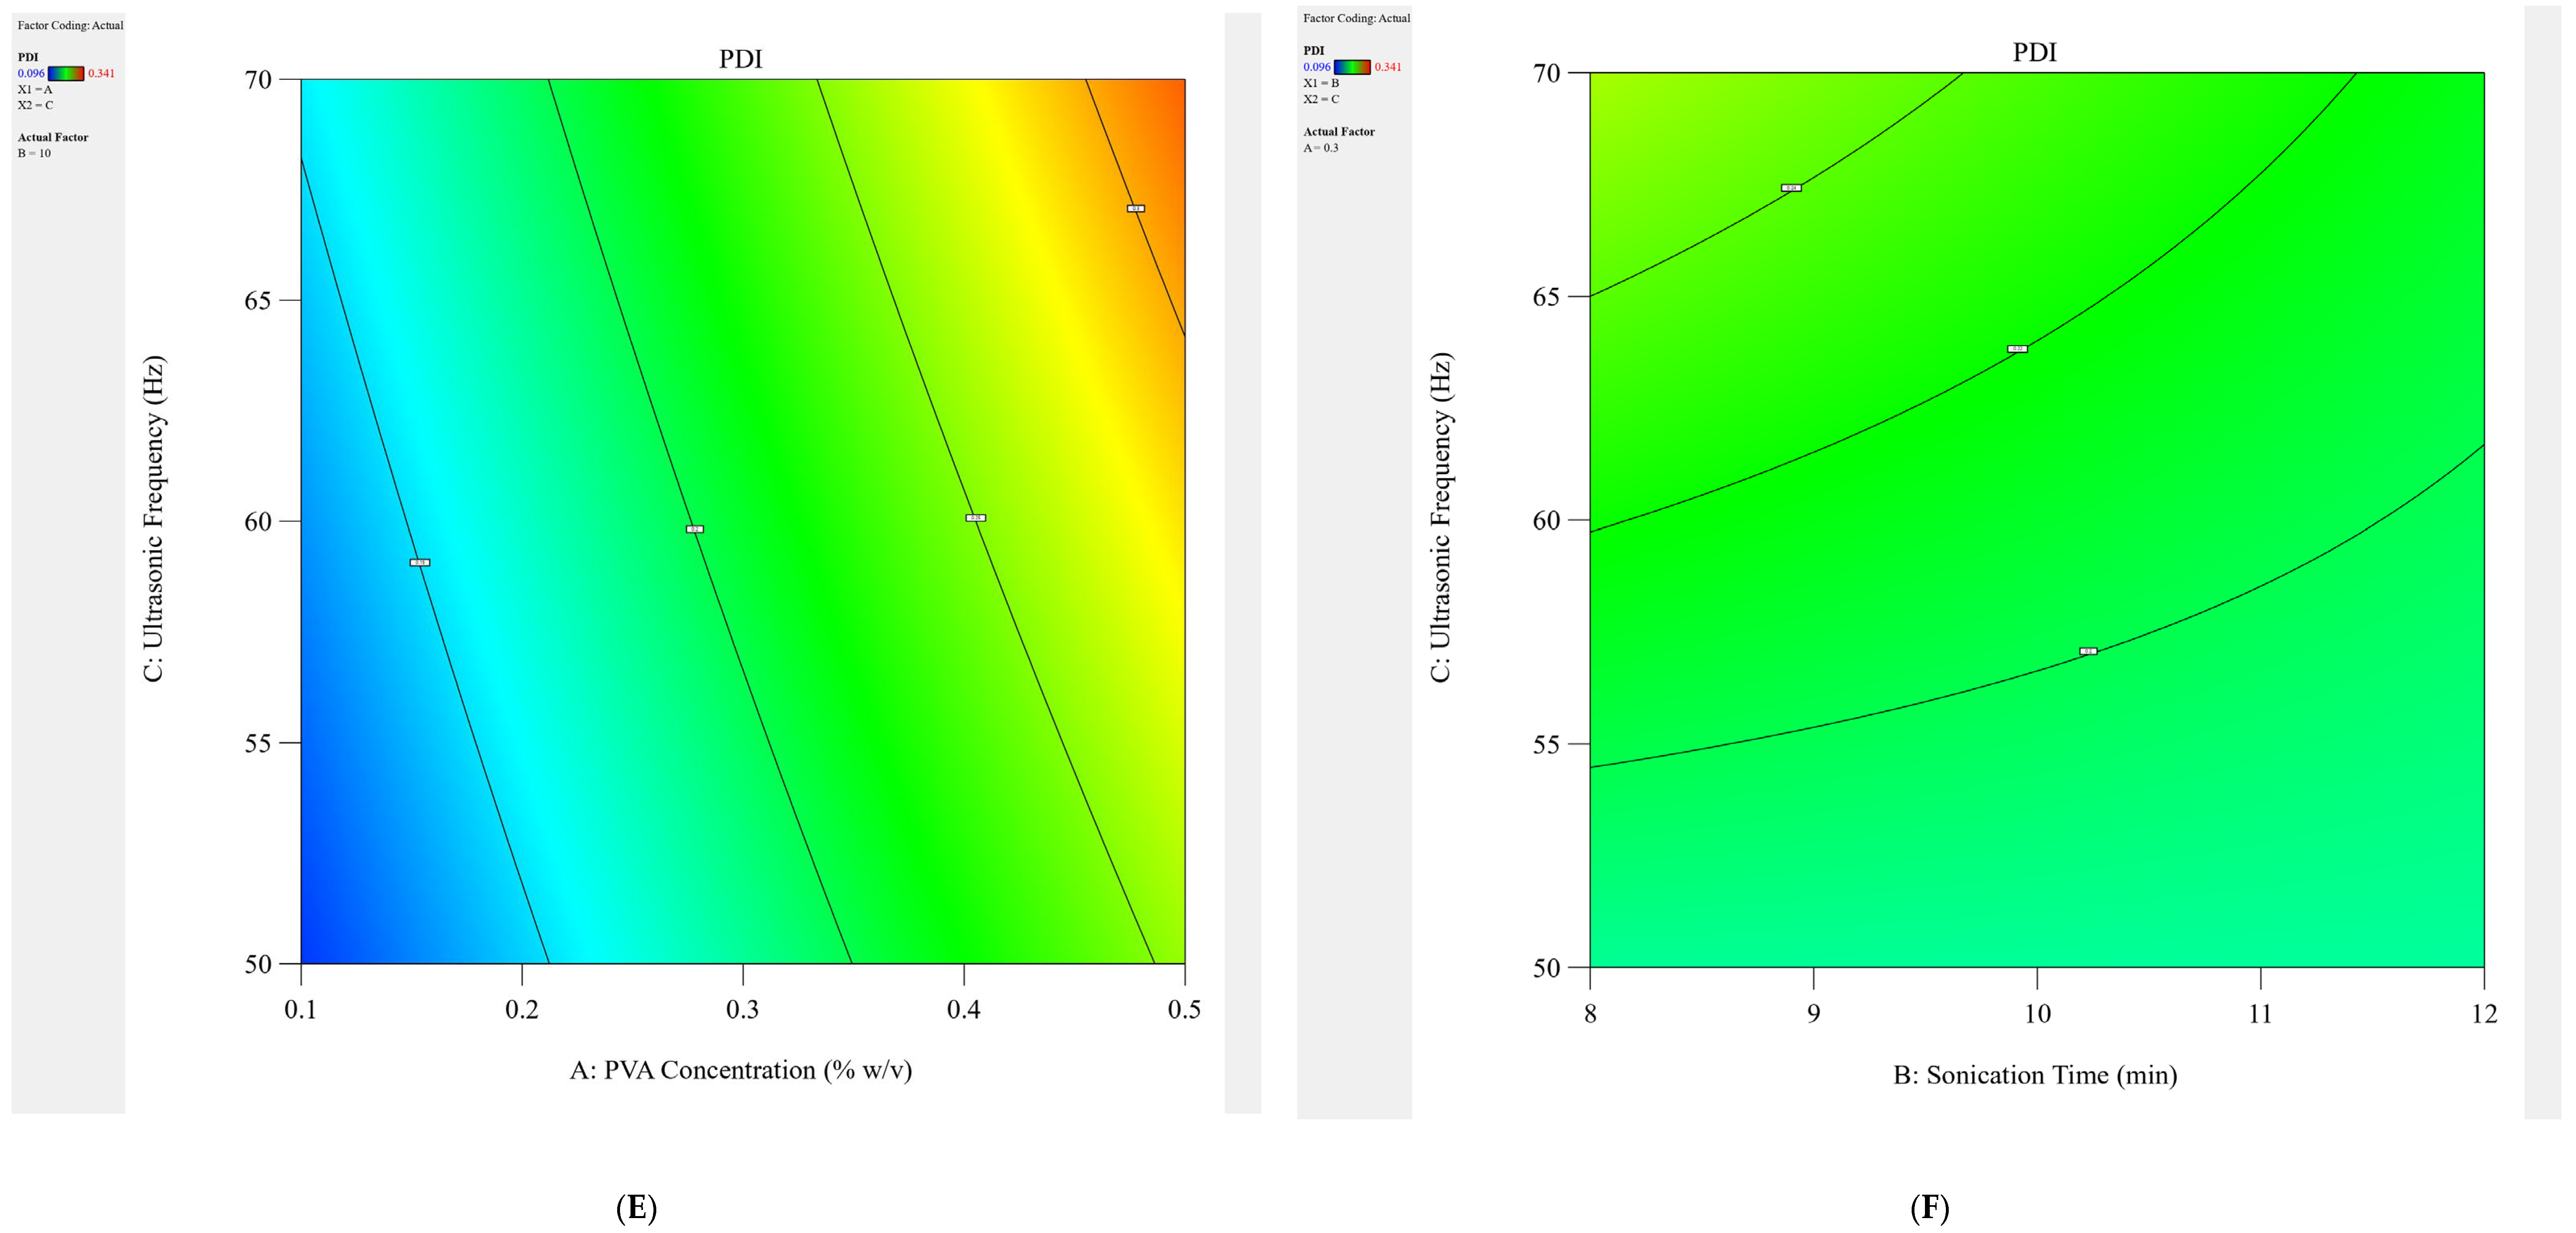
4.1. Experimental Designing

The design of the experiment (DoE) was constructed in this study using Design Expert® Software (Version 13.0.5.0, Stat-Ease Inc, Minneapolis, MN, USA) by adapting the 23 factorial design approaches to optimize the blank NPS. Before loading drugs into the NPs, the preparation process of NPs was optimized according to selected parameters. The independent parameters for optimization were PVA concentration (A = X1), sonication time (B = X2), and ultrasonic frequency (C = X3). The levels for every formulation variable were also established via preliminary investigations. Furthermore, the architecture is suitable for building second-order polynomial models and studying quadratic response surfaces. The selected responses were the Size (Y1) and PDI (Y2) of the study. Eight experimental runs of the DTX-BA-NPs formulations, as indicated in Table 5, were created after each independent variable was assigned a high and low-level value.

4.2. Optimization of 23 Factorial Designs Using Design Expert® Software Version 13

The model was run in triplicate for each of the eight possible formulations after the findings for the dependent variables, size (Y1) and PDI (Y2), were entered into the response columns of the experimental design program. When “p” values were less than 0.05, the statistical analysis of the data was deemed significant for any factor. To investigate the impact of independent variables (PVA concentration, sonication time, and ultrasonic frequency) on dependent variables (Size and PDI), a complete factorial design with 23 variables was chosen. Plots of contour (2-D) provide direct visualization of the link between the response and independent variables, where A, B, and C are the coded levels of independent variables, Y1 is the measured response (Size), and Y2 is the measured response (PDI) associated with each factor level combination. The interaction terms are denoted by the terms AB, BC, and AC. The average outcome of gradually increasing each factor’s value from low to high is represented by the primary effects (A, B, and C). The testing settings and factorial design parameters are displayed in Table 5.

4.3. Preparation of DTX-BA-NPs

DTX-BA-NPs were prepared by a double-emulsion solvent evaporation technique as described previously with minor modifications [34]. All the dependent variable values were obtained from the process optimization after the design of experiment analysis by 23 design on Design Expert software version 13 and used for the formulation. In brief, BA (2 mg) was dissolved in acetone and methanol in a 3:1 ratio (2 mL) with sonication and gentle heating, then cooled, and again the same solution of DTX was added followed by sonication to dissolve. The DTX-BA solution was treated with PLGA (30 mg). The solution was added to an aqueous solution (30 mL) of PVA (0.1% w/v) and immediately sonicated (for 11.45 min) under cold conditions using a microtip probe sonicator set at 55 W of energy output (50 Hz) (Fisherbrand™ Model 705 Sonic, Mumbai, Maharastra, India). The oil-in-water emulsion was allowed to stir at room temperature for 6–8 h for the removal of acetone and methanol. The prepared DTX-BA-NPs were retrieved by ultracentrifugation (35,000 rpm, 5 °C) for 20 min (Thermo Scientific Sorvall MTX 150 Micro-Ultracentrifuge, Mumbai, Maharastra, India) and washed thrice with milli-Q water (Millipore Corp., Billerica, MA, USA) to remove excess PVA and unencapsulated free DTX and BA. The pellet obtained was lyophilized for 6 h to obtain a free-flowing powder. Image depiction of the formulation procedure is shown in Figure 14.
In a similar way, blank nanoparticles were developed without the addition of drugs. FITC was employed as a fluorescent marker, and to produce FITC-labelled blank NPs, 0.1 mL of its stock solution (0.5% w/v in ethanol) was added to the PVA solution during emulsification. The prepared nanoparticles were lyophilized for further use.

4.4. Characterization of NPs

4.4.1. Particle Size Distribution and Zeta Potential Analysis

First, 2–3 mg of lyophilized NPs was taken in a microcentrifuge tube and 2 mL of milli-Q water was used for even redispersion using a bath sonicator for 70–80 min at a controlled temperature between 15 and 0 °C. The average particle size, size distribution, and polydispersity index (PDI) of the prepared nanoparticles were determined by dynamic light scattering technology with proper dilution (if required) with milli-Q water in zetasizer instruments (Zetasizer Nano ZSP—Malvern Panalytical, New Delhi, India). Zeta Potential was measured at 25 °C using the same instrument. All the measurements were performed in triplicate, and the average values were calculated and reported [20].

4.4.2. High-Resolution Transmission Electron Microscopy (HRTEM)

Lyophilized NPs were redispersed in milli-Q water using a bath sonicator for 80 min at a controlled temperature. After that, 2 µL of the dispersed NP solution was added to a TEM grid of mesh sized 600 mesh × 42 μM with a pitch of copper and air dried for 1 h and then kept in a desiccator for 24 h. After that, the grid was subjected to HRTEM (JEOL, Tokyo, Japan, Model: JEM-2100 Plus Electron Microscope) and operated at about 210–240 V with a frequency range of 50–60 Hz [35].

4.4.3. Filed Emission Scanning Electron Microscopy (FESEM)

Prepared lyophilized NPs (2–3 mg) were redispersed in milli-Q water with bath sonication at a controlled temperature for 80 min. After that, 50 µL of the dispersed NP solution was added dropwise to a coverslip and left to air dry for 2 h, and after that, they were kept in a desiccator for 24 h. The dried samples were then subjected to FESEM imaging by gold surface coating technology in nitrogen environments (Carl ZEISS Microscopy, Jena Germany, Model: ZEISS, SIGMA) with 20,000× and 40,000× magnifications, operated at 20 kV accelerating voltage [36].

4.4.4. HPLC Method Development of DTX and BA

The stock solution of a 1 mg/mL concentration of DTX solution was prepared in acetone. BA was dissolved in acetone and methanol in a 1:1 ratio by taking 1 mg/mL as the stock, and different concentration ranges were prepared as 400, 200, 100, 80, 60, 40, 20, and 10 µg/mL with methanol.
For DTX and BA, water–ACN (v/v) was used in various ratios to obtain the proper ratio in both isocratic and gradient systems along with retention time. For the stationary phase, the Waters Symmetry® C18 5 μM Column (4.62 × 250 mm) was used. For DTX 5/45, 10/55, 13/67, 17/82, and 22/95, gradient systems (time/ACN) were used according to the time the ACN concentration was changed. For BA 5/90, 7/85, 9/75, and 12/60, time/ACN was used. After optimization of the gradient system, an isocratic system was developed and run for both drugs. The flow rate was also chosen from 0.5 mL/min to 1 mL/min. For DTX and BA determination, 220, 235, 245, and 275 nm wavelengths and 205, 210, 220, and 235 nm were used, respectively [37,38].

4.4.5. Drug Loading and Encapsulation Efficiency of DTX-BA-NPs

The concentrations of DTX and BA in NPs were determined using the Waters Corporation ACQUITY Arc System equipped with a Waters 2487 dual wavelength absorbance detector and a Waters Symmetry® C18 5 μM Column (4.62 × 250 mm). For DTX and BA, water–ACN (v/v) was used in various ratios to obtain the proper ratio in both isocratic and gradient systems along with retention time with a flow rate of 0.5 mL/min. An aliquot of the DTX-BA-NPs suspension was added to a mixture of water–ACN (1:1, 1 mL), vortexed, sonicated, and centrifuged; the clear supernatant was filtered and analyzed by HPLC. Measurement was performed using standard solutions of DTX and BA in methanol (10–400 μg/mL). The % yield, drug loading, and encapsulation efficiency were calculated using Equations (3), (4), and (5), respectively [20].
Y i e l d   % = W e i g h t   o f   n a n o p a r t i c l e s T o t a l   w e i g h t   o f   a l l   c o m p o n e n t s   u s e d   i n   t h e   f o r m u l a t i o n × 100
D r u g   L o a d i n g   C o n t e n t   % = W e i g h t   o f   t h e   d r u g s   i n   n a n o p a r t i c l e s W e i g h t   o f   t h e   n a n o p a r t i c l e s × 100
E n c a p s u l a t i o n   e f f i c i e n c y   % = W e i g h t   o f   t h e   d r u g s   i n   n a n o p a r t i c l e s I n i t i a l   a m o u n t   o f   d r u g s × 100

4.4.6. Fourier Transform Infrared Spectroscopy (FTIR)

To determine the possible chemical interaction occurring between the drug and the PLGA polymer, the FTIR spectra of DTX, BA, the physical mixture of DTX, BA, and PLGA, DTX-BA-NPs, and PLGA in the range of 400–4000 cm−1 were studied, employing an FTIR spectrophotometer (Perkin Elmer, Model-Spectrum 100Thane, Maharastra, India). For the IR study, the KBr plate method was used. Drugs and excipients were assorted with IR-grade KBr at a ratio of 1:1000 and then a KBR thin plate was obtained using a hydraulic press at 100 psi pressure for 2 min. KBR plates were then placed in the IR sample holder and spectra were taken [39].

4.4.7. In Vitro Drug Release

The prepared NPs (10 mg) were redispersed again after lyophilization in 20 mL of phosphate buffer saline of pH 7.4 and 5 containing Tween 80 (50 μL) and subsidized in a magnetic stirrer at 4000 RPM for 7 days at 37 °C. The withdrawn samples were then centrifuged and the supernatant was collected and filtered through a 0.45 µ membrane filter and checked in HPLC for release data using the same method as described in the drug-loading method. A previously generated calibration curve was used to create a cumulative % release of drugs vs. time graph. The release profile of NPs was interpreted using a variety of kinetic models, including first-order, zero-order, Korsmeyer–Peppas, Highuchi, and Hixson–Crowell models, and curve fitting was completed using Origin Pro software version 10 [39].

4.4.8. Long-Term Stability Study

Lyophilized NPs were stored in a sample tube at t RT, 4 ± 2 °C, and −20 °C for 3 months after preparation. After the storage period, NPs were re-dispersed in milli-Q water, and bath sonication was performed for 70 min at 15 °C. After that, the dispersed NP solutions were subjected to size and zeta potential tests to determine the change in charge voltage compared to the charge of fresh NPs for the stability study [40].

4.5. Cell Line and Culture Maintenance

The adherent adenocarcinoma human alveolar basal epithelial A459 lung cancer cell line was obtained from the National Centre for Cell Science (NCCS) in Pune, India. These cells were cultured in a high-glucose dulbecco’s Modified Eagle Medium (DMEM) medium, supplemented with 10% fetal Bovine Serum (FBS), 50 IU/mL penicillin G, and 50 µg/mL streptomycin, and maintained in a humidified incubator with a 5% CO2 atmosphere. Sub-culturing was performed when the cells reached 90% confluence. Cell viability was assessed using the trypan blue exclusion method as needed [41].

4.6. In Vitro Cytotoxicity Assay Using MTT

The cytotoxic effects of the free drugs (DTX, BA), DTX-NPs, BA-NPs, and DTX-BA-NPs on the A549 lung cancer cell line were evaluated using the MTT assay. A549 cells (2 × 10⁴) were seeded into the wells of a 96-well plate and incubated overnight at 37 °C in a 5% CO2 environment with supplemented DMEM media. Following incubation, the media was removed, and the cells were treated with 200 μL of media containing either the free-drug suspension (concentration range of 1–50 μmol) or the NPs suspension (equivalent free-drug concentration range of 1–50 μmol) across different groups for 24, 48, and 72 h. The cells in the control group did not receive any medication treatment. Twenty microliters of the MTT solution (5 mg/mL in Phosphate Buffer Saline (PBS)) were added to each well after the treatment period was over, and it was incubated for 3 to 4 h at 37 °C. After removing the MTT solution, 100 μL of dimethyl sulphoxide (DMSO) was added to each well and shaken for 15 min to dissolve the formazan crystals that had formed in the cells as a result of the reaction between the MTT and the enzyme mitochondrial reductase. After that, the plate was examined at 570 nm in a microplate reader (Bio-Rad, Hercules, CA, USA). Cell viability % was plotted against DTX-NP, BA-NP, and DTX-BA-NP concentrations and the IC50 value was determined. The IC50 value, representing the significance of the results, was determined [39].
Combination index (CI) calculation for determining the synergism, antagonism, or additivity of drug combinations was performed by comparing the IC50 values of the combination treatment (DTX-BA-NPs) against the IC50 values of individual treatments (free DTX, Free BA, DTX-NPs, and BA-NPs) using Equation (6). Equation (6) is an adaption of the CI formula based on the Chou–Talalay method [42].
C I = I C 50   D T X B A N P s I C 50   D T X N P s + I C 50   D T X B A N P s I C 50   B A N P s

4.7. Cell Death by Dual Cell Staining

Cell death induced by NPs was observed using fluorescence microscopy after treating A549 cells with an IC50 concentration of NPs. In brief, 5 × 10⁴ cells were seeded on each coverslip and placed in 35 mm cell culture dishes. The cells were then treated with NPs at their IC50 concentration for 12, 24, and 48 h, while the control group received only media. First, after incubation, the coverslip was cleansed with PBS and stained with PI (4 μg/mL) for incubation for 10 min. Then, the coverslip was removed and wiped with PBS, and scrubbed cells were fixed using 4% paraformaldehyde for 15 min at 4 °C. The fixed cells were washed again and stained with DAPI (300 ng/mL) in the dark for 15 min. Finally, stained cells were mounted on a slide with antifade and observed under fluorescence microscopy (Horiba, Model: Fluorlolog-3) [43].

4.8. Cellular Uptake Study

The intracellular uptake of NPs by A549 cells was studied in vitro using confocal laser microscopy. For confocal laser microscopy, approximately 1 × 10⁴ cells were seeded on a coverslip, placed in a 35 mm tissue culture dish with media, and incubated overnight at 37 °C. The cells were then treated with the IC50 concentration of FITC-labeled NPs in different groups for 1, 4, and 8 h. After treatment, the cells were washed with PBS, fixed with 70% ice-cold ethanol, co-stained with DAPI (for the nucleus), and mounted on a slide with glycerol for observation under a confocal laser microscope (Leica Microsystems, Leica TCS SP8, Wetzlar, Germany). Filters for FITC (Ex/Em 495/519 nm) and DAPI (Ex/Em 359/461 nm) were used to capture binary color images [44].

4.9. Apoptosis and Cell Cycle Analysis

Apoptosis and cell cycle analyses of NPs were conducted using flow cytometry after treating A549 cells with the IC50 concentration of NPs and staining with the annexin V-FITC apoptosis detection kit. Briefly, 5 × 10⁴ cells were seeded on each coverslip and placed in 35 mm cell culture dishes. The cells were treated with NPs at their IC50 concentration for 12, 24, and 48 h, while the control group received only media. After the time gap cells were trypsinized and centrifuged to collect the palate at 2000 RPM for 3 min. Cells were resuspended in 500 μL of 1X Binding Buffer. Then, 5 μL of Annexin V-FITC detection kit solutions was appended, escorted by incubation at room temperature for 5 min in the shade. The binding of Annexin V-FITC was analyzed by flow cytometry (Ex/Em = 488/530 nm) using a FITC signal detector (usually FL1) to see cell death or cell cycle arrest phases (Beckman Coulter, USA, Model: MoFlo XDP&CytoFLEX S) [45].

4.10. In-Silico Docking Studies

The SMILES ID of the two drugs DTX and BA were obtained from the PubChem database (PubChem CID 148124 and 64971, respectively). The X-ray crystal structure of the Bcl-2 protein (PDB ID: 4MAN) with a resolution of 2.07Å and PI3K gamma (PDB ID: 3L08) with a resolution of 2.7 Å were selected as the target proteins and downloaded from the RCSB-PDB website in .pdb format. The target proteins were prepared and docking was performed with the BIOVIA Discovery Studio Client 2022 software. The active binding site was defined for both the protein in chain A, the active site coordinates of Bcl-2 (x = −11.76, y = 10.20, z = 8.70) and PI3K (x = 24.92, y = 15.61, z = 21.36) were identified, and molecular docking of the ligands with the proteins was performed to determine the binding efficacy to the target proteins [22].

4.11. Statistical Analysis

The results are presented as mean ± SD. The statistical analysis was performed using Student’s t-test in Origin Pro version 10 software. The differences were considered significant at a p value of <0.05 unless stated differently.

5. Conclusions

From this study, it may be concluded that an efficient and effective DTX- and BA-loaded PLGA-encapsulated NP delivery system can be developed with the double-emulsion solvent evaporation technique. The blank formulation can be optimized by considering various independent variable and their outcome effect on the dependent variable. Optimized formulation falls under nanoformulation as particle size was well under the designated values and stability confirmation was analyzed by potential values. Morphologically NPs were suitable for uptake by cells or in biological systems. Dual-drug NPs show synergistic activity between DTX and BA as IC50 values were significantly reduced compared to free-drug and single-drug NPs. Intercellular uptake was confirmed by the accumulation of FITC-labelled NPs in the perinuclear region. DTX-BA-NPs proved to be an effective apoptotic agent as cell death was observed in the G2/M phase. Overall, although additional in vivo studies of the NPs for their therapeutic effect in lung cancer are required for further exploration, this study highlights the potential of PLGA-based DTX-BA-NPs by double-emulsion solvent evaporation for the enhanced delivery of DTX and BA for potential lung delivery.

Supplementary Materials

The following supporting information can be downloaded at: https://www.mdpi.com/article/10.3390/ddc3030033/s1, Figure S1: FITR spectra of DTX, BA, PLGA and NP, Figure S2: SEM image of DTX-BA-NPs after diameter evaluation with the help of image J software; Table S1: (A) Actual 23 design, (B) Matrix measure of the 23 designs, (C) ANOVA of Size based on polynomial analysis and 2FI process order method, (D) ANOVA of PDI based on polynomial analysis and 2FI process order method, (E) Constrain for analysis, (F) Solution of optimization, Table S2: Particle size and DPI average distribution analysis, Table S3: Area and mean calculation from the SEM images with the help of image J software, Table S4 (A): DTX Concentration and AUC from HPLC system after sample run, (B): B A Concentration and AUC from HPLC system after sample run, Table S5: % drug release data from HPLC for DTX and BA at pH 7.4 and 5, Table S6: DTX and BA binding energy after interaction with ligand 3L08 (PI3k gamma protein) and 4MAN (Bcl-2 protein), Table S7: % cell viability of DTX-BA-NPs on normal human bronchial epithelial cells (BEAS-2B) over a concentration range of 50–5 µM.

Author Contributions

T.S.: conceptualization, methodology, investigation, writing—original draft, writing—review and editing, validation, resource, software. P.R.: review, proof check. B.P.S.: review, proof checking, L.P.: resource, software, validation. All authors have read and agreed to the published version of the manuscript.

Funding

This research received no external funding.

Institutional Review Board Statement

No humans or animals were used during the study.

Informed Consent Statement

No personal data of individuals were used in the current study.

Data Availability Statement

The datasets generated during and/or analyzed during the current study are available from the corresponding author upon reasonable request due to privacy.

Acknowledgments

The authors would like to acknowledge the support of the CSIR-North East Institute of Science and Technology, Jorhat and the School of Pharmaceutical Sciences, Girijananda Chowdhury University for the successful completion of the work.

Conflicts of Interest

The authors have no relevant financial or non-financial interests to disclose.

Abbreviations

PLGA = Poly (lactic-co-glycolic acid), DTX = Docetaxel, BA = Betulinic Acid, PVA = Poly Vinyl Alcohol, FESEM = Field Emission Scanning Electron Microscopy, HRTEM = High-Resolution Transmitting Electron Microscopy, DOE = Design of Experiment, ANOVA = Analysis of Variance, HPLC = High-Performance Liquid Chromatography %DL = % Drug Loading %EE = % Entrapment Efficiency PDI = Poly Dispersity Index EPR = Enhanced Permeability and Retention, DLS = Direct Light Scattering RT = Retention Time, MTT = 3-(4,5-dimethylthiazol-2-yl)-2,5-diphenyl tetrazolium bromide, DAPI = 4′,6-diamidino-2-phenylindole, PI = Propidium Iodide, FITC = Fluorescein Isothiocyanate, DMEM = Dulbecco’s Modified Eagle Medium, NP = Nanoparticle, KBR = Potassium Bromide, IR = InfraRed, mg = Milligram, µg = Microgram, µL = Microliter, RPM = Rotation per Minute, PBS = Phosphate Buffer Saline, DMSO = Dimethyl Sulfoxide, h = Hours, SD = Standard Deviation.

References

  1. World Health Organization. Lung Cancer. Available online: https://www.who.int/news-room/fact-sheets/detail/lung-cancer (accessed on 24 May 2024).
  2. Woodard, G.A.; Jones, K.D.; Jablons, D.M. Lung Cancer Staging and Prognosis. Cancer Treat. Res. 2016, 170, 47–75. [Google Scholar] [CrossRef] [PubMed]
  3. Bhattacharjee, S. Craft of Co-encapsulation in Nanomedicine: A Struggle to Achieve Synergy through Reciprocity. ACS Pharmacol. Transl. Sci. 2022, 5, 278–298. [Google Scholar] [CrossRef] [PubMed]
  4. Zhao, P.; Astruc, D. Docetaxel nanotechnology in anticancer therapy. ChemMedChem 2012, 7, 952–972. [Google Scholar] [CrossRef] [PubMed]
  5. Ramaswamy, B.; Puhalla, S. Docetaxel: A tubulin-stabilizing agent approved for the management of several solid tumors. Drugs Today 2006, 42, 265–279. [Google Scholar] [CrossRef] [PubMed]
  6. Zhang, L.; Zhang, N. How nanotechnology can enhance docetaxel therapy. Int. J. Nanomed. 2013, 8, 2927–2941. [Google Scholar] [CrossRef]
  7. Sohail, M.F.; Rehman, M.; Sarwar, H.S.; Naveed, S.; Salman, O.; Bukhari, N.I.; Hussain, I.; Webster, T.J.; Shahnaz, G. Advancements in the oral delivery of Docetaxel: Challenges, current state-of-the-art and future trends. Int. J. Nanomed. 2018, 13, 3145–3161. [Google Scholar] [CrossRef]
  8. Cichewicz, R.H.; Kouzi, S.A. Chemistry, biological activity, and chemotherapeutic potential of betulinic acid for the prevention and treatment of cancer and HIV infection. Med. Res. Rev. 2004, 24, 90–114. [Google Scholar] [CrossRef] [PubMed]
  9. Mullauer, F.B.; Kessler, J.H.; Medema, J.P. Betulinic acid, a natural compound with potent anticancer effects. Anticancer Drugs 2010, 21, 215–227. [Google Scholar] [CrossRef]
  10. Zhong, Y.; Liang, N.; Liu, Y.; Cheng, M.S. Recent progress on betulinic acid and its derivatives as antitumor agents: A mini review. Chin. J. Nat. Med. 2021, 19, 641–647. [Google Scholar] [CrossRef] [PubMed]
  11. Mazayen, Z.M.; Ghoneim, A.M.; Elbatanony, R.S.; Basalious, E.B.; Bendas, E.R. Pharmaceutical Nanotechnology: From the Bench to the Market. Futur. J. Pharm. Sci. 2022, 8, 12. [Google Scholar] [CrossRef] [PubMed]
  12. Abdifetah, O.; Na-Bangchang, K. pharmacokinetic Studies of Nanoparticles as a Delivery System for Conventional Drugs and Herb-derived Compounds for Cancer Therapy: A Systematic Review. Int. J. Nanomed. 2019, 14, 5659–5677. [Google Scholar] [CrossRef] [PubMed]
  13. Renault-Mahieux, M.; Seguin, J.; Vieillard, V.; Le, D.T.; Espeau, P.; Lai-Kuen, R.; Richard, C.; Mignet, N.; Paul, M.; Andrieux, K. Co-encapsulation of fisetin and cisplatin into liposomes: Stability considerations and in vivo efficacy on lung cancer animal model. Int. J. Pharm. 2024, 651, 123744. [Google Scholar] [CrossRef] [PubMed]
  14. Basu, S.M.; Yadava, S.K.; Singh, R.; Giri, J. Lipid nanocapsules co-encapsulating paclitaxel and salinomycin for eradicating breast cancer and cancer stem cells. Colloids Surf. B Biointerfaces 2021, 204, 111775. [Google Scholar] [CrossRef] [PubMed]
  15. Wu, T.; Qiao, Q.; Qin, X.; Zhang, D.; Zhang, Z. Immunostimulatory cytokine and doxorubicin co-loaded nanovesicles for cancer immunochemotherapy. Nanomedicine 2019, 18, 66–77. [Google Scholar] [CrossRef]
  16. Anees, M.; Mehrotra, N.; Tiwari, S.; Kumar, D.; Kharbanda, S.; Singh, H. Polylactic acid based biodegradable hybrid block copolymeric nanoparticle mediated co-delivery of salinomycin and doxorubicin for cancer therapy. Int. J. Pharm. 2023, 635, 122779. [Google Scholar] [CrossRef]
  17. Maniam, G.; Mai, C.W.; Zulkefeli, M.; Fu, J.Y. Co-encapsulation of gemcitabine and tocotrienols in nanovesicles enhanced efficacy in pancreatic cancer. Nanomedicine 2021, 16, 373–389. [Google Scholar] [CrossRef] [PubMed]
  18. Garcia-Diaz, M.; Foged, C.; Nielsen, H.M. Improved insulin loading in poly(lactic-co-glycolic) acid (PLGA) nanoparticles upon self-assembly with lipids. Int. J. Pharm. 2015, 482, 84–91. [Google Scholar] [CrossRef] [PubMed]
  19. Van Herck, S.; De Geest, B.G. Nanomedicine-mediated Alteration of the Pharmacokinetic Profile of Small Molecule Cancer Immunotherapeutics. Acta Pharma Sin. 2020, 41, 881–894. [Google Scholar] [CrossRef] [PubMed]
  20. Bhattacharya, S.; Mondal, L.; Mukherjee, B.; Dutta, L.; Ehsan, I.; Debnath, M.C.; Gaonkar, R.H.; Pal, M.M.; Majumdar, S. Apigenin loaded nanoparticle delayed development of hepatocellular carcinoma in rats. Nanomedicine 2018, 14, 1905–1917. [Google Scholar] [CrossRef] [PubMed]
  21. Moore, T.L.; Rodriguez-Lorenzo, L.; Hirsch, V.; Balog, S.; Urban, D.; Jud, C.; Rothen-Rutishauser, B.; Lattuada, M.; Petri-Fink, A. Nanoparticle Colloidal Stability in Cell Culture Media and Impact on Cellular Interactions. Chem. Soc. Rev. 2015, 44, 6287–6305. [Google Scholar] [CrossRef]
  22. Patowary, L.; Borthakur, M.S. Computational studies of Bridelia retusa phytochemicals for the identification of promising molecules with inhibitory potential against the spike protein and papain-like protease of SARS-CoV-2. Sci. Phytochem. 2022, 1, 29–41. [Google Scholar] [CrossRef]
  23. Zothantluanga, J.H.; Umar, A.K.; Ali Eltayb, W.; Patowary, L.; Borthakur, M.S.; Tayeng, D.; Chetia, D. An In-Silico Investigation on the Molecular Interactions between Ellagic Acid and PfDHFR-TS. Polycycl. Aromat. Compd. 2023, 44, 4081–4102. [Google Scholar] [CrossRef]
  24. Sabit, H.; Abdel-Hakeem, M.; Shoala, T.; Abdel-Ghany, S.; Abdel-Latif, M.M.; Almulhim, J.; Mansy, M. Nanocarriers: A Reliable Tool for the Delivery of Anticancer Drugs. Pharmaceutics 2022, 14, 1566. [Google Scholar] [CrossRef]
  25. Nirmala, M.J.; Kizhuveetil, U.; Johnson, A.; Balaji, G.; Nagarajan, R.; Muthuvijayan, V. Cancer Nanomedicine: A Review of Nano-therapeutics and Challenges Ahead. RSC Adv. 2023, 13, 8606–8629. [Google Scholar] [CrossRef] [PubMed]
  26. Rezvantalab, S.; Drude, N.I.; Moraveji, M.K.; Güvener, N.; Koons, E.K.; Shi, Y.; Lammers, T.; Kiessling, F. Plga-based Nanoparticles in Cancer Treatment. Front. Pharmacol. 2018, 9, 1260. [Google Scholar] [CrossRef] [PubMed]
  27. Sharma, A.; Shambhwani, D.; Pandey, S.; Singh, J.; Lalhlenmawia, H.; Kumarasamy, M.; Singh, S.K.; Chellappan, D.K.; Gupta, G.; Prasher, P.; et al. Advances in Lung Cancer Treatment Using Nanomedicines. ACS Omega 2023, 8, 10–41. [Google Scholar] [CrossRef] [PubMed]
  28. Dogra, P.; Butner, J.D.; Chuang, Y.L.; Caserta, S.; Goel, S.; Brinker, C.J.; Cristini, V.; Wang, Z. Mathematical modeling in cancer nanomedicine: A review. Biomed. Microdevices 2019, 21, 40. [Google Scholar] [CrossRef]
  29. Wroblewska-Luczka, P.; Cabaj, J.; Bak, W.; Bargiel, J.; Grabarska, A.; Goralczyk, A.; Luszczki, J.J. Additive Interactions between Betulinic Acid and Two Taxanes in In Vitro Tests against Four Human Malignant Melanoma Cell Lines. Int. J. Mol. Sci. 2022, 23, 9641. [Google Scholar] [CrossRef] [PubMed]
  30. Zhang, T.; Chen, Y.; Ge, Y.; Hu, Y.; Li, M.; Jin, Y. Inhalation treatment of primary lung cancer using liposomal curcumin dry powder inhalers. Acta Pharm. Sin. B 2018, 8, 440–448. [Google Scholar] [CrossRef]
  31. Hirota, K.; Ter, H. Endocytosis of Particle Formulations by Macrophages and Its Application to Clinical Treatment. Molecular Regul. Endocytosis 2012, 1, 413–428. [Google Scholar] [CrossRef]
  32. Thome, M.P.; Filippi-Chiela, E.C.; Villodre, E.S.; Migliavaca, C.B.; Onzi, G.R.; Felipe, K.B.; Lenz, G. Ratiometric analysis of Acridine Orange staining in the study of acidic organelles and autophagy. J. Cell Sci. 2016, 129, 4622–4632. [Google Scholar] [CrossRef] [PubMed]
  33. Miyanaga, S.; Ninomiya, I.; Tsukada, T.; Okamoto, K.; Harada, S.; Nakanuma, S.; Sakai, S.; Makino, I.; Kinoshita, J.; Hayashi, H.; et al. Concentration-dependent radiosensitizing effect of docetaxel in esophageal squamous cell carcinoma cells. Int. J. Oncol. 2016, 48, 517–524. [Google Scholar] [CrossRef] [PubMed]
  34. Baishya, R.; Nayak, D.K.; Kumar, D.; Sinha, S.; Gupta, A.; Ganguly, S.; Debnath, M.C. Ursolic Acid Loaded PLGA Nanoparticles: In vitro and in vivo Evaluation to Explore Tumor Targeting Ability on B16F10 Melanoma Cell Lines. Pharm. Res. 2016, 33, 2691–2703. [Google Scholar] [CrossRef] [PubMed]
  35. El-Khadragy, M.F.; Nabil, H.M.; Hassan, B.N.; Tohamy, A.A.; Waaer, H.F.; Yehia, H.M.; Alharbi, A.M.; Moneim, A.E.A. Bone Marrow Cell Therapy on 1,2-Dimethylhydrazine (DMH)-Induced Colon Cancer in Rats. Cell Physiol. Biochem. 2018, 45, 1072–1083. [Google Scholar] [CrossRef] [PubMed]
  36. Shaw, T.K.; Mandal, D.; Dey, G.; Pal, M.M.; Paul, P.; Chakraborty, S.; Ali, K.A.; Mukherjee, B.; Bandyopadhyay, A.K.; Mandal, M. Successful delivery of docetaxel to rat brain using experimentally developed nanoliposome: A treatment strategy for brain tumor. Drug Deliv. 2017, 24, 346–357. [Google Scholar] [CrossRef] [PubMed]
  37. Zhao, G.; Yan, W.; Cao, D. Simultaneous determination of betulin and betulinic acid in white birch bark using RP-HPLC. J. Pharm. Biomed. Anal. 2007, 43, 959–962. [Google Scholar] [CrossRef]
  38. Aluigi, A.; Ballestri, M.; Guerrini, A.; Sotgiu, G.; Ferroni, C.; Corticelli, F.; Gariboldi, M.B.; Monti, E.; Varchi, G. Organic solvent-free preparation of keratin nanoparticles as doxorubicin carriers for antitumour activity. Mater Sci. Eng. C Mater. Biol. Appl. 2018, 90, 476–484. [Google Scholar] [CrossRef]
  39. Dutta, D.; Paul, B.; Mukherjee, B.; Mondal, L.; Sen, S.; Chowdhury, C.; Debnath, M.C. Nanoencapsulated betulinic acid analogue distinctively improves colorectal carcinoma in vitro and in vivo. Sci. Rep. 2019, 9, 11506. [Google Scholar] [CrossRef]
  40. Adan, A.; Kiraz, Y.; Baran, Y. Cell Proliferation and Cytotoxicity Assays. Curr. Pharm. Biotechnol. 2016, 17, 1213–1221. [Google Scholar] [CrossRef]
  41. Paul, B.; Gaonkar, R.H.; Mukhopadhyay, R.; Ganguly, S.; Debnath, M.C.; Mukherjee, B. Garcinol-loaded novel cationic nanoliposomes: In vitro and in vivo study against B16F10 melanoma tumor model. Nanomedicine 2019, 14, 2045–2065. [Google Scholar] [CrossRef] [PubMed]
  42. Chou, T.-C. Drug Combination Studies and Their Synergy Quantification Using the Chou-talalay Method. Cancer Res. 2010, 70, 440–446. [Google Scholar] [CrossRef] [PubMed]
  43. Saneja, A.; Kumar, R.; Mintoo, M.J.; Dubey, R.D.; Sangwan, P.L.; Mondhe, D.M.; Panda, A.K.; Gupta, P.N. Gemcitabine and betulinic acid co-encapsulated PLGA-PEG polymer nanoparticles for improved efficacy of cancer chemotherapy. Mater. Sci. Eng. C Mater. Biol. Appl. 2019, 98, 764–771. [Google Scholar] [CrossRef] [PubMed]
  44. Wang, R.; Yang, M.; Li, G.; Wang, X.; Zhang, Z.; Qiao, H.; Chen, J.; Chen, Z.; Cui, X.; Li, J. Paclitaxel-betulinic acid hybrid nanosuspensions for enhanced anti-breast cancer activity. Colloids Surf. B Biointerfaces 2019, 174, 270–279. [Google Scholar] [CrossRef] [PubMed]
  45. Kazemi, M.; Emami, J.; Hasanzadeh, F.; Minaiyan, M.; Mirian, M.; Lavasanifar, A. Development of a RP-HPLC method for analysis of docetaxel in tumor-bearing mice plasma and tissues following injection of docetaxel-loaded pH responsive targeting polymeric micelles. Res. Pharm. Sci. 2020, 15, 1–13. [Google Scholar] [CrossRef] [PubMed]
Figure 1. Determinates of cancer drug resistance and possible ways to overcome it.
Ddc 03 00033 g001
Figure 2. (A) Effect of independent variables (polyvinyl alcohol) PVA concentration (A) and sonication time (B) on dependent variable Size (Y1), (B) effect of independent variables PVA concentration (A) and ultrasonic frequency (C) on dependent variable Size (Y1), (C) effect of independent variables sonication time (B) and ultrasonic frequency (C) on dependent variable Size (Y1), (D) effect of independent variables PVA concentration (A) and sonication time (B) on dependent variable Size (Y2), (E) effect of independent variables PVA concentration (A) and ultrasonic frequency (C) on dependent variable Size (Y2), (F) effect of independent variables sonication time (B) and ultrasonic frequency (C) on dependent variable Size (Y2). (G) Perturbation plot to show all the actual factors based on optimized selection, (H) overlay plot for optimization of actual factor C based on A and B, (I) overlay plot for optimization of actual factor B based on A and C, (J) overlay plot for optimization of actual factor A based on B and C.
Ddc 03 00033 g002aDdc 03 00033 g002bDdc 03 00033 g002cDdc 03 00033 g002dDdc 03 00033 g002e
Figure 3. Fourier transform infrared spectral analysis of Poly(lactic-co-glycolic acid) (PLGA), Docetaxel (DTX), Nanoparticle (NP), Betulinic acid (BA), and physical mixture (PM) of drug and excipient.
Ddc 03 00033 g003
Figure 4. (A) Dynamic light scattering (DLS) spectrum for size and poly dispersity index (PDI) for optimized DTX-BA-NP, (B) DLS spectrum for zeta potential for optimized DTX-BA-NP.
Ddc 03 00033 g004aDdc 03 00033 g004b
Figure 5. (A) Scanning electron microscopy (SEM) images of DTX-BA-NPs at 130 KX magnification with scale at 100 nm; (B) distribution of DTX-BA-NPs from SEM image in terms of mean diameter (nm) vs. area plotted and calculated with image J software, version 1.54j; (C) Transmission electron microscopy (TEM) photographs of optimized DTX-BA-NPs at a magnification of 35,000× with scale bar 50 nm; (D) TEM photographs of optimized DTX-BA-NPs at a magnification of 40,000× with scale bar 20 nm.
Ddc 03 00033 g005
Figure 6. (A) DTX high performance liquid chromatography (HPLC) spectra with water/acetonitrile (can) (55/45 v/v) with 10 min run and RT at 7.5 min, (B) BA HPLC spectra with water/ACN (10/90 v/v) with 10 min run with RT at 4.7 min, (C) linearity curve of DTX with 10–400 mg/mL concentration range, (D) linearity curve of BA with 10–400 mg/mL concentration range.
Ddc 03 00033 g006aDdc 03 00033 g006bDdc 03 00033 g006c
Figure 7. Drug release (%) curve of DTX and BA at pH 7.4 and pH 5 including initial burst release.
Ddc 03 00033 g007
Figure 8. Graphical representation for comparison of size (nm) and potential (mv) from fresh NPs to NPs stored for 3 months.
Ddc 03 00033 g008
Figure 9. IC50 value comparison of free DTX and BA, BA-NPs, DTX-NPs, and DTX-BA-NPs with MTT assay at 24, 48, and 72 h.
Ddc 03 00033 g009
Figure 10. DAPI and PI dual staining. Fluorescence microscopy images of A549 cells after treatment with DTX-BA-NPs followed by staining with DAPI (300 ng/mL) and PI (4 μg/mL); scale bar represents 20 µM.
Ddc 03 00033 g010
Figure 11. (A) Cellular uptake study. Confocal microscopy images of A549 cells after treatment with FITC-DTX-BA-NPs for 1 h, 4 h, and 8 h, respectively. Scale bar represents 20 μM. (B) Flow cytometry analysis representing the distribution of FITC-DTX-BA-NPs in A549 cells after treating them for 1, 4, and 8 h.
Ddc 03 00033 g011
Figure 12. (A) Induction of apoptosis in A549 cells by DTX-BA-NPs after treating them for 12 h, 24 h, and 48 h, (B) cell cycle analysis in A549 cells by DTX-BA-NPs after treating them for 0 h, 12 h, 24 h, and 48 h.
Ddc 03 00033 g012
Figure 13. (A) Molecular interaction of DTX with ligand 4MAN (Bcl-2 Protein) showing hydrophobic interaction, (B) molecular interaction of BA with ligand 4MAN (Bcl-2 Protein) showing hydrophobic interaction, (C) molecular interaction of DTX with ligand 3L08 (PI3K gamma Protein) showing hydrophobic interaction, (D) molecular interaction of BA with ligand 3L08 (PI3K gamma Protein) showing hydrophobic interaction.
Ddc 03 00033 g013
Figure 14. Depiction of preparation process of DTX-BA-NPs.
Ddc 03 00033 g014
Table 1. Parameters and correlation coefficients of empirical kinetic models.
Release ConditionZero Order ReleaseFirst OrderHiguchi Model
K0C0R2KfR2KHCHR2
pH 7.48.425.360.66210.2780.871112.533.10.9688
pH 59.725.960.66430.2920.898715.812.210.9447
Table 2. Parameters and correlation coefficients of non-empirical kinetic models.
Release ConditionKorsmeyer-PeppasPeppas-Sahlin
KKPnR2K1K2R2|K1|/|K2|
pH 7.415.430.380.999518.72−5.120.99995.75
pH 515.640.290.989722.87−6.80.99855.41
Table 3. Stability study values for NPs from fresh to 3 months.
Size (nm)Zeta Potential (mV)
Fresh NPs141.02 ± 4.21−24.23 ± 1.11
After 1 Month141.27 ± 3.27−24.84 ± 1.21
After 2 Month142.21 ± 3.81−23.81 ± 0.82
After 3 Month142.91 ± 4.31−24.62 ± 1.73
Table 4. IC50 values of Free DTX and BA, BA-NPs, DTX-NPs, and DTX-BA-NPs determined by MTT assay for 24, 48, and 72 h.
Time
(h)
Free DTXFree BABA-NPsDTX-NPsDTX-BA-NPs
IC50 (µmol)
2411.21 ± 0.11112.47 ± 0.2344.32 ± 0.129.81 ± 0.126.43 ± 0.11
487.43 ± 0.02103.45 ± 0. 1736.81± 0.146.65 ± 0.254.21 ± 0.32
724.25 ± 0.0481.47 ± 0.0827.42 ± 0.174.47 ± 0.171.17 ± 0.23
Table 5. Factorial design parameters and experimental conditions.
Independent VariableLevel Used, Actual (Coded)
Low (−1)High (+1)
PVA concentration0.1% (w/v)0.5% (w/v)
Sonication time8 Min12 Min
Frequency50 Hz70 Hz
Disclaimer/Publisher’s Note: The statements, opinions and data contained in all publications are solely those of the individual author(s) and contributor(s) and not of MDPI and/or the editor(s). MDPI and/or the editor(s) disclaim responsibility for any injury to people or property resulting from any ideas, methods, instructions or products referred to in the content.

