
Study of the Effects of Novel Analogs of Calebin-A on Melanogenesis


Abstract
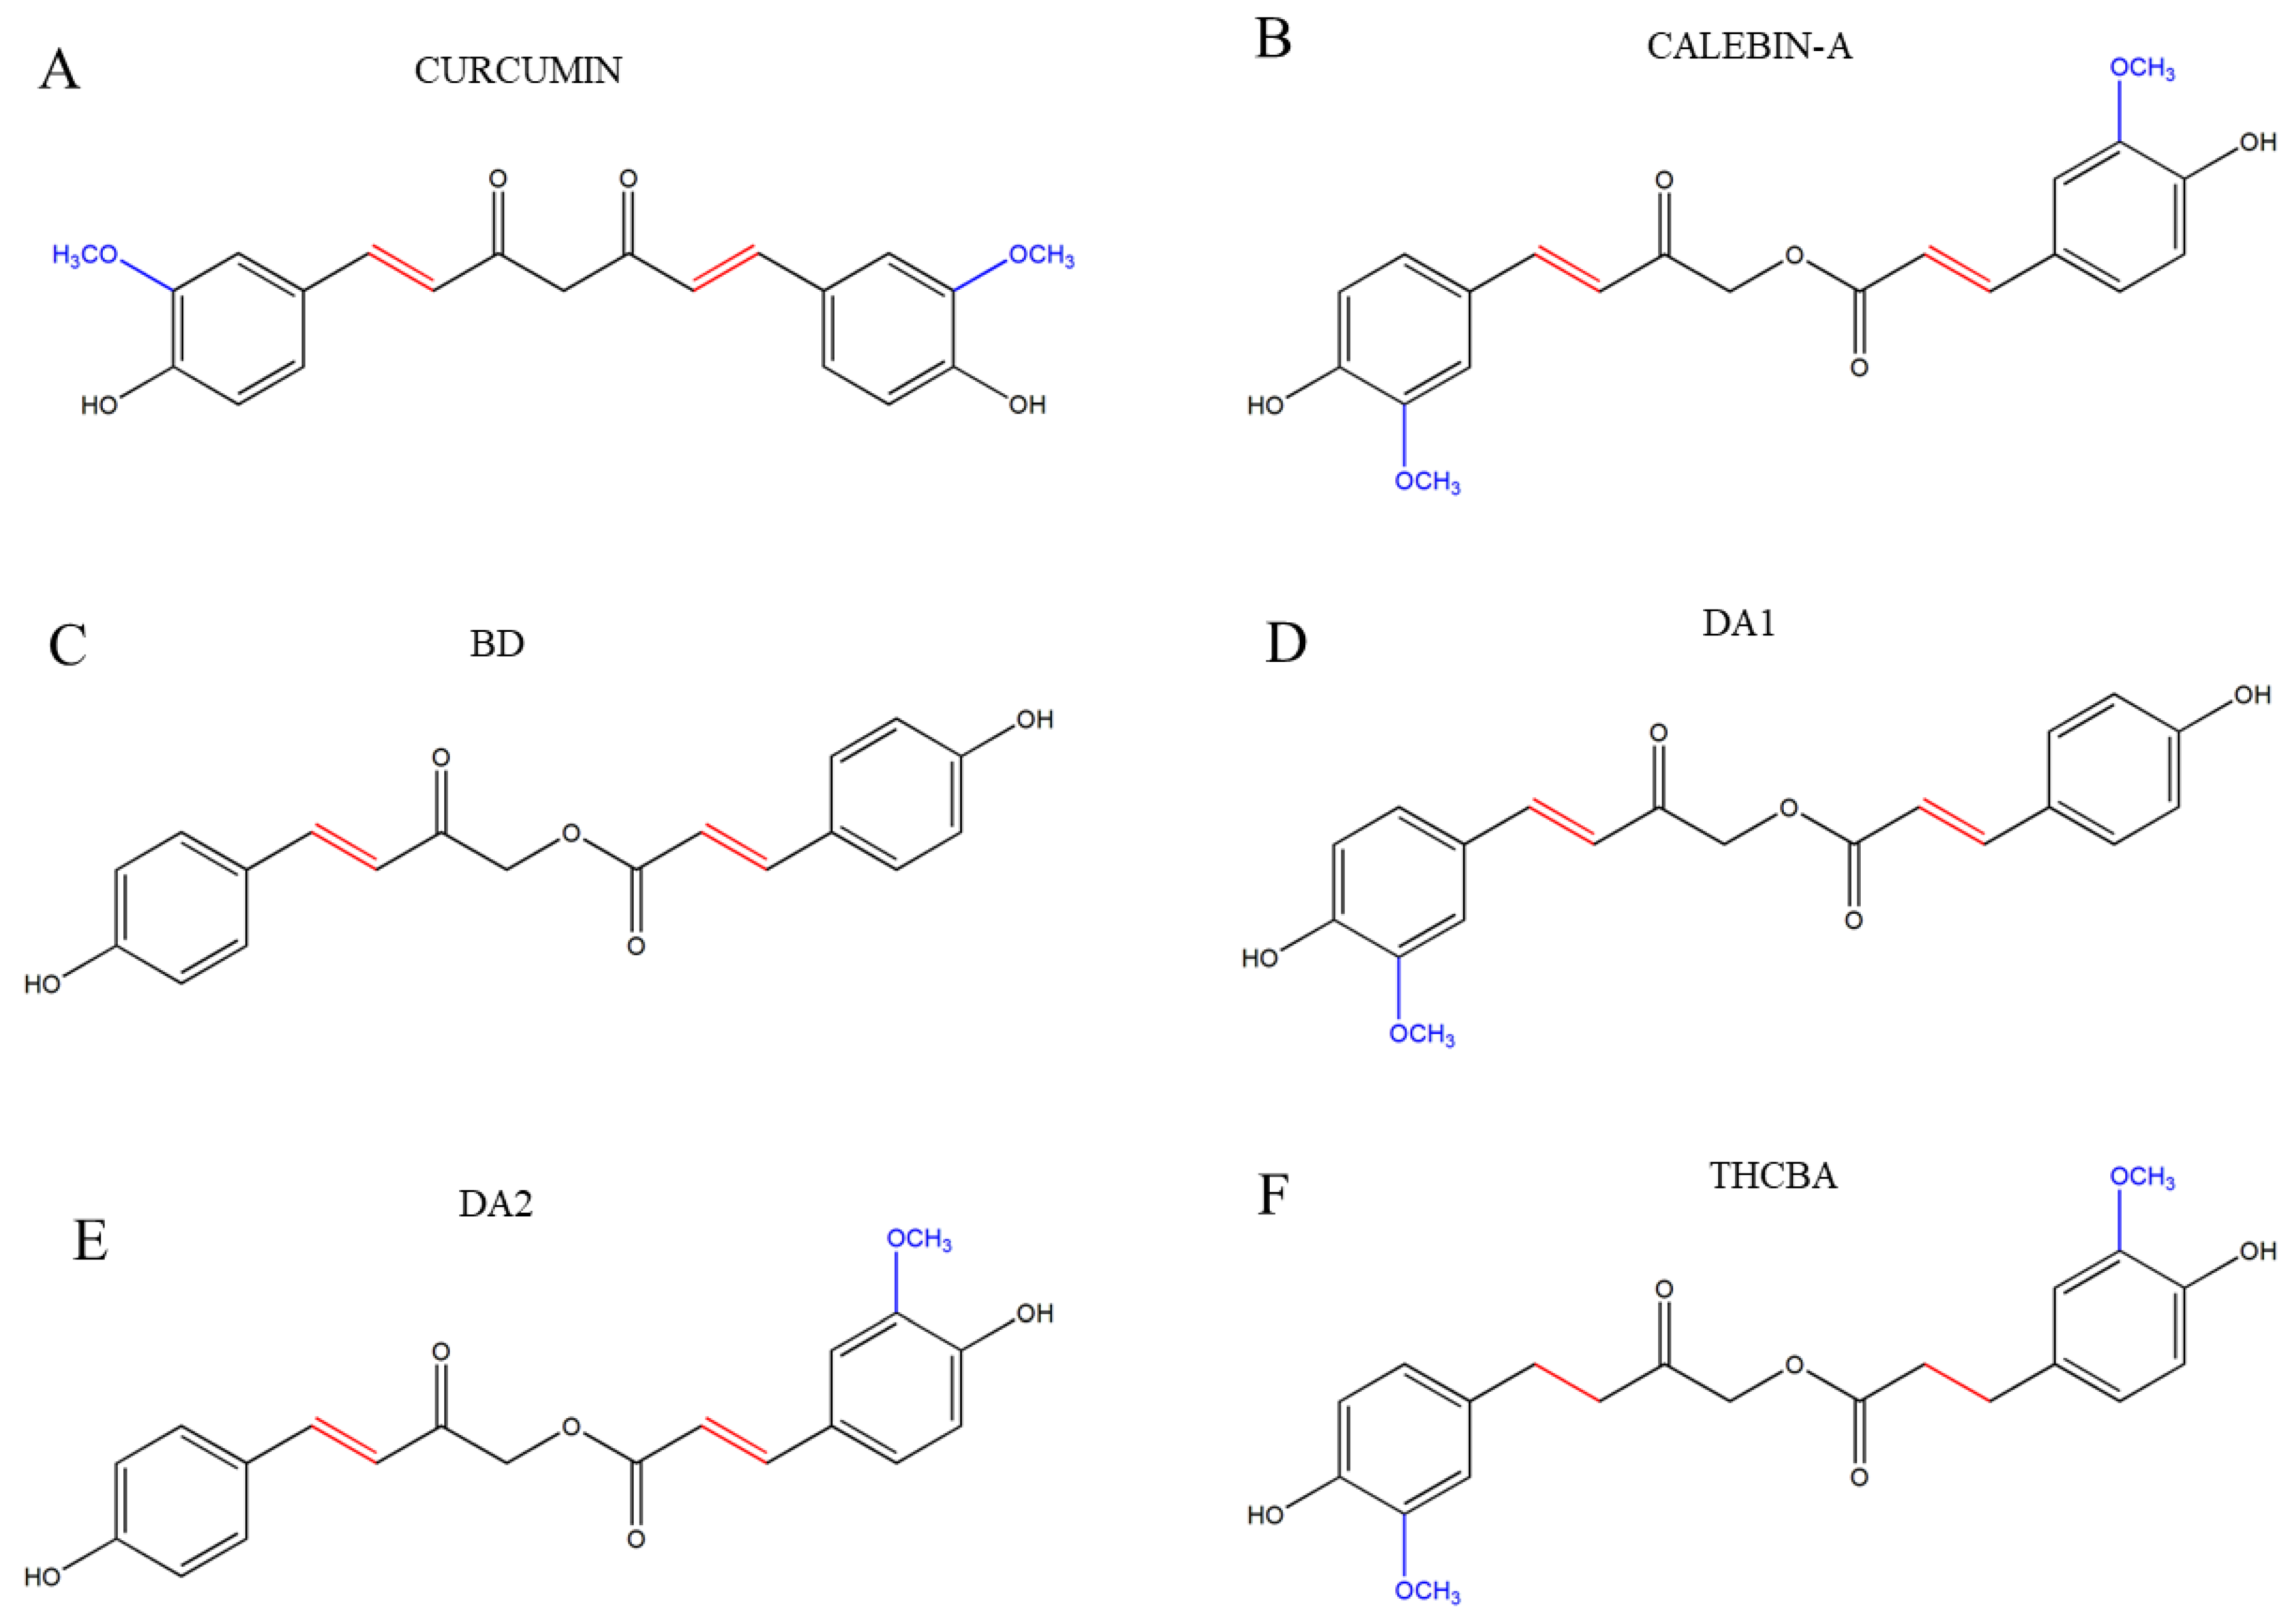
1. Introduction
2. Results
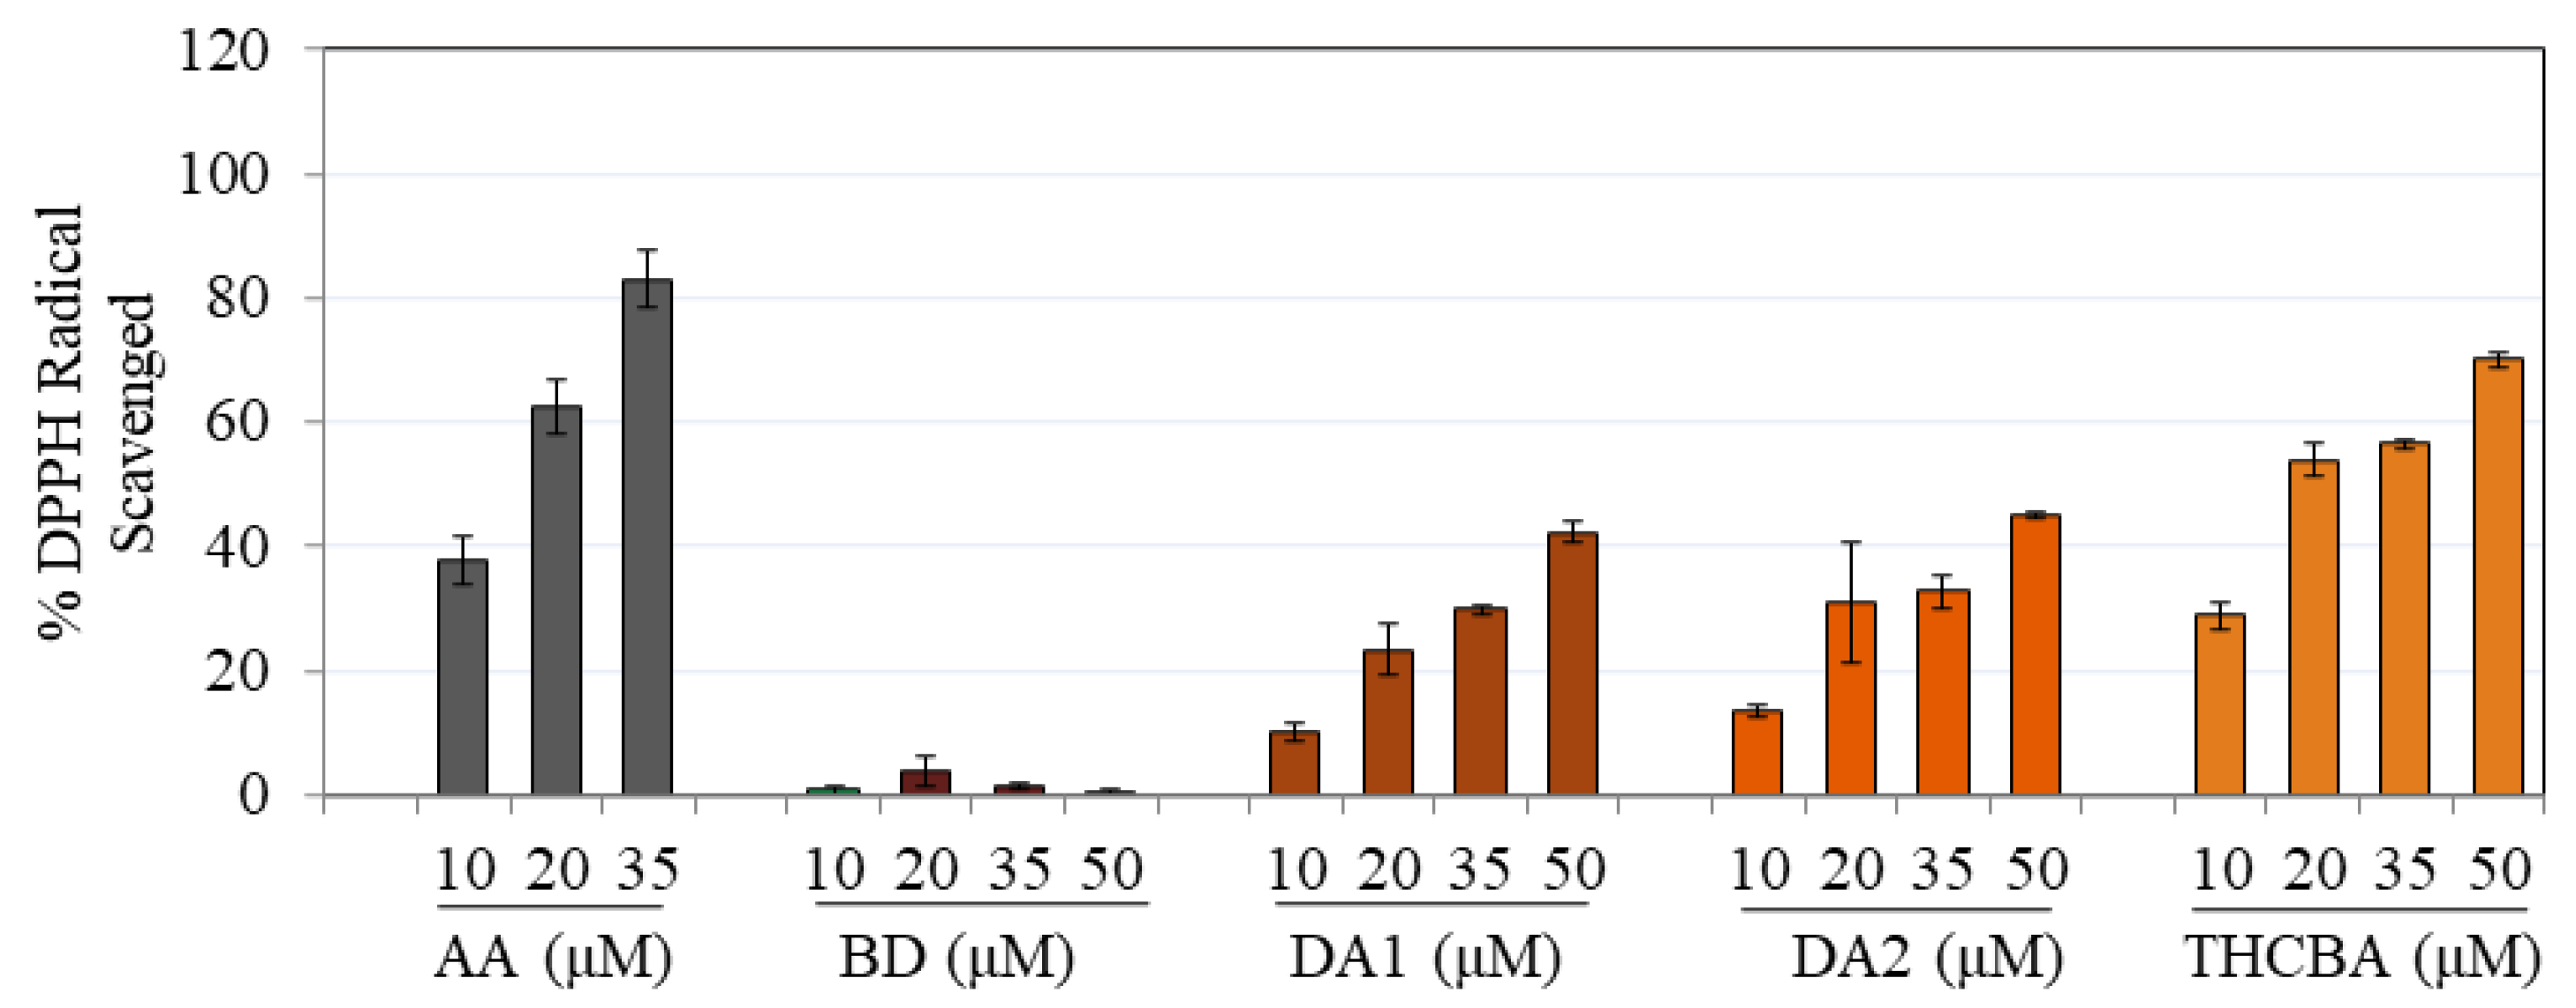
2.1. Effects of CBA Analogs on Antioxidant Activity
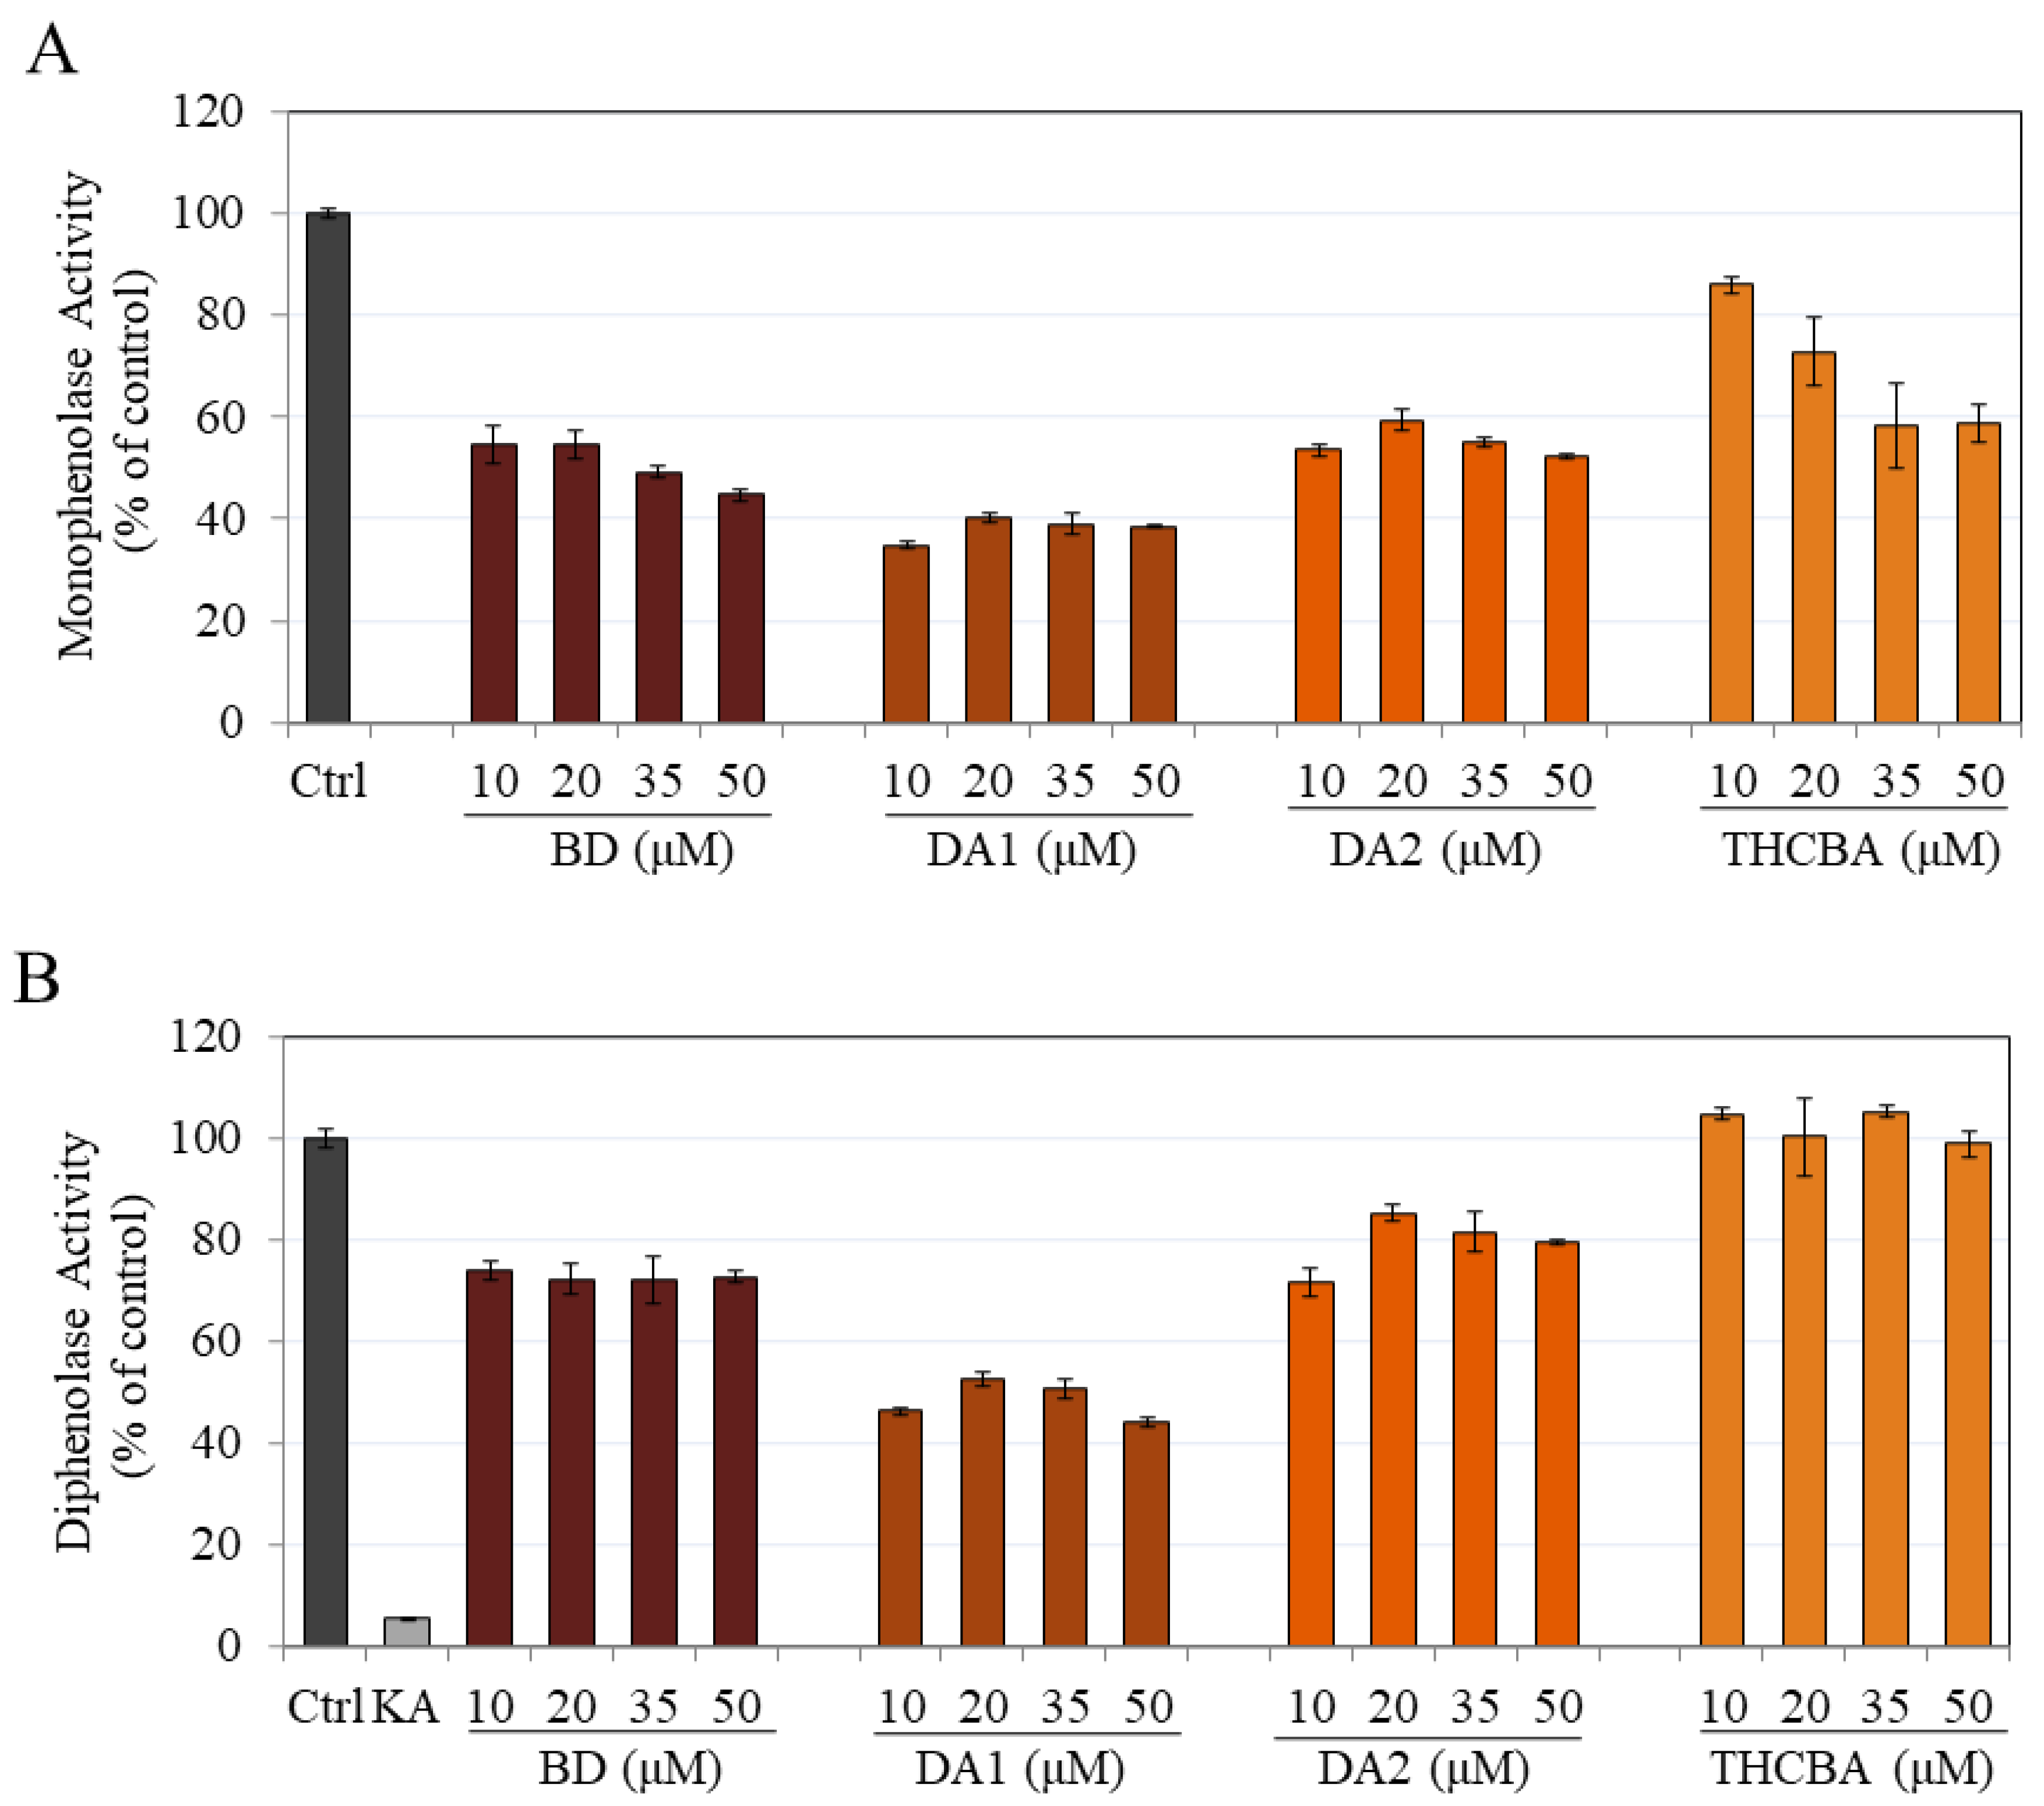
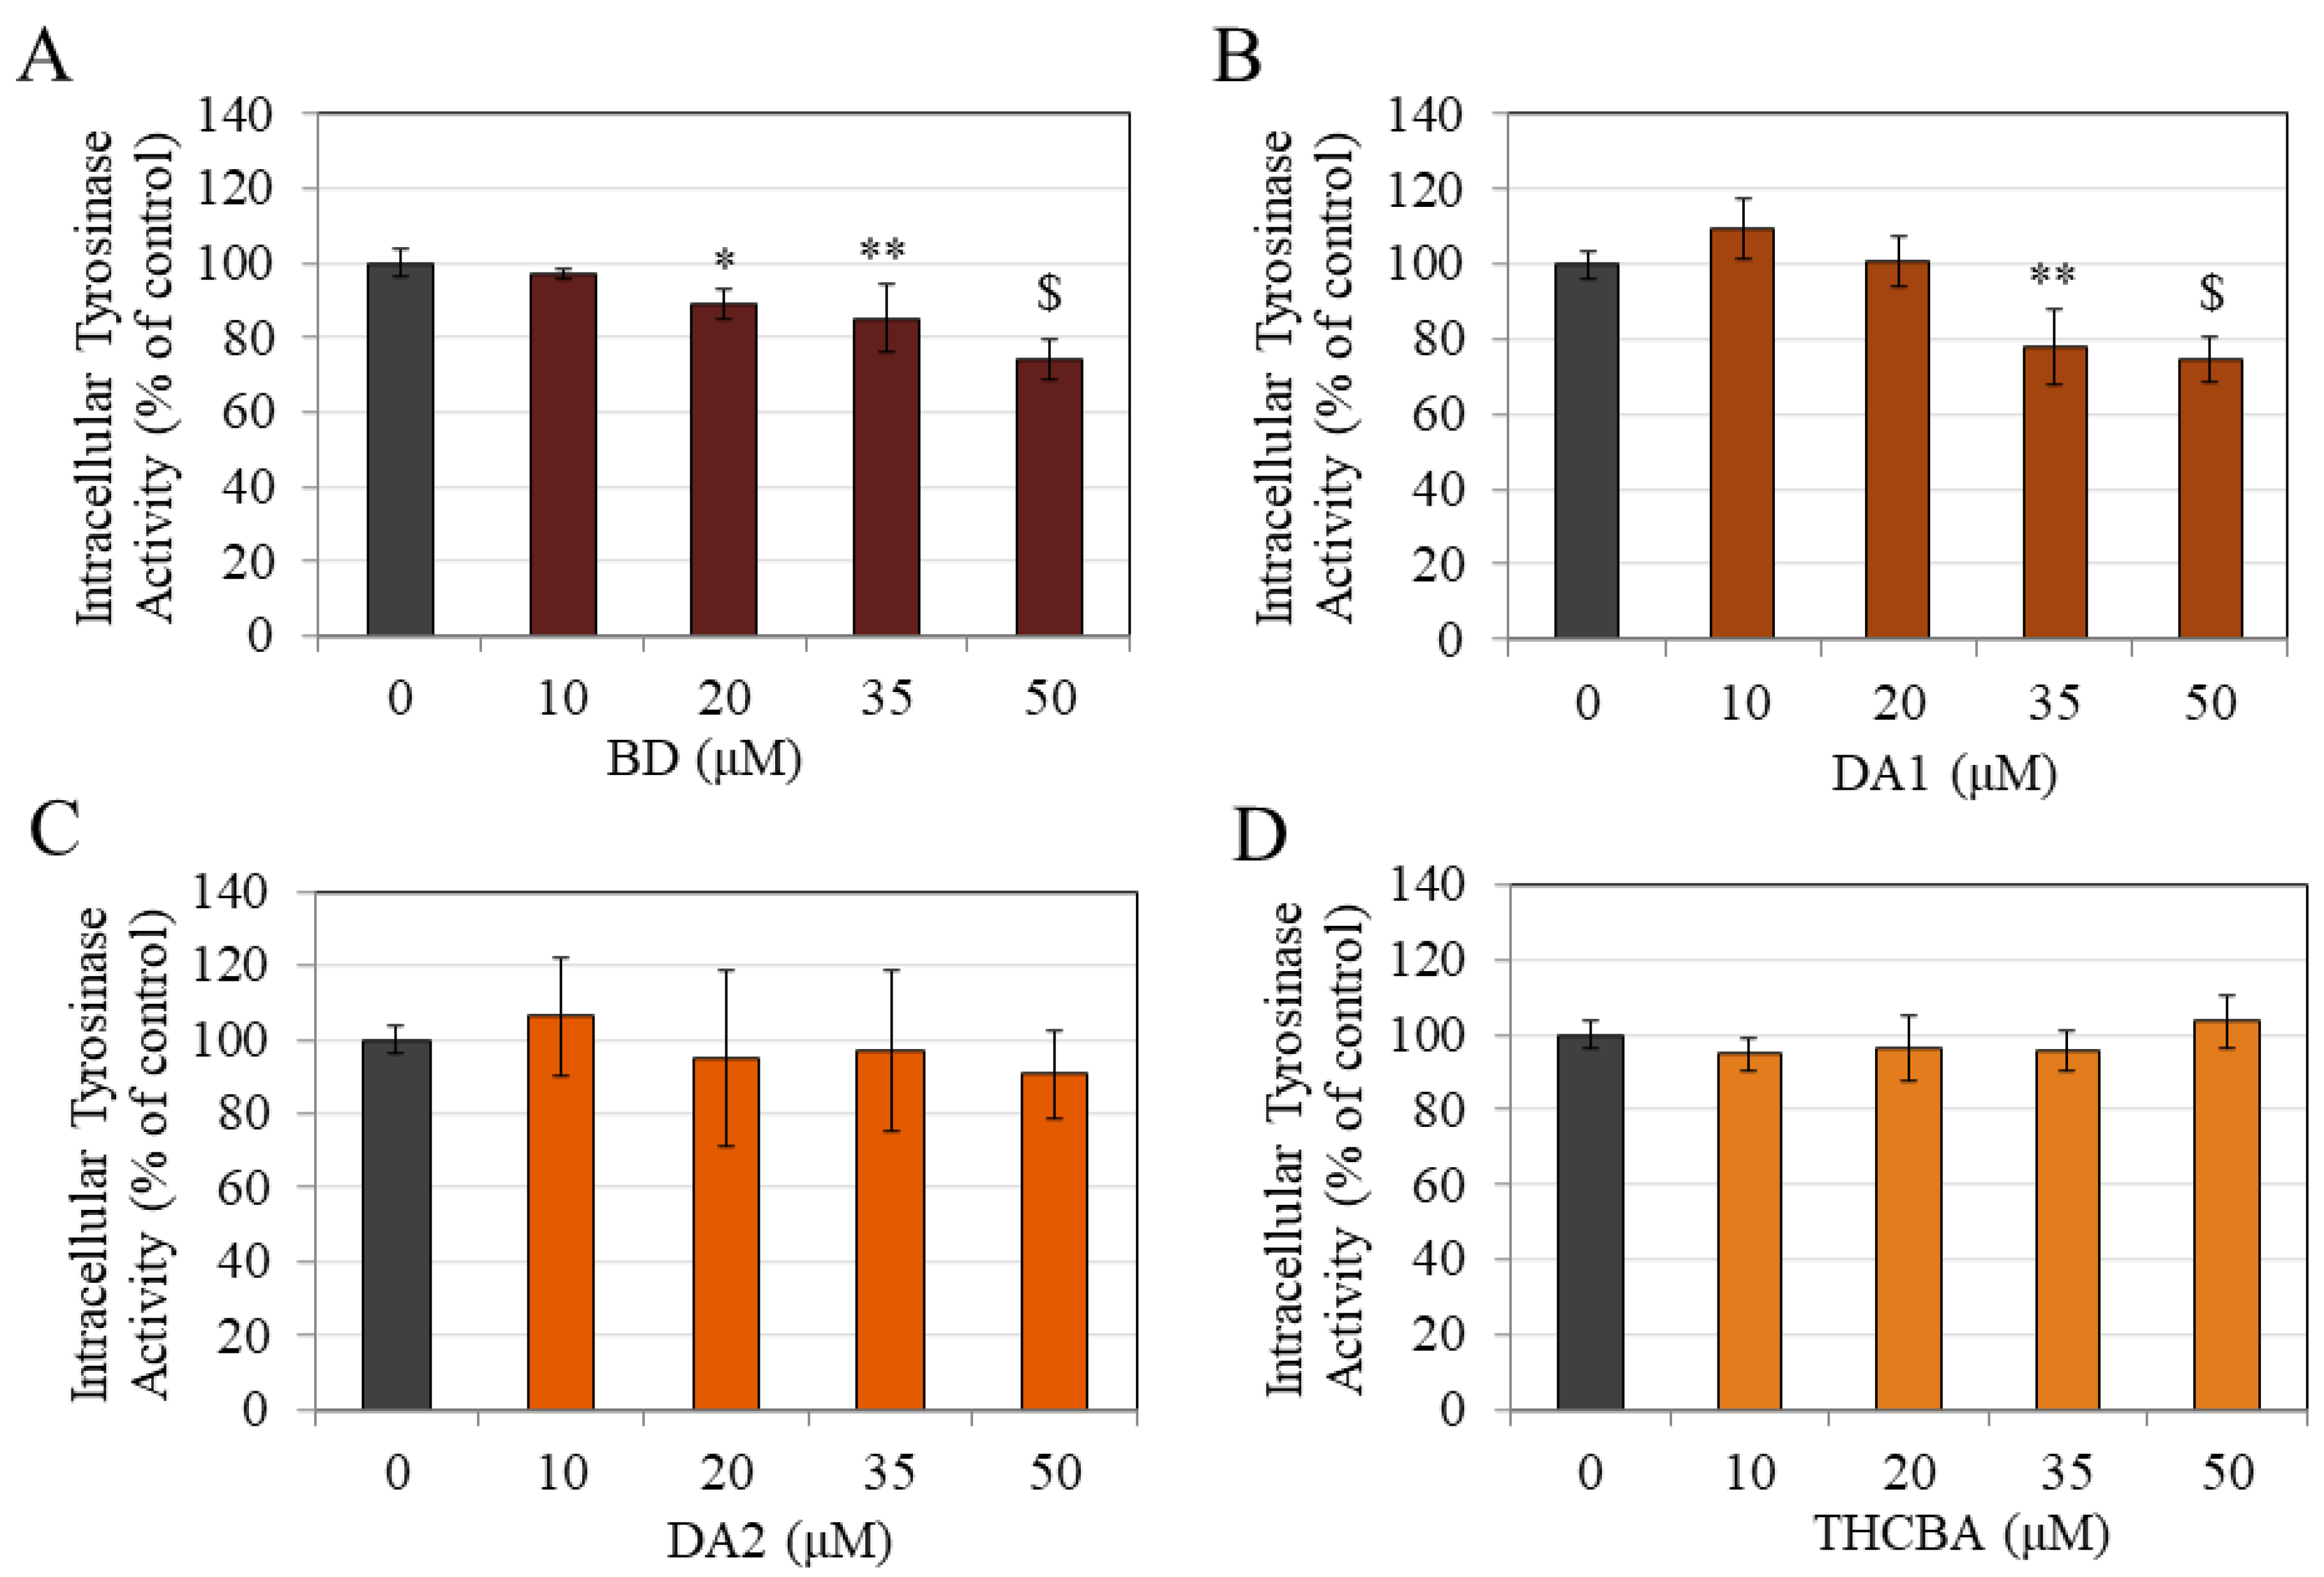
2.2. Effects of CBA Analogs on Mushroom Tyrosinase Activity
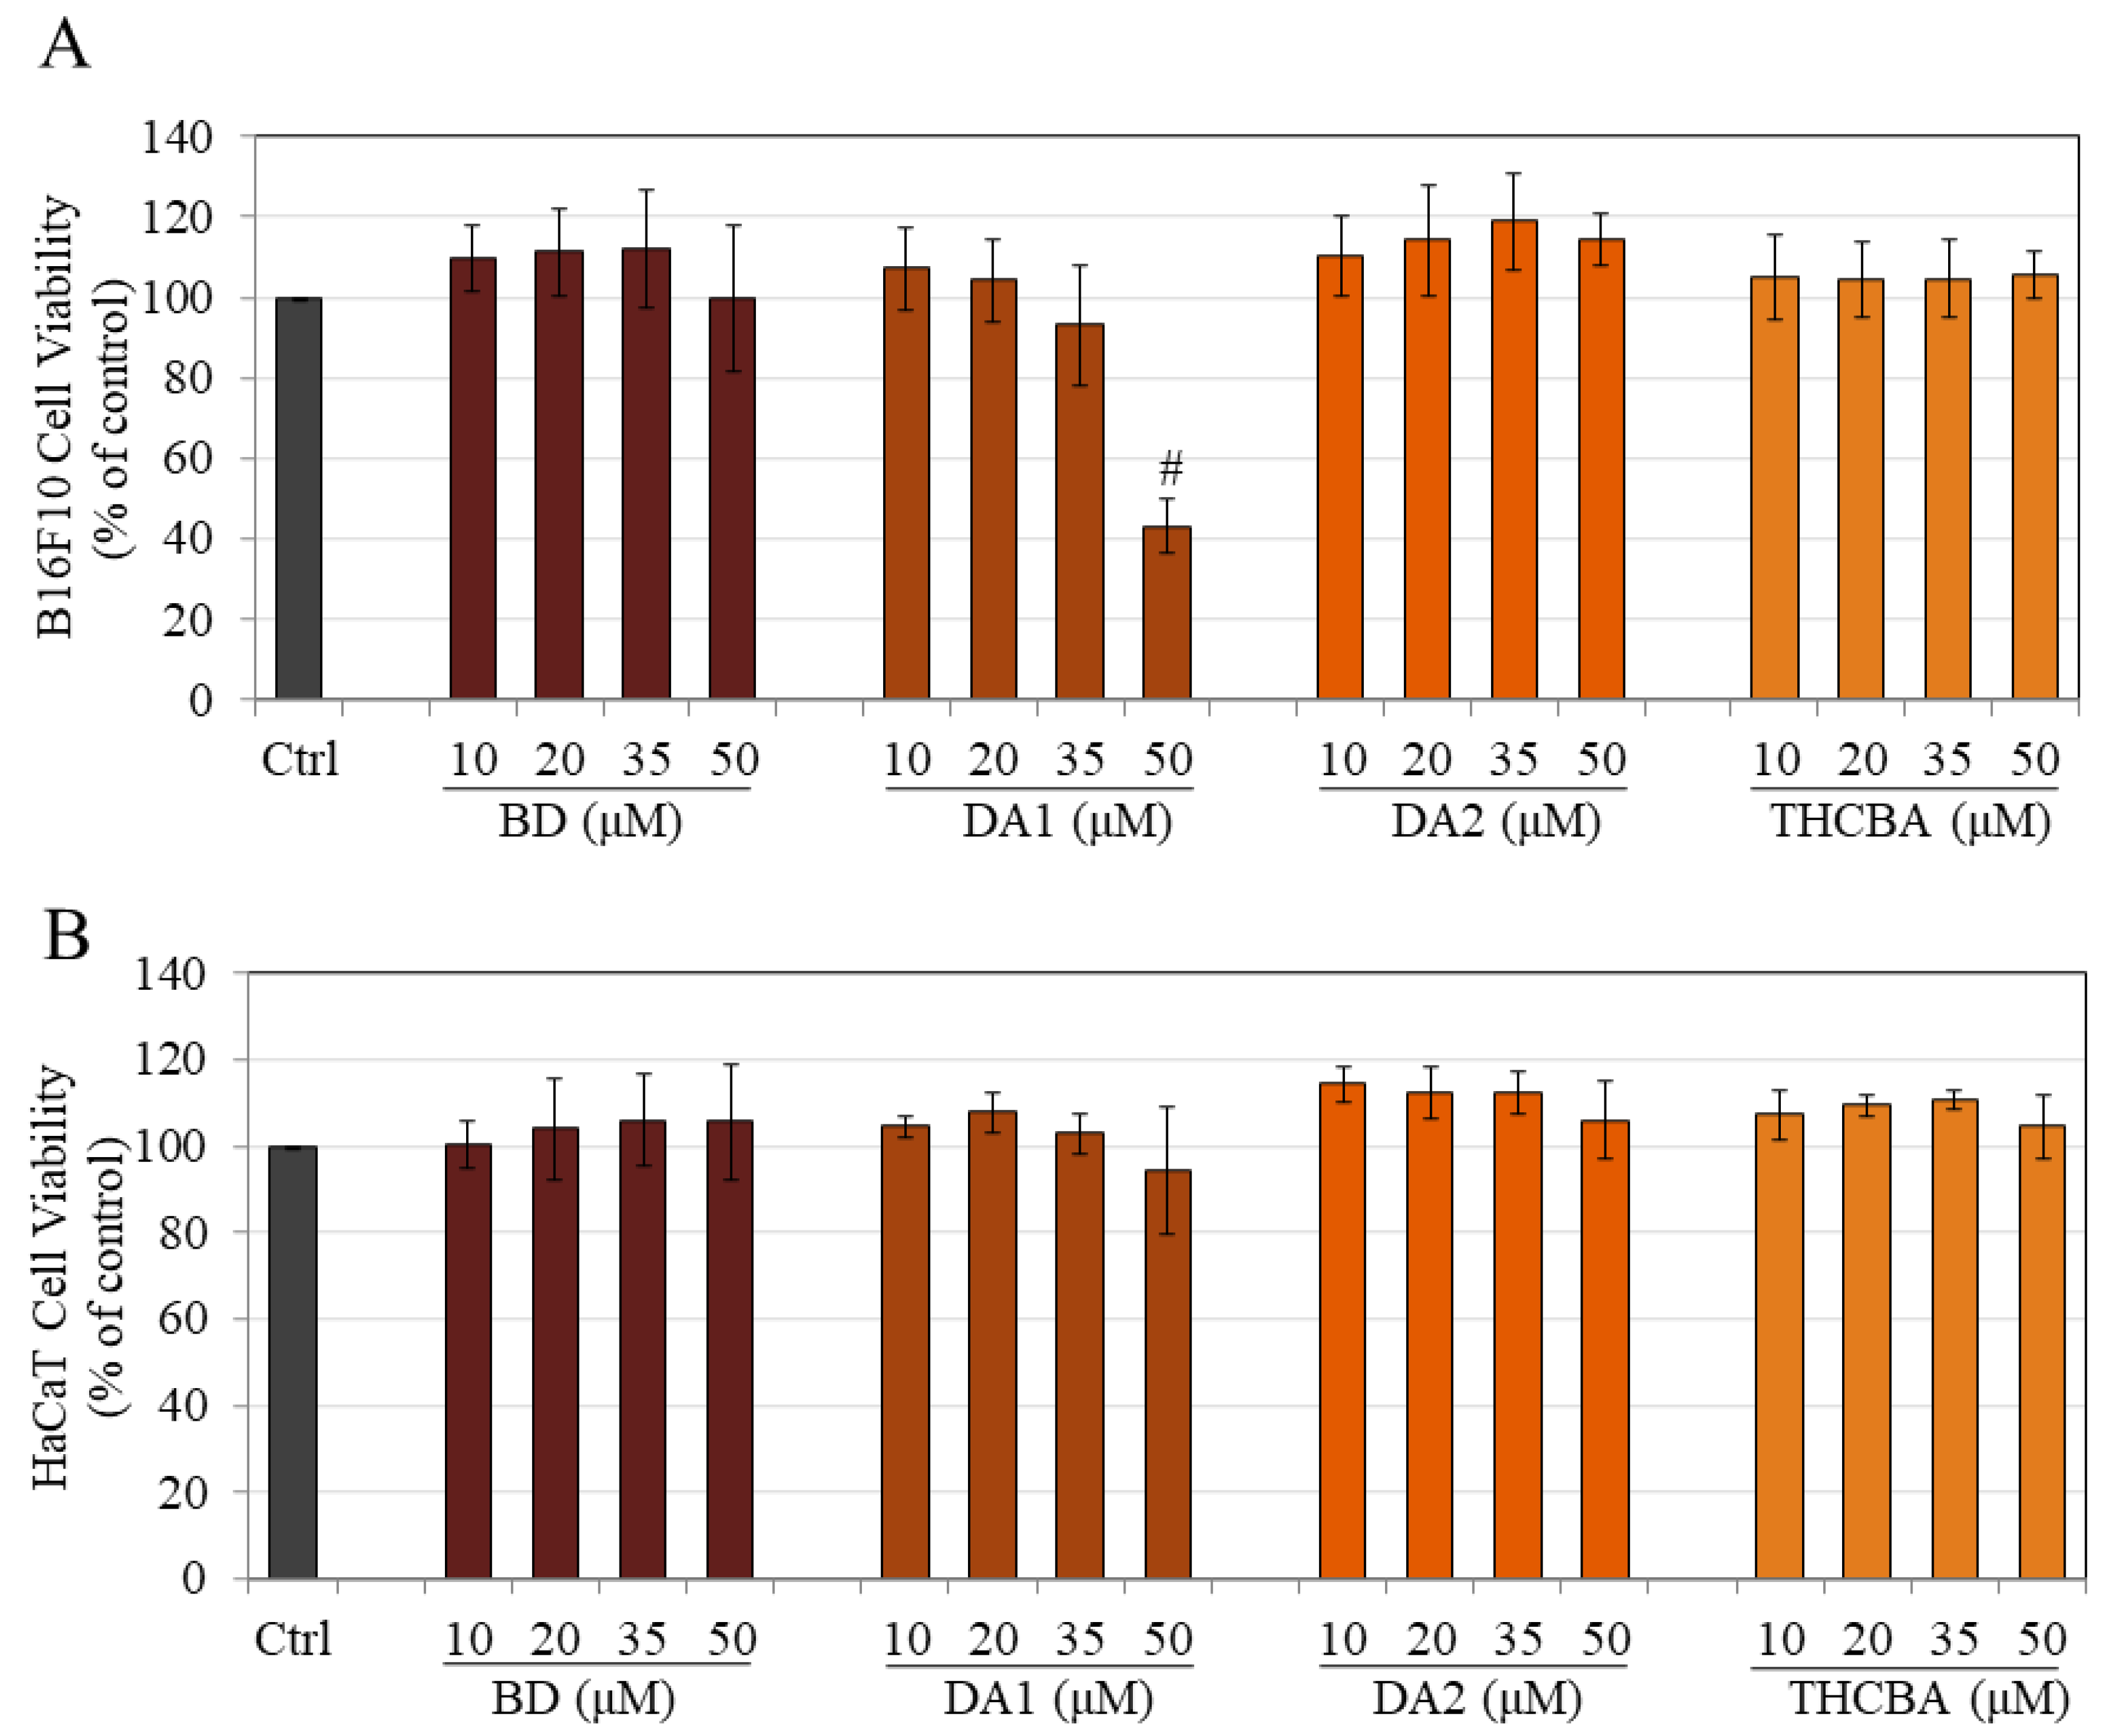
2.3. Effects of CBA Analogs on B16F10 and HaCaT Cell Viabilities
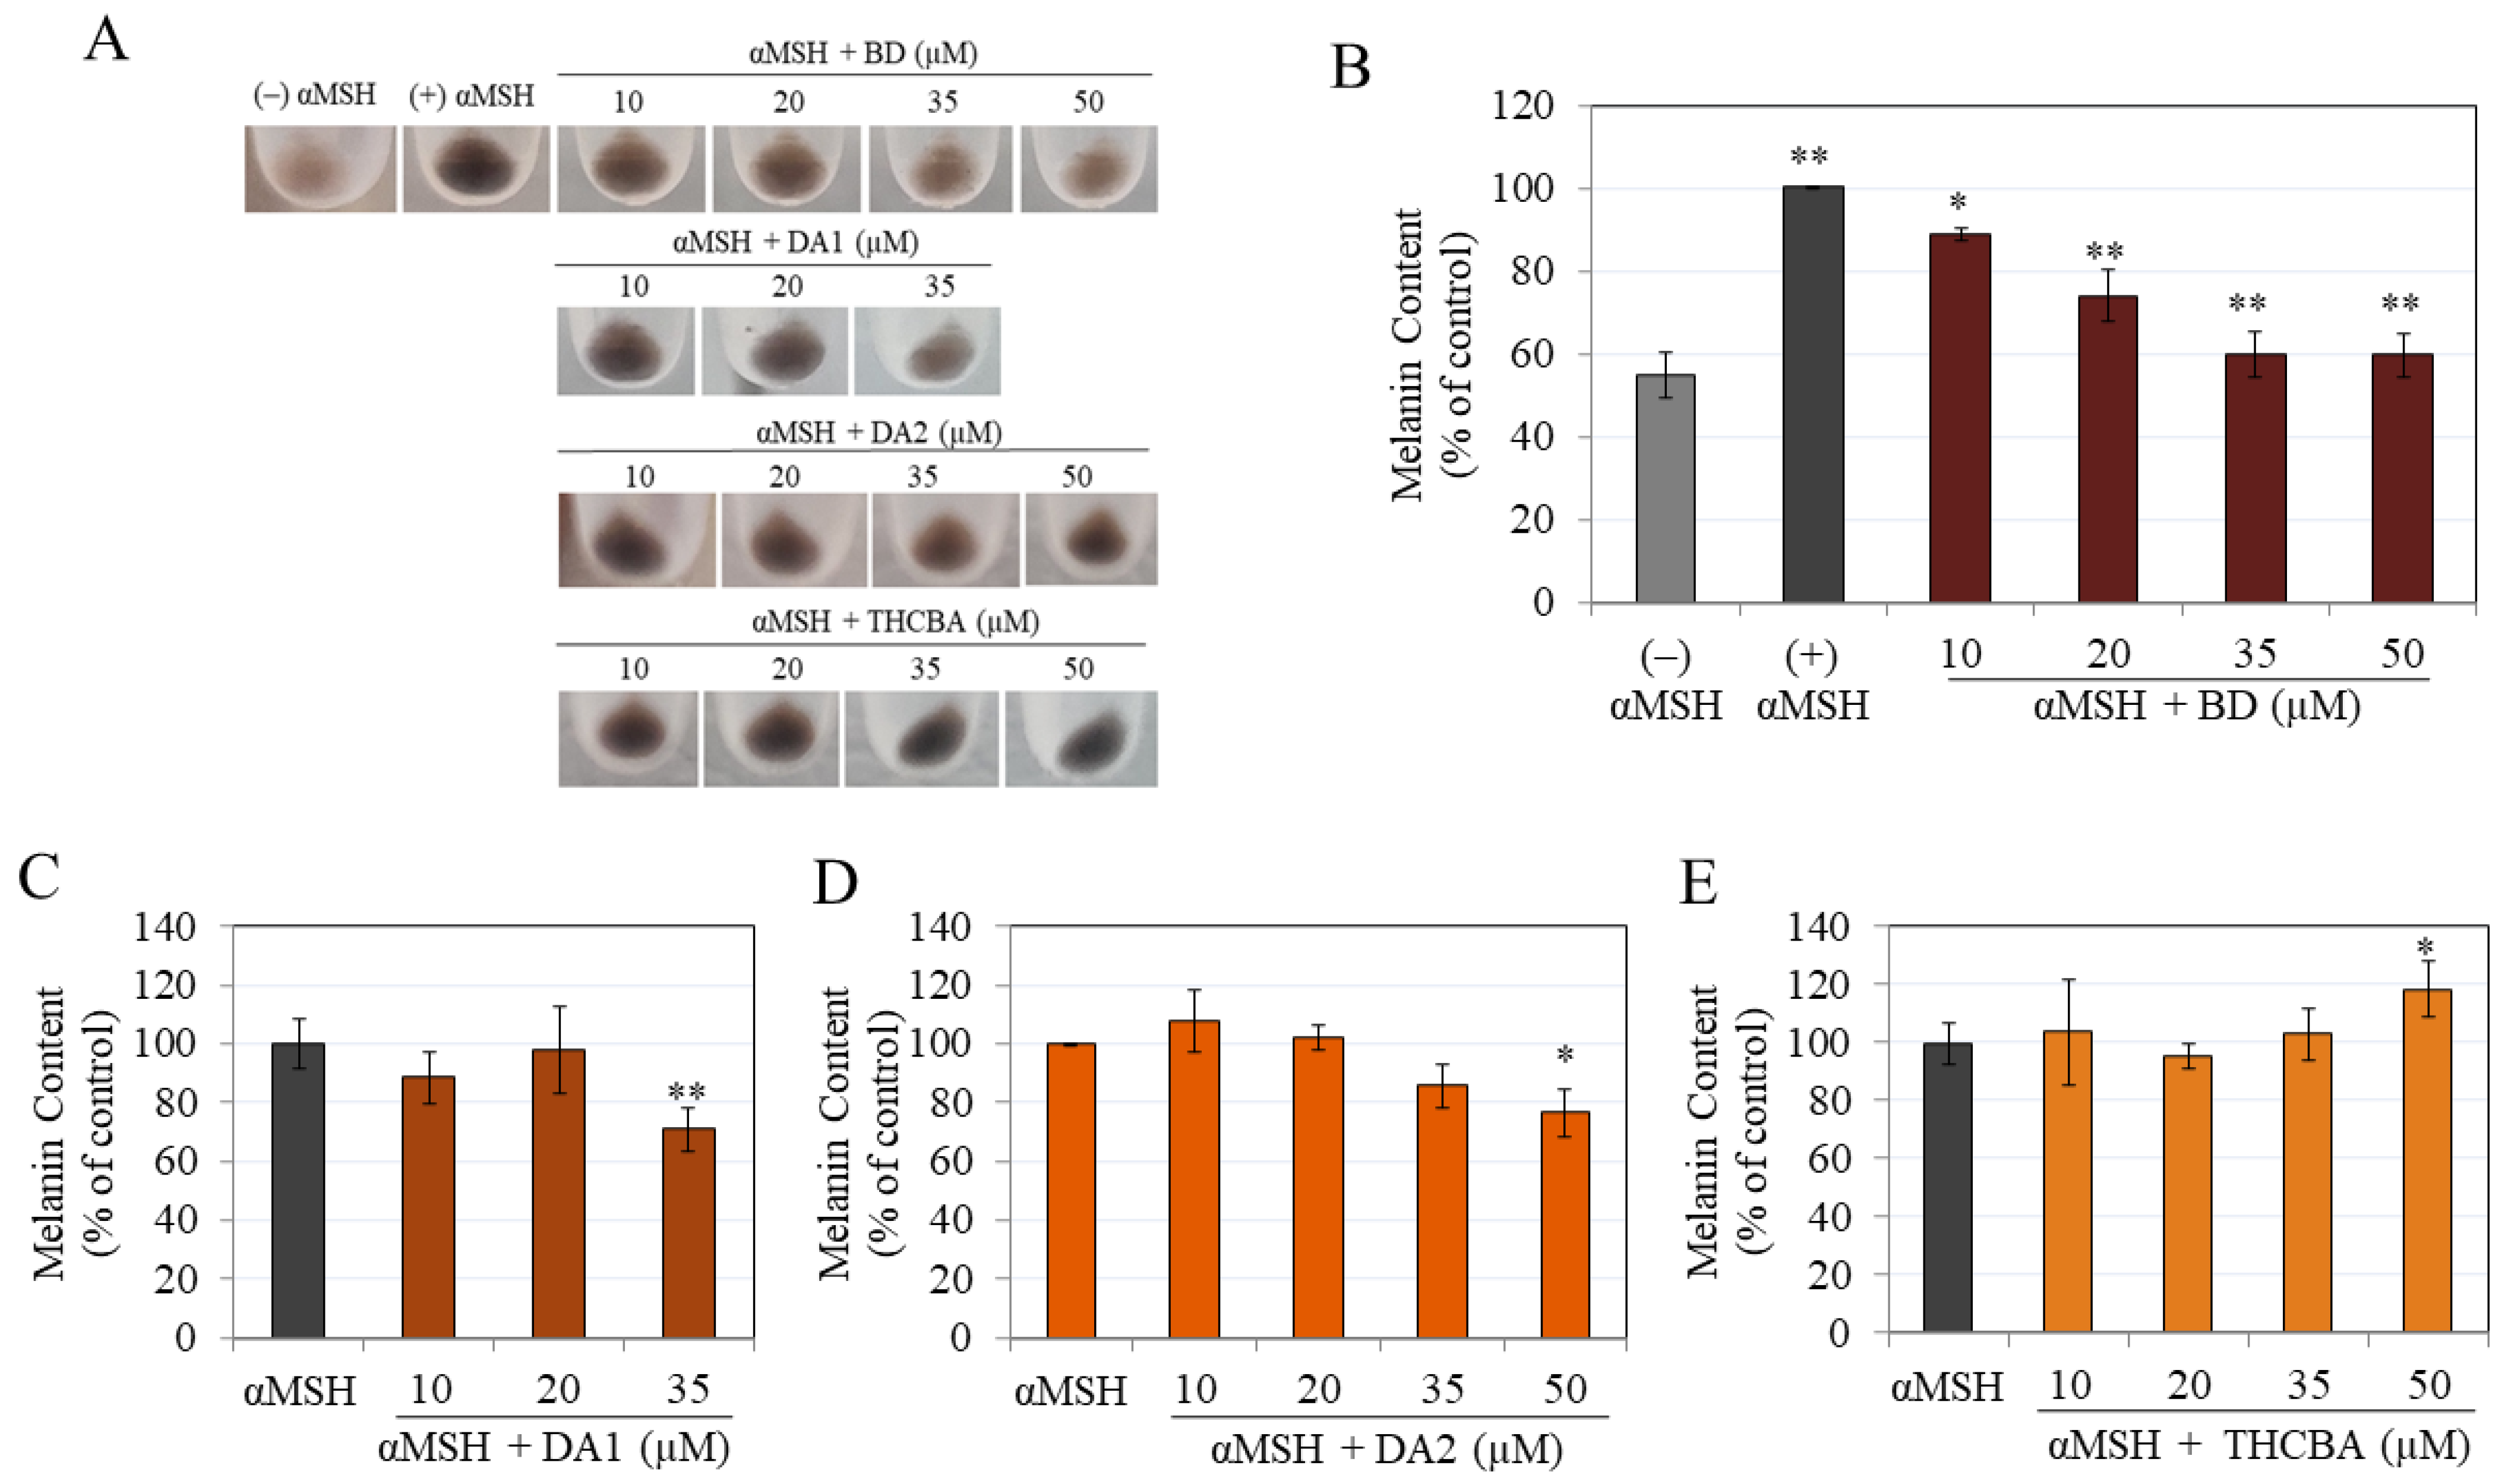
2.4. Effects of CBA Analogs on Melanin Synthesis in B16F10 Cells
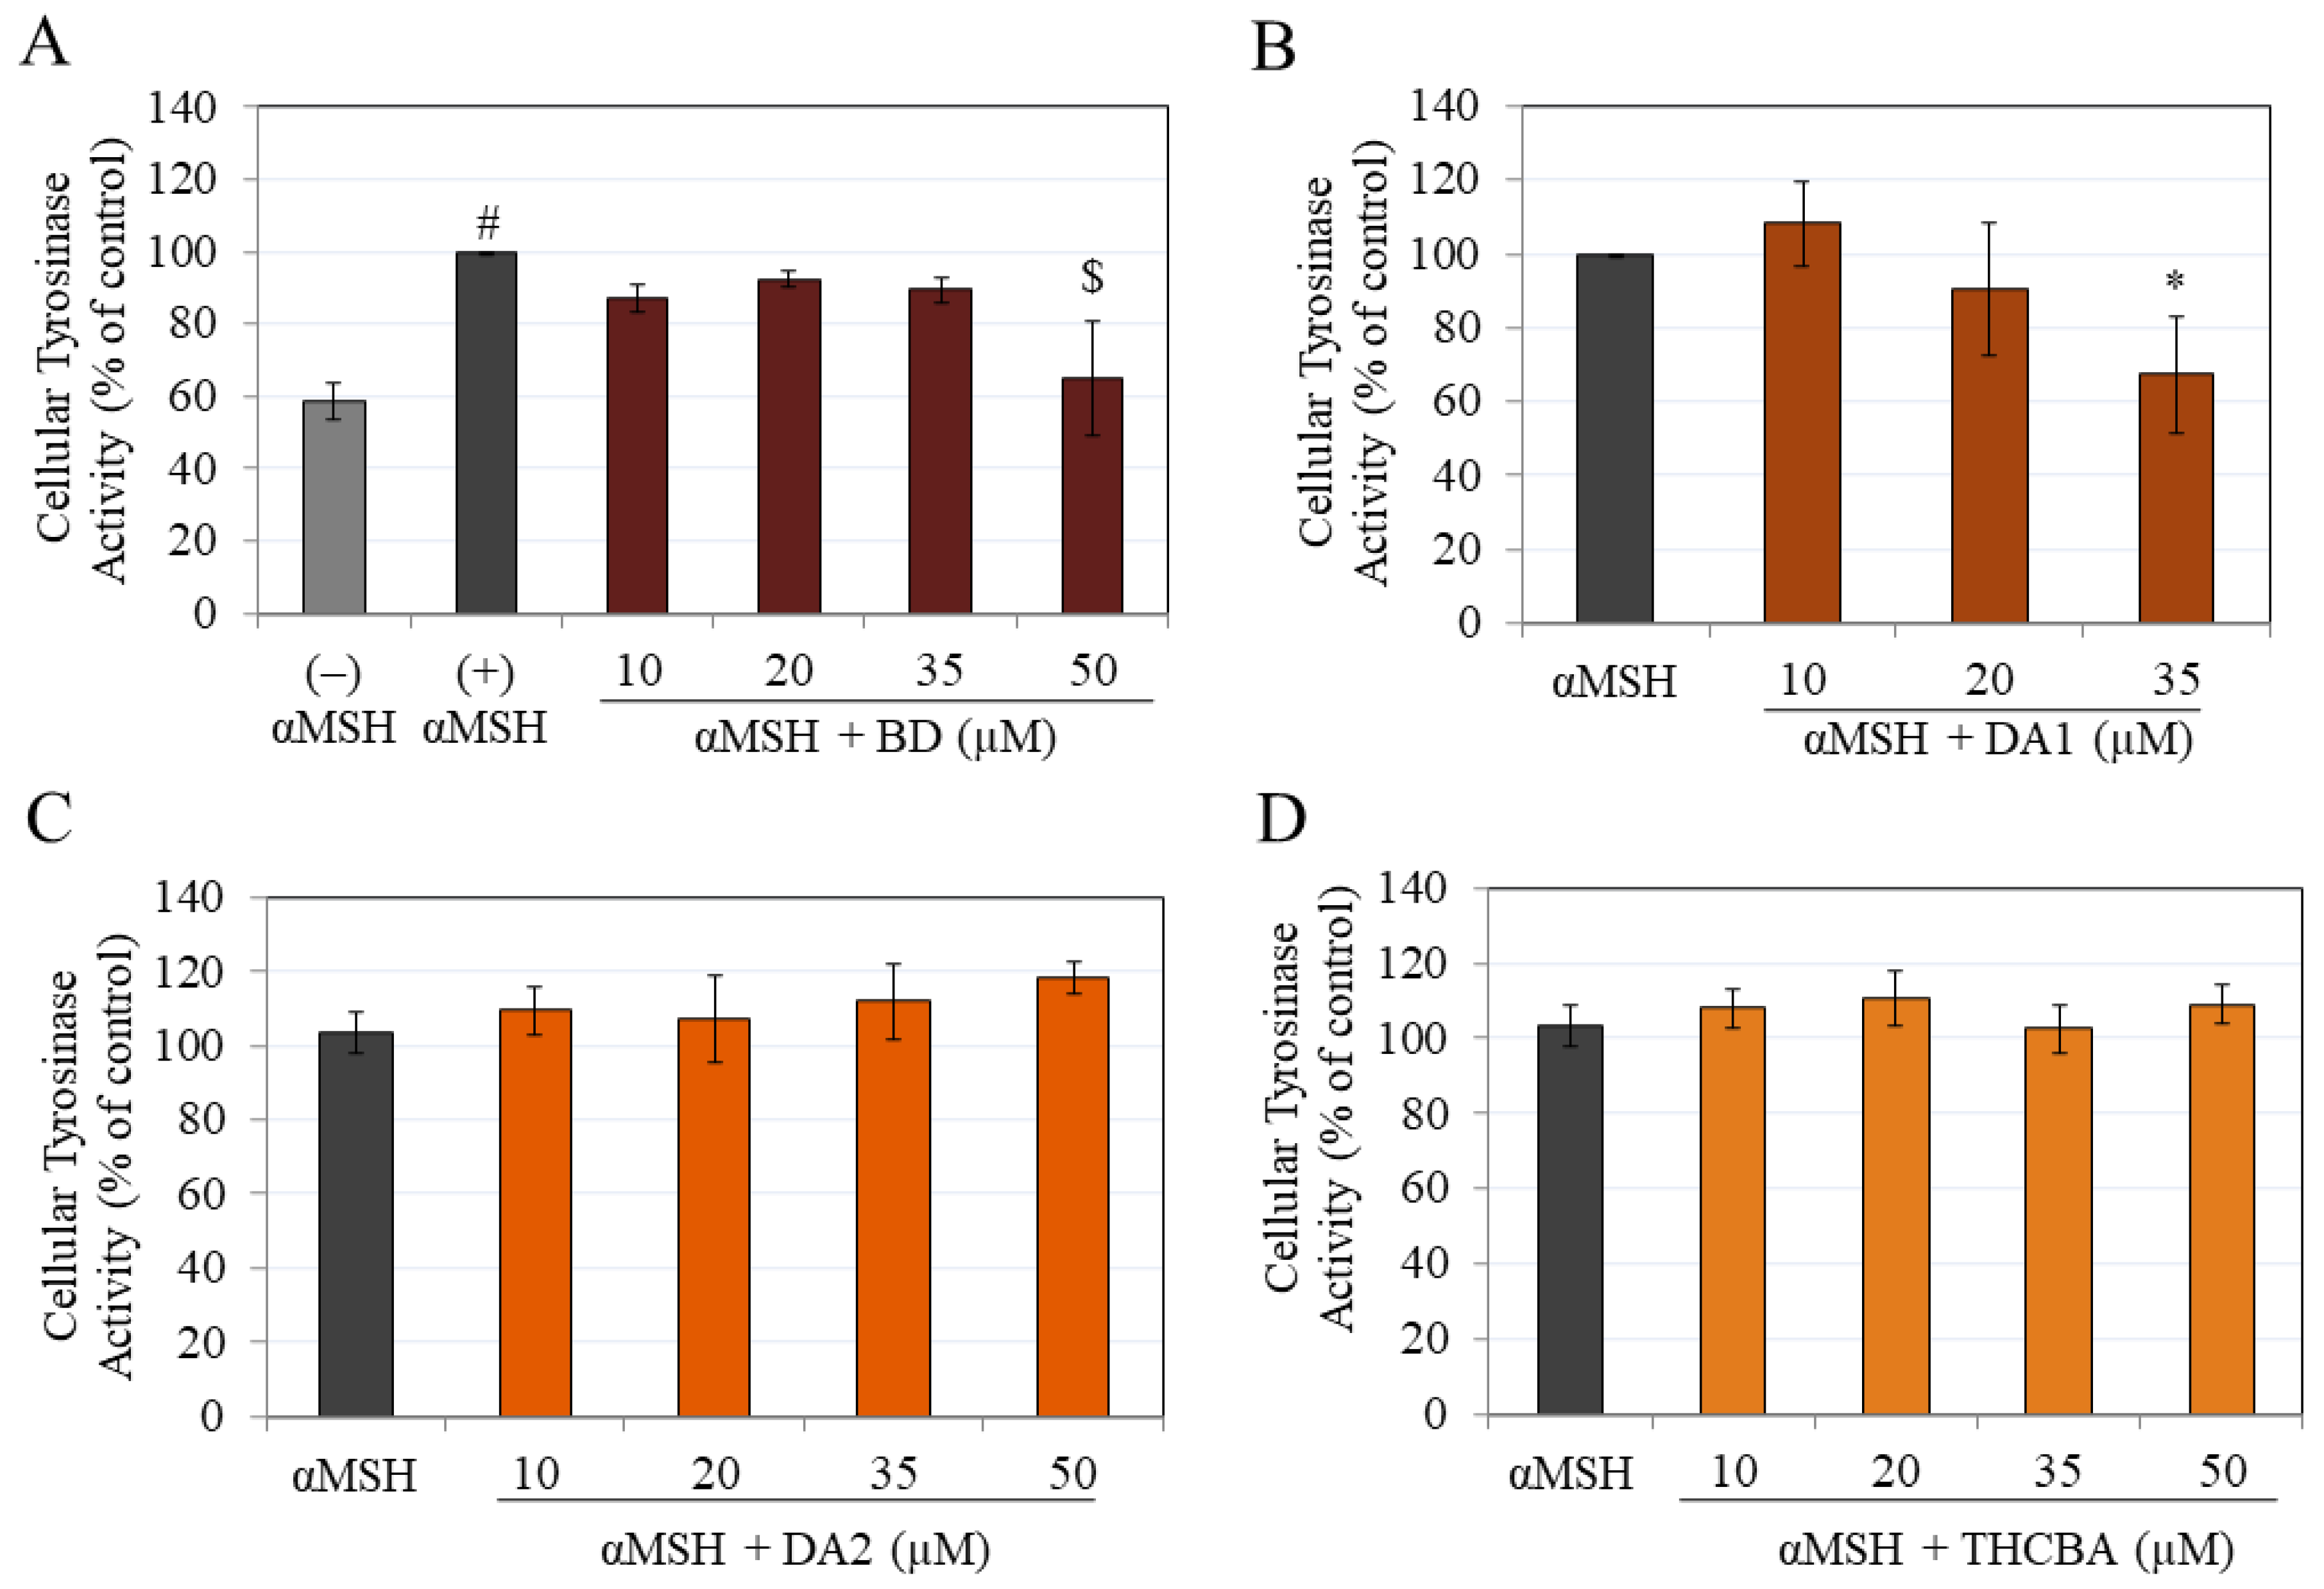
2.5. Effects of CBA Analogs on Tyrosinase Activity of B16F10 Cells
2.6. Effects of CBA Analogs on Melanin Synthesis in MNT-1 Cells
2.7. Effects of CBA Analogs on Tyrosinase Activity of MNT-1 Cells
3. Discussion
4. Materials and Methods
4.1. Materials
4.2. Mushroom Tyrosinase Assay
4.2.1. Monophenolase Activity
4.2.2. Diphenolase Activity
4.3. DPPH Radical Scavenging Assay
4.4. Cell Culture
4.5. Cytotoxicity Assay
4.6. Melanogenesis Assay
4.7. Intracellular Tyrosinase Activity
4.8. Statistical Analysis
5. Conclusions
Supplementary Materials
Author Contributions
Funding
Institutional Review Board Statement
Informed Consent Statement
Data Availability Statement
Acknowledgments
Conflicts of Interest
References
- Tailor, R. Pigmentation disorders: Types, aetiology and treatment options. J. Aesthetic Nurs. 2019, 8, 235–239. [Google Scholar] [CrossRef]
- Elbuluk, N.; Grimes, P.; Chien, A.; Hamzavi, I.; Alexis, A.; Taylor, S.; Gonzalez, N.; Weiss, J.; Desai, S.R.; Kang, S. The Pathogenesis and Management of Acne-Induced Post-inflammatory Hyperpigmentation. Am. J. Clin. Dermatol. 2021, 22, 829–836. [Google Scholar] [CrossRef] [PubMed]
- Woolery-Lloyd, H.; Kammer, J.N. Treatment of hyperpigmentation. Semin. Cutan. Med. Surg. 2011, 30, 171–175. [Google Scholar] [CrossRef] [PubMed]
- D’Alba, L.; Shawkey, M.D. Melanosomes: Biogenesis, properties, and evolution of an ancient organelle. Physiol. Rev. 2019, 99, 1–19. [Google Scholar] [CrossRef] [PubMed]
- Wakamatsu, K.; Zippin, J.H.; Ito, S. Chemical and biochemical control of skin pigmentation with special emphasis on mixed melanogenesis. Pigment. Cell Melanoma Res. 2021, 34, 730–747. [Google Scholar] [CrossRef] [PubMed]
- Ito, S.; Wakamatsu, K. Human hair melanins: What we have learned and have not learned from mouse coat color pigmentation. Pigment. Cell Melanoma Res. 2011, 24, 63–74. [Google Scholar] [CrossRef] [PubMed]
- Panzella, L.; Napolitano, A. Natural and bioinspired phenolic compounds as tyrosinase inhibitors for the treatment of skin hyperpigmentation: Recent advances. Cosmetics 2019, 6, 57. [Google Scholar] [CrossRef]
- Rendon, M.; Horwitz, S. Topical treatment of hyperpigmentation disorders. In Annales de Dermatologie et de Vénéréologie; Elsevier: Amsterdam, The Netherlands, 2012; pp. S153–S158. [Google Scholar]
- Kanlayavattanakul, M.; Lourith, N. Plants and natural products for the treatment of skin hyperpigmentation—A review. Planta Medica 2018, 84, 988–1006. [Google Scholar] [CrossRef] [PubMed]
- Kanlayavattanakul, M.; Lourith, N. Skin hyperpigmentation treatment using herbs: A review of clinical evidences. J. Cosmet. Laser Ther. 2018, 20, 123–131. [Google Scholar] [CrossRef]
- Zhu, W.; Gao, J. The use of botanical extracts as topical skin-lightening agents for the improvement of skin pigmentation disorders. J. Investig. Dermatol. Symp. Proc. 2008, 13, 20–24. [Google Scholar] [CrossRef] [PubMed]
- Kim, D.S.; Kim, J.Y. Total synthesis of Calebin-A, preparation of its analogues, and their neuronal cell protectivity against beta-amyloid insult. Bioorg. Med. Chem. Lett. 2001, 11, 2541–2543. [Google Scholar] [CrossRef] [PubMed]
- Brockmueller, A.; Mueller, A.-L.; Kunnumakkara, A.B.; Aggarwal, B.B.; Shakibaei, M. Multifunctionality of Calebin A in inflammation, chronic diseases and cancer. Front. Oncol. 2022, 12, 962066. [Google Scholar] [CrossRef] [PubMed]
- Majeed, M.; Nagabhushanam, K.; Devarajan, T.; Saklecha, S.; Reddy, S.V.K.; Mundkur, L. A minor metabolite from Curcuma longa effective against metabolic syndrome: Results from a randomized, double-blind, placebo-controlled clinical study. Food Funct. 2023, 14, 4722–4733. [Google Scholar] [CrossRef] [PubMed]
- Mueller, A.-L.; Brockmueller, A.; Kunnumakkara, A.B.; Shakibaei, M. Calebin A, a compound of turmeric, downregulates inflammation in tenocytes by NF-κB/Scleraxis signaling. Int. J. Mol. Sci. 2022, 23, 1695. [Google Scholar] [CrossRef] [PubMed]
- Zeng, Y.; Qiu, F.; Takahashi, K.; Liang, J.; Qu, G.; Yao, X. New sesquiterpenes and calebin derivatives from Curcuma longa. Chem. Pharm. Bull. 2007, 55, 940–943. [Google Scholar] [CrossRef] [PubMed]
- Majeed, A.; Nagabhushanam, K.; Majeed, M.; Thomas, S.M.; Thajuddin, N. An expeditious, green and protecting-group-free synthesis of a potent secondary metabolite Calebin-A and Its analogues. SynOpen 2017, 1, 0125–0128. [Google Scholar]
- Majeed, M.; Nagabhushanam, K.; Majeed, A.; Thomas, S.M. Synthesis of Calebin-A and Its Biologically Active Analogs. US Patent 9,365,486, 14 June 2016. [Google Scholar]
- Qiu, Y.; Wang, Y.; Lu, J.; Zhu, Q.; Jia, L.; Lei, F.; Shen, L.; Jiang, L.; Wu, A. Synthesis, spectroscopic analysis, DFT, docking, MD and antioxidant activity of tetrahydrocurcumin. J. Biomol. Struct. Dyn. 2023, 41, 1–13. [Google Scholar] [CrossRef] [PubMed]
- Kumar Ray, U.; Nowduri, A.; Babu Korupolu, R.; Boju, S.; Kumar, S.; TSS Sundaram, D.; Sekhara Rao Nethinti, C. Controlled Catalytic Reduction in Synthesising Pure Tetrahydrocurcumin. Asian J. Chem. Sci. 2022, 11, 46–53. [Google Scholar]
- Portes, E.; Gardrat, C.; Castellan, A. A comparative study on the antioxidant properties of tetrahydrocurcuminoids and curcuminoids. Tetrahedron 2007, 63, 9092–9099. [Google Scholar] [CrossRef]
- Goenka, S.; Nagabhushanam, K.; Majeed, M.; Simon, S.R. Calebin-A, a curcuminoid analog inhibits α-MSH-induced melanogenesis in B16F10 mouse melanoma cells. Cosmetics 2019, 6, 51. [Google Scholar] [CrossRef]
- Barclay, L.R.C.; Vinqvist, M.R.; Mukai, K.; Goto, H.; Hashimoto, Y.; Tokunaga, A.; Uno, H. On the antioxidant mechanism of curcumin: Classical methods are needed to determine antioxidant mechanism and activity. Org. Lett. 2000, 2, 2841–2843. [Google Scholar] [CrossRef] [PubMed]
- Selvam, C.; Jachak, S.M.; Thilagavathi, R.; Chakraborti, A.K. Design, synthesis, biological evaluation and molecular docking of curcumin analogues as antioxidant, cyclooxygenase inhibitory and anti-inflammatory agents. Bioorg. Med. Chem. Lett. 2005, 15, 1793–1797. [Google Scholar] [CrossRef] [PubMed]
- Shang, Y.-J.; Jin, X.-L.; Shang, X.-L.; Tang, J.-J.; Liu, G.-Y.; Dai, F.; Qian, Y.-P.; Fan, G.-J.; Liu, Q.; Zhou, B. Antioxidant capacity of curcumin-directed analogues: Structure–activity relationship and influence of microenvironment. Food Chem. 2010, 119, 1435–1442. [Google Scholar] [CrossRef]
- Somparn, P.; Phisalaphong, C.; Nakornchai, S.; Unchern, S.; Morales, N.P. Comparative antioxidant activities of curcumin and its demethoxy and hydrogenated derivatives. Biol. Pharm. Bull. 2007, 30, 74–78. [Google Scholar] [CrossRef] [PubMed]
- Aggarwal, B.B.; Deb, L.; Prasad, S. Curcumin differs from tetrahydrocurcumin for molecular targets, signaling pathways and cellular responses. Molecules 2015, 20, 185–205. [Google Scholar] [CrossRef] [PubMed]
- Zeng, Y.; Qiu, F.; Liu, Y.; Qu, G.; Yao, X. Isolation and identification of phase 1 metabolites of demethoxycurcumin in rats. Drug Metab. Dispos. 2007, 35, 1564–1573. [Google Scholar] [CrossRef] [PubMed]
- Luo, D.; Lin, Y.; Chen, J.; Huang, X.; Xie, Y.; Liu, Y.; Ni, S.; Su, Z.; Li, Y.; Zhang, Z. Stereoisomers of octahydrocurcumin, the hydrogenated metabolites of curcumin, display stereoselective activity on the CYP2E1 enzyme in L-02 cells. Food Funct. 2023, 14, 2822–2835. [Google Scholar] [CrossRef] [PubMed]
- Kumaravel, M.; Sankar, P.; Latha, P.; Benson, C.S.; Rukkumani, R. Antiproliferative effects of an analog of curcumin in Hep-2 cells: A comparative study with curcumin. Nat. Prod. Commun. 2013, 8, 1934578X1300800213. [Google Scholar] [CrossRef]
- Krawic, J.R.; Ladd, N.A.; Cansler, M.; McMurtrey, C.; Devereaux, J.; Worley, A.; Ahmed, T.; Froyd, C.; Kulicke, C.A.; Swarbrick, G. Multiple Isomers of Photolumazine V Bind MR1 and Differentially Activate MAIT Cells. J. Immunol. 2024, 212, 933–940. [Google Scholar] [CrossRef] [PubMed]
- Preuss, T.G.; Gehrhardt, J.; Schirmer, K.; Coors, A.; Rubach, M.; Russ, A.; Jones, P.D.; Giesy, J.P.; Ratte, H.T. Nonylphenol isomers differ in estrogenic activity. Environ. Sci. Technol. 2006, 40, 5147–5153. [Google Scholar] [CrossRef] [PubMed]
- Sprous, D.; Palmer, R.; Swanson, J.; Lawless, M. QSAR in the pharmaceutical research setting: QSAR models for broad, large problems. Curr. Top. Med. Chem. 2010, 10, 619–637. [Google Scholar] [CrossRef] [PubMed]
- Wang, H.; Chen, J.; Hu, J.; Si, J.; Xie, Y.; Wei, J.; Liu, Y.; Pei, D. Tyrosinase inhibitor screened from Olea europaea L. leaves: Identification, molecular docking analysis and molecular mechanisms. Ind. Crops Prod. 2024, 210, 118112. [Google Scholar] [CrossRef]
- Shin, M.; Truong, V.-L.; Lee, M.; Kim, D.; Kim, M.S.; Cho, H.; Jung, Y.H.; Yang, J.; Jeong, W.S.; Kim, Y. Investigation of phenyllactic acid as a potent tyrosinase inhibitor produced by probiotics. Curr. Res. Food Sci. 2023, 6, 100413. [Google Scholar] [CrossRef] [PubMed]
- Mann, T.; Gerwat, W.; Batzer, J.; Eggers, K.; Scherner, C.; Wenck, H.; Stäb, F.; Hearing, V.J.; Röhm, K.-H.; Kolbe, L. Inhibition of human tyrosinase requires molecular motifs distinctively different from mushroom tyrosinase. J. Investig. Dermatol. 2018, 138, 1601–1608. [Google Scholar] [CrossRef] [PubMed]
- Oyama, T.; Yoshimori, A.; Ogawa, H.; Shirai, Y.; Abe, H.; Kamiya, T.; Tanuma, S.-i. The structural differences between mushroom and human tyrosinase cleared by investigating the inhibitory activities of stilbenes. J. Mol. Struct. 2023, 1272, 134180. [Google Scholar] [CrossRef]
- Novaes, J.T.; Lillico, R.; Sayre, C.L.; Nagabhushanam, K.; Majeed, M.; Chen, Y.; Ho, E.A.; Oliveira, A.L.d.P.; Martinez, S.E.; Alrushaid, S. Disposition, metabolism and histone deacetylase and acetyltransferase inhibition activity of tetrahydrocurcumin and other curcuminoids. Pharmaceutics 2017, 9, 45. [Google Scholar] [CrossRef] [PubMed]
- Fitzpatrick, T.B.; Breathnach, A. The epidermal melanin unit system. Dermatol. Wochenschr. 1963, 147, 481. [Google Scholar]
- Quevedo, W.C., Jr. Epidermal melanin units melanocyte-keratinocyte interactions. Am. Zool. 1972, 12, 35–41. [Google Scholar] [CrossRef]
- Micallef, L.; Belaubre, F.; Pinon, A.; Jayat-Vignoles, C.; Delage, C.; Charveron, M.; Simon, A. Effects of extracellular calcium on the growth-differentiation switch in immortalized keratinocyte HaCaT cells compared with normal human keratinocytes. Exp. Dermatol. 2009, 18, 143–151. [Google Scholar] [CrossRef]
- Goenka, S.; Simon, S.R. Comparative study of curcumin and its hydrogenated metabolites, tetrahydrocurcumin, hexahydrocurcumin, and octahydrocurcumin, on melanogenesis in B16F10 and MNT-1 cells. Cosmetics 2021, 8, 4. [Google Scholar] [CrossRef]
- Kim, J.H.; Baek, E.J.; Lee, E.J.; Yeom, M.H.; Park, J.S.; Lee, K.W.; Kang, N.J. Ginsenoside F1 attenuates hyperpigmentation in B16F10 melanoma cells by inducing dendrite retraction and activating Rho signalling. Exp. Dermatol. 2015, 24, 150–152. [Google Scholar] [CrossRef] [PubMed]
- Jamaluddin, A.; Yusof, N.; Abdul Rahman, S.; Pilus, N. Effect of Aspergilus oryzae-fermented broken rice, brewers’ rice and rice bran on melanogenesis in highly pigmented human melanoma, MNT-1. Food Res. 2023, 6, 81–89. [Google Scholar] [CrossRef]
- Slominski, A.; Zbytek, B.; Slominski, R. Inhibitors of melanogenesis increase toxicity of cyclophosphamide and lymphocytes against melanoma cells. Int. J. Cancer 2009, 124, 1470–1477. [Google Scholar] [CrossRef] [PubMed]
- Brożyna, A.A.; VanMiddlesworth, L.; Slominski, A.T. Inhibition of melanogenesis as a radiation sensitizer for melanoma therapy. Int. J. Cancer 2008, 123, 1448–1456. [Google Scholar] [CrossRef] [PubMed]
- Sharma, K.V.; Davids, L.M. Depigmentation in melanomas increases the efficacy of hypericin-mediated photodynamic-induced cell death. Photodiagnosis Photodyn. Ther. 2012, 9, 156–163. [Google Scholar] [CrossRef] [PubMed]
- Lee, M.J.; Tsai, Y.J.; Lin, M.Y.; You, H.L.; Kalyanam, N.; Ho, C.T.; Pan, M.H. Calebin-A induced death of malignant peripheral nerve sheath tumor cells by activation of histone acetyltransferase. Phytomedicine 2019, 57, 377–384. [Google Scholar] [CrossRef] [PubMed]
- Liou, W.-S.; Lin, C.; Lee, P.-S.; Kalyanam, N.; Ho, C.-T.; Pan, M.-H. Calebin-A induces cell cycle arrest in human colon cancer cells and xenografts in nude mice. J. Funct. Foods 2016, 26, 781–791. [Google Scholar] [CrossRef]
- Majeed, M.; Nagabhushanam, K.; Natarajan, S.; Bani, S.; Pandey, A.; Karri, S.K. Investigation of repeated dose (90 day) oral toxicity, reproductive/developmental toxicity and mutagenic potential of ‘Calebin A’. Toxicol. Rep. 2015, 2, 580–589. [Google Scholar] [CrossRef] [PubMed]
- Daina, A.; Michielin, O.; Zoete, V. SwissADME: A free web tool to evaluate pharmacokinetics, drug-likeness and medicinal chemistry friendliness of small molecules. Sci. Rep. 2017, 7, 42717. [Google Scholar] [CrossRef] [PubMed]


| Parameter | BD | DA1 | DA2 | THCBA | CBA [22] | |||||
|---|---|---|---|---|---|---|---|---|---|---|
| 20 µM | 35 µM | 20 µM | 35 µM | 20 µM | 35 µM | 20 µM | 35 µM | 20 µM | 35 µM | |
| Antioxidant activity | × | × | ↓ 23.34% | ↓ 29.71% | ↓ 30.77% | ↓ 32.63% | ↓ 53.85% | ↓ 56.41% | ↓ 41% | N.D. |
| Monophenolase activity | ↓ 45.30% | ↓ 50.91% | ↓ 59.81% | ↓ 61.14% | ↓40.57% | ↓ 45.02% | ↓ 27.15% | ↓ 41.69% | × | N.D. |
| Diphenolase activity | ↓ 27.89% | ↓ 27.93% | ↓ 47.35% | ↓ 49.40% | ↓ 14.79% | ↓ 18.47% | × | × | × | N.D. |
| Melanin content (B16F10) | ↓ 29.11% | ↓ 36.02% | ↓ 24.12% | ↓ 36.82% | × | × | × | × | ↓ 20% | TX |
| Melanin content (B16F10+) | ↓ 26.08% | ↓ 40.14% | × | ↓ 29.25% | × | × | × | × | ↓ 38.71% | TX |
| Tyrosinase activity (B16F10+) | × | × | × | ↓ 32.74% | × | × | × | × | × | TX |
| Melanin content (MNT-1) | × | × | × | ↓ 13.69% | × | × | × | × | N.D. | |
| Tyrosinase activity (MNT-1) | ↓ 11.07% | ↓ 14.76% | × | ↓ 21.93% | × | × | × | × | N.D. | |
Disclaimer/Publisher’s Note: The statements, opinions and data contained in all publications are solely those of the individual author(s) and contributor(s) and not of MDPI and/or the editor(s). MDPI and/or the editor(s) disclaim responsibility for any injury to people or property resulting from any ideas, methods, instructions or products referred to in the content. |
© 2024 by the authors. Licensee MDPI, Basel, Switzerland. This article is an open access article distributed under the terms and conditions of the Creative Commons Attribution (CC BY) license (https://creativecommons.org/licenses/by/4.0/).
Share and Cite
Goenka, S.; Nagabhushanam, K.; Majeed, M. Study of the Effects of Novel Analogs of Calebin-A on Melanogenesis. Drugs Drug Candidates 2024, 3, 471-487. https://doi.org/10.3390/ddc3030028
Goenka S, Nagabhushanam K, Majeed M. Study of the Effects of Novel Analogs of Calebin-A on Melanogenesis. Drugs and Drug Candidates. 2024; 3(3):471-487. https://doi.org/10.3390/ddc3030028
Chicago/Turabian StyleGoenka, Shilpi, Kalyanam Nagabhushanam, and Muhammed Majeed. 2024. "Study of the Effects of Novel Analogs of Calebin-A on Melanogenesis" Drugs and Drug Candidates 3, no. 3: 471-487. https://doi.org/10.3390/ddc3030028
APA StyleGoenka, S., Nagabhushanam, K., & Majeed, M. (2024). Study of the Effects of Novel Analogs of Calebin-A on Melanogenesis. Drugs and Drug Candidates, 3(3), 471-487. https://doi.org/10.3390/ddc3030028