Abstract
Objective: To describe the secular trends of cause-specific mortality among adolescents aged 10 to 24 years from 2004 to 2019 and explore the association between mortality and economic status, education level as well as health investment. Methods: Mortality data of adolescents aged 10 to 24 years were obtained from the national disease surveillance points system. The age-standardized mortality rate (ASMR) was calculated by using the population data from the sixth national population census in 2010. GDP per capita, urbanization rate, illiteracy rate of the population over 15 years old, government education expenditure per capita, number of health service providers per 1000 people, and number of health beds per 1000 people were collected from China’s Economic and Social Big Data Research Platform. Age-period-cohort analysis was used to analyse the net age, period, and cohort effects of mortality among adolescents, while panel data regression was used to explore the association between mortality and economic status, education level as well as health investment. Results: Overall, the ASMR was 28.84 per 100,000 and the top five causes of mortality were road injuries, drowning, intentional self-harm and sequelae, leukaemia, and falls among adolescents aged 10 to 24 years in China in 2019. All-cause mortality declined with an annual percentage change of 4.02% (95% Confidence interval: 3.74% to 4.30%) from 2004 to 2019 yet with persistent differences across different demographic (gender and age) and geographical (urban-rural, and regional) subgroups. Notably, the ASMR for HIV/AIDS in males, lower respiratory infections in urban adolescents, and iron deficiency anaemia as well as cervical cancer in adolescents aged 20 to 24 years showed an increase over time. The multivariate panel data regression showed that the ASMR decreased by 5.18 (3.27, 7.08) per 100,000 for every increase in the number of health beds per 1000 population, but with insignificant association with GDP per capita and illiteracy rate in the total sample. Health beds investment was positively associated with ASMR at almost all subgroups except for adolescents aged 10 to 14 years; GDP per capita increase was helpful to males and rural adolescents while an increasing literacy rate was beneficial for females and adolescents aged 15 to 19 years. Conclusion: Given the persistent differences between subgroups, further investments including improving health services, especially increasing health bed investment, GDP per capita, and reducing the illiteracy rate and concern for adolescents in males, rural areas, the western regions, and aged 15 to 24 years are needed. Additionally, the increased burden of some diseases, such as HIV/AIDS, must be of further concern.
1. Introduction
During the Millennium Development Goals and Sustainable Development Goals eras, the under-five mortality rate was the global heath priority [1,2]. Compared with the under-fives, adolescents have been neglected for a long time [3], which might be the reason that they received fewer health benefits than under-five [4]. Until 2015, the Global Strategy for Women’s, Children’s and Adolescents’ Health (2016–2030) proposed by the World Health Organization included adolescents in the global strategy for the first time as part of the target that helps countries and their partners to promote accountability in ending preventable deaths and to ensure that no one is left behind [5]. The importance of paying attention to adolescent mortality is beginning to be recognized by the international community [6]. With the delayed timing of role transitions, such as the completion of education, marriage, and parenthood, a new definition of 10 to 24 years corresponds closely to adolescence; thus, we used this age group to define adolescence [7].
Socioeconomic development, education level, environment, and lifestyle have collectively contributed to the gradual improvement in adolescent health, leading to notable changes in their disease burden pattern [8]. This reminds us to pay attention to the causes of death among them. Globally, the Global Burden of Disease (GBD) 2019 study revealed that, between 1990 and 2019, the Disability-Adjusted Life Years (DALYs) of non-communicable diseases (NCDs) increased by 13.1%, while the DALYs of injuries and communicable, maternal, neonatal, and nutritional diseases (CMNN Diseases) decreased by 24.8% and 18.7%, respectively [9]. That transition also occurred in Chinese adolescents, with a shift from an injury-excess country in 1990 to a NCDs-dominant country in 2016 [8]. However, there were noticeable variations in the disease-burden pattern across provinces, with adolescents in some western provinces, such as Tibet, Qinghai, and Xinjiang, still living in injury-excess environments [4]. Additionally, the existing studies exploring the association between mortality and economic status, education level, and health investment were concentrated in developed countries [10,11,12,13], which were hard to generalize in low-and-middle-income countries. To date, no study has reported and systematically analysed the demographic and geographical differences in cause-specific mortality using the age-period-cohort model, nor explored the association between mortality and economic status, education level, as well as health investment among adolescents aged 10 to 24 years in China.
The National Disease Surveillance Points (DSP) system collected the cause-specific mortality data for different genders, areas, regions, and age groups, which offered an opportunity to explore the trends and influencing factors of cause-specific mortality among adolescents aged 10 to 24 years [14]. The purpose of this study was to describe the current status and secular trends in cause-specific mortality among adolescents aged 10 to 24 years in different subgroups in China from 2004 to 2019, as well as to explore the association between mortality and economic status, education level, and health investment. The following are the key points of this study:
- Question: How have adolescent mortality rates and death patterns changed in China and what factors were associated with the changes?
- Findings: This study found significant reductions in adolescent all-cause mortality, but some causes, such as HIV/AIDS, malnutrition, lymphoma, and multiple myeloma had higher burdens in 2019 than in 2004, while subgroup differences still existed. Increasing health investment might contribute to decreasing trends in deaths.
- Interpretation: It will be important to prioritize interventions based on the specific causes of death and associated patterns to ensure that no one is left behind.
2. Methods
2.1. Data Sources
The DSP system, which was initiated in the 1970s, is the national registration system conducted by the Chinese Center for Disease Control and Prevention (CDC). Since 2004, the annual yearbook has reported the cause-specific mortality data from 161 surveillance points (63 urban points and 98 rural points), covering a population of approximately 73 million (6%), and since 2013 the coverage has been expanded to 605 surveillance points (208 urban points and 397 rural points), covering a population of 323.8 million (24.3%). The data were confirmed with great representativeness at the national, regional, and area levels [15], and the detailed design has been published elsewhere [14,16]. A new definition which suggests that the 10 to 24-year-old age group corresponds to adolescence was adopted in this study [7], and we extracted the mortality data of Chinese adolescents aged 10 to 24 years from the annual yearbooks during the 2004–2019 period [17,18]. The causes of death were classified into three first-level classifications: (1) CMNN diseases; (2) NCDs; and (3) Injuries. Under the first-level classifications, the causes were further subdivided into more detailed secondary and tertiary causes. The standardized population was collected from the sixth national census in 2010. All provinces were classified into three regions. Beijing, Tianjin, Hebei, Liaoning, Shanghai, Jiangsu, Zhejiang, Fujian, Shandong, Guangdong, and Hainan belonged to the Eastern region; Shanxi, Jilin, Heilongjiang, Anhui, Jiangxi, Henan, Hubei, and Hunan belonged to the Central region; and Neimenggu, Guangxi, Chongqing, Sichuan, Guizhou, Yunnan, Xizang, Shaanxi, Gansu, Qinghai, Ningxia, and Xinjiang belonged to the Western region [17]. The data on economic status (GDP per capita and urbanization rate), education level (illiteracy rate of the population over 15 years old and education expenditure per capita), and health investment (health service providers per 1000 population and health beds per 1000 population) were collected from China’s Economic and Social Big Data Research Platform (https://data.cnki.net/, accessed on 14 December 2021).
2.2. Data Recode
We used the International Classification of Diseases 10th Revision (ICD-10) to match the causes of death during the study period, and the causes that could not be matched by ICD-10 were omitted from the analysis; thus, 27% of causes before 2009 and 23% of causes after 2010 were omitted. Additionally, we recoded the causes of death by assigning a unique code to each cause. For example, the three first-level classifications were recoded into “A”, “B”, and “C”, which represented CMNN diseases, NCDs, and Injuries, respectively, while HIV/AIDS, leukaemia, and drowning were recoded into “A1–3”, “B1–16”, and “C1–5”, respectively. The detailed relationship between the causes of death, the ICD-10 code, and the unique code used in this study was presented in Supplementary Table S1.
2.3. Statistical Analysis
2.3.1. The Trend for All-Cause Mortality and Cause-Specific Mortality
We used the mortality rate (MR) and standardized population to calculate the age-standardized mortality rate (ASMR) for adolescents aged 10 to 24 years. A similar standardization process was conducted for different genders, areas, regions, and age groups. Additionally, we utilized the age-period-cohort (APC) model to determine the net age, period, and cohort effects of adolescent mortality. The age effect, which refers to biological and social processes and the social role or status of specific age groups, was defined as the fitted longitudinal age-specific rates in the reference cohort adjusted for period deviations. The period effect, which refers to the external factors that affect all age groups simultaneously at a particular period, was defined as the rate ratio (RR) in a specific survey year compared with the reference survey year. The cohort effect, which refers to the unique experience or exposure of a cohort as they move across a period, was defined as the RR in a specific birth cohort compared with the reference birth cohort [19,20]. The regular relationship of age, birth cohort and period is fully collinear, so it is statistically impossible to estimate their effects independently [21]. Here we used the web tool (https://analysistools.cancer.gov/apc/, accessed on 30 May 2023) developed by the National Cancer Institute (NIH) to identify these effects [22]. The mortality data from 2004 to 2018 were classified into three groups (2004–2008, 2009–2013, 2014–2018), while the population was also classified into three age groups (10 to 14 years, 15 to 19 years, 20 to 24 years), and we obtained five cohorts (from 1984 birth cohort to 2004 birth cohort). In each group, the five-year average population and number of deaths were used to represent the population and the number of deaths in this group. We set the middle age group, period, and cohort as the reference, and calculated the age RR, period RR, and cohort RR, respectively. We additionally calculated the net drift and local drift to reflect the annual percentage change (APC) in each age group and the average annual percentage change (AAPC) of all age groups, respectively.
All tertiary causes of death and three secondary causes of death (B3: diabetes, B4: endocrine disorders, and B11: skin diseases) that do not contain subordinate tertiary causes of death were analysed, and trends in ASMR for different causes of death over the period 2004 to 2019 were depicted using heat maps and were further displayed across different subgroups. Based on the finding of the heat maps, which displayed the trends and ASMR for every cause of death, we additionally presented the top 15 causes of death and (age-standardized) mortality rates for adolescents in 2004, 2010, and 2019.
2.3.2. Association between Mortality and Economic Status, Education Level, as Well as Health Investment
We matched the mortality data with variables including GDP per capita, urbanization rate, illiteracy rate of the population over 15 years old, education expenditure per capita, health service providers per 1000 population, and health beds per 1000 population at regional level by year, while univariate and multivariate panel data regression models were used to determine the association between ASMR and these factors, respectively. The Variance Inflation Factor (VIF) was used as a criterion of multicollinearity. When the value was greater than 10, we thought the multicollinearity existed (Supplementary Table S2). After that, we built a fixed-effect panel regression model to determine the association between mortality and GDP per capita, illiteracy rate of the population over 15 years old, and health beds per 1000 population, while the region was used as the group variable and year was used as the time variable.
2.4. Sensitivity Analysis
In the APC model, the mortality data from 2004 to 2018 were used for the main analysis, and data from 2005 to 2019 were used to conduct the sensitivity analysis. In the panel data regression, we applied a one-year lag to GDP per capita, illiteracy rate of the population over 15 years old, and health beds per 1000 population, then compared the result with the main analysis to add robustness.
3. Results
3.1. Current Status of Mortality among Adolescents Aged 10 to 24 Years
In 2019, the national all-cause ASMR for adolescents aged 10 to 24 years was 28.84 per 100,000, of which the ASMR for male adolescents (37.11 per 100,000) was higher than females (19.55 per 100,000), for rural adolescents (31.34 per 100,000) higher than their urban peers (23.78 per 100,000), and for adolescents from the western area (38.98 per 100,000) higher than for their counterparts in the central area (25.76 per 100,000) and the eastern area (23.70 per 100,000). By age group, the adolescents aged 20 to 24 years had the highest MR, at 33.69 per 100,000, and adolescents aged 10 to 14 years had the lowest MR, at 20.62 per 100,000 (Figure 1, Table 1).
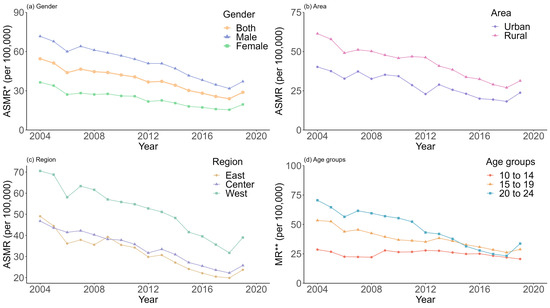
Figure 1.
Trends of (age-standardized) mortality rate in each subgroup between 2004 and 2019. Note: *, ASMR = Age-standardized mortality rate; **, MR = Mortality rate.

Table 1.
The (AS)MR and APC for adolescents aged 10 to 24 years, 2004 to 2019.
3.2. The Trend of Mortality among Adolescents Aged 10 to 24 Years, 2004–2019
Between 2004 and 2019, the national MR for adolescents that combined gender, area, region and age groups decreased by an average of 4.02% (95% Confidence interval [CI]: 3.74% to 4.30%) per year. The AAPC was −4.01% (−4.35% to −3.67%) for males, −4.27% (−4.77% to −3.77%) for females, −4.38 (−4.95% to −3.80%) for urban adolescents, and −3.79 (−4.34% to −3.24%) for rural adolescents, respectively. Among three different regions, the MR of eastern adolescents decreased faster than for western and central adolescents, while the AAPC was −4.50% (−5.02% to −3.98%), −4.07% (−4.58% to −3.56%), and −3.52% (−4.27% to −2.77%), respectively. For adolescents aged 20 to 24 years and adolescents aged 15 to 19 years, the MR decreased by an average of 7.46% (7.08% to 7.84%) and 4.17% (3.78% to 4.56%), respectively, while the adolescents aged 10 to 14 showed no significant improvement; the AAPC was −0.28% (−0.83% to 0.28%). The sensitivity analysis showed similar findings (Figure 1, Figure 2 and Figure S1, Table 1).
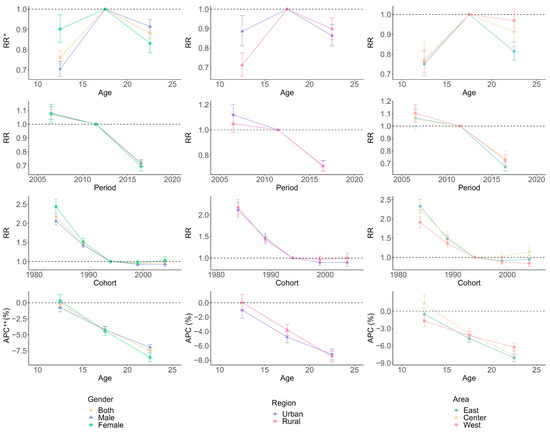
Figure 2.
Age, period and cohort trends in mortality in each subgroup, 2004–2018. Note: *, RR = Rate Ratio; **, APC = Annual Percentage change. The error bars represent the 95% confidence interval of the estimate.
3.3. APC Analysis of Mortality among Adolescents Aged 10 to 24 Years, 2004–2019
Compared with adolescents aged 15 to 19 years, the risk of death was lower in adolescents aged 10 to 14 years and adolescents aged 20 to 24 years; the RR was 0.76 (95% CI: 0.73, 0.80) and 0.88 (0.85, 0.91), respectively. The period and cohort risk both showed decreasing trends. The period risk declined from 1.07 (1.03, 1.11) to 0.71 (0.69, 0.73), while the cohort risk declined from 2.17 (2.09, 2.26) to 0.97 (0.92, 1.03). The subgroup results were consistent with the total sample (Figure 2, Table 1).
3.4. Overall Status of Cause-Specific Mortality among Adolescents Aged 10 to 24 Years, 2004–2019
Road injuries, drowning, intentional self-harm and sequelae, leukaemia, and falls were the top five causes of adolescent death in 2019, and the ASMR declined from 9.98, 5.35, 4.90, 3.00, and 1.41 per 100,000 to 4.96, 2.81, 2.66, 1.58, and 1.37 per 100,000, respectively. Within the top 15 causes, falls, ischemic heart diseases, epilepsy, and lower respiratory infections showed a higher rank in 2019 than in 2004. Moreover, some diseases, such as HIV/AIDS, malnutrition, lymphoma, and multiple myeloma, showed a higher ASMR in 2019 than in 2004 (Figure 3 and Figure 4).
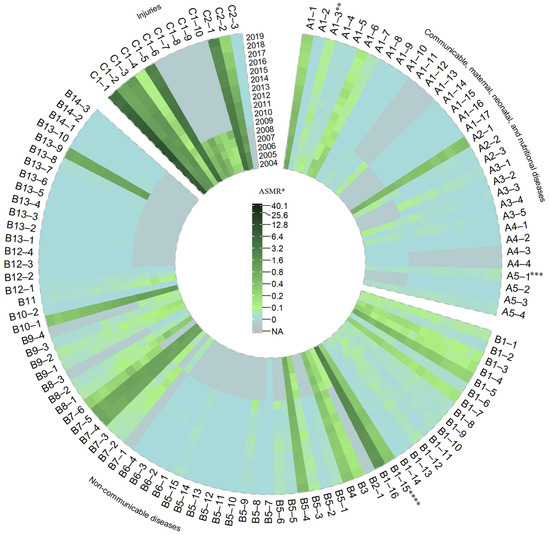
Figure 3.
The ASMR of adolescents aged 10 to 24 by cause of death, 2004 to 2019. Note: *, ASMR = Age-standardized mortality rate; **, A1–3, HIV/AIDS; ***, A5–1, malnutrition; ****, B1–15, lymphoma, and multiple myeloma.
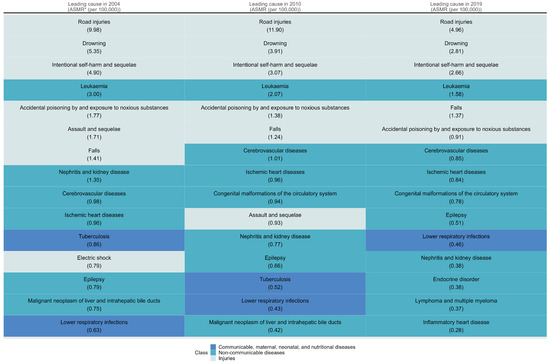
Figure 4.
The top 15 leading causes of death of adolescents aged 10 to 24 in 2004, 2010 and 2019. Note: *, ASMR = Age-standardized mortality rate.
3.5. Status of Cause-Specific Mortality by Gender and Areas
The change in causes of death among adolescents of different genders and areas was consistent with the overall pattern. Injuries, including road injuries, drowning, intentional self-harm and sequelae, and falls were leading causes in both males and females in 2019, with males showing a higher ASMR than females (7.16, 4.07, 3.18, and 1.94 per 100,000 vs. 2.51, 1.39, 2.09 and 0.74 per 100,000). Moreover, the ASMR for HIV/AIDS showed increasing trends in males but showed decreasing trends in females between 2004 and 2019. In both urban and rural adolescents, we found the ASMR of tuberculosis declined between 2004 and 2019, while the ASMR of lower respiratory infections increased in urban adolescents (Supplementary Figures S2–S9).
3.6. Status of Cause-Specific Mortality by Region
The change in causes of death among adolescents in different regions was also basically consistent with the overall pattern. But the ASMR of many causes, such as road injuries (7.32 per 100,000 vs. 3.63 and 4.41 per 100,000), drowning (3.61 per 100,000 vs. 1.99 and 2.96 per 100,000), and intentional self-harm and sequelae (3.30 per 100,000 vs. 2.54 and 2.25 per 100,000), were higher in western adolescents than in eastern and central adolescents. In western adolescents, tuberculosis (0.56 per 100,000) was in the top 15 causes of death in 2019 (Supplementary Figures S10–S15).
3.7. Status of Cause-Specific Mortality by Age Group
The top 15 causes of death for each age group differed from the overall pattern. The top three causes of death for adolescents aged 10 to 14 years were drowning, road injuries, and leukaemia. Congenital malformations of the circulatory system became the fifth leading cause of death among adolescents aged 10 to 14 years in 2019. Intentional self-harm and sequelae were more serious in the groups of adolescents aged 15 to 19 years and 20 to 24 years; in 2019, intentional self-harm and sequelae were the third and second leading causes of death among adolescents aged 15 to 19 years and 20 to 24 years, respectively. The mortality rates for causes of death such as falls and ischaemic heart disease in adolescents aged 10 to 14 years, ischaemic heart disease in adolescents aged 15 to 19 years, HIV/AIDS, iron-deficiency anaemia and cervical cancer in adolescents aged 20 to 24 years showed a higher MR in 2019 than in 2004 (Supplementary Figures S16–S21).
3.8. Association between Mortality and Economic Status, Education Level, as Well as Health Investment
In the univariate panel data regression model, GDP per capita, urbanization rate, illiteracy rate, education expenditure per capita, health personnel per 1000 population, and health beds per 1000 population were all associated with ASMR (Supplementary Table S3). In the multivariate panel data regression model, the ASMR of adolescents decreased by 5.18 (95% CI: 3.27, 7.08) per 100,000 for every increase in the number of health beds per 1000 population, but with an insignificant association with GDP per capita and illiteracy rate in the total sample. Other than the indicator of health beds, the AMSR decreased by 0.23 (0.06, 0.39) or 0.19 (0.03, 0.35) per 100,000 for every 1000 yuan increase in GDP per capita for males or rural adolescents, respectively, while for females, the AMSR increased by 0.82 (0.23, 1.41) per 100,000 for every percentage point increase in the illiteracy rate. When stratified by age group, we found that the MR increased by 1.48 (0.75, 2.22) per 100,000 for every percentage point increase in the illiteracy rate for adolescents aged 15 to 19 years. When stratified by cause of death, we found that the ASMR increased by 0.05 (0.02, 0.07) per 100,000 for every 1000 yuan increase in GDP per capita, and increased by 0.29 (0.18, 0.40) per 100,000 for every percentage point increase in the illiteracy rate for CMNN diseases; the ASMR increased by 0.24 (0.03, 0.45) per 100,000 for every percentage point increase in the illiteracy rate for NCDs, while the ASMR decreased by 0.12 (0.04, 0.21) per 100,000 for every 1000 yuan increase in GDP per capita for injuries (Table 2). The sensitivity analysis showed similar findings (Supplementary Table S4).
Table 2.
The association between all-cause (AS)MR (per 100,000) for adolescents aged 10 to 24 years and economic status, education level, as well as health investment in different subgroups.
4. Discussion
In this study, we found that the ASMR of adolescents aged 10 to 24 years in China decreased by 47% between 2004 and 2019, while similar trends were found in different genders, areas, regions, and age groups. We found the dramatic decline was accompanied by a change in the death patterns. Although the ASMR for most causes of death decreased between 2004 and 2019, there were some causes, such as HIV/AIDS, which became more severe in 2019 than in 2004, while there were also some causes, such as tuberculosis, leukaemia, road injuries, and drowning, despite the decreasing trends in ASMR, that resulted in a heavy burden of adolescent deaths in 2019. We additionally found that the decreased mortality was only associated with increased health investment, but the pattern was different in different subgroups.
This study first conducted the APC analysis and showed that the risk of death was highest among adolescents aged 15 to 19 years, where it was significantly higher than among those aged 10 to 14 years and 20 to 24 years. This might be due to the physical and psychological changes brought about by pubertal development, as well as the changing social roles of this age group [23]. Increased investment in education and health for this age group was essential, based on our findings. Many causes showed heavy burdens in adolescents aged 20 to 24 years, such as HIV/AIDs, tuberculosis, cardiovascular diseases, road injuries, and intentional self-harm and sequelae, which are worth paying attention to.
The burden of injuries, including road injuries, drowning, and intentional self-harm and sequelae, declined between 2004 and 2019; however, they were still the leading causes of death of adolescents aged 10 to 24 years in 2019. Among NCDs, cerebrovascular disease, ischaemic heart disease, and inflammatory heart disease remained the top 15 causes of adolescent mortality in 2019, indicating that the burden of cardiovascular disease in adolescents remains relatively serious. Meanwhile, lower respiratory infections and HIV/AIDs among CMNN diseases cause heavy burdens and rising trends, highlighting the pressing need for cause-specific interventions.
Both genders showed great achievements in reducing adolescent mortality: the ASMR of males and females decreased by 48% and 46%, respectively. But in 2019, the gender disparity in adolescent mortality was still evident, as the ASMR for males was approximately 1.9 times that for females. This finding was consistent with the previous study [24]. We found there was a decline in HIV/AIDs mortality among females, while there was a rise in HIV/AIDs mortality among males. This emphasized the necessity of formulating gender-specific preventive measures corresponding to the different infection patterns. Moreover, we found a great gap in the burden of injuries, such as road injuries, drowning, and intentional self-harm and sequelae, among males and females. Prefrontal cortex immaturity underlies the increase in adolescent risk-taking behaviour, which is the product of an imbalance between increased biologically driven novelty and immature self-regulatory capacity [25]. Females tend to show more anxiety and risk aversion in the face of stress than males [26], which might be the reason why males showed more risk-taking behaviours than females and were, therefore, more vulnerable [27,28,29]. We additionally found that male mortality was associated with economic status and health investment, while female mortality was associated with illiteracy rate and health investment. This indicated the need for gender-specific interventions to promote health equity.
The differences in ASMR between urban and rural areas shrank between 2004 and 2019. However, the ASMR of lower respiratory infections in urban adolescents was increasing, while that in rural adolescents was decreasing, and the burden in urban adolescents reversed the burden in rural adolescents in 2019. The improvement of adolescent malnutrition, along with the improvement of their immunity [30], might be the reasons for the declining trend in rural adolescents. Moreover, rural adolescents had a heavier burden of injuries than urban adolescents, which might be explained by the poor economic status and health care development, as well as the lack of supervision from families and communities [31]. More investments in economy and health were needed, given the situation that they were both associated with the mortality of rural adolescents.
From 2004 to 2019, the ASMR of adolescents in the eastern, central, and western areas decreased by 52%, 45%, and 45%, respectively. Among them, we found the burden of CMNN diseases, such as tuberculosis, decreased faster in western adolescents. However, western adolescents were still at higher risk of tuberculosis death than eastern and central adolescents. China was not only one of the 30 countries with a high TB burden globally but also the one with a high TB/HIV co-burden and experienced a high burden of drug-resistant TB [32]. Although there were great achievements in tuberculosis prevention, which might be due to the series of actions, including a national tuberculosis control plan, early screening, free treatment, patient management, etc. [33,34], more attention still needs to be paid to adolescents, especially in the western region.
A previous study found that all-cause mortality rates for adolescents aged 10 to 24 years in the Western Pacific region were similar to those in high-income countries, which was mainly due to the improved health status of adolescents in China [35]. This affirms China’s great achievements in the area of ensuring the survival of adolescents. Compared with the mortality data from CDC WONDER, Chinese adolescents aged 15 to 19 years and 20 to 24 years had lower mortality rates than American adolescents in 2019 [36]. Assault and sequelae, the second leading cause of death among American adolescents in 2017 [37], caused many fewer deaths for Chinese adolescents, which might be due to the great difference in culture and socio-political context [38]. The Program for the Development of Chinese Children (PDCC) 2001–2010 and the PDCC 2011–2020, both formulated by the Chinese government, set out consistent goals and strategies for children’s physical and mental health, education, social support and the protection of children’s legal rights [39,40], which might contribute to the dramatic decline of deaths. Moreover, previous studies indicated that improved economic status, education level, and health investment may be another possible reason for the dramatic decline in adolescent deaths in China [41,42,43]. However, we found that decreased mortality was associated with increased health investment but had an insignificant association with both GDP per capita and illiteracy rate, which might be due to the panel analysis at the macro level without individual data, but also indicated the importance of health investments.
5. Limitations and Future Reflections
This study filled up the blank of secular trends of cause-specific MR among adolescents aged 10 to 24 years over time by using data from DSP and exploring the association between mortality and economic status, education level, as well as health investment. However, there were several limitations. Firstly, this study used secondary data for analysis and lacked individual-level data, which could only be explored accordingly at the area level and not for intra-area variation. Secondly, there was an unexpectedly upward fluctuation in mortality from 2018 to 2019, but we observed the declining period and cohort risk in the APC analysis for both main analysis and sensitivity analysis, so more data or information were needed to explore the reason for this phenomenon. Thirdly, the expanding of surveillance points in 2013 might have influenced the distribution of characteristics within the study period, although most of the existing surveillance points (158/161) were included in the new system for the continuity of mortality data and the representation of the system [14,15]. Fourthly, because the causes of death were not completely consistent across the years, we deleted all causes that could not be matched according to the ICD-10 code; about 27% of causes before 2009 and 23% of causes after 2010 were omitted, which might influence the results to some extent. In addition, mismatches between years occasionally led to several causes of death without available data. Fifthly, there might be other confounders that were not controlled in our model due to data unavailability. Sixthly, we analysed the association by using panel data regression at the macro level, so the ecological fallacy might have some influence on our results. However, we provided a sensitive analysis, which supported our findings.
6. Conclusions
In conclusion, our findings indicate a notable reduction in mortality burden among Chinese adolescents aged 10 to 24 years between 2004 and 2019, and the trends were consistent across genders, areas, regions, and age groups. However, gender, area, regional, and age group differences persisted. Further interventions for males, adolescents in rural areas, adolescents in the western region, and adolescents aged 15 to 24 years are needed to promote health equity. In 2019, the leading causes of death of adolescents were still injuries, with road injuries, drowning, and intentional self-harm and sequelae being the top three causes of death among adolescents. Despite the significant decline in mortality for most CMNN diseases, there were still some causes of death with a serious burden, such as lower respiratory infections and tuberculosis, while the burden of HIV/AIDS even showed rising trends in male adolescents. Target efforts beyond increasing health investment, such as increasing the education level of females and adolescents aged 15 to 19 years old, should be put into the prevention of different regions according to the specific death patterns to reduce preventable mortality and ensure that no one is left behind.
Supplementary Materials
The following supporting information can be downloaded at: https://www.mdpi.com/article/10.3390/future1030008/s1, Table S1: Comparison of cause name, ICD10 codes, cause levels, and unique codes used in this study. Table S2: Co-linear results for economic status, education level, and health investment indicators. Table S3: The association between all-cause (AS)MR (per 100,000) for adolescents aged 10–24 years and economic status, education level, as well as health investment. Table S4: The association between all-cause (AS)MR (per 100,000) for adolescents aged 10 to 24 years and one-year-lagged economic status, education level, as well as health investment in different subgroups. Figure S1: Age, period, and cohort trends in mortality in each subgroup, 2005–2019. Figure S2: The ASMR of male adolescents aged 10 to 24 by cause of death, 2004 to 2019. Figure S3: The top 15 leading causes of death of male adolescents aged 10 to 24 in 2004, 2010, and 2019. Figure S4: The ASMR of female adolescents aged 10 to 24 by cause of death, 2004 to 2019. Figure S5: The top 15 leading causes of death of female adolescents aged 10 to 24 in 2004, 2010, and 2019. Figure S6: The ASMR of urban adolescents aged 10 to 24 by cause of death, 2004 to 2019. Figure S7: The top 15 leading causes of death of urban adolescents aged 10 to 24 in 2004, 2010, and 2019. Figure S8: The ASMR of rural adolescents aged 10 to 24 by cause of death, 2004 to 2019. Figure S9: The top 15 leading causes of death of rural adolescents aged 10 to 24 in 2004, 2010, and 2019. Figure S10: The ASMR of eastern adolescents aged 10 to 24 by cause of death, 2004 to 2019. Figure S11: The top 15 leading causes of death of eastern adolescents aged 10 to 24 in 2004, 2010, and 2019. Figure S12: The ASMR of central adolescents aged 10 to 24 by cause of death, 2004 to 2019. Figure S13: The top 15 leading causes of death of central adolescents aged 10 to 24 in 2004, 2010, and 2019. Figure S14: The ASMR of western adolescents aged 10 to 24 by cause of death, 2004 to 2019. Figure S15: The top 15 leading causes of death of western adolescents aged 10 to 24 in 2004, 2010, and 2019. Figure S16: The ASMR of adolescents aged 10 to 14 by cause of death, 2004 to 2019. Figure S17: The top 15 leading causes of death of adolescents aged 10 to 14 in 2004, 2010, and 2019. Figure S18: The ASMR of adolescents aged 15 to 19 by cause of death, 2004 to 2019. Figure S19: The top 15 leading causes of death of adolescents aged 15 to 19 in 2004, 2010, and 2019. Figure S20: The ASMR of adolescents aged 20 to 24 by cause of death, 2004 to 2019. Figure S21: The top 15 leading causes of death of adolescents aged 20 to 24 in 2004, 2010, and 2019.
Author Contributions
Conceptualization, Y.L. and Y.S.; Formal analysis, Y.L.; Methodology, Y.L.; Software, Y.L.; Validation, P.Z. and J.D.; Writing—original draft, Y.L.; Writing—review & editing, P.Z., J.D., D.S., S.C., Z.C., Y.Z., J.M. and Y.S. All authors have read and agreed to the published version of the manuscript.
Funding
The present research was supported by the Capital’s Funds for Health Improvement and Research (2022-1G-4251 to Y.S.) and the Natural Science Foundation of Beijing (Grant No. 7222247 to Y.S.).
Institutional Review Board Statement
Not applicable.
Informed Consent Statement
Not applicable.
Data Availability Statement
The mortality data were available in the yearbook published by China CDC. The economic status, education level, and health investment data was available in China Economic and Social Big Data Research Platform (https://data.cnki.net/, accessed on 14 December 2021).
Acknowledgments
We thank the staff of the DSPs, the National Bureau of Statistics, the former Ministry of Health of the People’s Republic of China, the former National Health and Family Planning Commission, and the National Health Commission for their contributions to data collection for this study.
Conflicts of Interest
The authors declare no conflict of interest.
References
- Millennium Development Goals (MDGs). Available online: https://www.who.int/news-room/fact-sheets/detail/millennium-development-goals-(mdgs) (accessed on 29 September 2023).
- Sustainable Development Goals: 17 Goals to Transform Our World. Available online: https://www.un.org/sustainabledevelopment/ (accessed on 14 February 2023).
- Kassebaum, N.; Kyu, H.H.; Zoeckler, L.; Olsen, H.E.; Thomas, K.; Pinho, C.; Bhutta, Z.A.; Dandona, L.; Ferrari, A.; Ghiwot, T.T.; et al. Child and Adolescent Health from 1990 to 2015: Findings from the Global Burden of Diseases, Injuries, and Risk Factors 2015 Study. JAMA Pediatr. 2017, 171, 573–592. [Google Scholar] [CrossRef] [PubMed]
- Patton, G.C.; Sawyer, S.M.; Santelli, J.S.; Ross, D.A.; Afifi, R.; Allen, N.B.; Arora, M.; Azzopardi, P.; Baldwin, W.; Bonell, C.; et al. Our future: A Lancet commission on adolescent health and wellbeing. Lancet 2016, 387, 2423–2478. [Google Scholar] [CrossRef]
- Global Strategy for Women’s, Children’s and Adolescents’ Health Data Portal. Available online: https://platform.who.int/data/maternal-newborn-child-adolescent-ageing/global-strategy-data (accessed on 16 February 2023).
- Global Accelerated Action for the Health of Adolescents (AA-HA!): Guidance to Support Country Implementation. Available online: https://www.who.int/publications/i/item/9789241512343 (accessed on 20 September 2023).
- Sawyer, S.M.; Azzopardi, P.S.; Wickremarathne, D.; Patton, G.C. The age of adolescence. Lancet Child Adolesc. Health 2018, 2, 223–228. [Google Scholar] [CrossRef] [PubMed]
- Azzopardi, P.S.; Hearps, S.J.; Francis, K.L.; Kennedy, E.C.; Mokdad, A.H.; Kassebaum, N.J.; Lim, S.; Irvine, C.M.; Vos, T.; Brown, A.D.; et al. Progress in adolescent health and wellbeing: Tracking 12 headline indicators for 195 countries and territories, 1990–2016. Lancet 2019, 393, 1101–1118. [Google Scholar] [CrossRef]
- GBD 2019 Diseases and Injuries Collaborators. Global burden of 369 diseases and injuries in 204 countries and territories, 1990–2019: A systematic analysis for the Global Burden of Disease Study 2019. Lancet 2020, 396, 1204–1222. [Google Scholar] [CrossRef]
- Boonen, T.J.; Li, H. Modeling and Forecasting Mortality with Economic Growth: A Multipopulation Approach. Demography 2017, 54, 1921–1946. [Google Scholar] [CrossRef]
- Gavurova, B.; Khouri, S.; Kovac, V.; Ferkova, M. Exploration of Influence of Socioeconomic Determinants on Mortality in the European Union. Int. J. Environ. Res. Public Health 2020, 17, 4699. [Google Scholar] [CrossRef] [PubMed]
- Honjo, K.; Iso, H.; Fukuda, Y.; Nishi, N.; Nakaya, T.; Fujino, Y.; Tanabe, N.; Suzuki, S.; Subramanian, S.V.; Tamakoshi, A.; et al. Influence of Municipal- and Individual-level Socioeconomic Conditions on Mortality in Japan. Int. J. Behav. Med. 2014, 21, 737–749. [Google Scholar] [CrossRef] [PubMed]
- Edney, L.C.; Haji Ali Afzali, H.; Cheng, T.C.; Karnon, J. Mortality reductions from marginal increases in public spending on health. Health Policy 2018, 122, 892–899. [Google Scholar] [CrossRef] [PubMed]
- Liu, S.; Wu, X.; Lopez, A.D.; Wang, L.; Cai, Y.; Page, A.; Yin, P.; Liu, Y.; Li, Y.; Liu, J.; et al. An integrated national mortality surveillance system for death registration and mortality surveillance, China. Bull. World Health Organ. 2016, 94, 46–57. [Google Scholar] [CrossRef]
- Yang, G.; Hu, J.; Rao, K.Q.; Ma, J.; Rao, C.; Lopez, A.D. Mortality registration and surveillance in China: History, current situation and challenges. Popul. Health Metr. 2005, 3, 3. [Google Scholar] [CrossRef] [PubMed]
- Zhou, M.; Wang, H.; Zhu, J.; Chen, W.; Wang, L.; Liu, S.; Li, Y.; Wang, L.; Liu, Y.; Yin, P.; et al. Cause-specific mortality for 240 causes in China during 1990–2013: A systematic subnational analysis for the Global Burden of Disease Study 2013. Lancet 2016, 387, 251–272. [Google Scholar] [CrossRef] [PubMed]
- Chinese Center for Disease Control and Prevention CfCN-CDC. National Disease Surveillance System Cause of Death Surveillance Data Set 2004; Military Medical Science Press: Beijing, China, 2009. (In Chinese) [Google Scholar]
- Chinese Center for Disease Control and Prevention CfCN-CDC; NCHS Statistical Information Center. China Cause of Death Surveillance Dataset 2019; China Science and Technology Press: Beijing, China, 2020. (In Chinese) [Google Scholar]
- Age-Period-Cohort Analysis. Available online: https://www.publichealth.columbia.edu/research/population-health-methods/age-period-cohort-analysis#Description (accessed on 15 April 2023).
- Yang, Y.; Land, K.C. Age-Period-Cohort Analysis: New Models, Methods, and Empirical Applications, 1st ed.; Chapman and Hall/CRC: Boca Raton, FL, USA, 2013. [Google Scholar]
- Rosenberg, P.S.; Anderson, W.F. Age-period-cohort models in cancer surveillance research: Ready for prime time? Cancer Epidemiol. Biomark. Prev. 2011, 20, 1263–1268. [Google Scholar] [CrossRef] [PubMed]
- Rosenberg, P.S.; Check, D.P.; Anderson, W.F. A web tool for age-period-cohort analysis of cancer incidence and mortality rates. Cancer Epidemiol. Biomark. Prev. 2014, 23, 2296–2302. [Google Scholar] [CrossRef]
- Ho, T.C.; Gifuni, A.J.; Gotlib, I.H. Psychobiological risk factors for suicidal thoughts and behaviors in adolescence: A consideration of the role of puberty. Mol. Psychiatry 2022, 27, 606–623. [Google Scholar] [CrossRef] [PubMed]
- Luo, D.M.; Yan, X.J.; Lei, Y.T.; Hu, P.J.; Zhang, J.S.; Song, Y.; Ma, J. Secular trends and geographic disparities of all-cause mortality among Chinese adolescents aged 10–24 years, between 1953 and 2010. Zhonghua Liu Xing Bing Xue Za Zhi Zhonghua Liuxingbingxue Zazhi 2020, 41, 184–189. [Google Scholar]
- Casey, B.J.; Jones, R.M.; Hare, T.A. The adolescent brain. Ann. N. Y. Acad. Sci. 2008, 1124, 111–126. [Google Scholar] [CrossRef]
- Gomes, M.G.S.; Tractenberg, S.G.; Orso, R.; Viola, T.W.; Grassi-Oliveira, R. Sex differences in risk behavior parameters in adolescent mice: Relationship with brain-derived neurotrophic factor in the medial prefrontal cortex. Neurosci. Lett. 2022, 766, 136339. [Google Scholar] [CrossRef]
- Miovsky, M.; Gavurova, B.; Ivankova, V.; Rigelsky, M.; Sejvl, J. Fatal injuries and economic development in the population sample of Central and Eastern European Countries: The perspective of adolescents. Int. J. Public Health 2020, 65, 1403–1412. [Google Scholar] [CrossRef]
- Adolescent and Young Adult Health. Available online: https://www.who.int/news-room/fact-sheets/detail/adolescents-health-risks-and-solutions (accessed on 25 October 2021).
- Simons, A.; Govender, R.; Saunders, C.J.; Singh-Adriaanse, R.; Van Niekerk, A. Childhood vulnerability to drowning in the Western Cape, South Africa: Risk differences across age and sex. Child Care Health Dev. 2020, 46, 607–616. [Google Scholar] [CrossRef]
- GBD 2016 Risk Factors Collaborators. Global, regional, and national comparative risk assessment of 84 behavioural, environmental and occupational, and metabolic risks or clusters of risks, 1990–2016: A systematic analysis for the Global Burden of Disease Study 2016. Lancet 2017, 390, 1345–1422. [Google Scholar] [CrossRef] [PubMed]
- The Ministry of Education and Other Four Departments Plans to Prevent Drowning among Primary and Middle School Students. Available online: http://www.moe.gov.cn/jyb_xwfb/gzdt_gzdt/s5987/202207/t20220729_649584.html (accessed on 26 April 2023). (In Chinese)
- Global Tuberculosis Report 2021. Available online: https://www.who.int/publications/i/item/9789240037021 (accessed on 22 January 2022).
- Office of the State Council on the Issuance of the National Tuberculosis Prevention and Control Plan (2001–2010) Notice. Available online: http://www.gov.cn/zhengce/zhengceku/2016-10/10/content_5116899.htm (accessed on 25 January 2022). (In Chinese)
- Office of the State Council on the Issuance of the National Tuberculosis Prevention and Control Plan (2011–2015) Notice. Available online: http://www.gov.cn/gongbao/content/2011/content_2020914.htm (accessed on 25 January 2022). (In Chinese)
- Patton, G.C.; Coffey, C.; Sawyer, S.M.; Viner, R.M.; Haller, D.M.; Bose, K.; Vos, T.; Ferguson, J.; Mathers, C.D. Global patterns of mortality in young people: A systematic analysis of population health data. Lancet 2009, 374, 881–892. [Google Scholar] [CrossRef] [PubMed]
- National Center for Health Statistics Mortality Data on CDC Wonder. Available online: https://wonder.cdc.gov/Deaths-by-Underlying-Cause.html (accessed on 20 September 2023).
- Heron, M. Deaths: Leading Causes for 2017. Natl. Vital Stat. Rep. 2019, 68, 1–77. [Google Scholar] [PubMed]
- Lozano, R.; Naghavi, M.; Foreman, K.; Lim, S.; Shibuya, K.; Aboyans, V.; Abraham, J.; Adair, T.; Aggarwal, R.; Ahn, S.Y.; et al. Global and regional mortality from 235 causes of death for 20 age groups in 1990 and 2010: A systematic analysis for the Global Burden of Disease Study 2010. Lancet 2012, 380, 2095–2128. [Google Scholar] [CrossRef]
- The Program for the Development of Chinese Children 2001–2010. Available online: http://www.scio.gov.cn/xwfbh/xwbfbh/wqfbh/39595/41756/xgzc41762/Document/1664775/1664775.htm (accessed on 19 January 2021). (In Chinese)
- The Program for the Development of Chinese Children 2011–2020. Available online: https://www.scio.gov.cn/ztk/xwfb/46/11/Document/976030/976030.htm,2011-08-08/2019-09-04 (accessed on 19 January 2021). (In Chinese)
- Niu, G.; Melenberg, B. Trends in mortality decrease and economic growth. Demography 2014, 51, 1755–1773. [Google Scholar] [CrossRef]
- Stewart, C.H.; Dundas, R.; Leyland, A.H. The Scottish school leavers cohort: Linkage of education data to routinely collected records for mortality, hospital discharge and offspring birth characteristics. BMJ Open 2017, 7, e015027. [Google Scholar] [CrossRef]
- Gallet, C.A.; Doucouliagos, H. The impact of healthcare spending on health outcomes: A meta-regression analysis. Soc. Sci. Med. 2017, 179, 9–17. [Google Scholar] [CrossRef]
Disclaimer/Publisher’s Note: The statements, opinions and data contained in all publications are solely those of the individual author(s) and contributor(s) and not of MDPI and/or the editor(s). MDPI and/or the editor(s) disclaim responsibility for any injury to people or property resulting from any ideas, methods, instructions or products referred to in the content. |
© 2023 by the authors. Licensee MDPI, Basel, Switzerland. This article is an open access article distributed under the terms and conditions of the Creative Commons Attribution (CC BY) license (https://creativecommons.org/licenses/by/4.0/).