Abstract
(1) Background: Previous studies have shown that stress increases the risk of bullying (including perpetration and victimization) in adolescents, and depressive symptoms are associated with both stress and bullying. However, the relationship between stress, depressive symptoms, and bullying has not been fully elucidated. In addition, previous studies have focused only on stressors but have ignored the role of resilience in evaluating individual’s stress. This study aimed to incorporate resilience into the assessment of an individual’s stress, which we named comprehensive stress; to examine the relationship between comprehensive stress and bullying; and then to investigate the potential role of depressive symptoms in this relationship. (2) Methods: We recruited 6353 middle and high school students from the 2021 Shanghai CDC Youth Risk Behavior Surveillance Project. After signing informed consent, participants provided demographic information and completed effective measures of stressors, resilience, depressive symptoms, and bullying. (3) Results: Latent profile analysis revealed four profiles of comprehensive stress, labeled as Low stressor–High resilience (37.57%, n = 2216), Moderate high stressor–Average resilience (14.38%, n = 848), Average stressor–Moderate low resilience (33.33%, n = 1966), and High stressor–Low resilience (14.72%, n = 868). In comparison to students in the Low stressor–High resilience profile, students in other profiles demonstrated higher likelihoods of engaging in bullying victimization and perpetration, as well as higher levels of depressive symptoms. Specifically, students in the High stressor–Low resilience profile had the highest odds of bullying victimization (OR = 6.74, 95% CI: 4.92–9.22) and perpetration (OR = 5.15, 95% CI: 3.56–7.46), along with the highest level of depressive symptoms (β = 11.35, Se(β) = 0.17). Students in the Average stressor–Moderate low resilience profile had a moderate increase in the odds of bullying victimization (OR = 2.21, 95% CI: 1.63–3.00) and perpetration (OR = 2.69, 95% CI: 1.91–3.80), as well as a moderate level of depressive symptoms (β = 5.03, Se(β) = 0.13). Students in the Moderate high stressor–Average resilience profile also showed increased odds of bullying victimization (OR = 2.99, 95% CI: 2.12–4.20) and perpetration (OR = 2.80, 95% CI: 1.88–4.20), as well as a moderate level of depressive symptoms (β = 4.44, Se(β) = 0.16). Depressive symptoms were positively correlated with both perpetration and victimization. Furthermore, the mediating role of depressive symptoms between comprehensive stress and bullying was observed. (4) Conclusions: Combining stressors and resilience is crucial when evaluating an individual’s stress. Comprehensive stress is associated with bullying, and depressive symptoms may partially mediate this relationship.
1. Introduction
School bullying is a highly pervasive issue among children and adolescents worldwide, and it could be defined as intentional and aggressive behaviour occurring repeatedly against a victim where there is a real or perceived power imbalance and where the victims feel vulnerable and powerless to defend themselves. Bullying behaviours can be physical, including hitting, kicking and the destruction of property; verbal, such as teasing, insulting, and threatening; or relational, through the spreading of rumours and exclusion from a group [1].
In 2019, the UNESCO (United Nations Educational, Scientific and Cultural Organization) estimated that almost one-third of students globally have experienced bullying in the past month [2]. School bullying among Chinese adolescents is also characterized by a high prevalence. A representative survey conducted in 2016 from seven provinces showed that the prevalence of being bullied among all pre-college school types was 26.1%, while that of bullying perpetration was 9.3% [3]. A multi-center study [4] conducted in Beijing, Chongqing, and nine other provinces revealed that 11.1% of students interviewed have been involved in moderate or frequent bullying. A survey conducted in Xi’an city among middle school students found that approximately 54.9% reported having experienced bullying, with about 44.6% of students encountering such situations in the past year [5]. Evidence has pointed out that bullying may contribute to a range of negative consequences for physical and mental health. For example, victims may experience post-traumatic stress disorder (PTSD) [6] and various psychosocial problems [7] including loneliness, anxiety, emotional distress, and low self-esteem. Additionally, somatic symptoms, poor academic achievement, and difficulties in psychosocial adjustments were commonly observed [4]. Even violent or suicidal tendencies were potential outcomes [8]. It is important to note that both victims and perpetrators can experience these consequences [9].
In light of emerging research on bullying, a growing comprehension of its intricate dynamics is now coming to the fore. A myriad of interrelated factors associated with school bullying have been diligently unraveled [10,11], encompassing individual, school, family, and community factors. The aforementioned domains have been found to overlap with the dimensions associated with chronic stressors during adolescence [12]. Chronic stressors such as academic demands, teacher interactions, peer relationships, and family issues were considered significant influencing factors for bullying [13]. Resilience, which refers to the ability of individuals to adapt, cope, and recover from adversity, stress, and challenges [14], played a crucial role in mitigating the negative effects of chronic stressors and involvement in bullying [15]. Furthermore, resilience has been reported as a negative predictor of stress [16]. Thus, it can be inferred that both stressors and resilience are indispensable components of an individual’s stress assessment. However, previous studies have primarily focused on measuring an individual’s stress solely through the examination of stressors, often treating resilience as an independent variable. Consequently, it is essential to comprehensively assess adolescents’ stress by incorporating daily chronic stressors and resilience. The importance of addressing mental health issues was underscored in previous bullying research [7]. Depressive symptoms, a prevalent mood disorder among adolescents, are not only influenced by early life stress and current perceived stress [17,18], but also associated with health risk behaviors such as bullying perpetration and victimization [19,20].
In summary, the association between stressors, resilience, depressive symptoms, and bullying behavior is complicated and requires further integrative analysis. Therefore, we conducted a large cross-sectional study aimed at comprehensively assessing the stress levels among Chinese adolescents and exploring their relationship with school bullying. We hypothesized that comprehensive stress is associated with bullying, with depressive symptoms playing a mediating role in this relationship.
2. Materials and Methods
2.1. Participants
The cross-sectional study was conducted between May and June 2021, using a resampling method from schools previously sampled for the Shanghai CDC Youth Risk Behavior Surveillance Project 2021. Stratified by school level, subsequent equal-proportion stratified sampling was conducted within each school at various grades, and all students in the sampled classes were included. Participants with significant cognitive impairments or mental disorders, and individuals who failed to sign the necessary consent forms, were excluded from this study. A total of 6353 questionnaires were collected from 198 classes in 11 districts of Shanghai, and primary information was obtained through a questionnaire that included sociodemographic characteristics, basic family information, depressive symptoms, stressors, resilience, bullying victimization, and bullying perpetration. A total of 455 (7.16%) questionnaires with extremely biased responses, excessive missing data, or poor data quality were identified and excluded, and 5898 (92.84%) valid questionnaires were included for analysis. Among the participants, there were 3043 (51.59%) boys and 2855 (48.41%) girls. The age range of the sample spanned from 10 to 21 years, with an average age of (14.94 ± 2.09) years.
2.2. Measures
2.2.1. Daily Chronic Stressors
A self-administered questionnaire, “Urban Secondary School Students’ Stressor Evaluation Questionnaire”, was utilized to measure students’ daily chronic stressor levels [21]. The questionnaire consisted of 28 items that were categorized into four dimensions, study stressors, self stressors, family stressors, and interpersonal stressors, with higher total scores indicating greater levels of stressors. The questionnaire demonstrated good reliability and validity, as evidenced by a Cronbach’s α coefficient of 0.935, a Guttman fraction confidence of 0.884, and a retest reliability of 0.679.
2.2.2. Psychological Resilience
A simplified version of “the Resilience scale for Chinese Adolescents, (RSCA)” [22] was used to assess middle and high school students’ resilience. Maintaining the five dimensions of the original scale, 2 items were retained under each dimension. The Likert 5-point scoring method was utilized with scores ranging from 1 (“completely inconsistent”) to 5 (“completely consistent”). Questions 16, 26, and 27 were reverse-scored. The higher the total score, the higher the degree of resilience. The simplified scale showed good homogeneity reliability (Cronbach’s α coefficient >0.8), internal consistency reliability (Spearman–Brown coefficient >0.8), and structural validity (the correlation coefficients were 0.686–0.741 between the scores of each dimension and the total scores, and 0.309–0.590 between each dimension). The total scores of the simplified scale were significantly and negatively correlated with anxiety-related questions for the same subjects (r = − 0.498, p < 0.01).
2.2.3. Depressive Symptoms
To evaluate the depressive symptoms of students over the past week, a 10-item version of the Center for Epidemiologic Studies Depression Scale (CES-D-10) [23] was utilized. The scale was developed by Anderson et al.; included three dimensions, somatic symptoms, depressed mood, and positive mood; and has been demonstrated to possess good validity and reliability. Symptoms were rated on a four-point scale, with higher values indicating a greater frequency of occurrence. Higher scores on the CES-D-10 indicate more severe depressive symptoms. The validity of this scale was examined by Xiong [24], and the internal consistency coefficient (Cronbach’s α) was 0.78 in the non-clinical adolescent sample.
2.2.4. Bullying Victimization and Perpetration
In this study, we employed the Chinese Youth Health Risk Behavior Surveillance Questionnaire, which is an adapted version of the Youth Risk Behavior Surveillance System (YRBSS) questionnaire widely employed in the United States. The validity and credibility of the questionnaire were demonstrated through the “National Youth Health Risk Behavior Survey 2005” [25]. Six items, each pertaining to bullying perpetration and victimization, were extracted from the previous questionnaire and then modified as necessary to effectively assess bullying. Selected items included physical violence, verbal violence, sexual harassment, emotional neglect, and cyberbullying. Participants were asked to report the frequency of their experiences as victims or perpetrators during the previous month. The answer options for each item on the bullying victimization questionnaire were “never”, “occasional”, and “often”, with an additional response choice of “unclear” on the bullying perpetration questionnaire. In both scales, the participant was defined as victim or perpetrator as long as the response was “often” to any item. The Cronbach’s α coefficients for the bullying victimization questionnaire and bullying perpetration questionnaire in the current sample were 0.71 and 0.68, respectively.
2.3. Covariates
A number of variables were proposed to be related to adolescences’ stress and bullying, such as gender, grade, parental education level, perceived household income level, academic performance, and body mass index (BMI). Parental education level was categorized into four groups: primary or lower, elementary or high school, college, postgraduate or higher. Students’ perceived household income level was classified as poor, about the same, and rich. Students’ self-reported academic performance was divided into three categories: low, middle, and high. According to the criteria of “Screening standard for malnutrition of school-age children and adolescents” and “Screening for overweight and obesity among school-age children and adolescents”, BMI status was classified as thin, normal, overweight, or obese. The above data were collected through questionnaires.
2.4. Statistical Analyses
Statistical analyses were performed using SPSS 26.0 (IBM Corp., New York, NY, USA) and R (version 4.1.3) software (R Core Team, Vienna, Austria). Continuous variables with a normal distribution are described using means and standard deviations (SDs), while categorical variables are presented as frequencies with corresponding percentages. Firstly, latent profile analysis (LPA), an empirically derived clustering method that aims to uncover hidden groups with similar responses based on the observed data and to determine the number of homogeneous groups [26], was utilized to identify latent stress profiles. These profiles were collectively referred to as comprehensive stress and were assessed based on study stressors, self stressors, family stressors, interpersonal stressors, interpersonal assistance, family support, positive perception, emotional control, goal focus, and total resilience. To determine the optimal profile model, solutions with 1 to 5 profiles were studied and multiple fitted indicators were tested. The optimal number of profiles was determined by the following model fit indices, with lower values indicative of better fit [27,28]: Akaike Information Criterion (AIC), Consistent AIC (CAIC), Bayesian Information Criterion (BIC), and Sample-Size-adjusted BIC (aBIC). Entropy was computed to determine the accuracy of profile classification, with values ranging from 0 to 1, with higher values indicating better separation between profiles [29].If the p value of the Bounded Likelihood Ratio Test (BLRTp) was below 0.05, it indicated that the model with one less class should be rejected in favor of the estimated model [30]. Interpretability and parsimony were also considered in optimal model selection. Next, the chi-square test and t-test were used to detect the difference in characteristics of students with different comprehensive stress. The factors found significant in the bivariate analysis at a 10% level were considered for further analysis in the multivariable regression analysis, which was built using the backward elimination approach. Then, after adjusting for gender, grade, parental education level, perceived household income level, academic performance, and BMI, the association between comprehensive stress or (and) depressive symptoms and bullying was analyzed using logistic regression and the association between comprehensive stress and depressive symptoms was tested using linear regression. The program RMediation in R version 4.1.3 [31] was used to examine the indirect effects of comprehensive stress on bullying through depressive symptoms. RMediaton builds upon the PRODCLIN program by producing more accurate confidence intervals (CIs) by using three methods: Monte Carlo, asymptotic normal distributions, and distributions of products. Simulations studies suggest that the distribution of products provides more accurate CIs and optimal coverage compared to bias-corrected bootstrap and the percentile resampling method [31]. If the RMediation analysis yields CIs that do not include zero, then the indirect effect is considered statistically significant. The proportion of missing data in our study was small, ranging from 0% to 2.7%, which falls below the threshold of 5%. The missing completely at random (MCAR) test revealed that the missing data were missing at random. Therefore, no special treatment was implemented for missing data in our analysis.
3. Results
3.1. Types of Comprehensive Stress by LPA
Five unconditional LPA models with an increasing number of profiles (1–5) were examined, and LPA fit indices for all models are summarized in Table 1. The findings suggested that all the models adequately captured the latent heterogeneity in stressors and resilience, as indicated by BLRTp indices. And it can be found that AIC, CAIC, BIC, and aBIC all decreased monotonically with the increase in profiles. The entropy first decreased, after which there was a small recovery in the 4-Profiles model, and then decreased again in the 5-Profiles model. Since the high-entropy value implies high classification accuracy, an entropy value of 0.86 indicated that the four-profile model provided a clear classification. Considering the simplicity of relative distinguishability of the model comprehensively, we chose the four-profile solution as the final model.

Table 1.
Latent profile analysis model fit indices.
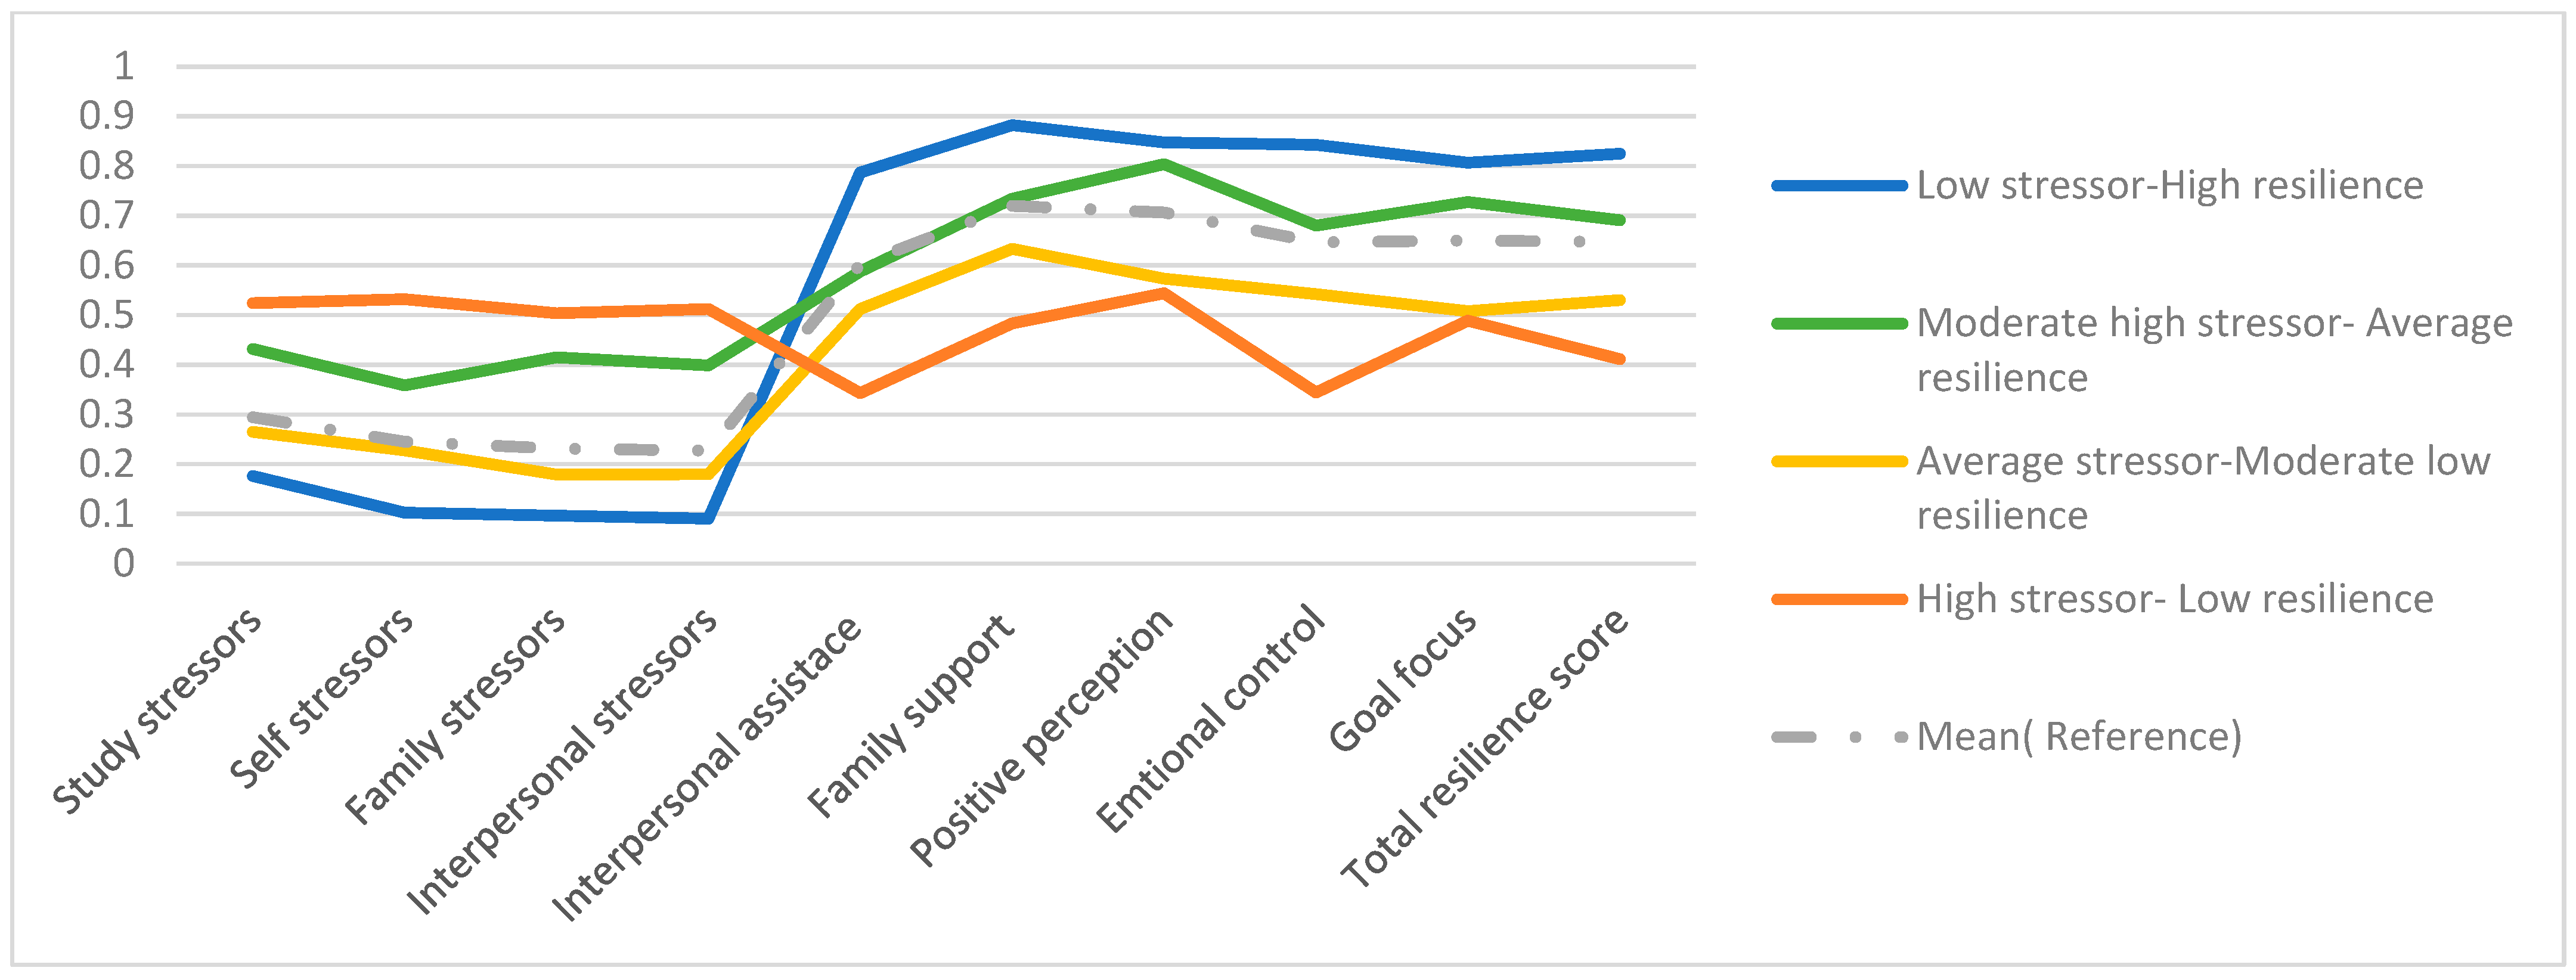
Figure 1 summarizes the characteristics of the four profiles of comprehensive stress. The profiles differed from one another with respect to stressors and resilience, and we labeled them as Low stressor–High resilience (37.57%), Moderate high stressor–Average resilience (14.38%), Average stressor–Moderate low resilience (33.33%), and High stressor–Low resilience (14.72%).
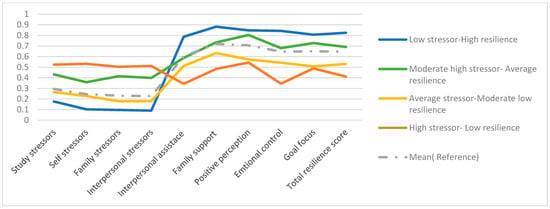
Figure 1.
Conditional probability distribution of the 4 potential categories.
3.2. Participants’ Characteristics Using Comprehensive Stress Profiles
Participant characteristics are displayed in Table 2 overall and using comprehensive stress profiles. The results indicated no significant difference in ethnicity or BMI status among different comprehensive stress profiles. However, significant differences were observed in other variables for different profiles. Specifically, the CES-D-10 scores varied among the groups characterized as Low stressor–High resilience (3.61 ± 3.03), Moderate high stressor–Average resilience (8.32 ± 4.44), Average stressor–Moderate low resilience (8.94 ± 4.34), and High stressor–Low resilience (15.48 ± 5.39), with the highest scores observed in the High stressor–Low resilience group. These differences were also evident in pairwise comparisons between the groups. This study also revealed that 333 (5.65%) participants reported bullying perpetration and 474 (8.04%) participants reported victimization. Furthermore, differences in the rates of bullying were observed among the different potential profiles, with the High stressor–Low resilience group demonstrating the highest rates of both bullying victimization and perpetration.
Table 2.
Characteristics of participants by comprehensive stress profiles.
3.3. Comprehensive Stress, Depressive Symptoms, and Bullying
The association between comprehensive stress and bullying was revealed. After adjusting for potential confounders, the group at highest risk of being involved in bullying was High stressor–Low resilience (OR:6.74, 95% CI: 4.92–9.22)), followed by Moderate high stressor–Average resilience (OR:2.99, 95% CI:2.12–4.20), and then the Average stressor–Moderate low resilience (OR:2.21, 95% CI: 1.63–3.00), as compared to the Low stressor–High resilience. Similar findings had also been observed in the analysis of comprehensive stress and perpetration. Detailed data can be found in Table 3. Then, we performed linear regression analyses to examine the association between different profiles and depressive symptoms (Table 4). After controlling for potential confounders, the High stressor–Low resilience (β = 11.34, p < 0.01), Average stressor–Moderate low resilience (β = 5.03, p < 0.01), and Moderate high stressor–Average resilience (β = 4.44, p < 0.01) groups had higher scores of CES-D10 in contrast to the Low stressor–High resilience group. Moreover, there was an association between depressive symptoms and bullying. Elevated CES-D-10 scores increased the risk of bullying victimization (OR = 1.12, p < 0.01) and perpetration (OR = 1.10, p < 0.01) after controlling for potential confounders.
Table 3.
Association between comprehensive stress and bullying.
Table 4.
Association between comprehensive stress and depressive symptoms.
3.4. Mediating Effect of Depressive Symptoms on the Association between Comprehensive Stress and Bullying
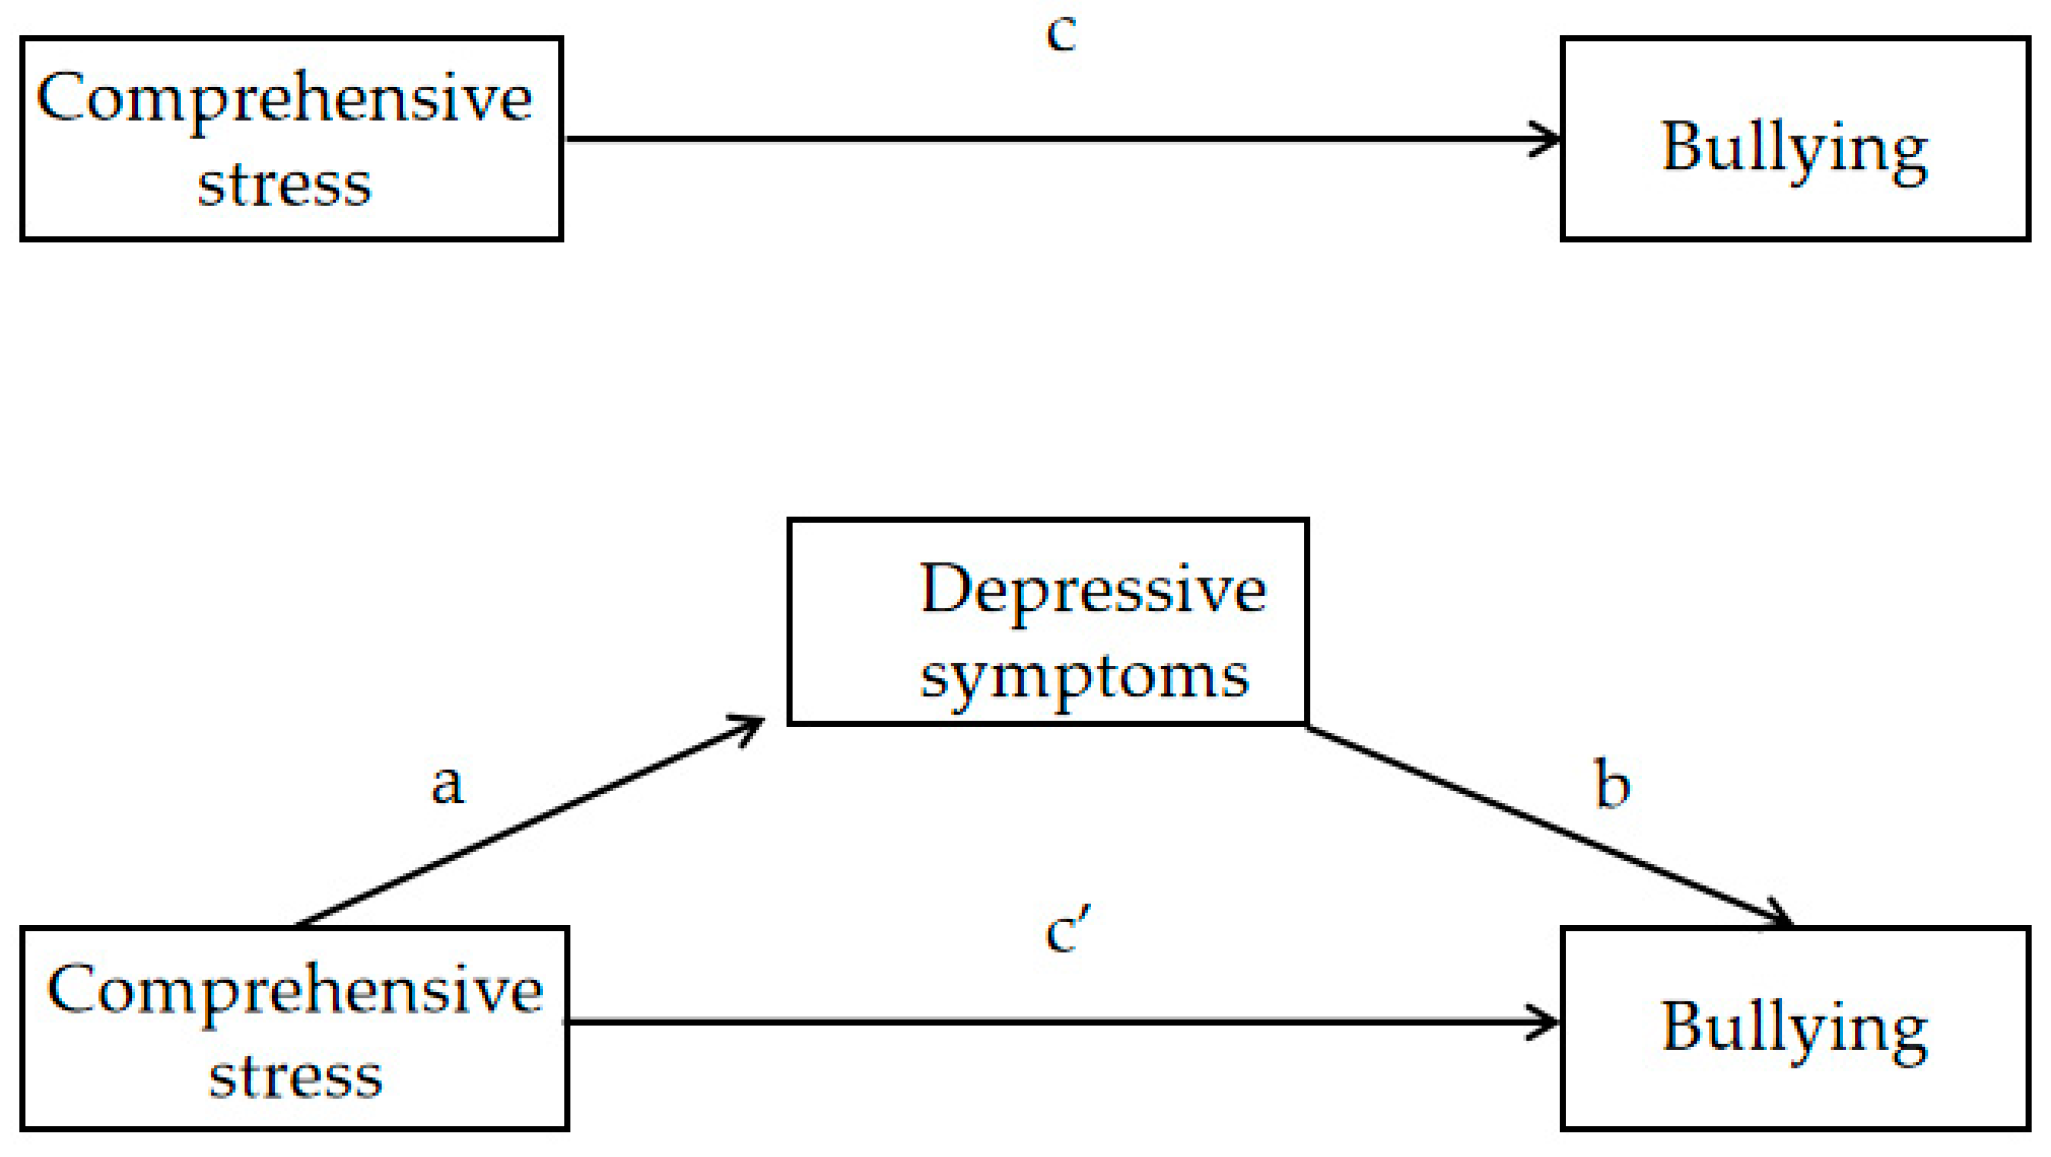
The path diagram of the mediation model is shown in Figure 2. As shown in Table 5 the mediating effect of depressive symptoms between comprehensive stress and students’ bullying behaviors was observed. In the analysis of victimization, compared with the Low stressor–High resilience group, the indirect effects of the Average stressor–Moderate low resilience group (Za*Zb = 0.37, 95% CI: 0.25–0.49) and Average stressor–Moderate low resilience group (Za*Zb = 0.33, 95% CI: 0.22–0.44) through depressive symptoms on victimization were significant. However, the indirect effect of depressive symptoms on the relationship between the High stressor–Low resilience group and victimization compared with the Low stressor–High resilience group was not found to be statistically significant (95% CI included 1). In addition, after adding mediation, the direct effects of the Average stressor–Moderate low resilience group (β = 0.41, p < 0.05) and Moderate high stressor–Average resilience group (β = 0.76, p < 0.01) on victimization were still significant, indicating that depressive symptoms played a partial mediating role. A significant partial mediating role of depressive symptoms in the association between comprehensive stress and perpetration was also seen. Detailed data are shown in Table 5.
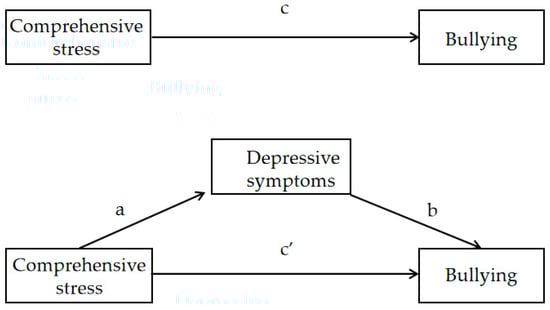
Figure 2.
Path diagram of mediation model of comprehensive stress, depressive symptoms, and bullying of adolescent. Path a represents the effect of comprehensive stress on depressive symptoms (the mediator being examined), path b represents the effect of depressive symptoms on bullying, path c represents the total effect of comprehensive stress on bullying, and path c’ reports the effect of comprehensive stress on bullying after controlling for depressive symptoms.
Table 5.
Mediation of depressive symptoms in the association between comprehensive stress and bullying.
4. Discussion
In the present study, we conducted a cross-sectional study to perform an LPA of comprehensive stress and to investigate the associations between comprehensive stress, depressive symptoms, and adolescents’ bullying. The LPA used in this study revealed four profiles of comprehensive stress in a sample of students in Shanghai: Low stressor–High resilience, Moderate high stressor–Average resilience, Average stressor–Moderate low resilience, and High stressor–Low resilience. Additionally, comprehensive stress was associated with bullying, and depressive symptoms played a partial mediating role in this relationship.
This study offers a unique investigation into comprehensive stress with the use of LPA, a person-centered research strategy. Unlike past studies that focused solely on stressors or feelings, our study considered resilience as a dynamic and interactive process involving both innate traits and the external environment, integrating it into the assessment of comprehensive stress innovatively. Our findings suggested that four groups are the optimal choice to describe differences in students’ comprehensive stress. In addition, there were differences in demographic factors between these profiles, such as gender, grade, parental education level, family structure, academic performance, and social economic status. These dissimilarities align, to some extent, with previous investigations [32,33,34,35,36,37], although earlier studies treated stress and resilience as separate variables during analysis.
The prevalence of bullying among adolescents in Shanghai remains a serious concern, with 8.04% of respondents reporting being victims and 5.65% were bullies. These findings emphasized the urgent need for interventions to address bullying. The present study observed that comprehensive stress correlates with both bullying perpetration and victimization. Similar results were found in recent studies. According to a 10-year trend analysis, all forms of violence, including physical violence, fighting, and bullying, were linked to greater psycho-social stressors in both boys and girls [38]. In addition, research revealed a significant positive correlation between stressors and bullying victimization among adolescents, indicating that stressors may be a significant risk factor [39] and predictor [20] of bullying victimization. Furthermore, research has indicated that family support acts as a resilience factor that moderates the relationship between stressors and bullying [40]. Resilience has also been shown to mitigate the negative effects of stressors on adolescents’ mental health and well-being, potentially reducing the risk of experiencing bullying victimization [41,42]. Thus, it becomes evident that prior studies have examined the relationship between stressors, resilience, and bullying. However, this study extends upon previous research by evaluating an individual’s comprehensive stress and exploring its association with bullying.
Another key finding of our study concerned the relationship between comprehensive stress and depressive symptoms. The groups were arranged in order of increasing CES-D-10 scores: Low stressor–High resilience group, Average stressor–Moderate low resilience group, Moderate high stressor–Average resilience group, and High stressor–Low resilience group. Chronic stressor exposure has been demonstrated to alter the functionality of the hypothalamic–pituitary–adrenal (HPA) axis [43], which is a known risk factor for depression [44]. Resilience was able to effectively mitigate the levels of depression and anxiety induced by stressful events, thereby promoting better mental health [45,46]. Our data also revealed a significant correlation between depressive symptoms and bullying (both perpetration and victimization). Consistently, a bidirectional prospective association between depression symptoms and victimization was found in this study by Anat et al. [47]. Geel et al. suggested that emotional–behavioral traits like depression may increase vulnerability to bullying during adolescence [48]. Children with depression may also engage in aggressive behavior due to difficulties with emotion regulation, which is a common feature of emotion regulation disorder, and may increase their risk of developing violent tendencies [49,50]. An important finding of this study was that the association between the Moderate high stressor–Average resilience and Average stressor–Moderate low resilience groups and victimization, and the association between the high stressor–low resilience, Moderate high stressor–Average resilience, and Average stressor–Moderate low resilience groups and perpetration were partially mediated by depressive symptoms compared to the low stressor–high resilience group.
These findings provide valuable insights for the development and implementation of targeted interventions and prevention strategies against bullying behaviors among adolescents. For instance, it suggests the potential integration of students’ stressors and resilience to estimate the likelihood of engaging in bullying, emphasizing the significance of addressing depressive symptoms in bullying prevention. Schools and the wider community should offer professional counseling services, and parents should carefully monitor their children’s mental well-being, assisting students in managing negative emotions, alleviating psychological stress, and mitigating depressive symptoms.
Limitations
There are several limitations in our study that warrant discussion. First, as the design of this study is cross-sectional, it is challenging to infer the causality and direction of the relationships, so further longitudinal studies are necessary to investigate the relationship between comprehensive stress, depressive symptoms, and bullying. Second, research suggests that the role of bully–victim may increase the risk of mental disorders more broadly than pure bullies or pure victims; however, we did not break down this relationship in our study. Since we define bullying as experiencing or perpetrating it twice or more in the last 30 days, the proportion of bullies was quite small, and the proportion of bully–victims was even smaller. Therefore, we did not consider the cross-relationship between bullies and victims in our analysis. Third, we utilized a latent profile analysis approach, which assigned membership based on the most probable class and treated the classes as discrete groups in further analysis. There may have been misclassified individuals and classification uncertainties; to address this drawback of LPA, we used a good entropy measure in our study. Fourth, participants in this study were middle and high school students from Shanghai. Future research could expand to include more schools in different provinces through China. Fifth, it is worth noting that our study did not include certain variables, such as school climate, that may impact bullying and victimization [51]. Therefore, future research should consider incorporating these variables to gain a more comprehensive understanding of the phenomenon.
5. Conclusions
In conclusion, our study found a correlation between comprehensive stress and both depressive symptoms and bullying among adolescents. Our data showed that depressive symptoms were increased in other groups compared to the Low stressor–High resilience group, and depressive symptoms may mediate the relationship between comprehensive stress and bullying. Although the causality and direction of the relationships are currently undetermined, this study provides a possible direction for future studies. Bullying prevention and intervention strategies among adolescents should take comprehensive stress and depressive symptoms into account.
Author Contributions
Conceptualization, M.T. (Maiheliyakezi Tuersunniyazi), M.T. (Min Tong), L.W. and H.S.; methodology, M.T. (Maiheliyakezi Tuersunniyazi), M.T. (Min Tong), L.W. and H.S.; software, M.T. (Maiheliyakezi Tuersunniyazi), M.T. (Min Tong) and L.W.; validation, M.T. (Maiheliyakezi Tuersunniyazi) and M.T. (Min Tong); formal analysis, M.T. (Maiheliyakezi Tuersunniyazi), M.T. (Min Tong) and L.W.; investigation, L.W., S.Z. and Y.L.; resources, H.S.; data curation, L.W., S.Z. and Y.L.; writing—original draft preparation, M.T. (Maiheliyakezi Tuersunniyazi) and M.T. (Min Tong); writing—review and editing, M.T. (Maiheliyakezi Tuersunniyazi), M.T. (Min Tong) and H.S.; visualization, M.T. (Maiheliyakezi Tuersunniyazi), M.T. (Min Tong) and L.W.; supervision, H.S.; project administration, H.S.; funding acquisition, H.S. All authors have read and agreed to the published version of the manuscript.
Funding
This work was supported by the Key Discipline Program of Sixth Round of the Three-Year Public Health Action Plan (Year 2023-2025) of Shanghai, China: GWVI-11.1-32.
Institutional Review Board Statement
This study was approved by the Ethics Committee of the School of Public Health, Fudan University (IRB number 2021-06-0906).
Informed Consent Statement
Informed consent was obtained from all subjects involved in the study.
Data Availability Statement
Data cannot be made available online, because of ethical restrictions and confidentiality agreements. However, data can be requested for research collaboration.
Acknowledgments
We are grateful to the participants for their involvement and we thank all the staff participating for data collection.
Conflicts of Interest
The funders had no role in the design of the study; in the collection, analyses, or interpretation of data; in the writing of the manuscript; or in the decision to publish the results.
References
- Olweus, D. Bullying at School: What We Know and What We Can Do; Blackwell Publishing: Malden, MA, USA, 1993; p. 140. [Google Scholar]
- UNESCO. Behind the Numbers: Ending School Violence and Bullying; United Nations Educational Scientific Organization, UNESO: Paris, France, 2019; p. 70. [Google Scholar]
- Han, Z.; Zhang, G.; Zhang, H. School Bullying in Urban China: Prevalence and Correlation with School Climate. Int. J. Environ. Res. Public Health 2017, 14, 1116. [Google Scholar] [CrossRef] [PubMed]
- Zhang, H.; Zhou, H.; Tao, T. Bullying Behaviors and Psychosocial Adjustment Among School-Aged Children in China. J. Interpers Violence 2019, 34, 2363–2375. [Google Scholar] [CrossRef] [PubMed]
- Zhu, Y.; Chan, K.L. Prevalence and Correlates of School Bullying Victimization in Xi’an, China. Violence Vict. 2021, 30, 714–732. [Google Scholar] [CrossRef] [PubMed]
- Nielsen, M.B.; Tangen, T. Post-Traumatic Stress Disorder as a Consequence of Bullying at Work and at School. A Literature Review and Meta-Analysis. Aggress. Violent Behav. 2015, 21, 17–24. [Google Scholar] [CrossRef]
- Wen, Y.; Zhu, X.; Haegele, J.A.; Yu, F. Mental Health, Bullying, and Victimization Among Chinese Adolescents. Children 2022, 9, 240. [Google Scholar] [CrossRef]
- Peng, C.; Hu, W. Self-Harm, Suicidal Ideation, and Suicide Attempts in Chinese Adolescents Involved in Different Sub-Types of Bullying: A Cross-Sectional Study. Front. Psychiatry 2020, 11, 565364. [Google Scholar] [CrossRef]
- Hong, J.S.; Espelage, D.L. A Review of Research on Bullying and Peer Victimization in School: An Ecological System Analysis. Aggress. Violent Behav. 2012, 17, 311–322. [Google Scholar] [CrossRef]
- Álvarez-García, D.; García, T. Predictors of School Bullying Perpetration in Adolescence: A Systematic Review. Aggress. Violent Behav. 2015, 23, 126–136. [Google Scholar] [CrossRef]
- Zych, I.; Farrington, D.P. Childhood Risk and Protective Factors as Predictors of Adolescent Bullying Roles. Int. J. Bullying Prev. 2021, 3, 138–146. [Google Scholar] [CrossRef]
- Núñez-Regueiro, F.; Núñez-Regueiro, S. Identifying Salient Stressors of Adolescence: A Systematic Review and Content Analysis. J. Youth Adolesc. 2021, 50, 2533–2556. [Google Scholar] [CrossRef]
- Hu, X.L. Analysis of the Causes and Countermeasures of the High Incidence of School Bullying in Primary and Secondary Schools. J. Chin. Soc. Educ. 2018, 1, 31–37. [Google Scholar]
- Goldstein, S.; Brooks, R.B. Handbook of Resilience in Children; Springer: Berlin/Heidelberg, Germany, 2005. [Google Scholar]
- Lili, W.; Dajun, Z. Bullying and Social Anxiety in Chinese Children: Moderating Roles of Trait Resilience and Psychological Suzhi. Child Abus. Negl. 2018, 76, 204–215. [Google Scholar]
- Thomas, C.; Zolkoski, S. Preventing Stress Among Undergraduate Learners: The Importance of Emotional Intelligence, Resilience, and Emotion Regulation. Front. Educ. 2020, 5, 94. [Google Scholar] [CrossRef]
- Lemoult, J.; Humphreys, K.L. Meta-Analysis: Exposure to Early Life Stress and Risk for Depression in Childhood and Adolescence. J. Am. Acad. Child Psychiatry 2019, 59, 842–855. [Google Scholar] [CrossRef] [PubMed]
- Leung, C.; Kyung, M. Associations Among Perceived Stress, Cortisol, and Adolescent Depressive Symptoms. J. Pediatr. Health Car. 2022, 36, 397–398. [Google Scholar] [CrossRef]
- He, Y.; Chen, S.S.; Xie, G.D.; Chen, L.R.; Zhang, T.T.; Yuan, M.Y.; Li, Y.H.; Chang, J.J.; Su, P.Y. Bidirectional Associations Among School Bullying, Depressive Symptoms and Sleep Problems in Adolescents: A Cross-Lagged Longitudinal Approach. J. Affect. Disord. 2022, 298, 590–598. [Google Scholar] [CrossRef]
- Chu, X.W.; Fan, C.Y.; Lian, S.L.; Zhou, Z.K. Does Bullying Victimization Really Influence Adolescents’ Psychosocial Problems? A Three-Wave Longitudinal Study in China. J. Affect. Disord. 2019, 246, 603–610. [Google Scholar] [CrossRef]
- Wang, L.; Zhang, S.M. Reliability and Validity Assessment of Daily Stressors Evaluation Scale for Urban Secondary School Students. Chin. J. Sch. Health 2023, 44, 875–879. [Google Scholar]
- Hu, Y.Q.; Gan, Y.Q. Development and Psychometric Validity of the Resilience Scale for Chinese Adolescents. Acta Psychol. Sin. 2008, 40, 902–912. [Google Scholar] [CrossRef]
- Zhang, M.Y.; Ren, F.M. Investigation of Depressive Symptoms in Normal Population and Application of Ces-D. Chin. J. Neurol. 1987, 20, 67–71. [Google Scholar]
- Xiong, G. Validity of Short Forms of the Center for Epidemiological Studies Depression Scale in Chinese Adolescents. Master’s Thesis, Hunan Normal University, Changsha, China, 2015. [Google Scholar]
- Ji, C. A Comprehensive Report on the Survey of Health-Related/ Risky Behaviors Among Chinese Adolescents 2005, 1st ed.; Peking University Medical Press: Beijing, China, 2007; p. 357. [Google Scholar]
- Oberski, D. Mixture Models: Latent Profile and Latent Class Analysis, 1st ed.; Springer International Publishing: Cham, Switzerland, 2016; pp. 275–287. [Google Scholar]
- Raftery, A.E. Bayesian Model Selection in Social Research. Sociol. Methodol. 1995, 25, 111–163. [Google Scholar] [CrossRef]
- Burnham, K. Understanding Aic and Bic in Model Selection; SAGE Publications: London, UK, 2004; p. 93. [Google Scholar]
- Celeux, G.; Soromenho, G. An Entropy Criterion for Assessing the Number of Clusters in a Mixture Model. J. Classif. 1996, 13, 195–212. [Google Scholar] [CrossRef]
- Dobson, K.S.; McLarnon, M.J.W. A Latent Profile Analysis of Adverse Childhood Experiences and Adult Health in a Community Sample. Child Abus. Negl. 2021, 114, 104927. [Google Scholar]
- Tofighi, D.; MacKinnon, D.P. Rmediation: An R Package for Mediation Analysis Confidence Intervals. Behav. Res. Methods 2011, 43, 692–700. [Google Scholar] [CrossRef] [PubMed]
- Dougherty, E.N.; Goldschmidt, A.B. Gender Differences in the Relation Between Interpersonal Stress and Momentary Shape and Weight Concerns in Youth with Overweight/Obesity. Body Image 2022, 40, 249–255. [Google Scholar] [CrossRef]
- Mañas Ojeda, A.; Ros Bernal, F. Becoming Stressed: Does the Age Matter? Reviewing the Neurobiological and Socio-Affective Effects of Stress Throughout the Lifespan. Int. J. Mol. Sci. 2020, 21, 5819. [Google Scholar] [CrossRef]
- Bluth, K.; Park, J. Is Parents’ Education Level Associated with Adolescent Self-Compassion? Eeplore 2020, 16, 225–230. [Google Scholar] [CrossRef]
- Reiss, F.; Meyrose, A.K. Socioeconomic Status, Stressful Life Situations and Mental Health Problems in Children and Adolescents: Results of the German Bella Cohort-Study. PLoS ONE 2019, 14, e0213700. [Google Scholar] [CrossRef]
- Frazier, P.; Gabriel, A. Understanding Stress as an Impediment to Academic Performance. J. Am. Coll. Health 2018, 67, 562–570. [Google Scholar] [CrossRef] [PubMed]
- Lema-Gómez, L.; Arango-Paternina, C.M. Family Aspects, Physical Fitness, and Physical Activity Associated with Mental-Health Indicators in Adolescents. BMC Public Health 2021, 21, 2324. [Google Scholar] [CrossRef] [PubMed]
- Santos, A.T.D.; Soares, F.C. Violence and Psychosocial Stress: A 10-Year Time Trend Analysis. J. Affect. Disord. 2021, 295, 116–122. [Google Scholar] [CrossRef] [PubMed]
- Arhin, D.K.; Asante, K.O. The Relationship Between Psychological Distress and Bullying Victimisation Among School-Going Adolescents in Ghana: A Cross-Sectional Study. BMC Res. Notes 2019, 12, 264. [Google Scholar] [CrossRef] [PubMed]
- Konishi, C.; Hymel, S. Bullying and Stress in Early Adolescents: The Roles of Coping and Social Support; University of British Columbia: Vancouver, BC, Canada, 2003. [Google Scholar]
- Chen, X.; Lu, J. Resilience Mediates Parenting Style Associated School Bullying Victimization in Chinese Children and Adolescents. BMC Public Health 2022, 22, 2246. [Google Scholar] [CrossRef] [PubMed]
- Fergus, S.; Zimmerman, M.A. Adolescent Resilience: A Framework for Understanding Healthy Development in the Face of Risk. Annu. Rev. Public Health 2005, 26, 399–419. [Google Scholar] [CrossRef]
- Starr, L.R.; Dienes, K. Chronic Stress Exposure, Diurnal Cortisol Slope, and Implications for Mood and Fatigue: Moderation by Multilocus Hpa-Axis Genetic Variation. Psychoneuroendocrinology 2019, 100, 156–163. [Google Scholar] [CrossRef]
- Nikkheslat, N.; McLaughlin, A.P. Childhood Trauma, Hpa Axis Activity and Antidepressant Response in Patients with Depression. Brain Behav. Immun. 2020, 87, 229–237. [Google Scholar] [CrossRef]
- Lara-Cabrera, M.L.; Betancort, M.; Muñoz-Rubilar, C.A.; Rodríguez Novo, N.; De las Cuevas, C. The Mediating Role of Resilience in the Relationship Between Perceived Stress and Mental Health. Int. J. Environ. Res. Public Health 2021, 18, 9762. [Google Scholar] [CrossRef]
- Yumei, Z.; Guohua, L. Effect of Stress On Mental Health in College Students: The Mediating Role of Resilience. China J. Health Psychol. 2021, 29, 5. [Google Scholar]
- Klomek, A.B.; Barzilay, S. Bi-Directional Longitudinal Associations between Different Types of Bullying Victimization, Suicide Ideation/Attempts, and Depression Among a Large Sample of European Adolescents. J. Child Psychol. Psychiatry 2018, 60, 209–215. [Google Scholar] [CrossRef]
- Van Geel, M.; Goemans, A. Does Peer Victimization Predict Low Self-Esteem, Or Does Low Self-Esteem Predict Peer Victimization? Meta-Analyses On Longitudinal Studies. Dev. Rev. 2018, 49, 31–40. [Google Scholar] [CrossRef]
- Garber, J.; Quiggle, N.L. Aggression and Depression in Children: Comorbidity, Specificity, and Social Cognitive Processing. In Internalizing and Externalizing Expressions of Dysfunction; Toth, C., Ed.; Lawrence Erlbaum Associates, Inc.: Mahwah, NJ, USA, 1991; Volume 2, pp. 225–264. [Google Scholar]
- Dodge, K.A. Social-Cognitive Mechanisms in the Development of Conduct Disorder and Depression. Annu. Rev. Psychol. 1992, 44, 559–584. [Google Scholar] [CrossRef] [PubMed]
- Marchante, M.; Alexandre Coelho, V. The Influence of School Climate in Bullying and Victimization Behaviors During Middle School Transition. Contemp. Educ. Psychol. 2022, 71, 102111. [Google Scholar] [CrossRef]
Disclaimer/Publisher’s Note: The statements, opinions and data contained in all publications are solely those of the individual author(s) and contributor(s) and not of MDPI and/or the editor(s). MDPI and/or the editor(s) disclaim responsibility for any injury to people or property resulting from any ideas, methods, instructions or products referred to in the content. |
© 2023 by the authors. Licensee MDPI, Basel, Switzerland. This article is an open access article distributed under the terms and conditions of the Creative Commons Attribution (CC BY) license (https://creativecommons.org/licenses/by/4.0/).