Brief Report

Expression of the Purinergic P2X7 Receptor in Murine MOPC315.BM Myeloma Cells

by
Eva Risborg Høyer
1,†,
Melisa Demir
1,†,
Lasse Kristoffer Bak
1,2,
Niklas Rye Jørgensen
1,3 and
Ankita Agrawal
1,*
1
Department of Clinical Biochemistry, Copenhagen University Hospital Rigshospitalet, 2600 Glostrup, Denmark
2
Department of Drug Design and Pharmacology, University of Copenhagen, 1172 Copenhagen, Denmark
3
Department of Clinical Medicine, Faculty of Health and Medical Sciences, University of Copenhagen, 1172 Copenhagen, Denmark
*
Author to whom correspondence should be addressed.
These authors contributed equally to this work.
Receptors 2023, 2(3), 191-203; https://doi.org/10.3390/receptors2030013
Submission received: 30 June 2023 / Revised: 26 July 2023 / Accepted: 18 August 2023 / Published: 7 September 2023

Abstract

:
The adenosine-5’ triphosphate (ATP)-gated, ion channel, P2X receptor superfamily has seven members expressed by many cancer types. Subtype 7 (P2X7 receptor) is expressed consistently at levels higher than in comparatively healthy tissues. Moreover, transcript variant heterogeneity is associated with drug resistance. We have previously described the role of the P2X7 receptor in myeloma, a rare blood disease that uniquely presents with aggressive bone destruction. In this study, we used known agonists of the P2X7 receptor to induce calcium influx and YO-PRO-1 uptake in murine MOPC315.BM myeloma cells as readouts of P2X7 receptor-mediated channel activation and pore formation, respectively. Neither ATP- nor BzATP-induced calcium influx and YO-PRO-1 indicated an absence of the P2X7 receptor function on MOPC315.BM cells. TaqMan revealed low (Ct > 35) P2rx7 but high P2rx4 gene expression in MOPC315.BM; the latter was downregulated with BzATP treatment. The concomitant downregulation of CD39/Entpd1, Icam-1, and Nf-kb1 and the upregulation of Casp-1 genes regulated during purinergic signaling and with established roles in myeloma progression suggest P2RX4-mediated survival adaptation by cancer cells. Further studies are needed to characterize the P2RX4 pharmacology on MOPC315.BM since transcriptional regulation may be utilized by cancer cells to overcome the otherwise toxic effects of high extracellular ATP.

1. Introduction

Adenosine-5′ triphosphate (ATP) and its derivatives support, as chemical messengers, purinergic transmission throughout tissues and species. As an extracellular messenger, eATP activates P2X receptors (P2XR), a family of trimeric non-selective cation channels. The P2X7 receptor subtype has attracted the interest of major drug discovery projects since being cloned from a rat brain cDNA library [1]. A key pharmacological property of the P2X7 receptor is its low ATP sensitivity, being the least sensitive among all the P2XR subtypes [2]. P2X7 receptor activation by eATP concentrations ranging between 0.05 and 1 mM causes a rapid influx of Na+ and Ca2+ and efflux of K+, and other cations [3,4]. Upon long-term activation, P2X7 receptor complexes with membrane proteins to form a macropore that allows the passage of organic ions like N-methyl-D-glucamine (NMDG+), choline+, and fluorescent dyes, such as ethidium+ and YO-PRO-12+ [5,6].
After activation, the P2X7 receptor stimulates various downstream signaling pathways, aiding in cell proliferation and survival; however, curiously, P2X7 receptor activation is also associated with the induction of apoptosis and subsequent cell death [2,7]. Dramatically high ATP concentrations are typical of lesions with tissue damage, indicating cellular stress, and are also detected in the tumor microenvironment (TME) [8]. Moreover, P2X7 receptor expression is upregulated in various solid tumors versus the comparatively healthy tissues [9]. It is, therefore, understandable that the P2X7 receptor has been the most widely investigated purinergic receptor in various pathologies and has the largest amount of specific pharmacological tools available [10,11]. In addition, recently developed preclinical disease models have greatly advanced P2X7 receptor investigations and paved the way for new clinical perspectives of P2X7 receptor-targeted therapies. However, the role of the P2X7 receptor in non-solid malignancies remains understudied.
We aimed to identify the potential of the P2X7 receptor as a druggable target in multiple myeloma (MM). MM is the second most common hematological malignancy, characterized by the clonal expansion of antibody-producing plasma cells in the bone marrow [12]. Patients with MM present with organ dysfunction, referred to as C-R-A-B (hypercalcemia, renal insufficiency, anemia, and osteolytic bone disease) [13]. The latter presents in >90% of patients due to increased numbers of bone-degrading cells (osteoclasts) and reduced numbers of bone-producing cells (osteoblasts) [14]. Furthermore, the myeloma- bone cell interactions positively influence myeloma cell survival, migration, and drug resistance [14,15]. Stem-cell transplantation and the introduction of novel therapeutics and better use of them have benefitted patient survival and quality of life [16]. Unfortunately, MM remains incurable, with heterogeneous patient prognosis. The majority of patients relapse, and multiple drug resistance is common [12,17,18].
In the present study, we identify whether the P2X7 receptor is expressed and functional in murine MOPC315.BM cells, an ideal model for studying MM and the associated bone disease. When injected in BALB/c mice, a commonly used laboratory-bred mouse strain, mice replicate many characteristics of MM disease, including bone lesions [19]. This syngeneic model can enhance our understanding of MM biology, and drug targets can be developed to counteract drug resistance and improve health outcomes in patients.

2. Materials and Methods

2.1. Cell Culture

Murine MOPC315.BM myeloma cells, received from B. Bogen and PO Hofgaard at the University of Oslo and Oslo University Hospital, were maintained at 37 °C and 5% CO2 in RPMI 1640 medium (Thermo Fisher Scientific, Waltham, MA, USA) supplemented with 10% fetal bovine serum (Sigma-Aldrich, St. Louis, MO, USA), 1% MEM NEAA (Thermo Fisher Scientific), 1% sodium pyruvate (Thermo Fisher Scientific), 0.024% gentamicin solution (Sigma-Aldrich), and 0.005% l-thioglycerol (Sigma-Aldrich). Cells were subcultured 1:2 every 3–4 days as described previously [19].
The human myeloma cell line, RPMI-8226 (ATCC) was maintained at 37 °C and 5% CO2 in RPMI 1640 medium with supplements as described previously [20] and subcultured 1:3 every 2–3 days.
Primary osteoclasts were derived from splenic precursors from 8-week-old BALB/c mice as previously described [21]. Briefly, spleen cells were harvested by macerating the spleen tissue with a 25G needle. Histopaque-1077 was used to layer the spleen cells and gradient centrifugation was performed at 400× g for 30 min to isolate precursors. Precursors were washed in alpha-modified essential medium with 1% penicillin/streptomycin (αMEM) and seeded in 24-well plates (4 × 10⁶ cells/well) in 0.4 mL αMEM supplemented with 10% fetal bovine serum, 1% GlutaMax, 30 ng/mL rmM-CSF (R&D Systems, Boston, MA, USA), and 50 ng/mL rmRANKL (R&D Systems) (Oc-CM) for 24 h at 37 °C and 7% CO2 to allow the attachment of osteoclast precursors. After removing the non-adherent cells by washing with αMEM, adherent precursors were differentiated for 7 days in Oc-CM at 37 °C, 7% CO2, with the medium replaced every 2–3 days.

2.2. Calcium Influx Assay

An influx of calcium was determined as a change in the intracellular calcium concentration [Ca2+]i with the use of Ca2+ chelating dye, Fluo-4 AM, as described previously [20]. Cells were seeded in poly-D-lysine-coated, clear-bottom, black-walled, 96-well plates at a density of 100,000 cells per well in culture medium for 24 h. The culture medium was removed, and the cells were washed in experimental buffer (Hanks Buffer with Ca2+ and Mg2+ supplemented with 10 mM HEPES, 2.5 mM probenecid in 0.6 N NaOH, pH 7.4) before loading with Fluo-4 AM (4 µM, 50% v/v Pluronic F-127) for 1 h in the dark. Excess Fluo-4 AM was removed, and the cells were washed in experimental buffer before equilibrating for 10 min in NOVOstar (BMG Labtech, Ortenberg, Germany). The baseline fluorescence was determined for 30 s (485 nm excitation/520 nm emission) before the agonists, ATP or 2′(3′)-O-(4-benzoylbenzoyl) adenosine 5′-triphosphate (BzATP), were injected directly into the experimental buffer, and the measurements were further continued for 90 s. When mentioned, the cells were pre-treated with P2X7 receptor-specific antagonists A-740003 (1 µM) and A-438079 (10 µM) [22] for 30 min to measure P2X7 receptor-mediated [Ca2+]i) at maximal agonist concentrations, i.e., 2.5 mM ATP or 300 µM BzATP. The assay, including incubation, equilibration, and measurements was performed at 37 °C and 5% CO2.
P2X7 receptor-mediated increases in [Ca2+]i with agonists, 2.5 mM ATP and 100 µM BzATP, in human myeloma cell line RPMI-8226, were used as the assay controls. After adjusting for autofluorescence, the maximum peak fluorescence after agonist injection was expressed as a fold change of the baseline for quantitative analysis, and each experiment was repeated four times.

2.3. Pore Formation

Cellular uptake of the nucleic acid dye YO-PRO-1 (molecular weight: 629 Da) was used to measure pore formation, as described previously [20]. Cells were seeded in poly-D-lysine-coated, clear-bottom, black-walled, 96-well plates at a density of 50,000 cells per well in culture medium for 24 h. The culture medium was removed, and the cells were washed in experimental buffer (Hanks Buffer without Ca2+ and Mg2+ supplemented with 10 mM HEPES, 2.5 mM probenecid in 0.6 N NaOH, pH 7.4). The cells were loaded with YO-PROTM-1 iodide (2 µM) and equilibrated for 10 min in NOVOstar (BMG Labtech). The baseline fluorescence was determined for 10 min (485 nm excitation/520 nm emission) before the agonists, ATP or BzATP, were added directly into the experimental buffer, and measurements were further continued for 60 min. When mentioned, the cells were pre-treated with P2X7 receptor-specific antagonists A-740003 (1 µM) and A-438079 (10 µM) [22] for 30 min to measure P2X7 receptor-mediated YO-PRO uptake at the maximal agonist concentrations, i.e., 2.5 mM ATP or 500 µM BzATP. The assay, including incubation, equilibration, and measurements, was performed at 37 °C and 5% CO2.
Pore formation with agonists, 1 mM ATP and 500 µM BzATP, in human myeloma cell line RPMI-8226, was used as the assay controls. After adjusting for autofluorescence, the area under the curve (AUC) from the time of agonist injection was used for quantitative analysis, and each experiment was repeated four times.

2.4. TaqMan Gene Expression

Cells were either lysed directly in RLT buffer or equally weighed tissues were homogenized on dry ice to isolate the total RNA using the RNeasy Mini Kit (Qiagen, Hilden, Germany) according to the manufacturer’s instructions. The total RNA (2 μg) was used for cDNA synthesis using the High-Capacity cDNA Reverse Transcription kit (Applied Biosystems, Thermo Fisher Scientific) using Multiscribe Reverse Transcriptase and random primers with a thermal profile of 10 min at 25 °C, 2 h at 37 °C, and 5 min at 85 °C, according to the manufacturer’s instructions.
Successful reverse transcription was confirmed on all samples (MOPC315.BM cells, RAW264.7 cells from ATCC, and primary osteoclasts derived from BALB/c mice) using a previously described procedure [21] by semi-quantitative PCR and visualization on the gel as follows. cDNA (2 µg) was assembled with a PCR mix containing HotStarTaq DNA polymerase, PCR buffer, each dNTP (200 µM), and 0.2 µM of each Gapdh primer (forward 5′ TTGAAGGGTGGAGCCAAACG 3′ and reverse 5′ TCATACCAGGAAATAGC 3′) before amplification under the following conditions: initial heat activation (95 °C for 15 min), followed by 30 cycles each of denaturation (95 °C for 30 s), annealing (60 °C for 30 s), and extension (68 °C for 1 min). A final extension was achieved at 72 °C for 10 min. For gel electrophoresis, the products were stained and loaded on a 1% agarose gel (TAE buffer, and SYBR Safe). The electrophoresis was performed at 80 V for 40 min, followed by visualization under UV light.
A custom TaqMan Array 96-well plate (# 4391528) containing pre-aliquoted, dried-down assay probes and primers for the transcript variants of the mouse P2rx7 gene (transcript region common to variants a and k, assay ID: Mm01199500_m1, transcript region unique to variant a, and excluding variant k, assay ID: Mm00440578_m1) and housekeeping gene Gapdh (assay ID: Mm99999915_g1) were used according to the manufacturer’s instructions. cDNA (100 ng per 20 µL reaction) was mixed with the TaqMan Universal PCR Master Mix and amplified using QuantStudio 6 Pro (Thermo Fischer Scientific) with the following PCR conditions: initial incubation (50 °C for 2 min) and DNA polymerase activation (95 °C for 10 min), followed by 40 cycles each of denaturation (95 °C for 15 s), annealing, and extension (60 °C for 1 min). The assay IDs of all genes used in the design of the TaqMan Array are tabulated in Table 1.
The cDNA from the MOPC315.BM cells passed on 3 different days, with or without BzATP treatment, were run on 3 TaqMan array plates with the cDNA from either the RAW 264.7 or primary mouse osteoclasts as P2XR gene expression controls.

2.5. Statistics

The data were tested for normality using the Kolmogorov–Smirnov test, and statistical analysis was performed using the Kruskal–Wallis test and Dunn’s multiple correction for the agonist dose-response, or the Mann–Whitney t-test for comparison between the two treatment groups. The results shown are from at least four independent experiments and are presented as the means ± SEM. p-values < 0.05 were considered significant, calculated using GraphPad Prism (version 9.4.1). For gene expression analysis, any undetermined Ct values were given the arbitrary number 38 for normalization to housekeeping genes or calculation of the fold change (2−∆∆Ct) according to the comparative Livak method. A ratio paired t-test was used to assess the fold-change significance, with p-values < 0.05 considered significant.

3. Results

3.1. Neither ATP nor BzATP Induces Calcium Influx in MOPC315.BM

No calcium influx was observed at the tested concentrations of either ATP (0.5, 1, 2, 3, and 4 mM; p-value = 0.2712) or BzATP (10, 50, 100, 200, and 300 µM; p-value = 0.0721) (Figure 1a,b, Table 2). Thus, both agonists failed to activate the P2X7 receptor-mediated cation channel in the MOPC315.BM cells. Antagonists A-438079 and A-740003 were used to eliminate P2X7 receptor involvement, and the presence of neither antagonists altered the ATP or BzATP-mediated calcium influx (Figure 1c,d, Table 2). The RPMI-8226 cells showed a statistically significant calcium influx with 100 µM BzATP (4.27-fold, p-value = 0.0286) (Figure 1e), aligning with our previously published findings and confirming our experimental setup.

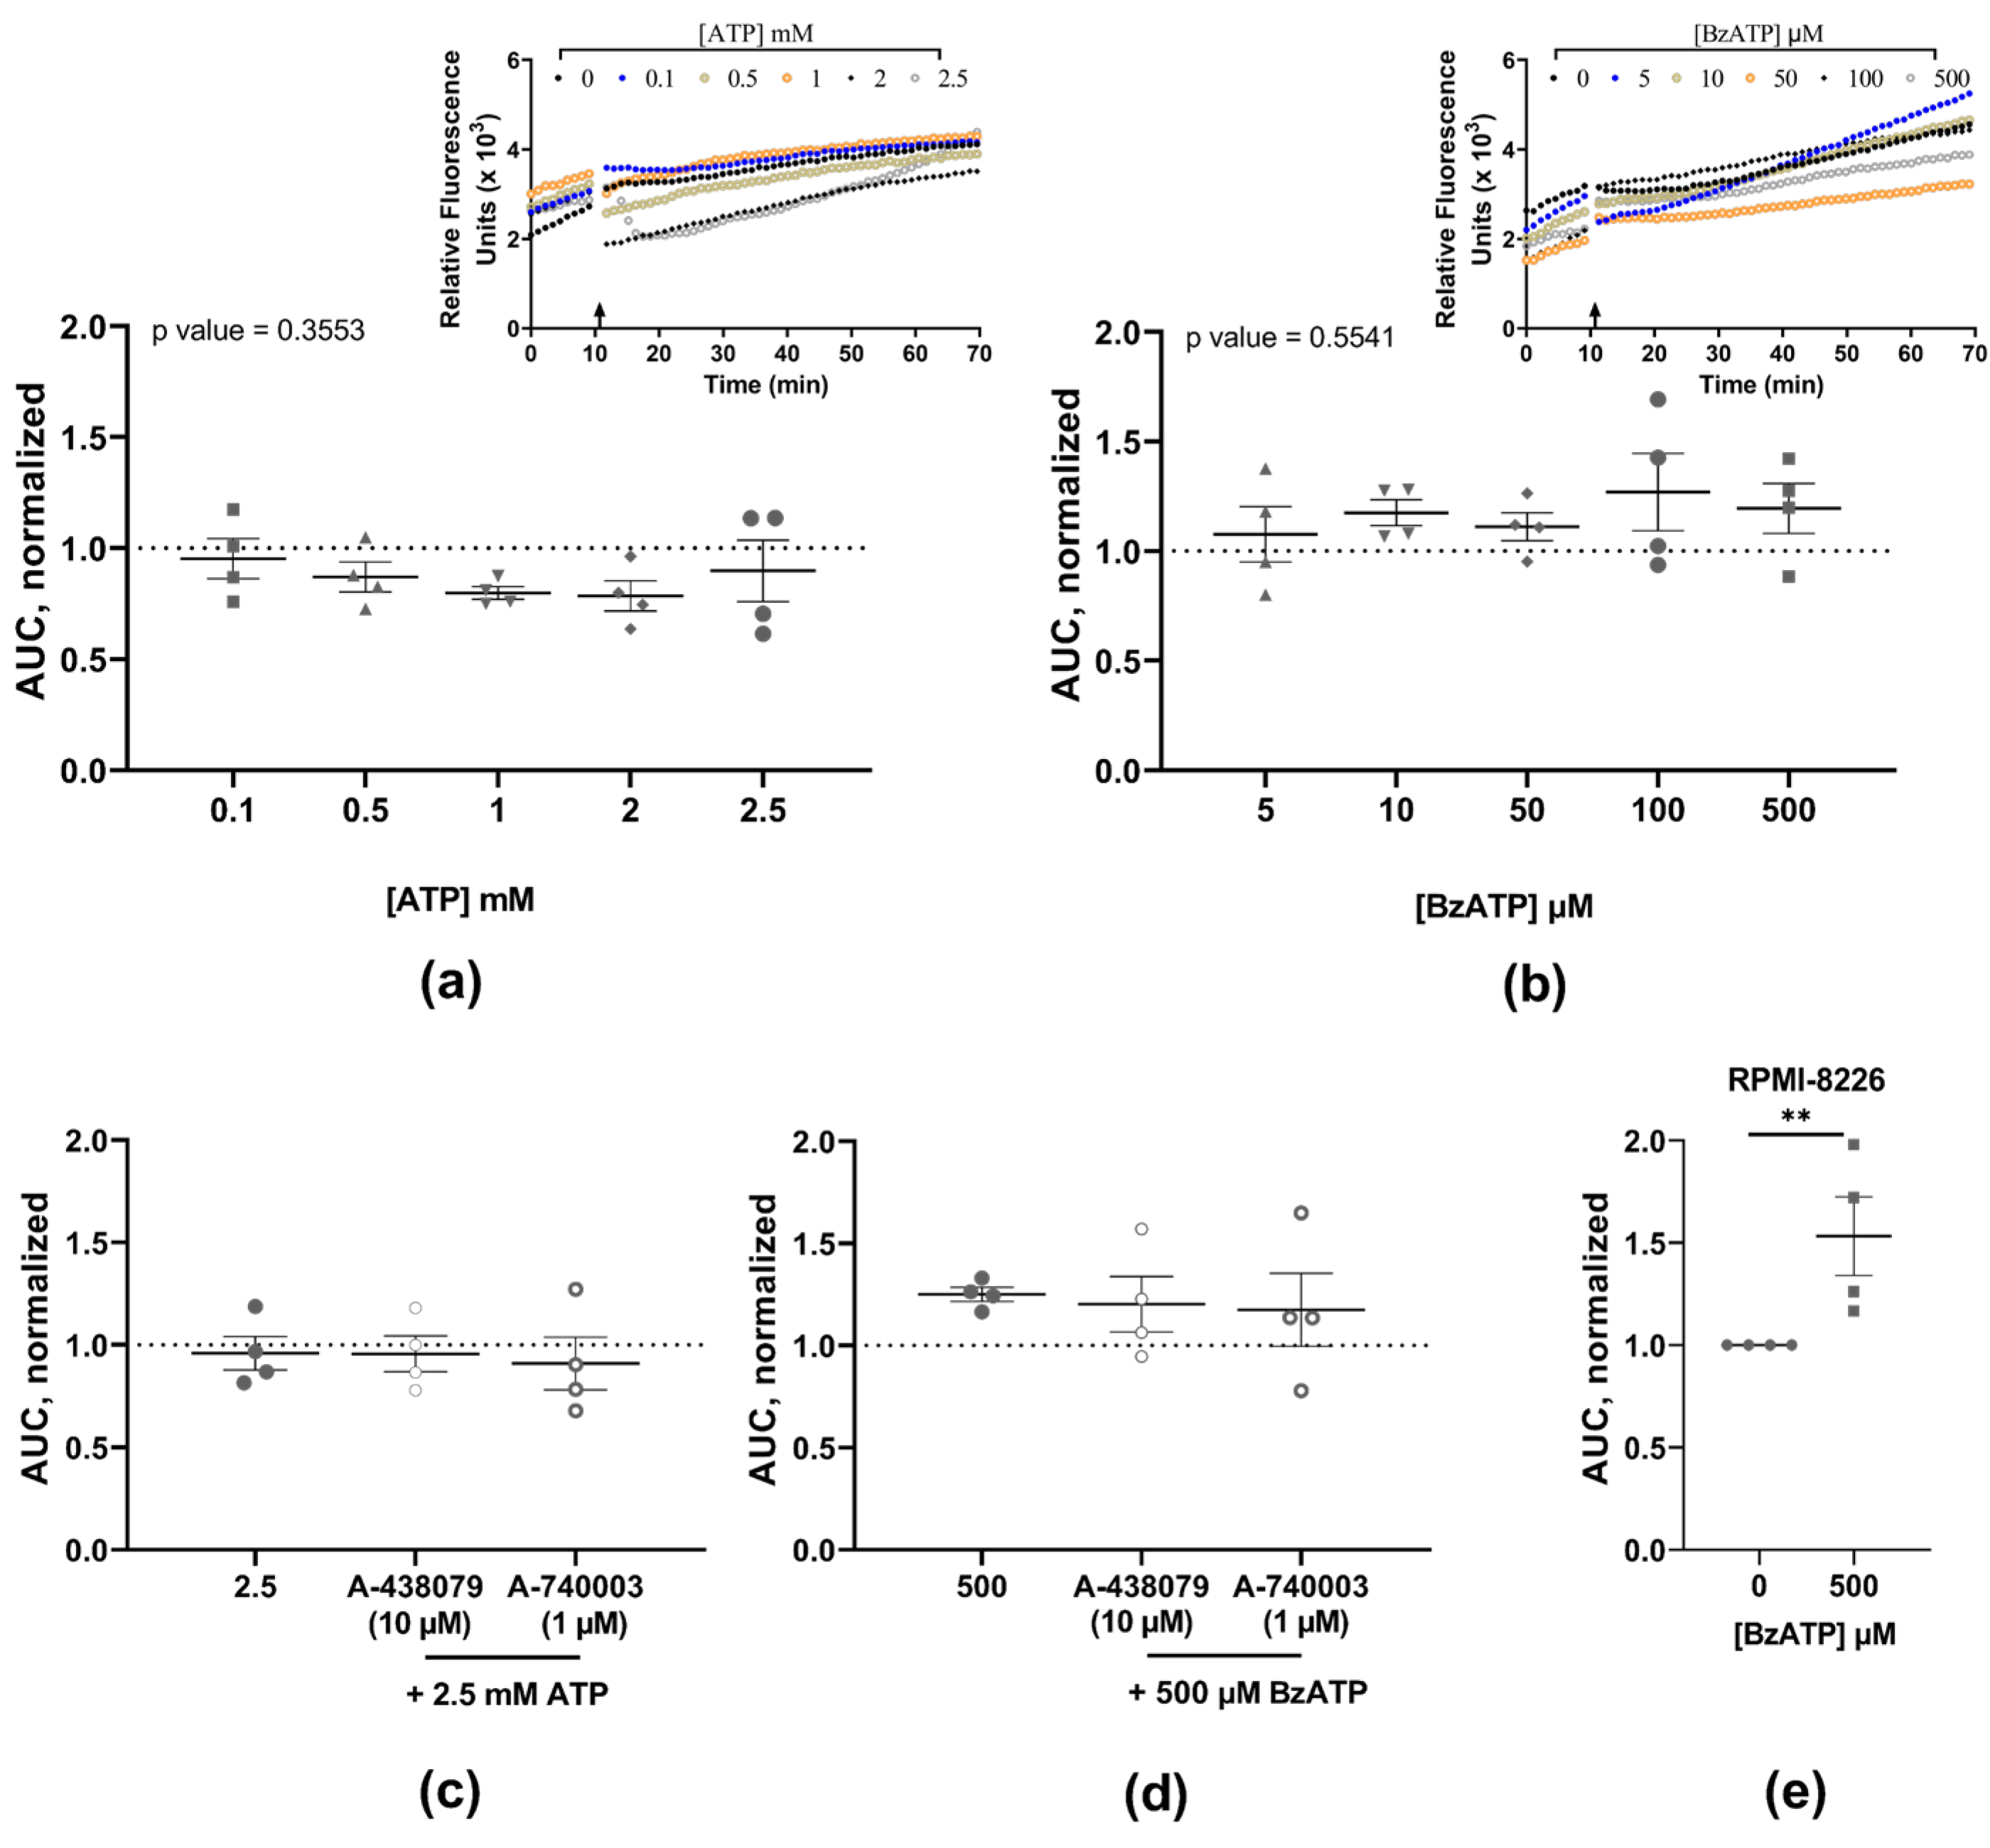
3.2. Neither ATP nor BzATP Induces Pore Formation in MOPC315.BM

No change in YO-PRO-1 uptake was observed at the tested concentrations of either the ATP (0.1, 0.5, 1, 2, and 2.5 mM; p-value = 0.3553) or BzATP (5, 10, 50, 100, and 500 µM); p-value = 0.5541) (Figure 2a,b, Table 3). Antagonists A-438079 and A-740003 were used to eliminate P2X7 receptor involvement, and the presence of neither antagonist altered the ATP or BzATP YO-PRO-1 uptake (Figure 2c,d, Table 3). The RPMI-8226 cells showed a statistically significant YO-PRO-1 uptake with 500 µM BzATP (1.53-fold, p-value = 0.002) (Figure 2e), aligning with our previously published findings and confirming our experimental setup.

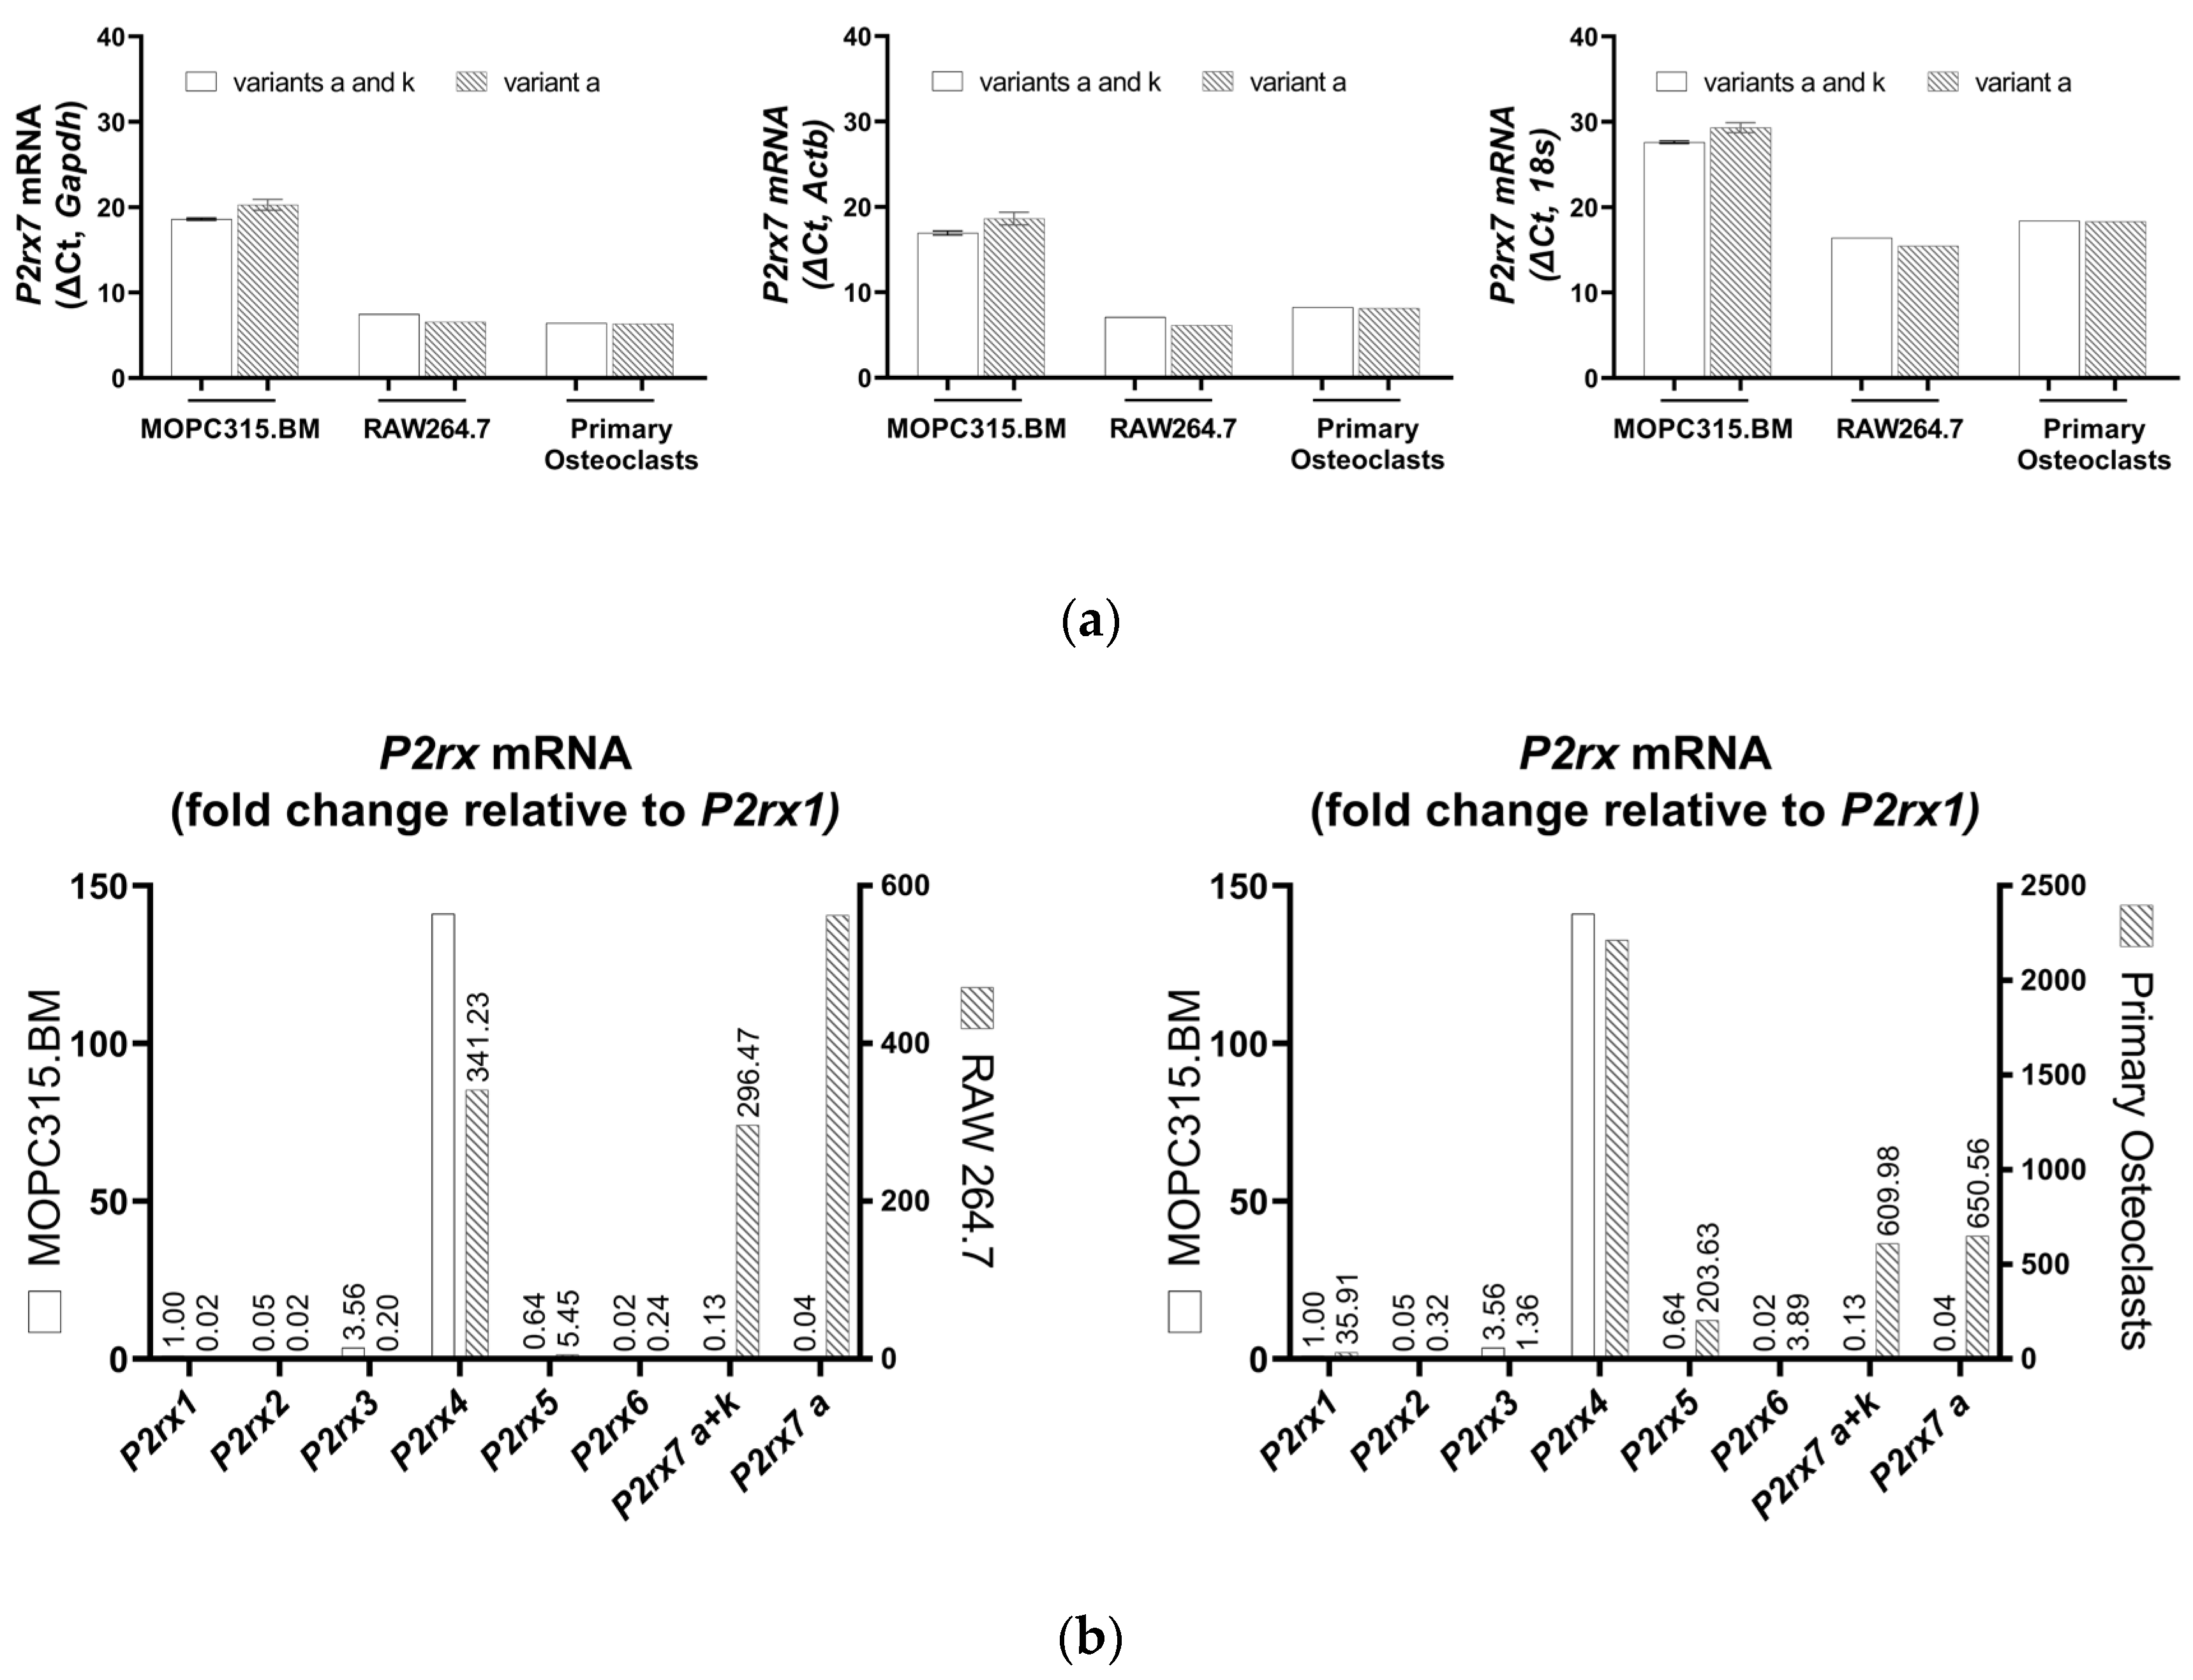
3.3. Expression of P2X7 Receptor Variants in MOPC315.BM

TaqMan analysis revealed a high cycle threshold (Ct) corresponding to the P2X7 receptor mRNA variants, indicating a reduced P2rx7 gene expression in the MOPC315.BM cells in comparison to their expression in RAW 264.7 cells (average Ct = 35.2 versus 23.7, respectively, for the sequence common to protein-coding variants a and k; and average Ct = 36.9 versus 22.8, respectively, for the sequence unique to the variant a, thus excluding the variant k in the BALB/c P2rx7 gene). Primary osteoclasts were used as a second P2X7 receptor-expressing cell type of BALB/c origin and showed an average Ct = 27.1 for the common sequence in both variants a and k, and an average Ct = 26.9 for the sequence unique to variant a. Figure 3 shows the ∆Ct of P2rx7 expression normalized to the indicated housekeeping gene in the MOPC315.BM cells, RAW 264.7 cells, and primary osteoclasts. The fold change (2−∆∆Ct) of all P2XR subtypes relative to the P2rx1 in the MOPC315.BM cells confirms the negligible P2rx7 expression at 0.13-fold (P2X7 receptor variants a + k) and 0.04-fold (P2X7 receptor variant a) in the MOPC315.BM cells, but it was higher in the RAW 264.7 cells (296.47-fold and 562.46-fold for P2X7 receptor variants a + k and P2X7 receptor variant a, respectively) and primary osteoclasts (609.98-fold and 650.56-fold for P2X7 receptor variants a + k and P2X7 receptor variant a, respectively) (Figure 3b). However, both P2rx3 (3.56-fold) and P2rx4 (141.07-fold) were expressed in the MOPC315.BM cells (Figure 3b).
The expression of P2X7 receptor variants remained unaltered with agonist exposure, that is, 500 µM BzATP for 30 min, indicating that P2rx7 gene expression in MOPC315.BM cells is not regulated by a high agonist concentration (Figure 4a).

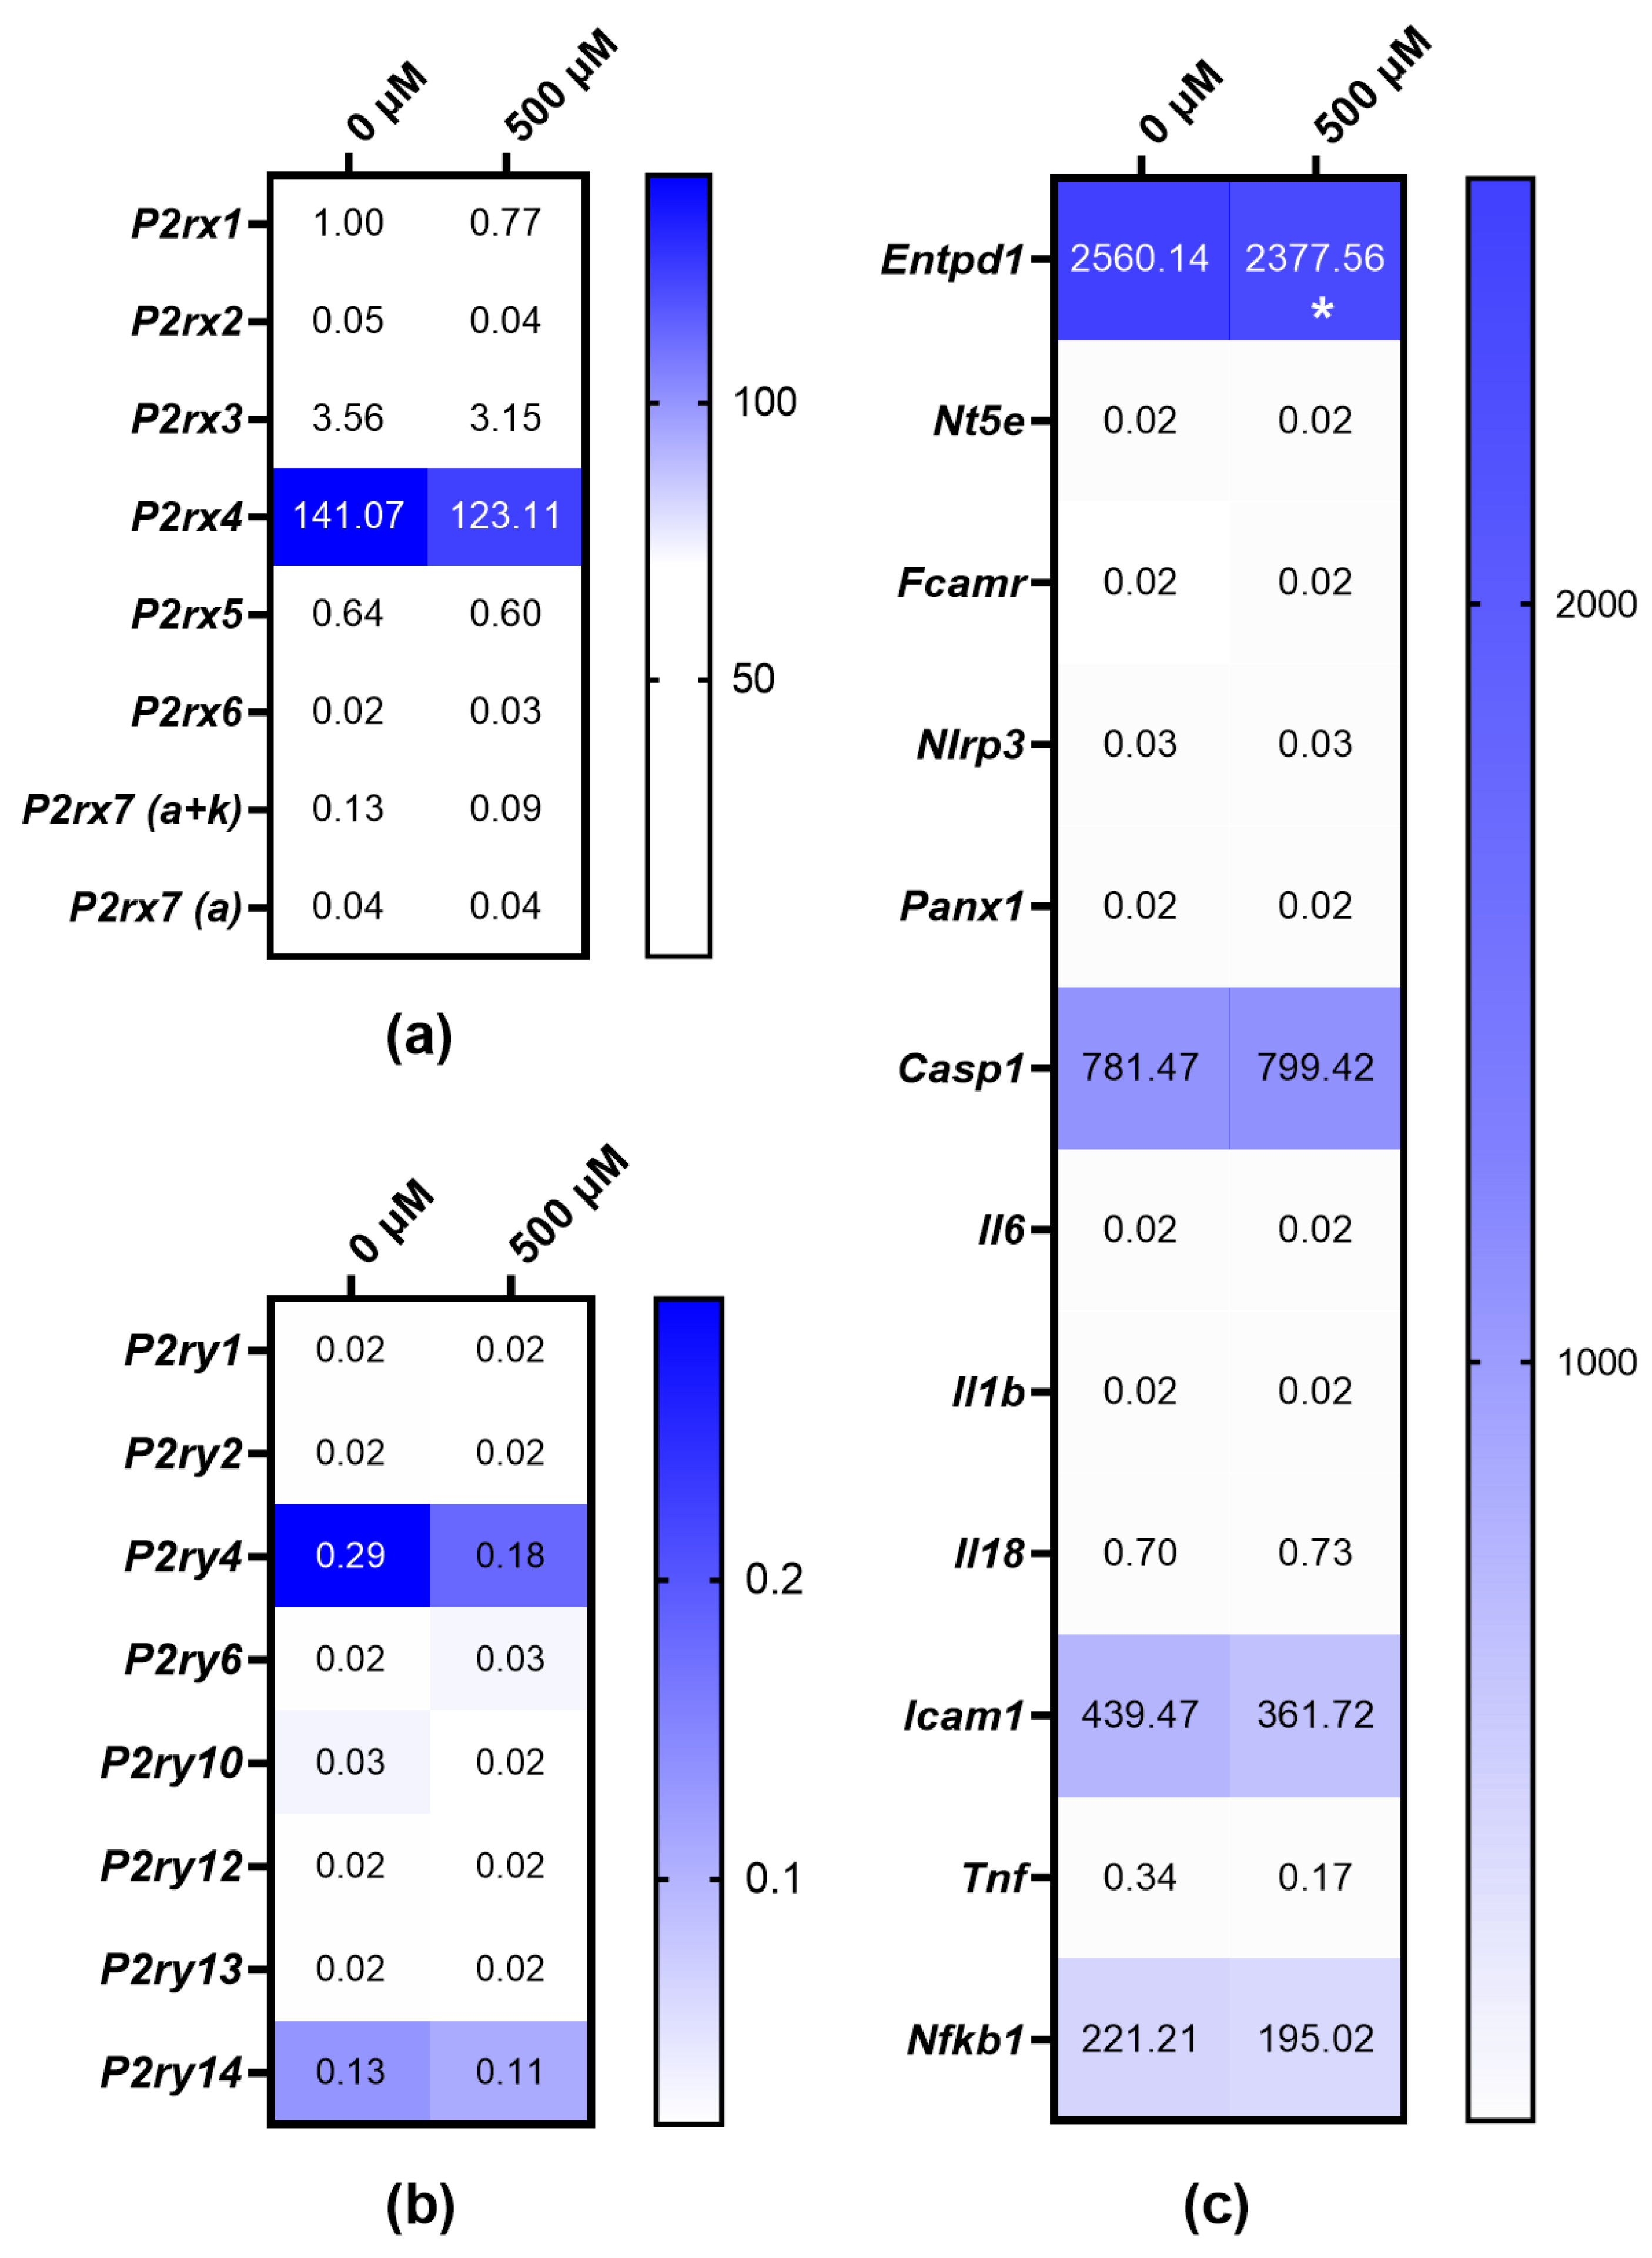
3.4. Expressions of P2XR and P2YR Subtypes in MOPC315.BM and BzATP-Induced Genetic Regulation

The gene expressions of other P2XR subtypes were also investigated after the treatment of MOPC315.BM cells with 500 µM BzATP for 30 min. Both P2rx3 and P2rx4 gene expressions were downregulated in the MOPC315.BM cells after agonist exposure (Figure 4a). Moreover, the downregulation of P2YR subtype P2ry4 was seen in the MOPC315.BM cells treated with BzATP (Figure 4b).
We further investigated any transcriptional regulation of candidates involved in purinergic signaling pathways. The downregulation of ectonucleotidase CD39 (Entpd1), intercellular adhesion molecule 1 (Icam-1), and nuclear factor of kappa 1, p105 (Nf-kb1) and the upregulation of Caspase 1 (Casp1) was seen after agonist exposure (Figure 4c). Since these genes are also targets in purinergic signaling pathways, regulation by BzATP is thus implicated.

4. Discussion

P2X7 receptor expression and function have been validated in several human MM cell lines, such as RPMI-8226, but have not yet been studied in MOPC315.BM cells, a widely used syngeneic model for MM and its associated bone disease. We elucidated the functional properties of the P2X7 receptor, i.e., the cation channel, and the pore formation characteristics in MOPC315.BM cells using varying concentrations of both ATP, the physiological ligand, and a more potent agonist, BzATP. In case ATP and BzATP had caused P2X7 receptor activation, the P2X7 receptor antagonists (A-438079 and A-740003) [22] were used to confirm P2X7 receptor involvement. However, neither of the agonists activated the P2X7 receptor cation channel or membrane pore at any of the concentrations tested. Therefore, we investigated the expressions of the two functional transcript variants of P2rx7 described in the BALB/c mice strain [23]. Low (Ct > 35) P2X7 receptor mRNA (for both variant a and variant k) but high P2rx3 and P2rx4 mRNA was detected in the MOPC315.BM cells.
Roles of the P2X3 and P2X4 receptors are indicated in nociceptive pain through the downregulation of P2X3 receptors in neurons [24,25], and P2X3 receptor antagonists demonstrate analgesic effects in murine models of cancer-induced bone pain [26,27,28]. Thus, further investigations with the MOPC315.BM MM model can be considered to examine the effect of targeting P2X3 receptors in chronic pain states, and thus, a rapidly translatable strategy to reduce MM-associated bone pain in patients. In addition, the P2X4 and P2X7 subunit isoforms are co-expressed in the cells of the immune and inflammatory system and share the highest amino acid sequence similarity amongst the P2X subtypes [29,30,31]. Therefore, physical and functional interactions between the P2X4 and P2X7 subunits have been investigated [32,33]. Evidence that P2X7 receptor mRNA levels are reduced in P2RX4 knockout mice, and vice versa [34], supports the genetic interplay between P2rx4 and P2rx7. Furthermore, the shRNA-mediated downregulation of P2X7 receptor mRNA leads to increased P2RX4 expression, and the knockdown of P2RX4 mRNA resulted in a compensatory increase in P2X7 receptor protein expression [35], which suggests that a lack of one receptor is compensated by the presence of the other one. Although we did not investigate the pharmacological properties of P2RX4 in the MOPC315.BM cells, the BzATP treatment impaired the P2rx4 mRNA expression, which correlated with a decrease in the expressions of ectonucleotidase CD39 (Entpd1), intercellular adhesion molecule 1 (Icam-1), and nuclear factor of kappa 1, p105 (Nf-kb1) and an increased expression of Caspase 1 (Casp1). P2RX4 is emerging as a potent regulator of hematopoietic stem/progenitor cell mobilization and homing [36], and further studies with the MOPC315.BM myeloma model could provide a novel view of the mutual dependence between the P2RX4 and P2X7 receptors in orchestrating the homing and engraftment events in myeloma cells.
Different animal models have been used for studies of bone marrow tropism, the development of osteolytic lesions, drug testing, and immunotherapy in MM and have contributed to novel therapies. However, each model has advantages and disadvantages. While syngeneic mouse models such as 5T2MM and 5T33MM, have been extensively used over the last five decades for studying the homing mechanisms of MM cells to bone marrow, the interaction of MM cells with the bone marrow environment, and the evaluation of new therapies [37,38,39], MM cell infiltration is restricted to the bone marrow and spleen [40] and does not necessarily accurately reflect human disease or, are dependent on a mouse strain of limited availability (C57BL/KaLwRij). Double-transgenic Myc/Bcl-XL mice have been used to develop different transgenic mice models, and although they recapitulate several characteristics of MM [41,42,43,44], these models are time-consuming and costly, perhaps explaining their limited use thus far. Finally, xenograft models using human myeloma cell lines or primary human myeloma have also been established in immunodeficient SCID or NOD SCID gamma (NSG) mice, allowing a high degree of adaptability. While labeling with luciferase and green fluorescent protein (GFP) allows for the in vivo imaging of the MM-like disease, they also allow for the pharmacological assessment of agents either alone or in combination with bone-targeted therapies, thus proving a highly translational strategy to improve bone outcomes [45,46]. A major drawback of the immunodeficient models is the lack of an immune-mediated antitumor response, and therefore, the models do not completely reflect normal physiological conditions.
The presence of a physiological response in oncological experimental models is essential, as ATP is one of the pivotal molecules present in the TME, with an essential role in promoting cancer proliferation and metastasis and immune responses. Additionally, expression of the P2X7 receptor endows tumor cells with a significant growth advantage and an anaplastic phenotype in vivo [47]. On the other hand, P2X7 receptor expression is critical for an antitumor immune response and to restrict tumor growth and metastatic spreading, as seen in mouse models of B16 melanoma and CT26 colon carcinoma [48]. Gene knock-in strategies with MOPC315.BM cells could be employed to elucidate the role of the P2X7 receptor in MM and its associated bone disease as well as in oncogenesis.
This model provides a unique opportunity to comprehensively evaluate immunotherapeutic strategies in MM as well as drive the emerging role of eATP as an immune mediator in a more preclinically relevant setting.

5. Conclusions

MOPC315.BM myeloma cells have low P2rx7 gene expression and high P2rx3 and P2rx4 gene expression, making it an ideal model for studying the roles of P2X3 and P2X4 receptors in the events of MM disease and the associated bone pain. Gene modification strategies, such as knock-in of isoforms specific to the human P2X7 receptor, could be approached with MOPC315.BM cells to assess how genetic variants and alternate splicing of the P2X7 receptor contributes to the progression of MM and the associated bone disease.

Author Contributions

Investigation and data validation, E.R.H., M.D. and A.A. Conceptualization, methodology, formal analysis, resources and supervision, E.R.H., M.D., L.K.B. and A.A. Writing—original draft preparation, E.R.H., M.D. and A.A. Writing—review and editing, L.K.B., N.R.J. and A.A. Project administration and funding acquisition, N.R.J. and A.A. All authors have read and agreed to the published version of the manuscript.

Funding

This study was supported by grants by the institutional funds from Rigshospitalet, Glostrup, and the European H2020 office through the COST Action CA21130 “P2X receptors as a therapeutic opportunity (PRESTO)”.

Data Availability Statement

The data presented in this study are available upon request from the corresponding author.

Acknowledgments

We thank Bjarne Bogen and Peter Olaf Hofgaard at the University of Oslo and Oslo University Hospital for providing the MOPC315.BM cells used in this study.

Conflicts of Interest

The authors declare no conflict of interest.

References

  1. Surprenant, A.; Rassendren, F.; Kawashima, E.; North, R.A.; Buell, G. The cytolytic P2Z receptor for extracellular ATP identified as a P2X receptor (P2X7). Science 1996, 272, 735–738. [Google Scholar] [CrossRef] [PubMed]
  2. Lara, R.; Adinolfi, E.; Harwood, C.A.; Philpott, M.; Barden, J.A.; Di Virgilio, F.; McNulty, S. P2X7 in Cancer: From Molecular Mechanisms to Therapeutics. Front. Pharmacol. 2020, 11, 793. [Google Scholar] [CrossRef] [PubMed]
  3. Khakh, B.S.; North, R.A. P2X receptors as cell-surface ATP sensors in health and disease. Nature 2006, 442, 527–532. [Google Scholar] [CrossRef] [PubMed]
  4. Burnstock, G.; Kennedy, C. P2X receptors in health and disease. Adv. Pharmacol. 2011, 61, 333–372. [Google Scholar] [CrossRef]
  5. Di Virgilio, F.; Schmalzing, G.; Markwardt, F. The Elusive P2X7 Macropore. Trends Cell Biol. 2018, 28, 392–404. [Google Scholar] [CrossRef]
  6. Di Virgilio, F.; Giuliani, A.L.; Vultaggio-Poma, V.; Falzoni, S.; Sarti, A.C. Non-nucleotide Agonists Triggering P2X7 Receptor Activation and Pore Formation. Front. Pharmacol. 2018, 9, 39. [Google Scholar] [CrossRef]
  7. Di Virgilio, F. P2RX7: A receptor with a split personality in inflammation and cancer. Mol. Cell. Oncol. 2016, 3, e1010937. [Google Scholar] [CrossRef]
  8. Di Virgilio, F.; Sarti, A.C.; Falzoni, S.; De Marchi, E.; Adinolfi, E. Extracellular ATP and P2 purinergic signalling in the tumour microenvironment. Nat. Rev. Cancer 2018, 18, 601–618. [Google Scholar] [CrossRef]
  9. Burnstock, G.; Di Virgilio, F. Purinergic signalling and cancer. Purinergic Signal. 2013, 9, 491–540. [Google Scholar] [CrossRef]
  10. Sluyter, R.; Adriouch, S.; Fuller, S.J.; Nicke, A.; Sophocleous, R.A.; Watson, D. Animal Models for the Investigation of P2X7 Receptors. Int. J. Mol. Sci. 2023, 24, 8225. [Google Scholar] [CrossRef]
  11. Muller, C.E.; Baqi, Y.; Namasivayam, V. Agonists and Antagonists for Purinergic Receptors. Methods Mol. Biol. 2020, 2041, 45–64. [Google Scholar] [CrossRef]
  12. Kumar, S.K.; Rajkumar, V.; Kyle, R.A.; van Duin, M.; Sonneveld, P.; Mateos, M.V.; Gay, F.; Anderson, K.C. Multiple myeloma. Nat. Rev. Dis. Primers 2017, 3, 17046. [Google Scholar] [CrossRef] [PubMed]
  13. Rajkumar, S.V. Multiple myeloma: 2018 update on diagnosis, risk-stratification, and management. Am. J. Hematol. 2018, 93, 981–1114. [Google Scholar] [CrossRef] [PubMed]
  14. Marino, S.; Roodman, G.D. Multiple Myeloma and Bone: The Fatal Interaction. Cold Spring Harb. Perspect. Med. 2018, 8, a031666. [Google Scholar] [CrossRef] [PubMed]
  15. Anderson, K.C.; Carrasco, R.D. Pathogenesis of myeloma. Annu. Rev. Pathol. 2011, 6, 249–274. [Google Scholar] [CrossRef]
  16. Sperling, A.S.; Anderson, K.C. Facts and Hopes in Multiple Myeloma Immunotherapy. Clin. Cancer Res. 2021, 27, 4468–4477. [Google Scholar] [CrossRef]
  17. Robak, P.; Drozdz, I.; Szemraj, J.; Robak, T. Drug resistance in multiple myeloma. Cancer Treat. Rev. 2018, 70, 199–208. [Google Scholar] [CrossRef]
  18. Pinto, V.; Bergantim, R.; Caires, H.R.; Seca, H.; Guimaraes, J.E.; Vasconcelos, M.H. Multiple Myeloma: Available Therapies and Causes of Drug Resistance. Cancers 2020, 12, 407. [Google Scholar] [CrossRef]
  19. Hofgaard, P.O.; Jodal, H.C.; Bommert, K.; Huard, B.; Caers, J.; Carlsen, H.; Schwarzer, R.; Schunemann, N.; Jundt, F.; Lindeberg, M.M.; et al. A novel mouse model for multiple myeloma (MOPC315.BM) that allows noninvasive spatiotemporal detection of osteolytic disease. PLoS ONE 2012, 7, e51892. [Google Scholar] [CrossRef]
  20. Agrawal, A.; Kruse, L.S.; Vangsted, A.J.; Gartland, A.; Jorgensen, N.R. Human P2X7 Receptor Causes Cycle Arrest in RPMI-8226 Myeloma Cells to Alter the Interaction with Osteoblasts and Osteoclasts. Cells 2020, 9, 2341. [Google Scholar] [CrossRef]
  21. Agrawal, A.; Ellegaard, M.; Haanes, K.A.; Wang, N.; Gartland, A.; Ding, M.; Praetorius, H.; Jorgensen, N.R. Absence of P2Y(2) Receptor Does Not Prevent Bone Destruction in a Murine Model of Muscle Paralysis-Induced Bone Loss. Front. Endocrinol. 2022, 13, 850525. [Google Scholar] [CrossRef] [PubMed]
  22. Donnelly-Roberts, D.L.; Namovic, M.T.; Han, P.; Jarvis, M.F. Mammalian P2X7 receptor pharmacology: Comparison of recombinant mouse, rat and human P2X7 receptors. Br. J. Pharmacol. 2009, 157, 1203–1214. [Google Scholar] [CrossRef] [PubMed]
  23. Nicke, A.; Kuan, Y.H.; Masin, M.; Rettinger, J.; Marquez-Klaka, B.; Bender, O.; Gorecki, D.C.; Murrell-Lagnado, R.D.; Soto, F. A functional P2X7 splice variant with an alternative transmembrane domain 1 escapes gene inactivation in P2X7 knock-out mice. J. Biol. Chem. 2009, 284, 25813–25822. [Google Scholar] [CrossRef]
  24. Inoue, K.; Tsuda, M. Nociceptive signaling mediated by P2X3, P2X4 and P2X7 receptors. Biochem. Pharmacol. 2021, 187, 114309. [Google Scholar] [CrossRef]
  25. Chen, Y.; Zhang, X.; Wang, C.; Li, G.; Gu, Y.; Huang, L.Y. Activation of P2X7 receptors in glial satellite cells reduces pain through downregulation of P2X3 receptors in nociceptive neurons. Proc. Natl. Acad. Sci. USA 2008, 105, 16773–16778. [Google Scholar] [CrossRef]
  26. Gonzalez-Rodriguez, S.; Pevida, M.; Roques, B.P.; Fournie-Zaluski, M.C.; Hidalgo, A.; Menendez, L.; Baamonde, A. Involvement of enkephalins in the inhibition of osteosarcoma-induced thermal hyperalgesia evoked by the blockade of peripheral P2X3 receptors. Neurosci. Lett. 2009, 465, 285–289. [Google Scholar] [CrossRef] [PubMed]
  27. Hansen, R.R.; Nasser, A.; Falk, S.; Baldvinsson, S.B.; Ohlsson, P.H.; Bahl, J.M.; Jarvis, M.F.; Ding, M.; Heegaard, A.M. Chronic administration of the selective P2X3, P2X2/3 receptor antagonist, A-317491, transiently attenuates cancer-induced bone pain in mice. Eur. J. Pharmacol. 2012, 688, 27–34. [Google Scholar] [CrossRef]
  28. Kaan, T.K.; Yip, P.K.; Patel, S.; Davies, M.; Marchand, F.; Cockayne, D.A.; Nunn, P.A.; Dickenson, A.H.; Ford, A.P.; Zhong, Y.; et al. Systemic blockade of P2X3 and P2X2/3 receptors attenuates bone cancer pain behaviour in rats. Brain 2010, 133, 2549–2564. [Google Scholar] [CrossRef]
  29. Xiang, Z.; Lv, J.; Jiang, P.; Chen, C.; Jiang, B.; Burnstock, G. Expression of P2X receptors on immune cells in the rat liver during postnatal development. Histochem. Cell Biol. 2006, 126, 453–463. [Google Scholar] [CrossRef]
  30. Burnstock, G. Blood cells: An historical account of the roles of purinergic signalling. Purinergic Signal. 2015, 11, 411–434. [Google Scholar] [CrossRef]
  31. Vargas-Martinez, E.M.; Gomez-Coronado, K.S.; Espinosa-Luna, R.; Valdez-Morales, E.E.; Barrios-Garcia, T.; Barajas-Espinosa, A.; Ochoa-Cortes, F.; Montano, L.M.; Barajas-Lopez, C.; Guerrero-Alba, R. Functional expression of P2X1, P2X4 and P2X7 purinergic receptors in human monocyte-derived macrophages. Eur. J. Pharmacol. 2020, 888, 173460. [Google Scholar] [CrossRef] [PubMed]
  32. Burnstock, G. Unresolved issues and controversies in purinergic signalling. J. Physiol. 2008, 586, 3307–3312. [Google Scholar] [CrossRef] [PubMed]
  33. Schneider, M.; Prudic, K.; Pippel, A.; Klapperstuck, M.; Braam, U.; Muller, C.E.; Schmalzing, G.; Markwardt, F. Interaction of Purinergic P2X4 and P2X7 Receptor Subunits. Front. Pharmacol. 2017, 8, 860. [Google Scholar] [CrossRef]
  34. Craigie, E.; Birch, R.E.; Unwin, R.J.; Wildman, S.S. The relationship between P2X4 and P2X7: A physiologically important interaction? Front. Physiol. 2013, 4, 216. [Google Scholar] [CrossRef] [PubMed]
  35. Weinhold, K.; Krause-Buchholz, U.; Rodel, G.; Kasper, M.; Barth, K. Interaction and interrelation of P2X7 and P2X4 receptor complexes in mouse lung epithelial cells. Cell. Mol. Life Sci. 2010, 67, 2631–2642. [Google Scholar] [CrossRef]
  36. Adamiak, M.; Bujko, K.; Thapa, A.; Pensato, V.; Brzezniakiewicz-Janus, K.; Ratajczak, J.; Davies, D.L.; Ulrich, H.; Kucia, M.; Ratajczak, M.Z. The P2X4 purinergic receptor has emerged as a potent regulator of hematopoietic stem/progenitor cell mobilization and homing-a novel view of P2X4 and P2X7 receptor interaction in orchestrating stem cell trafficking. Leukemia 2022, 36, 248–256. [Google Scholar] [CrossRef]
  37. Vanderkerken, K.; Asosingh, K.; Croucher, P.; Van Camp, B. Multiple myeloma biology: Lessons from the 5TMM models. Immunol. Rev. 2003, 194, 196–206. [Google Scholar] [CrossRef]
  38. Paton-Hough, J.; Chantry, A.D.; Lawson, M.A. A review of current murine models of multiple myeloma used to assess the efficacy of therapeutic agents on tumour growth and bone disease. Bone 2015, 77, 57–68. [Google Scholar] [CrossRef]
  39. Diaz-del Castillo, M.; Kamstrup, D.; Olsen, R.B.; Hansen, R.B.; Pembridge, T.; Simanskaite, B.; Jimenez-Andrade, J.M.; Lawson, M.A.; Heegaard, A.M. Differential Pain-Related Behaviors and Bone Disease in Immunocompetent Mouse Models of Myeloma. JBMR Plus 2020, 4, e10252. [Google Scholar] [CrossRef]
  40. Vanderkerken, K.; De Raeve, H.; Goes, E.; Van Meirvenne, S.; Radl, J.; Van Riet, I.; Thielemans, K.; Van Camp, B. Organ involvement and phenotypic adhesion profile of 5T2 and 5T33 myeloma cells in the C57BL/KaLwRij mouse. Br. J. Cancer 1997, 76, 451–460. [Google Scholar] [CrossRef]
  41. Cheung, W.C.; Kim, J.S.; Linden, M.; Peng, L.; Van Ness, B.; Polakiewicz, R.D.; Janz, S. Novel targeted deregulation of c-Myc cooperates with Bcl-X(L) to cause plasma cell neoplasms in mice. J. Clin. Investig. 2004, 113, 1763–1773. [Google Scholar] [CrossRef] [PubMed]
  42. Carrasco, D.R.; Sukhdeo, K.; Protopopova, M.; Sinha, R.; Enos, M.; Carrasco, D.E.; Zheng, M.; Mani, M.; Henderson, J.; Pinkus, G.S.; et al. The differentiation and stress response factor XBP-1 drives multiple myeloma pathogenesis. Cancer Cell 2007, 11, 349–360. [Google Scholar] [CrossRef] [PubMed]
  43. Chesi, M.; Robbiani, D.F.; Sebag, M.; Chng, W.J.; Affer, M.; Tiedemann, R.; Valdez, R.; Palmer, S.E.; Haas, S.S.; Stewart, A.K.; et al. AID-dependent activation of a MYC transgene induces multiple myeloma in a conditional mouse model of post-germinal center malignancies. Cancer Cell 2008, 13, 167–180. [Google Scholar] [CrossRef] [PubMed]
  44. Winkler, W.; Farre Diaz, C.; Blanc, E.; Napieczynska, H.; Langner, P.; Werner, M.; Walter, B.; Wollert-Wulf, B.; Yasuda, T.; Heuser, A.; et al. Mouse models of human multiple myeloma subgroups. Proc. Natl. Acad. Sci. USA 2023, 120, e2219439120. [Google Scholar] [CrossRef] [PubMed]
  45. Mitsiades, C.S.; Anderson, K.C.; Carrasco, D.R. Mouse models of human myeloma. Hematol. Oncol. Clin. N. Am. 2007, 21, 1051–1069. [Google Scholar] [CrossRef]
  46. Paton-Hough, J.; Tazzyman, S.; Evans, H.; Lath, D.; Down, J.M.; Green, A.C.; Snowden, J.A.; Chantry, A.D.; Lawson, M.A. Preventing and Repairing Myeloma Bone Disease by Combining Conventional Antiresorptive Treatment With a Bone Anabolic Agent in Murine Models. J. Bone Miner. Res. 2019, 34, 783–796. [Google Scholar] [CrossRef]
  47. Adinolfi, E.; Raffaghello, L.; Giuliani, A.L.; Cavazzini, L.; Capece, M.; Chiozzi, P.; Bianchi, G.; Kroemer, G.; Pistoia, V.; Di Virgilio, F. Expression of P2X7 receptor increases in vivo tumor growth. Cancer Res. 2012, 72, 2957–2969. [Google Scholar] [CrossRef]
  48. Adinolfi, E.; Capece, M.; Franceschini, A.; Falzoni, S.; Giuliani, A.L.; Rotondo, A.; Sarti, A.C.; Bonora, M.; Syberg, S.; Corigliano, D.; et al. Accelerated tumor progression in mice lacking the ATP receptor P2X7. Cancer Res. 2015, 75, 635–644. [Google Scholar] [CrossRef]
Figure 1. Quantified calcium influx in MOPC315.BM stimulated with increasing doses of ATP (a) and BzATP (b), and the respective injection traces of relative fluorescence (arrow marking the injection point). Pre-incubation with antagonists A-438079 (10 µM) or A-740003 (1 µM) did not alter the calcium response in the presence of either 2.5 mM ATP (c) or 300 µM BzATP (d). Human cell line RPMI-8226 and BzATP (100 µM) were used as an assay control (e). Data show the maximum peak fluorescence after agonist injection as a fold change of baseline before injection, normalized to no-agonist control (dotted line) and expressed as mean ± SEM of four independent experiments (n) with three technical replicates for each concentration. Kruskal–Wallis test followed by Dunn’s multiple comparisons test is used for comparison of each concentration to the no-agonist control (a,b); or Mann–Whitney t-test for comparison between agonist and antagonists (c,d) and between no agonist and agonist (e). * p-values < 0.05 were considered statistically significant.
Receptors 02 00013 g001
Figure 2. Quantified YO-PRO-1 uptake in MOPC315.BM stimulated with increasing doses of ATP (a) and BzATP (b), and the respective injection traces of relative fluorescence (arrow marking the injection point). Pre-incubation with antagonists A-438079 (10 µM) or A-740003 (1 µM) did not alter the YO-PRO-1 uptake response induced by 2.5 mM ATP (c) or 500 µM BzATP (d). Human cell line RPMI-8226 and BzATP (500 µM) were used as an assay control (e). Data show area under the curve (AUC) from the time of injection normalized to no-agonist control (dotted line) and expressed as mean ± SEM of four independent experiments (n) with three technical replicates for each concentration. Kruskal–Wallis test followed by Dunn’s multiple comparisons test was used for comparison of each concentration to the no-agonist control (a,b); or Mann–Whitney t-test for comparison between agonist and antagonists (c,d) and between no agonist and agonist (e). ** indicates p-values < 0.01.
Receptors 02 00013 g002
Figure 3. TaqMan qPCR analysis showing the expressions of P2X7 receptor mRNA variants of the BALB/c P2rx7 gene in MOPC315.BM cells, RAW 264.7 cells, and primary osteoclasts, calculated as ∆Ct of housekeeping genes Gapdh, Actb, and 18s (a). P2rx1 gene expression in MOPC315.BM cells was used to calculate the fold change (2−∆∆Ct) of all P2RX subtypes in MOPC315.BM cells, RAW 264.7 cells, and primary osteoclasts (b) with Gapdh as a housekeeping gene. Data are presented as means ± SEM of mRNA prepared from 3 separate subcultures of MOPC315.BM cells.
Receptors 02 00013 g003
Figure 4. TaqMan qPCR analysis depicted as heat map of the transcriptional regulation after MOPC315.BM cells were treated with 500 µM BzATP for 30 min. Expressions of P2RX (a) and P2RY (b) subtypes and candidates involved in purinergic signaling pathways (c) calculated as 2−∆∆Ct of P2rx1 expression in untreated MOPC315.BM cells. Gapdh was used as a housekeeping gene. mRNA was prepared from 3 separate subcultures of MOPC315.BM cells. Ratio paired t-test was used to assess the fold-change significance, and * = p-value < 0.05. Gene names are represented by the following symbols: ectonucleotidase CD39 (Entpd1), 5′-ectonucleotidase (Nt5e), Fc receptor (Fcamr), NLR family, pyrin domain containing 3 (Nlrp3), pannexin 1 (Panx1), Caspase 1 (Casp1), interleukin 6 (Il6), interleukin 1 beta (Il1b), interleukin 18 (Il18), intercellular adhesion molecule 1 (Icam-1), tumor necrosis factor (Tnf), and nuclear factor of kappa 1, p105 (Nf-kb1).
Receptors 02 00013 g004
Table 1. Assay IDs of genes used in the TaqMan Array.
Gene
Symbols
Assay IDsGene
Symbols
Assay IDsGene
Symbols
Assay IDsGene
Symbols
Assay IDs
18sHs99999901_s1P2rx1Mm00435460_m1P2ry1Mm00435471_mEntpd1Mm00515447_m1
GapdhMm99999915_g1P2rx2Mm00462952_m1P2ry2Mm00435472_m1Nt5eMm00501910_m1
ActbMm01205647_g1P2rx3Mm00523699_m1P2ry4Mm00445136_s1FcamrMm03047928_m1
HprtMm03024075_m1P2rx4Mm00501787_m1P2ry6Mm01275473_m1Nlrp3Mm00840904_m1
P2rx5Mm00473677_m1P2ry10Mm00549811_m1Panx1Mm00450900_m1
P2rx6Mm00440591_m1P2ry12Mm00446026_m1Casp1Mm00438023_m1
P2rx7 *Mm01199500_m1P2ry13Mm00546978_m1Il6Mm00446190_m1
P2rx7 **Mm00440578_m1P2ry14Mm01289602_m1Il1bMm00434228_m1
Il18Mm00434226_m1
Icam1Mm00516023_m1
TnfMm00443258_m1
Nfkb1Mm00476361_m1
* Assay amplifies the transcript region common to variants a and k. ** Assay amplifies the transcript region unique to variant a, and excludes variant k.
Table 2. Summary of agonist-induced calcium influx in MOPC315.BM.
[BzATP]0 μM10 μM50 μM100 μM200 μM300 μM
Fmax/F0, mean ± SEM1.000 ± 0.0001.201 ± 0.0861.214 ± 0.1090.873 ± 0.1751.333 ± 0.1031.357 ± 0.153
(n)(4)(4)(4)(4)(4)(4)
p-value-0.8030.6638>0.9990.13730.1559
[BzATP]0 μM 300 μM300 μM300 μM
+ 10 µM A-4380791 µM A-740003
Fmax/F0, mean ± SEM1.000 ± 0.000 1.020 ± 0.0881.170 ± 0.2220.866 ± 0.225
(n)(4) (4)(4)(4)
p-value- 0.31430.857>0.999
[ATP]0 mM0.5 mM1 mM2 mM3 mM4 mM
Fmax/F0, mean ± SEM1.000 ± 0.0001.553 ± 0.4581.260 ± 0.2421.935 ± 0.6161.864 ± 0.4531.056 ± 0.409
(n)(4)(4)(4)(4)(4)(4)
p-value->0.999>0.9990.5350.5726>0.999
[ATP]0 mM 2.5 mM2.5 mM2.5 mM
+ 10 µM A-4380791 µM A-740003
Fmax/F0, mean ± SEM1.000 ± 0.000 1.841 ± 0.5392.299 ± 1.1261.533 ± 0.405
(n)(4)(4)(4)(4)
p-value- 0.93330.68570.8857
Table 3. Summary of agonist-induced pore formation in MOPC315.BM.
[BzATP]0 μM5 μM10 μM50 μM100 μM500 μM
AUC, mean ± SEM1.000 ± 0.0001.077 ± 0.1261.175 ± 0.0591.111 ± 0.0641.269 ± 0.1761.195 ± 0.1134
(n)(4)(4)(4)(4)(4)(4)
p-value->0.9990.5441>0.9990.66380.803
[BzATP]0 μM 500 μM500 μM500 μM
+ 10 µM A-4380791 µM A-740003
AUC, mean ± SEM1.000 ± 0.000 1.250 ± 0.0331.202 ± 0.1351.175 ± 0.179
(n)(4)(4)(4)(4)
p-value- 0.02860.48570.3429
[ATP]0 mM0.1 mM0.5 mM1 mM2 mM2.5 mM
AUC, mean ± SEM1.000 ± 0.0000.953 ± 0.0890.870 ± 0.0670.798 ± 0.0280.786 ± 0.0680.898 ± 0.139
(n)(4)(4)(4)(4)(4)(4)
p-value->0.999>0.9990.4910.2534>0.999
[ATP]0 mM 2.5 mM2.5 mM2.5 mM
+ 10 µM A-4380791 µM A-740003
AUC, mean ± SEM1.000 ± 0.000 0.959 ± 0.1640.956 ± 0.0870.909 ± 0.129
(n)(4)(4)(4)(4)
p-value- 0.31430.88570.6857
Disclaimer/Publisher’s Note: The statements, opinions and data contained in all publications are solely those of the individual author(s) and contributor(s) and not of MDPI and/or the editor(s). MDPI and/or the editor(s) disclaim responsibility for any injury to people or property resulting from any ideas, methods, instructions or products referred to in the content.

