Article

Hemodynamic Implications of Aortic Stenosis on Ascending Aortic Aneurysm Progression: A Patient-Specific CFD Study

by
A B M Nazmus Salehin Nahid
,
Mashrur Muntasir Nuhash
and
Ruihang Zhang
*
Department of Mechanical and Industrial Engineering, University of Minnesota Duluth, Duluth, MN 55812, USA
*
Author to whom correspondence should be addressed.
J. Vasc. Dis. 2025, 4(4), 38; https://doi.org/10.3390/jvd4040038
Submission received: 22 August 2025 / Revised: 15 September 2025 / Accepted: 30 September 2025 / Published: 3 October 2025
(This article belongs to the Section Peripheral Vascular Diseases)

Abstract

An ascending aortic aneurysm is a localized dilation of the ascending aorta, which poses a high risk of aortic dissection or rupture, with surgery recommended at diameters > 5.5 cm. However, events also occur at smaller sizes, suggesting additional factors—such as stenosis—may significantly influence aneurysm severity. To investigate this, a computational fluid dynamics (CFD) analysis was conducted using a patient-specific ascending aortic model (aneurysm diameter: 5.28 cm) under three aortic stenosis severities: mild, moderate, and severe. Results showed that the severe stenosis condition led to the formation of prominent recirculation zones and increased peak velocities, 2.36 m·s−1 compared to 1.53 m·s−1 for moderate stenosis and 1.37 m·s−1 for mild stenosis. A significantly increased pressure loss coefficient was observed for the severe case. Additionally, the wall shear stress (WSS) distribution exhibited higher values along the anterior region and lower values along the posterior region. Peak WSS values were recorded at 43.46 Pa in the severe stenosis model, compared to 21.98 Pa and 13.87 Pa for the moderate and mild cases, respectively. Velocity distribution and helicity analyses demonstrate that increasing stenosis severity amplifies jet-induced flow disturbances, contributing to larger recirculation zones and greater helicity heterogeneity in the ascending aorta. Meanwhile, WSS results indicate that greater stenosis severity is also associated with elevated WSS magnitude and heterogeneity in the ascending aorta, with severe cases exhibiting the highest value. These findings highlight the need to incorporate hemodynamic metrics, alongside traditional diameter-based criteria, into rupture risk assessment frameworks.

1. Introduction

The aorta, the largest artery in the human body, originates at the aortic valve and extends through the diaphragm, continuing as the abdominal aorta. Anatomically, it is divided into three main segments: the ascending aorta, the aortic arch, and the descending aorta. An aortic aneurysm is defined as a localized dilation of the aortic wall that, if left untreated, can lead to fatal complications such as aortic dissection or even rupture [1]. Particularly, aortic dissection is an acute and life-threatening condition characterized by a tear in the inner layer of the aortic wall—intimal tear. It can occur when wall stress exceeds aortic wall strength, allowing blood flow to enter the layers of the aorta wall, forming a false lumen. This false lumen blood flow can obstruct the blood flow of the true aortic channel or the true lumen, causing severe problems such as limiting blood flow to vital organs [2]. It can propagate downstream or upstream along the aorta and can spread to other arteries and create unexpected complications. A weakened aortic wall caused by aortic dissection can lead to rupture, which is a very fatal condition and even results in sudden death. Aortic dissection can be divided into two types by the Stanford classification: Type A and Type B [3]. Type A is characterized by dissection in the ascending portion of the aorta, between the aortic valve and the brachiocephalic trunk, while type B refers to complications on the descending aorta. Ascending aortic aneurysm accounts for approximately 60% of all thoracic aortic aneurysm cases [4]. Surgical intervention is generally recommended when the risk of rupture outweighs the inherent risks of the procedure [5,6], with an operative mortality rate reported as high as 5% [7]. According to the current clinical guidelines, surgery is advised when the aneurysm diameter reaches or exceeds 5.5 cm [8]. However, patients with diameters smaller than 5.5 cm can also experience rupture or aortic dissection [9]. Studies have shown that more than 50% of patients undergo dissection below the surgical threshold [5,10]. While diameter remains the primary clinical marker, other geometric properties of the aorta have also been associated with dissection risk. For instance, an increased aortic length has been linked to higher susceptibility to dissection [11]. Sun et al. conducted a study of 112 patients, comprising healthy and diseased patients, and analyzed morphological indicators of the aorta. They identified the degree of curvature of the ascending aorta as a significant contributing factor [12]. However, in a recent study, Eliathamby et al. concluded that threshold criteria based solely on diameter and length are insufficient to reliably identify aneurysms at high risk of dissection [13].
To assess the risk of aortic dissection and aneurysm rupture more accurately, it is essential to improve the diagnostic tool and consider all contributing factors [14]. Moreover, aortic stenosis, characterized by narrowing of the aortic valve due to calcific leaflet buildup, is one factor that has received relatively limited attention. As reported, aortic stenosis affects approximately 2% of the global population over the age of 60 [15]. It significantly alters aortic hemodynamics by restricting blood flow and increasing flow resistance [16]. However, obtaining real-time in vivo hemodynamic measurements remains challenging. To address this limitation, researchers have employed a variety of tools to replicate and study blood flow dynamics, including numerical modeling [17], in vitro experiments with artificial models [18], mechanical testing, and most notably, computational fluid dynamics (CFD) simulation [19,20].
CFD offers a robust framework for simulating and visualizing complicated blood flow conditions, enabling detailed quantitative analysis of velocity fields, pressure distributions, and shear stresses within patient-specific vascular geometries. Simao et al. conducted a CFD study on three cases, one healthy and two aneurysmal, and found that the presence of an aneurysm in the ascending aorta introduced flow separation, increased pressure drops, and vortex formation [21]. Petuchova and Maknickas reported substantial changes in Wall Shear Stress (WSS) and a 45% greater wall displacement in the aorta with ascending aneurysm [22]. Azevedo et al. correlated high wall pressure and elevated WSS with aneurysm growth [23]. These studies highlight the importance of CFD to analyze irregularities in the aorta. Furthermore, patients with concurrent aortic stenosis and aneurysm face highly complicated hemodynamic conditions. Understanding these hemodynamic changes is crucial, as flow patterns, pressure gradients, and wall shear stresses provide important insights into aneurysm progression and rupture risk. However, limited studies have investigated how the presence of aortic valve stenosis impacts the hemodynamics and, consequently, alters risk assessment in patients with ascending aortic aneurysms.
To address this gap, this study performs CFD simulations on a patient-specific aortic aneurysm geometry under three stenosis severities: mild, moderate, and severe. Key Hemodynamic parameters, including velocity distributions, helicity, WSS, and pressure drop, were analyzed and compared across conditions. The objective is to evaluate how the presence of aortic stenosis alters the hemodynamics and may influence the risk of rupture or dissection. These findings aim to support future patient-specific studies and improve risk assessment by considering a broader set of contributing factors rather than relying solely on aortic geometry.

2. Materials and Methods

2.1. Model Configuration and Boundary Conditions

Figure 1a shows the patient-specific geometry utilized in this study. It was obtained from an open-source patient-specific database of cardiovascular models [24], under the filename D2.nrrd. This selected case involves an ascending aorta with a diameter of 5.28 cm, which is below the current 5.5 cm surgical threshold yet sufficiently close to warrant clinical concern. The fully simulated geometry was reconstructed in SolidWorks to closely replicate the patient-specific anatomy. For this, the geometry model was first converted to an STL (stereolithography) file using 3D Slicer, version 5.8.1. The file was then imported to SolidWorks (Version 2024) as a surface body, as shown in Figure 1a. A series of sketches was drawn tracing the outer perimeter of the aorta and its branches. These sketches were then joined to create a solid body. An additional element was added to the upstream of the model to represent the narrowing of the aortic valve due to stenosis, presented in Figure 1b. In this model, the degree of severity of aortic stenosis (AS) is defined by the percentage of orifice area obstructed, calculated by 1-(Dj/D)2, where D represents the diameter of the inlet of the aorta and Dj is the minimum diameter of stenosis. Three degrees of stenosis are considered in this study: mild (50% of orifice area obstructed), moderate (62% obstruction), and severe (75% obstruction). Similar geometry has been utilized in other studies to represent aortic stenosis [25,26,27,28].
Moreover, three-dimensional CFD simulations have been performed for this patient-specific aortic aneurysm model using Ansys Fluent. For boundary conditions, a steady mass flow of 0.315 Kg·s−1 (equivalent to 18 LPM) was applied at the inlet, following the established literature values [29]. The aortic pressure was set to 120 mmHg, with no-slip conditions and rigid wall assumptions. Blood was modeled as a Newtonian fluid with a dynamic viscosity of 0.0035 Pa·s and a density of 1060 kg·m−3.

2.2. Governing Equations

Continuity Equation (1) and Navier–Stokes Equation (2) were used to calculate the flow in the aorta [30]:
ρ u i x i = 0
x j ρ u i u j = p x i + x j μ u i x j ρ u i u j ¯
Here, ρ is the fluid density in kg·m−3, u is the fluid velocity (m·s−1), p represents pressure (Pa), and µ is the dynamic viscosity of the fluid (Pa·s). The Reynolds term can be explained using the Boussinesq hypothesis:
ρ u i u j ¯ = μ t u i x j + u j x i 2 3 ρ k δ i j 2 3 μ t u k x k δ i j
In Equation (3), δij is the Kronecker delta, k represents turbulent kinetic energy (m2·s−2), and µt is turbulent viscosity (Pa·s). The k-ω SST turbulence model was employed in this study, where k depicts turbulent kinetic energy and ω represents the diffusion of turbulent energy. This model shows reliable near-wall accuracy while reducing free-stream sensitivity and produces favorable results in large arteries [19].

2.3. Mesh Sensitivity Analysis

The computational mesh was generated with Fluent Meshing in Ansys Fluent 2023 R2, consisting of approximately 1.76 million polyhexcore cells. The mesh near the walls was refined using multiple boundary layers to achieve a non-dimensional wall distance of y+ ≤ 1. The parameter y+ defines the mesh positioning relative to the boundary layer, and a value of y+ ≤ 1 is generally recommended for the SST k-ω turbulence model.
Additionally, a mesh sensitivity analysis was performed on the mild stenotic model to optimize mesh density. The boundary conditions were kept consistent with previously described values. The area weighted average WSS at the stenosis wall was calculated at four different mesh sizes: 0.553, 1.01, 1.76, and 3.3 million cells. As illustrated in Table 1, the WSS values converged for the 1.76 and 3.3 million cell meshes, indicating mesh independence beyond this resolution. Consequently, a mesh with 1.76 million cells was selected for the final simulations to optimize the balance between numerical accuracy and computational efficiency.
The simulations were conducted in Ansys Fluent 2023 R2 (ANSYS, Canonsburg, PA, USA) using the finite volume solver. The momentum equations employed second-order upwind schemes, and the SIMPLE method was utilized for pressure-velocity coupling. The area-weighted values of WSS at the aorta and the stenosis region were set as a convergence criterion along with the continuity equation. The value of convergence was set to 10−4 for continuity, and 10−3 for the WSS values.

3. Results

3.1. Velocity Profile and Flow Structure

Figure 2 illustrates the velocity streamline across the aorta at the peak systole (maximum aortic valve opening). The top three streamlines are drawn with 10,000 elements, while the bottom three streamlines are at 20 streamline elements to show the fluid flow path. Generally, at the inlet, the velocity is relatively uniform and streamlined. However, in the stenotic orifice area, it developed a central jet, and the flow velocity increased across the valve due to the narrowing of the orifice area. In the severe stenosis case, the jet was more pronounced downstream of the stenosis and had a maximum velocity of 2.36 m·s−1. In addition, the severe case showed more extensive recirculation zones along the ascending aortic wall, marked by black arrows, as indicated in Figure 2a. The flow exhibited marked separation and turbulence, consistent with energy dissipation and elevated pressure loss. Furthermore, the moderate and mild cases also exhibited extensive similarities but with less concentrated jets downstream and reduced recirculation regions in size and intensity, compared to the severe case. Specifically, they had a lower maximum velocity, 1.53 m·s−1 for moderate and 1.37 m·s−1 for mild, respectively. Although there was flow recirculation, it was not as pronounced as in the severe case. In general, the streamline patterns demonstrate a relatively clear progression: increasing stenosis severity led to stronger jet formation and larger recirculation zones within the ascending aorta.
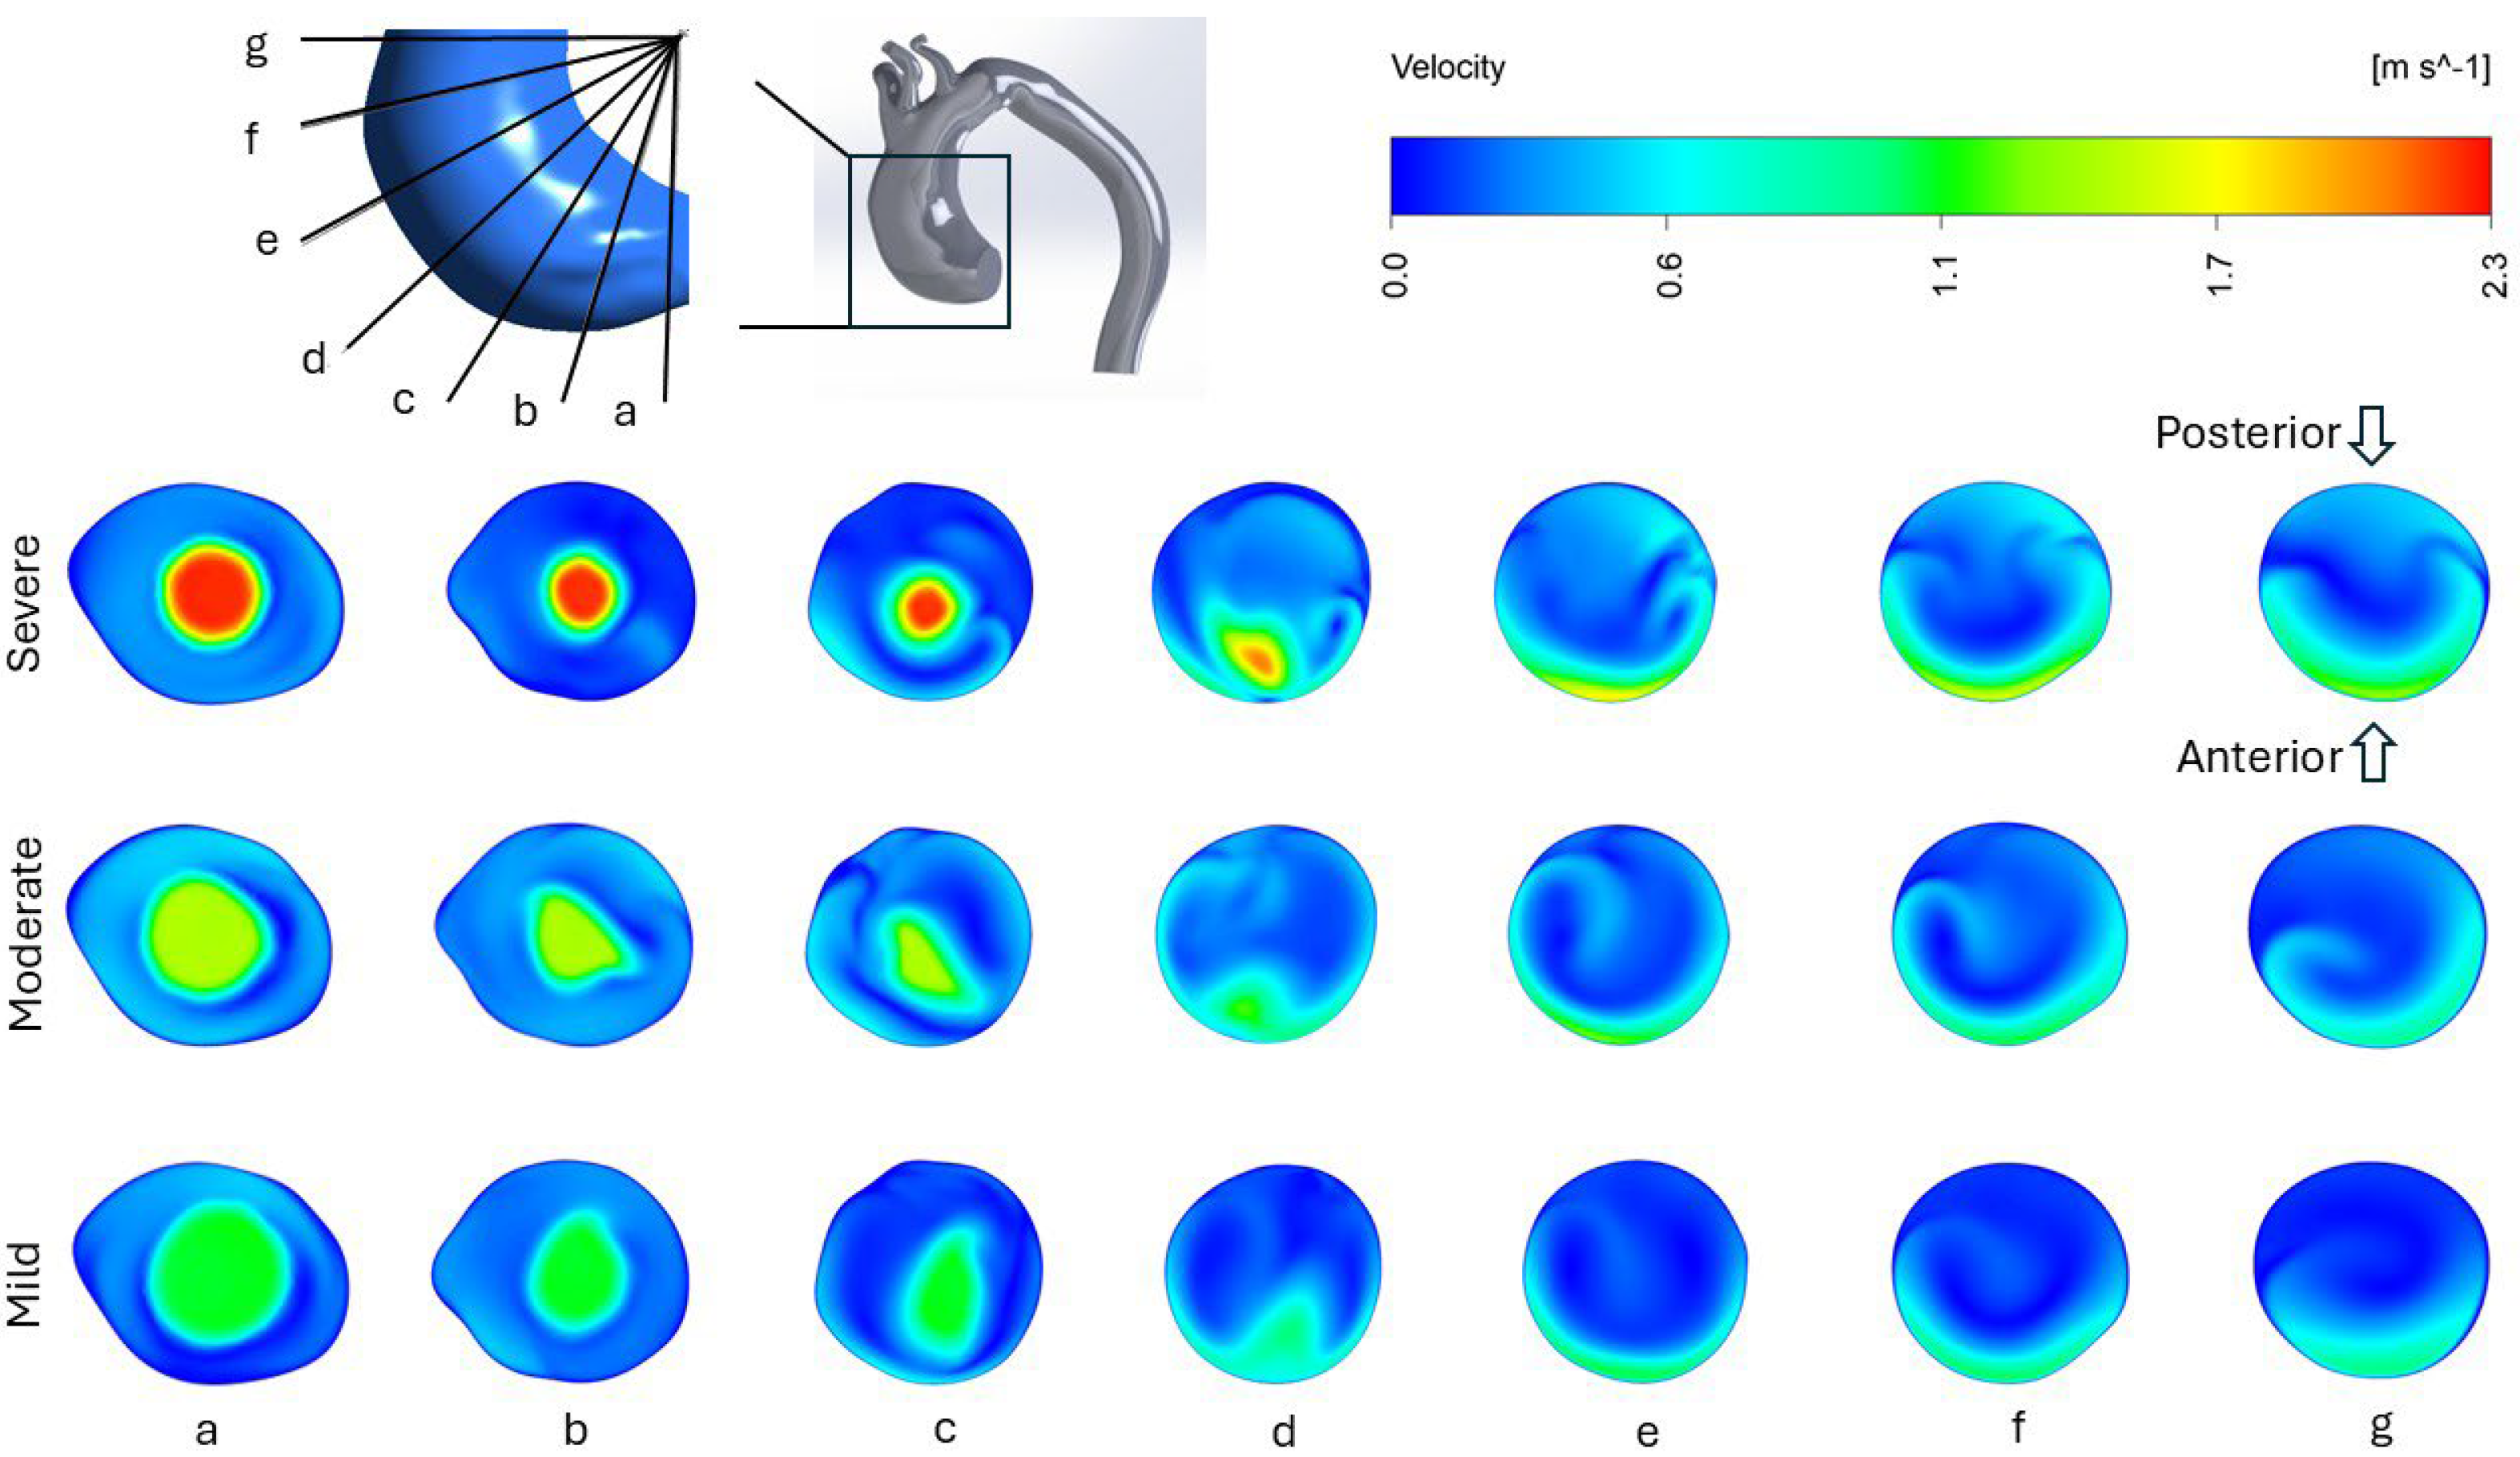
Figure 3 indicates the flow progression inside the ascending aorta with an aneurysm. Seven planes, marked a to g, were selected at an interval of 15 degrees, starting from the sinotubular junction of the aortic root to the beginning of the brachiocephalic artery. The figure depicts the flow entering the aorta, forming a jet, and expanding gradually. For the severe case, the jet is much narrower and concentrated. It gets narrower as it travels, finally collapsing against the aorta around planes d and e. Then, it flows along the anterior, while causing recirculation and non-uniform flow as evident by planes e to g. In contrast, moderate and mild cases have a much more uniform core. Furthermore, the mild case has minimum flow disturbance and non-uniformity across plane e to g. Even though the moderate case has non-uniform flow, it is less intense than that in the severe case.

3.2. Helicity

Helical flow represents the predominant flow pattern observed from the ascending aorta to the aortic arch. In this study, absolute normalized helicity was employed to quantify the helical motion or twisted nature. It is a directionally independent dimensionless number that ranges from 0 (no helical flow) to 1 (maximally helical flow). It can be expressed in the following equation [31]:
Absolute   Normalized   Helicity   =   V · ω V ω
where V is the velocity vector and ω is the vorticity vector.
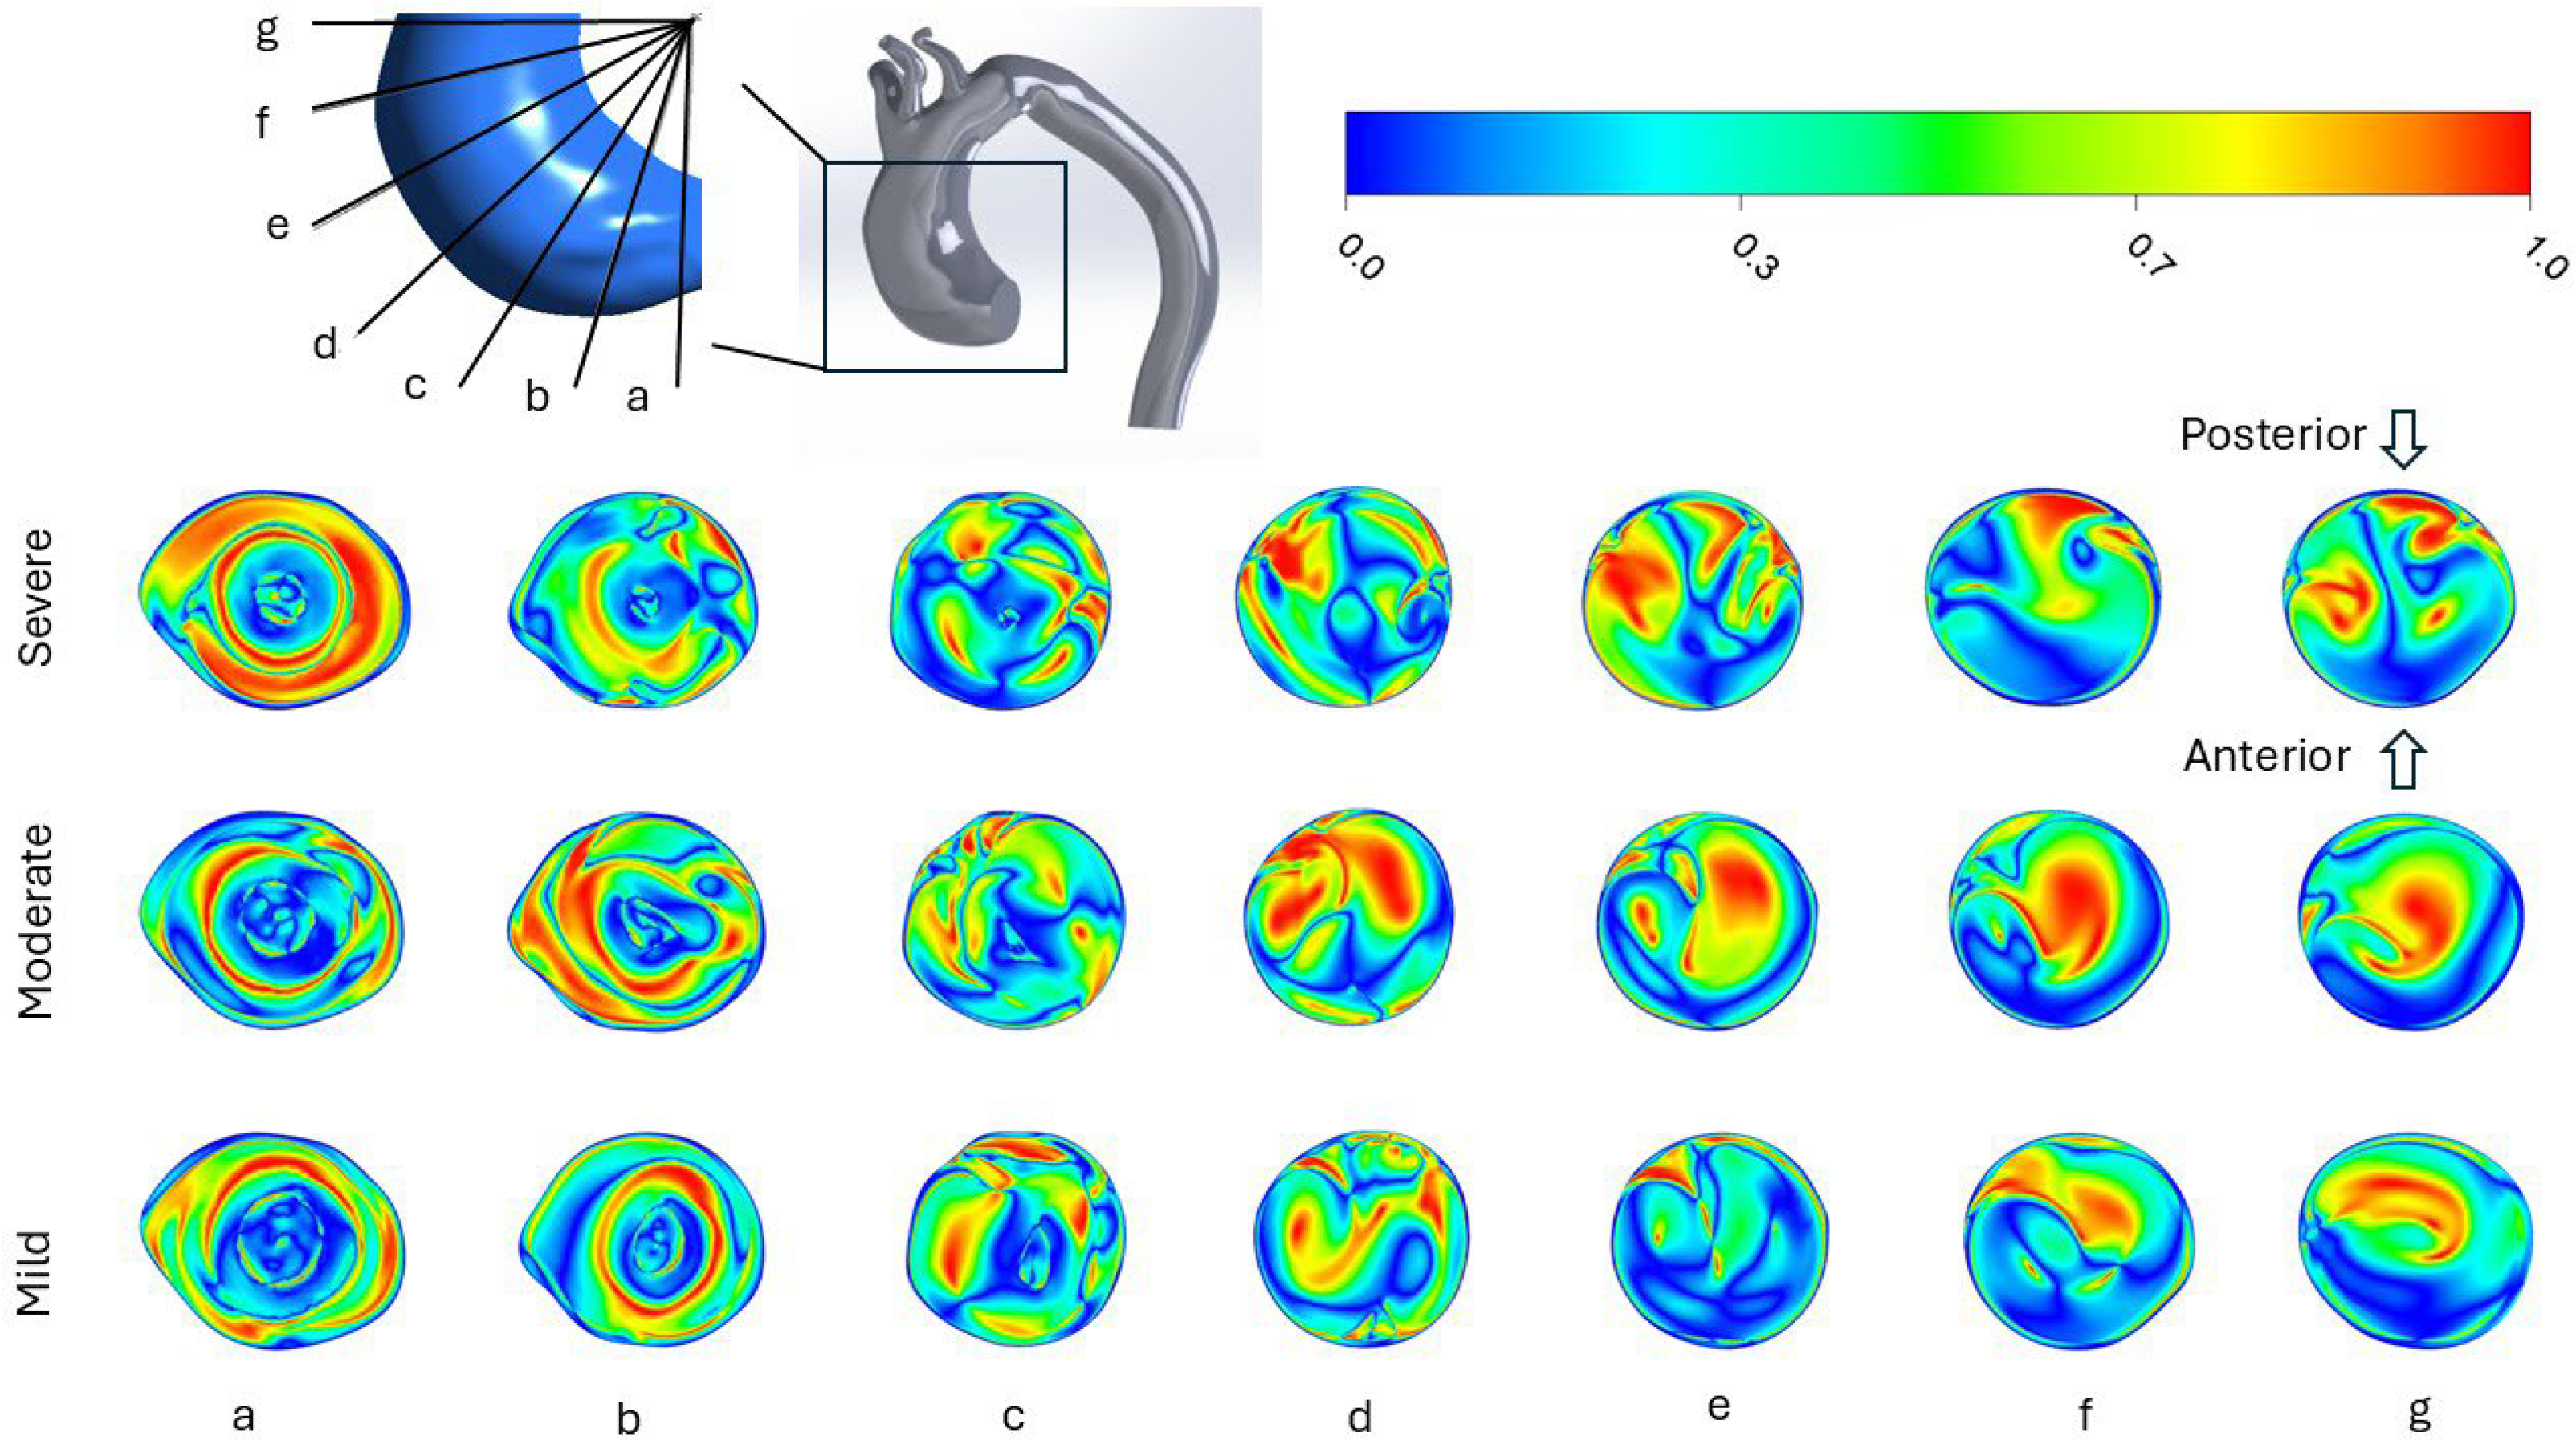
Figure 4 shows the distribution of absolute normalized helicity across the ascending aorta for mild, moderate, and severe aortic valve stenosis, comparable to Figure 3. The normalized helicity was visualized using the point cloud method, as shown in the figure. In the mild case, helicity values remained relatively uniform, with limited regions of high or low intensity. The moderate case showed a more heterogeneous distribution, with localized regions of elevated helicity appearing near the posterior wall of the ascending aorta. Meanwhile, in the severe case, pronounced fluctuations were observed, characterized by alternating regions of low and high helicity across the cross-sections. Particularly, across the three cases, at plane a, helicity was close to zero at the center, and as the flow progressed, it remained low at the anterior all up to plane g. Concentrated regions of high and low helicity were observed in the posterior and mid-aortic regions, respectively, suggesting the presence of recirculation zones, which align with the flow structure shown in Figure 2. In addition, notable differences were observed starting from planes e to g for the three cases: the severe stenosis case showed relatively significant fluctuations in helicity, particularly in the mid and posterior regions of the ascending aorta. However, the moderate and mild stenosis cases displayed relatively more uniform patterns with flow largely dominated by either high or low helicity regions. All in all, the results indicate a progressive increase in helicity heterogeneity with the severity of aortic stenosis.

3.3. Wall Shear Stress

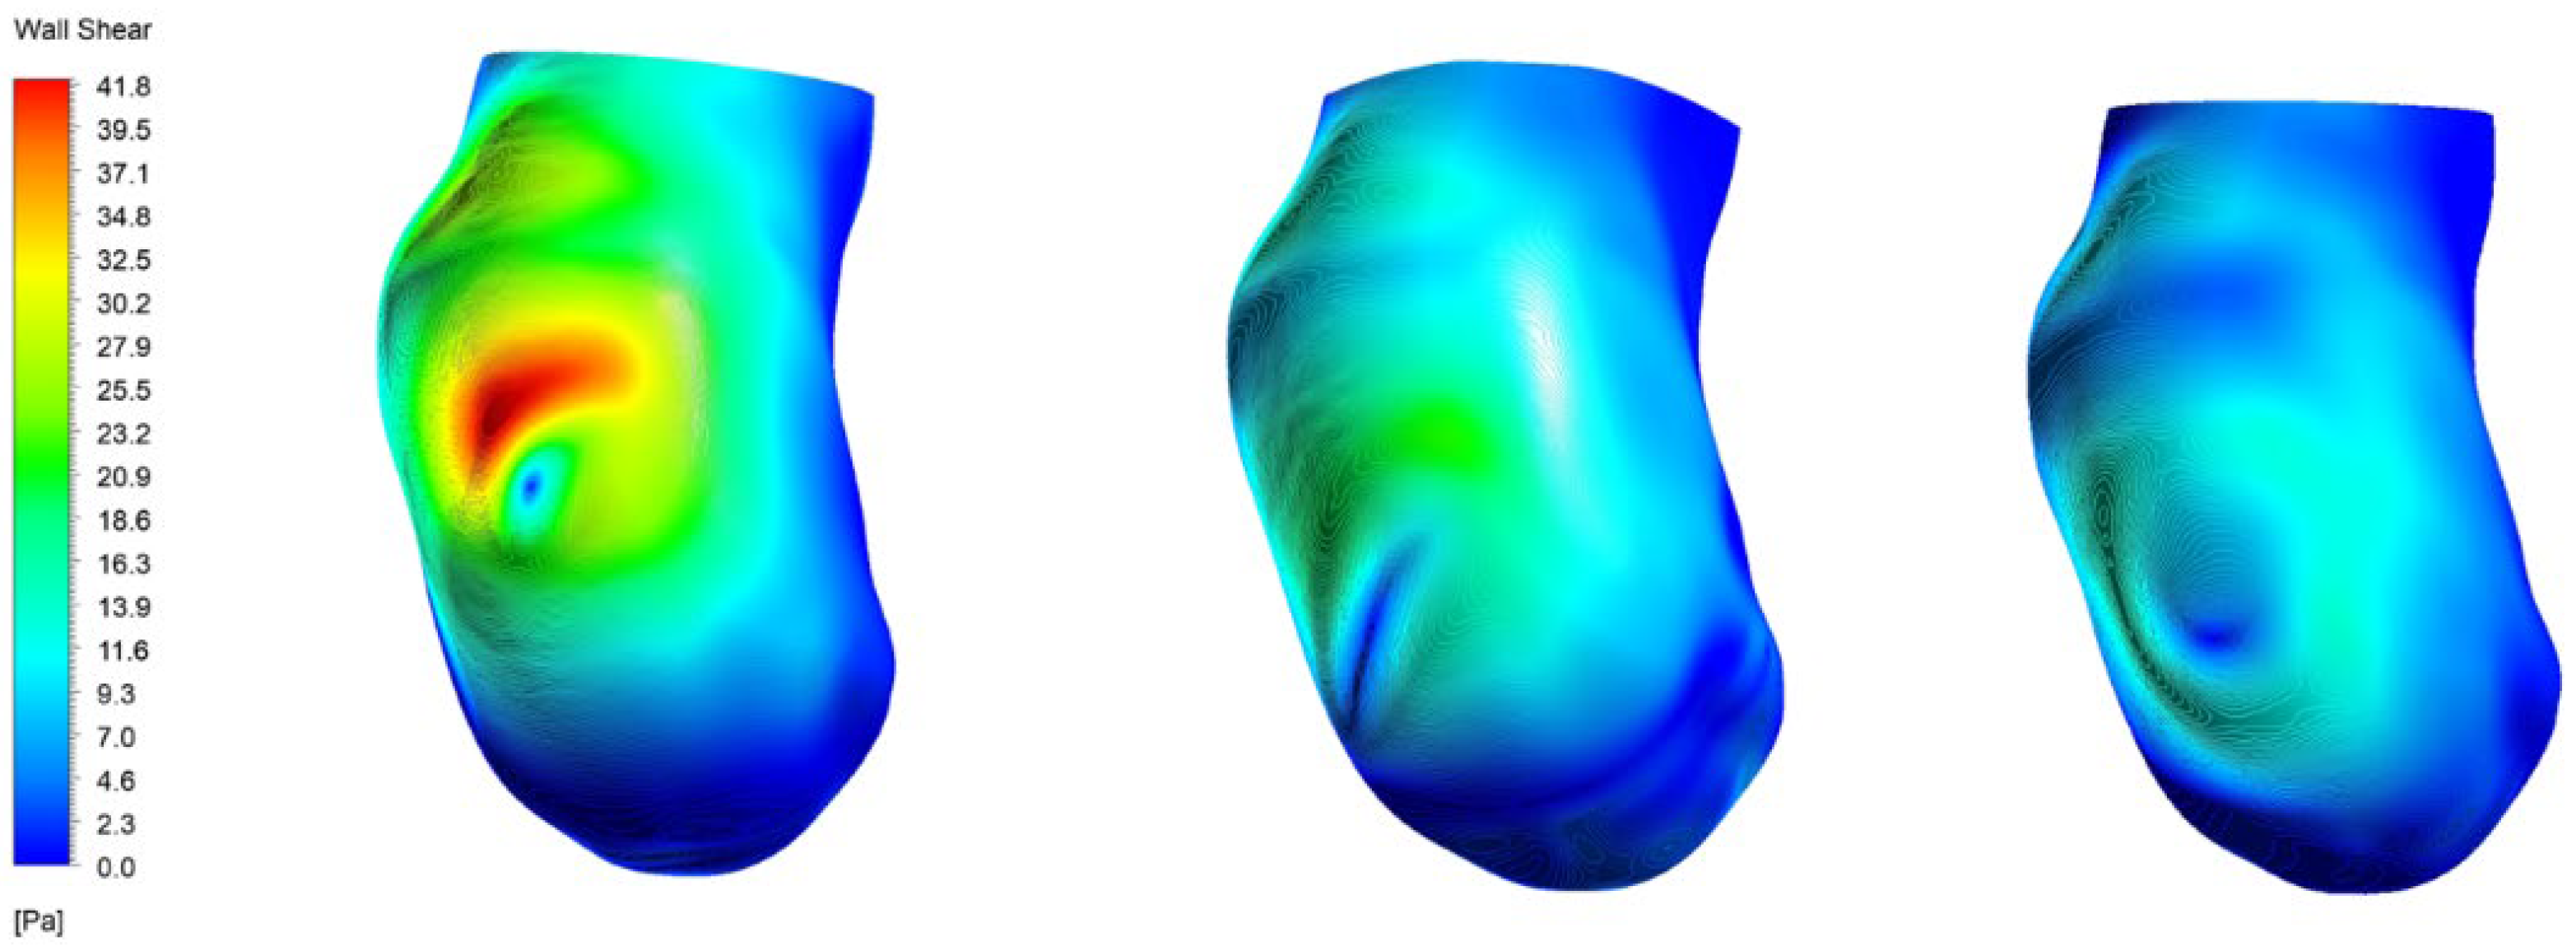
Figure 5 depicts the wall shear stress (WSS) distribution in the ascending aorta region for severe, moderate, and mild cases. In the severe case, significantly elevated WSS was observed near the stenotic jet impingement region in the aneurysm, with peak values concentrated along the anterior aortic wall region, while low WSS was observed on the posterior aortic wall region. Moreover, it should be noted that, in the severe case, there is a low shear area right below the high shear area. This coincides with previous research studies on this area [32]. In contrast, in the moderate case, WSS was lower and more uniformly distributed with localized elevations near the jet impact, while the mild case showed the lowest WSS with an even, largely uniform distribution. Additionally, the maximum WSS was found to be 43.46 Pa, but 21.98 Pa and 13.87 Pa for moderate and mild cases, respectively.

3.4. Pressure Loss Coefficient

The pressure loss coefficient (K) is a dimensionless number that quantifies how much energy is lost due to geometry changes, flow separation, or turbulence. It can be calculated from the following calculation [33]:
K = P 1 2 ρ U 2
where ΔP represents pressure drop (Pa) across the aorta, ρ represents the density of working fluid in kg·m−3, and U is the velocity in m·s−1.
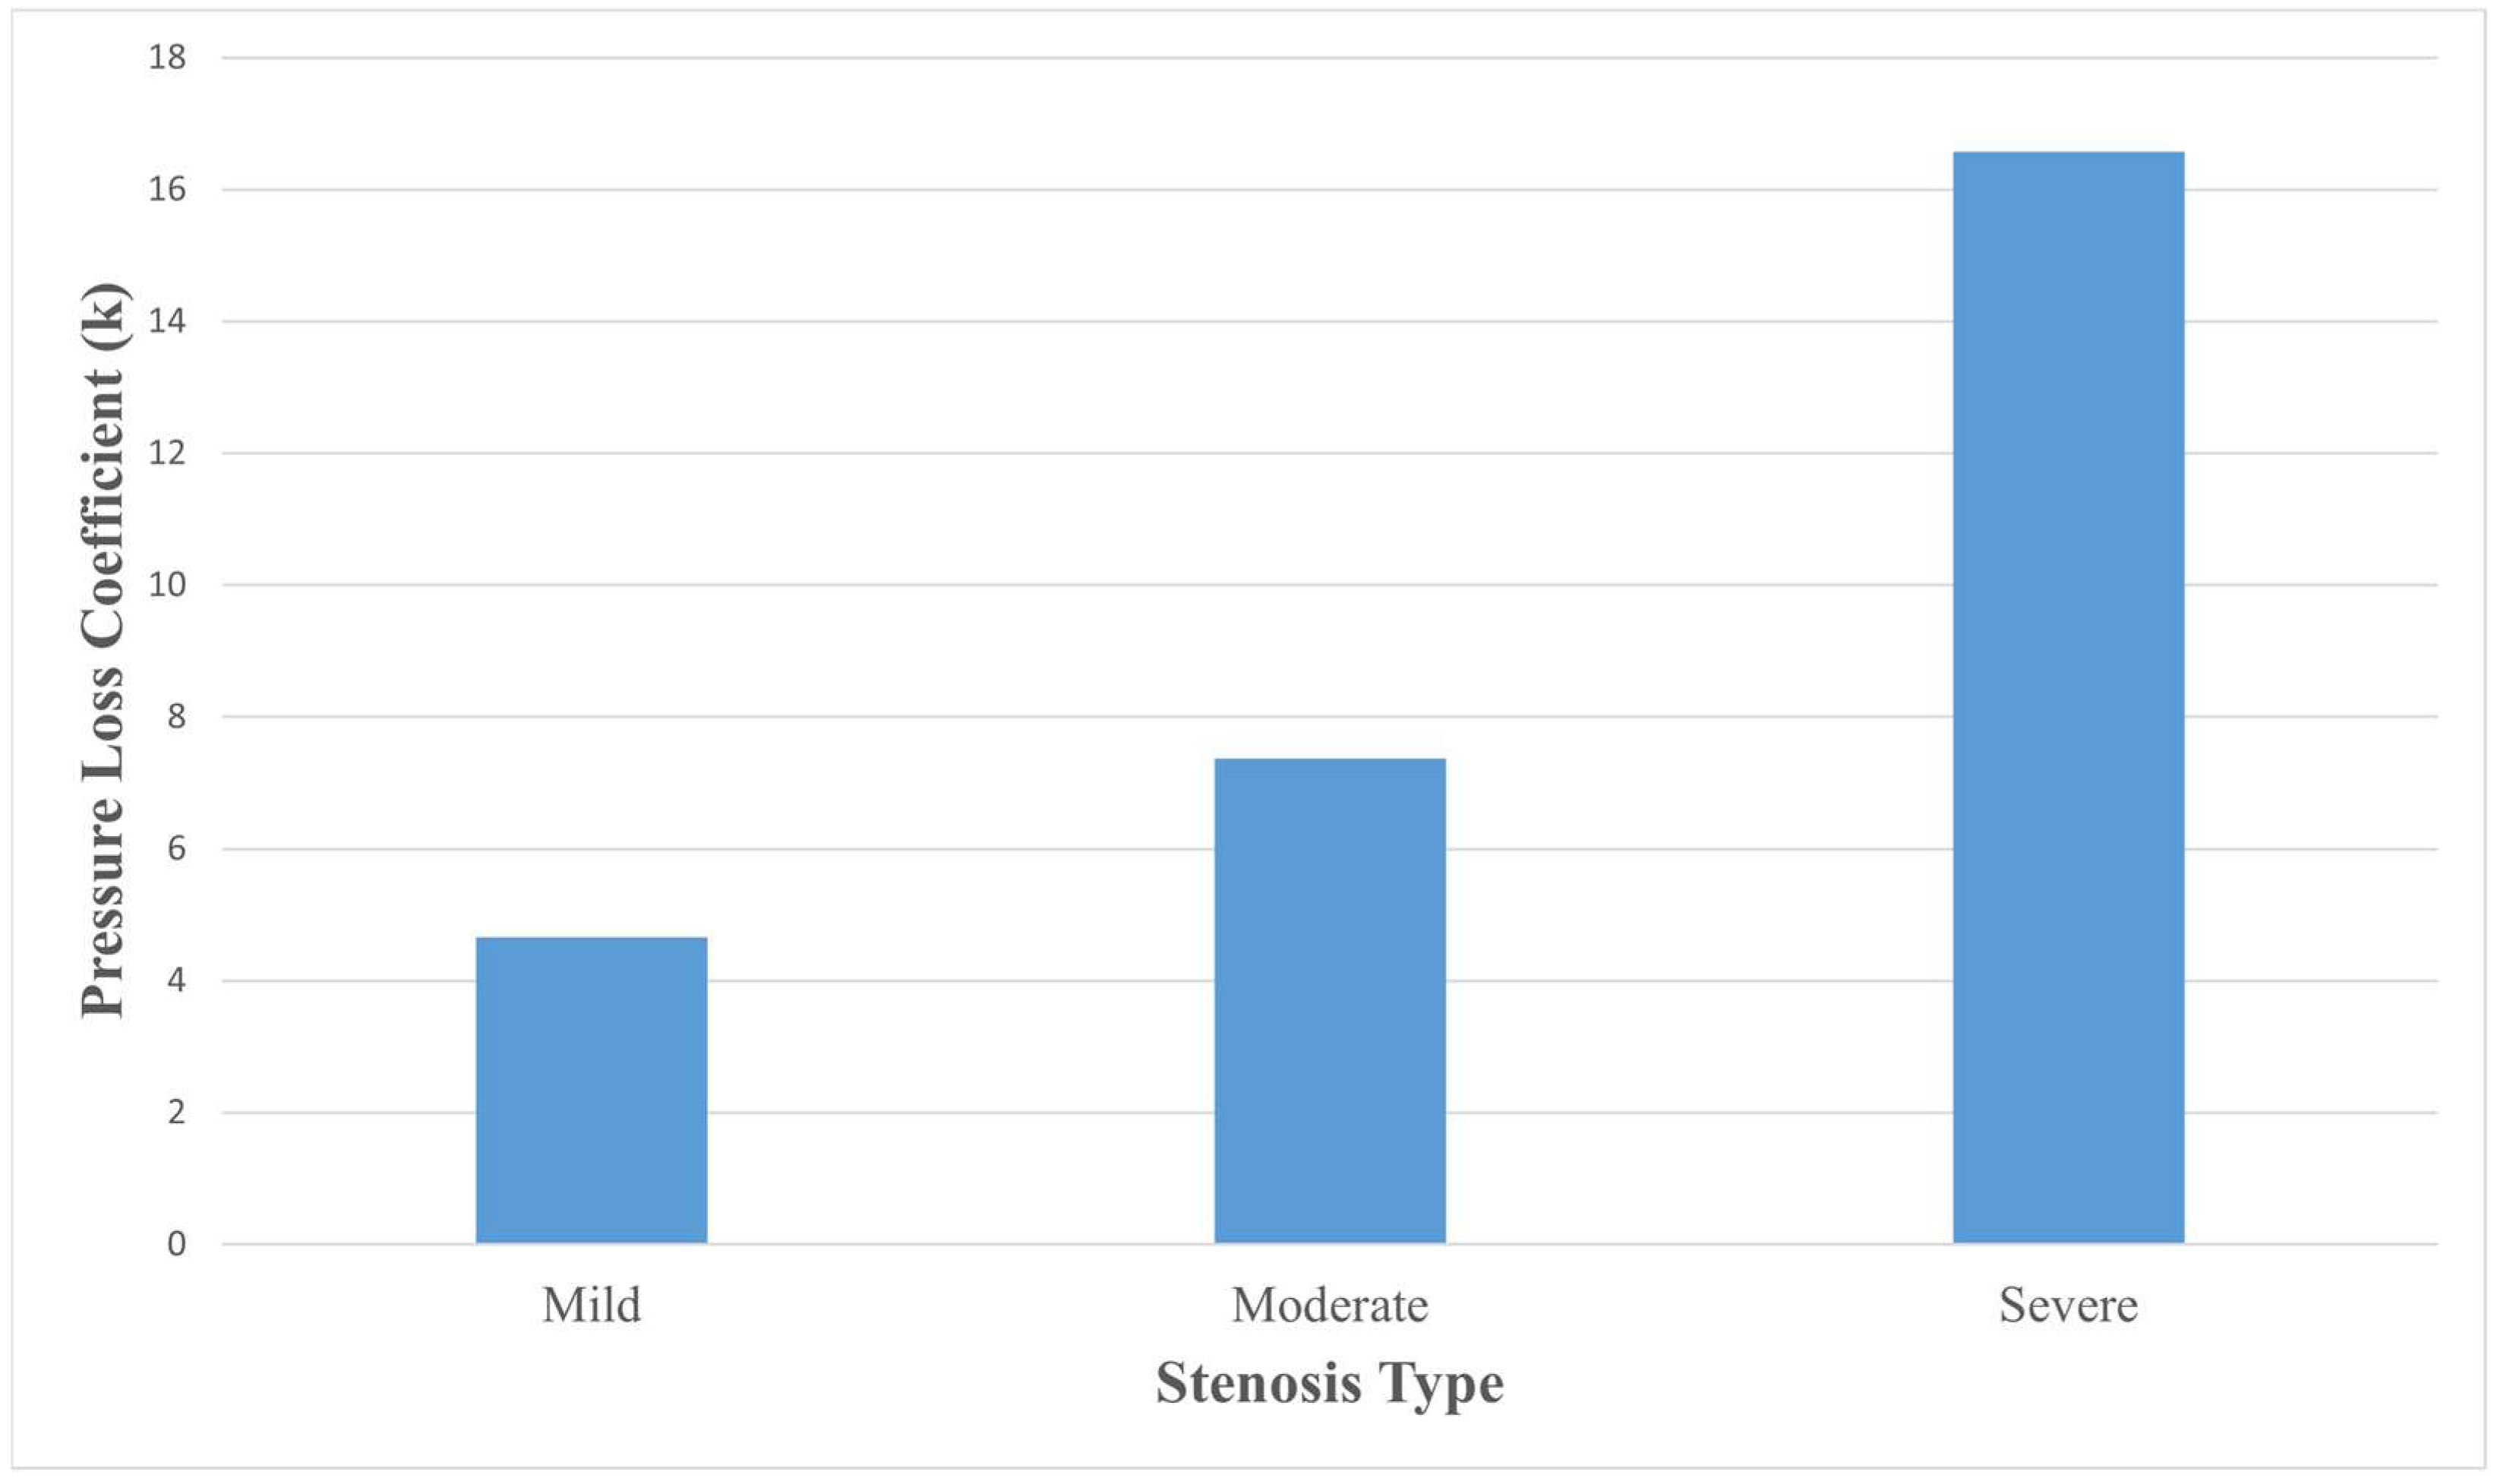
Figure 6 shows the pressure loss coefficient across the aorta. As shown in the figure, the pressure loss coefficient was lowest for mild stenosis (4.66) and increased to 7.37 at a moderate level. This indicates the relatively uniformity of velocity and minimum loss of energy in the blood flow. Meanwhile, severe stenosis produced a pressure loss coefficient (K) nearly four times greater than that of mild stenosis, reaching 16.57. Furthermore, in the severe stenosis case, it is noticeable that the high velocity jet impinged on the ascending aorta wall, dissipating a substantial portion of its kinetic energy and thereby contributing to the elevated pressure loss coefficient.

4. Discussion

The results show an uneven distribution of high and low WSS across the ascending aorta aneurysm region. The severity of WSS increases with the increase in the degree of stenosis. Both high and low WSS have been associated with an aneurysm expansion, rupture, and wall degradation. A study conducted on 295 patients with abdominal aortic aneurysm (AAA) found an independent association of low shear stress with both the aneurysm expansion rate and rupture [34]. Boyd et al. suggested a correlation between low WSS and rupture in a study of seven patients with AAA [35]. Similarly, Parker et al. found that rupture occurred at low shear stress locations in common iliac artery locations [36]. Although the result of AAA does not necessarily extend to ascending aneurysm, their rupture can be modeled similarly with the concept of biomechanical failure [20]. By this concept, rupture or dissection will occur when peak wall shear stress reaches the maximum stress or strength of a tissue. The risk of rupture is not systematically the highest at the location of peak wall stress. Studies show that ascending aortic regions have non-uniform tissue thickness and regional differences in strength [37,38]. Therefore, dissections can happen at low stress regions where tissue may be weaker because of disturbed hemodynamics [20]. In a study of 98 patients with apparent aortic dissection in the thoracic aorta, Taguchi et al. found that 6% of the patients had an entrance tear at the posterior site of the ascending aorta [39]. They also found that 26% of tears happen at the site of low shear stress across the thoracic aorta.
On the other hand, it is also reported that high WSS has been associated with an increased risk of dissection. In the study conducted by Taguchi et al., 40% of the patients had entrance-tear at the anterior site of the ascending aorta, which is a region with high WSS [39]. Literature on aortic dissection also mentions the anterior region, particularly 2 to 2.5 cm above the aortic root, as a primary location of tear [40,41,42,43]. Although high WSS may not directly result in aortic dissection, the fact that most of the entrance-tear occurs at the region with the highest WSS indicates a correlation between high WSS and aortic dissection. The results of this study show that WSS for the severe stenosis case is three times higher than for the mild stenosis case. It can be reasonably concluded that patients with severe stenosis may have a higher risk of dissection compared to patients with mild stenosis.
Increased severity of stenosis had a significant impact on velocity distributions and helicity. The severe case had higher velocity, non-uniform distribution, and significant areas of recirculation. The velocity of the severe case impacts the aorta wall at a higher velocity compared to the other cases, while maintaining the jet shape. This explains the localized high WSS at the outer curvature of the ascending aorta. Meanwhile, the recirculation zones at the inner curvature cause low shear stress at those locations. The combined effects of vessel curvature structure and the bulging aneurysmal geometry under various stenosis may contribute to abnormal helical flow in the ascending aorta. Helicity analysis further confirmed these alterations, revealing apparent abnormal flow patterns in the presence of severe stenosis. Meanwhile, Boyd et al. also found that rupture occurred in recirculating, low velocity areas, in both CFD simulation and Computed Tomography Angiography (CTA) [35].
Additionally, the pressure loss coefficient significantly increases in the case of severe stenosis, indicating the presence of turbulence. This can be a crucial indicator of risk for patients. Gulan et al. suggested that energy loss or pressure loss can be a complementary indicator for assessing the severity of ascending aortic aneurysm [44]. Chung et al. [45] in a study of 41 ascending aortas, found that for the same size of aorta, the ones with greater energy loss showed significant medial degeneration compared to their counterparts. Medial degeneration is characterized by breakdown of the normal structure of the aorta wall, which makes it prone to dilation and other complications [46].
It is important to note that the current study was based on a single patient-specific aortic aneurysm geometry. To accurately characterize the effect of stenosis on a wider population, large-scale studies with diverse patient datasets are necessary. While this investigation focuses exclusively on the aortic hemodynamics at peak systole, to gain a further understanding of fluid dynamics, pulsatile flow conditions should be utilized. Moreover, a plug velocity profile is prescribed at the inlet to simplify the simulation procedure, ignoring the swirling flow condition that has been observed in several arteries [47]. Valve leaflets were replaced by simplified orifices to reduce the complexity of the geometry and computational costs. Similarly, the elasticity of the arterial vessel is ignored and considered rigid. To capture more physiologically accurate hemodynamics, future studies can employ a fluid–structure interaction (FSI) model considering the elasticity and motion of valve leaflets, alongside the pulsatile inlet condition of aortic flow. Nevertheless, exploring additional patient-specific geometries together with physiologically relevant boundary conditions may help to further substantiate the findings presented in this study.

5. Conclusions

This study analyzed the hemodynamic impact of varying degrees of stenosis in the ascending aorta using patient-specific geometry and a CFD model. The results showed significant hemodynamic alterations in the severe stenosis case, which had a pronounced jet core with high velocity and significant recirculation at the posterior. The elevated pressure loss coefficient in the severe case indicates greater energy dissipation and flow nonuniformity. The severe case also showed high WSS at the anterior, where the jet impacted upon the ascending aorta. Patients’ case studies show most entry tears of dissection occur at high WSS locations, which points to a correlation between high WSS and risk of dissection. In addition, the severe stenosis induces pronounced helicity fluctuations and recirculation, while mild and moderate cases exhibit more uniform helicity distributions. Therefore, these findings suggest an increased risk of dissection or rupture in patients with severe stenosis compared to those with mild or moderate stenosis. This study highlights the importance of stenosis severity as a critical parameter in assessing the risk of aneurysm rupture.

Author Contributions

A.B.M.N.S.N. worked on the outline, conducted the CFD simulation, and wrote the initial draft. M.M.N. revised the simulation and helped to write the initial draft and revise the introduction and discussion of the draft. The research topic was developed by R.Z. And R.Z. provided critical revisions and supervision, and contributed to the writing, review, and editing. All authors have read and agreed to the published version of the manuscript.

Funding

This work is supported by the Spring 2024 Early Innovation Fund Program, University of Minnesota.

Data Availability Statement

The original contributions presented in this study are included in this article. Further inquiries can be directed to the corresponding author upon reasonable request.

Conflicts of Interest

The authors declare no conflicts of interest.

Abbreviations

The following abbreviations are used in this manuscript:
CFDComputational fluid dynamics
WSSWall shear stress
ASAortic stenosis
AAAAbdominal aortic aneurysm
CTAComputed Tomography Angiography

References

  1. Standring, S.; Ellis, H.; Healy, J.; Johnson, D.; Williams, A.; Collins, P.; Wigley, C. Gray’s Anatomy: The Anatomical Basis of Clinical Practice. Am. J. Neuroradiol. 2005, 26, 2703. [Google Scholar]
  2. Juang, D.; Braverman, A.C.; Eagle, K. Aortic Dissection. Circulation 2008, 118, e507–e510. [Google Scholar] [CrossRef] [PubMed]
  3. Deplano, V.; Boufi, M.; Gariboldi, V.; Loundou, A.D.; D’Journo, X.B.; Cautela, J.; Djemli, A.; Alimi, Y.S. Mechanical Characterisation of Human Ascending Aorta Dissection. J. Biomech. 2019, 94, 138–146. [Google Scholar] [CrossRef] [PubMed]
  4. Bonow, R.O.; Mann, D.L.; Zipes, D.P.; Libby, P. Braunwald’s Heart Disease e-Book: A Textbook of Cardiovascular Medicine; Elsevier: Amsterdam, The Netherlands, 2011; ISBN 1437727700. [Google Scholar]
  5. Pape, L.A.; Tsai, T.T.; Isselbacher, E.M.; Oh, J.K.; O’Gara, P.T.; Evangelista, A.; Fattori, R.; Meinhardt, G.; Trimarchi, S.; Bossone, E.; et al. Aortic Diameter ≥5.5 cm Is Not a Good Predictor of Type A Aortic Dissection: Observations from the International Registry of Acute Aortic Dissection (IRAD). Circulation 2007, 116, 1120–1127. [Google Scholar] [CrossRef]
  6. Erbel, R.; Eggebrecht, H. Aortic Dimensions and the Risk of Dissection. Heart 2006, 92, 137–142. [Google Scholar] [CrossRef]
  7. Condemi, F.; Campisi, S.; Viallon, M.; Troalen, T.; Xuexin, G.; Barker, A.J.; Markl, M.; Croisille, P.; Trabelsi, O.; Cavinato, C.; et al. Fluid- and Biomechanical Analysis of Ascending Thoracic Aorta Aneurysm with Concomitant Aortic Insufficiency. Ann. Biomed. Eng. 2017, 45, 2921–2932. [Google Scholar] [CrossRef] [PubMed]
  8. Erwin, J.P.; Cibotti-Sun, M.; Elma, M.A. 2022 Aortic Disease Guideline-at-a-Glance. J. Am. Coll. Cardiol. 2022, 80, 2348–2352. [Google Scholar] [CrossRef]
  9. Chau, K.H.; Elefteriades, J.A. Natural History of Thoracic Aortic Aneurysms: Size Matters, plus Moving beyond Size. Prog. Cardiovasc. Dis. 2013, 56, 74–80. [Google Scholar] [CrossRef]
  10. Tozzi, P.; Gunga, Z.; Niclauss, L.; Delay, D.; Roumy, A.; Pfister, R.; Colombier, S.; Patella, F.; Qanadli, S.D.; Kirsch, M. Type A Aortic Dissection in Aneurysms Having Modelled Pre-Dissection Maximum Diameter below 45 mm: Should We Implement Current Guidelines to Improve the Survival Benefit of Prophylactic Surgery? Eur. J. Cardio-Thorac. Surg. 2021, 59, 473–478. [Google Scholar] [CrossRef]
  11. Eliathamby, D.; Gutierrez, M.; Liu, A.; Ouzounian, M.; Forbes, T.L.; Tan, K.T.; Chung, J. Ascending Aortic Length and Its Association with Type A Aortic Dissection. J. Am. Heart Assoc. 2021, 10, e020140. [Google Scholar] [CrossRef]
  12. Sun, L.; Li, X.; Wang, G.; Sun, J.; Zhang, X.; Chi, H.; Cao, H.; Ma, W.; Yan, Z.; Liu, G. Relationship Between Length and Curvature of Ascending Aorta and Type a Dissection. Front. Cardiovasc. Med. 2022, 9, 927105. [Google Scholar] [CrossRef]
  13. Eliathamby, D.; Keshishi, M.; Ouzounian, M.; Forbes, T.L.; Tan, K.; Simmons, C.A.; Chung, J. Ascending Aortic Geometry and Its Relationship to the Biomechanical Properties of Aortic Tissue. JTCVS Open 2023, 13, 32–44. [Google Scholar] [CrossRef]
  14. Ramanath, V.S.; Oh, J.K.; Sundt III, T.M.; Eagle, K.A. Acute Aortic Syndromes and Thoracic Aortic Aneurysm. Mayo Clin. Proc. 2009, 84, 465–481. [Google Scholar] [CrossRef]
  15. Goody, P.R.; Hosen, M.R.; Christmann, D.; Niepmann, S.T.; Zietzer, A.; Adam, M.; Bönner, F.; Zimmer, S.; Nickenig, G.; Jansen, F. Aortic Valve Stenosis: From Basic Mechanisms to Novel Therapeutic Targets. Arterioscler. Thromb. Vasc. Biol. 2020, 40, 885–900. [Google Scholar] [CrossRef]
  16. Carabello, B.A.; Paulus, W.J. Aortic Stenosis. Lancet 2009, 373, 956–966. [Google Scholar] [CrossRef] [PubMed]
  17. García–Herrera, C.M.; Celentano, D.J.; Herrera, E.A. Modelling and Numerical Simulation of the in Vivo Mechanical Response of the Ascending Aortic Aneurysm in Marfan Syndrome. Med. Biol. Eng. Comput. 2017, 55, 419–428. [Google Scholar] [CrossRef] [PubMed]
  18. Zhang, R.; Zhang, Y. An Experimental Study of Pulsatile Flow in a Compliant Aortic Root Model under Varied Cardiac Outputs. Fluids 2018, 3, 71. [Google Scholar] [CrossRef]
  19. Zhang, Y.; Zhang, R.; Thomas, N.; Ullah, A.H.; Eichholz, B.; Estevadeordal, J.; Suzen, Y.B. Experimental and Computational Study of Pulsatile Flow Characteristics in Romanesque and Gothic Aortic Arch Models. Med. Eng. Phys. 2022, 102, 103784. [Google Scholar] [CrossRef]
  20. Campobasso, R.; Condemi, F.; Viallon, M.; Croisille, P.; Campisi, S.; Avril, S. Evaluation of Peak Wall Stress in an Ascending Thoracic Aortic Aneurysm Using FSI Simulations: Effects of Aortic Stiffness and Peripheral Resistance. Cardiovasc. Eng. Technol. 2018, 9, 707–722. [Google Scholar] [CrossRef] [PubMed]
  21. Simao, M.; Ferreira, J.M.; Tomas, A.C.; Fragata, J.; Ramos, H.M. Aorta Ascending Aneurysm Analysis Using CFD Models towards Possible Anomalies. Fluids 2017, 2, 31. [Google Scholar] [CrossRef]
  22. Petuchova, A.; Maknickas, A. Computational Analysis of Aortic Haemodynamics in the Presence of Ascending Aortic Aneurysm. Technol. Health Care 2022, 30, 187–200. [Google Scholar] [CrossRef]
  23. de Azevedo, F.S.; Almeida, G.d.C.; Alvares de Azevedo, B.; Ibanez Aguilar, I.F.; Azevedo, B.N.; Teixeira, P.S.; Camargo, G.C.; Correia, M.G.; Nieckele, A.O.; Oliveira, G.M.M. Stress Load and Ascending Aortic Aneurysms: An Observational, Longitudinal, Single-Center Study Using Computational Fluid Dynamics. Bioengineering 2024, 11, 204. [Google Scholar] [CrossRef]
  24. Radl, L.; Jin, Y.; Pepe, A.; Li, J.; Gsaxner, C.; Zhao, F.H.; Egger, J. AVT: Multicenter aortic vessel tree CTA dataset collection with ground truth segmentation masks. Data Brief. 2022, 40, 107801. [Google Scholar] [CrossRef]
  25. Cassanova, R.A.; Giddens, D.P. Disorder Distal to Modeled Stenoses in Steady and Pulsatile Flow. J. Biomech. 1978, 11, 441–453. [Google Scholar] [CrossRef]
  26. Zhu, C.; Seo, J.H.; Mittal, R. Computational Modelling and Analysis of Haemodynamics in a Simple Model of Aortic Stenosis. J. Fluid Mech. 2018, 851, 23–49. [Google Scholar] [CrossRef]
  27. Varghese, S.S.; Frankel, S.H.; Fischer, P.F. Direct Numerical Simulation of Stenotic Flows. Part 1. Steady Flow. J. Fluid Mech. 2007, 582, 253–280. [Google Scholar] [CrossRef]
  28. Niu, Y.; Chu, W.; Lee, L.; Yu, H. Numerical Evaluation of Curvature Effects on Shear Stresses Across Arterial Stenoses. Biomed. Eng. Appl. Basis Commun. 2002, 14, 164–170. [Google Scholar] [CrossRef]
  29. Jhun, C.-S.; Newswanger, R.; Cysyk, J.P.; Ponnaluri, S.; Good, B.; Manning, K.B.; Rosenberg, G. Dynamics of Blood Flows in Aortic Stenosis: Mild, Moderate, and Severe. ASAIO J. 2021, 67, 666–674. [Google Scholar] [CrossRef] [PubMed]
  30. Pope, S.B. Turbulent Flows. Meas. Sci. Technol. 2001, 12, 2020–2021. [Google Scholar] [CrossRef]
  31. Dyverfeldt, P.; Trenti, C.; Ziegler, M.; Bjarnegård, N.; Lindenberger, M. Helical Flow in Tortuous Aortas and Its Relationship to Turbulence: A Whole-Aorta 4D Flow MRI Study. Front. Cardiovasc. Med. 2023, 10, 1124604. [Google Scholar] [CrossRef]
  32. Biglino, G.; Cosentino, D.; Steeden, J.A.; De Nova, L.; Castelli, M.; Ntsinjana, H.; Pennati, G.; Taylor, A.M.; Schievano, S. Using 4D Cardiovascular Magnetic Resonance Imaging to Validate Computational Fluid Dynamics: A Case Study. Front. Pediatr. 2015, 3, 107. [Google Scholar] [CrossRef] [PubMed]
  33. Lin, L.; Batista, M.D.; Ferretti, N.M. State-of-the-Art Review on Measurement of Pressure Losses of Fluid Flow Through Pipe Fittings; NIST Technical Note 2206; National Institute of Standards and Technology, U.S. Department of Commerce: Gaithersburg, MD, USA, 2022. [Google Scholar]
  34. Bappoo, N.; Syed, M.B.J.; Khinsoe, G.; Kelsey, L.J.; Forsythe, R.O.; Powell, J.T.; Hoskins, P.R.; McBride, O.M.B.; Norman, P.E.; Jansen, S.; et al. Low Shear Stress at Baseline Predicts Expansion and Aneurysm-Related Events in Patients with Abdominal Aortic Aneurysm. Circ. Cardiovasc. Imaging 2021, 14, e013160. [Google Scholar] [CrossRef]
  35. Boyd, A.J.; Kuhn, D.C.S.; Lozowy, R.J.; Kulbisky, G.P. Low Wall Shear Stress Predominates at Sites of Abdominal Aortic Aneurysm Rupture. J. Vasc. Surg. 2016, 63, 1613–1619. [Google Scholar] [CrossRef]
  36. Parker, L.P.; Powell, J.T.; Kelsey, L.J.; Lim, B.; Ashleigh, R.; Venermo, M.; Koncar, I.; Norman, P.E.; Doyle, B.J. Morphology and Hemodynamics in Isolated Common Iliac Artery Aneurysms Impacts Proximal Aortic Remodeling. Arterioscler. Thromb. Vasc. Biol. 2019, 39, 1125–1136. [Google Scholar] [CrossRef]
  37. Khanafer, K.; Duprey, A.; Zainal, M.; Schlicht, M.; Williams, D.; Berguer, R. Determination of the Elastic Modulus of Ascending Thoracic Aortic Aneurysm at Different Ranges of Pressure Using Uniaxial Tensile Testing. J. Thorac. Cardiovasc. Surg. 2011, 142, 682–686. [Google Scholar] [CrossRef]
  38. Iliopoulos, D.C.; Deveja, R.P.; Kritharis, E.P.; Perrea, D.; Sionis, G.D.; Toutouzas, K.; Stefanadis, C.; Sokolis, D.P. Regional and Directional Variations in the Mechanical Properties of Ascending Thoracic Aortic Aneurysms. Med. Eng. Phys. 2009, 31, 1–9. [Google Scholar] [CrossRef]
  39. Taguchi, E.; Nishigami, K.; Miyamoto, S.; Sakamoto, T.; Nakao, K. Impact of Shear Stress and Atherosclerosis on Entrance-Tear Formation in Patients with Acute Aortic Syndromes. Heart Vessel. 2014, 29, 78–82. [Google Scholar] [CrossRef] [PubMed]
  40. Roberts, W.C. Aortic Dissection: Anatomy, Consequences, and Causes. Am. Heart J. 1981, 101, 195–214. [Google Scholar] [CrossRef] [PubMed]
  41. Valente, T.; Sica, G.; Bocchini, G.; Romano, F.; Lassandro, F.; Rea, G.; Muto, E.; Pinto, A.; Iacobellis, F.; Crivelli, P.; et al. MDCT Imaging of Non-Traumatic Thoracic Aortic Emergencies and Its Impact on Diagnosis and Management—A Reappraisal. Tomography 2022, 8, 200–228. [Google Scholar] [CrossRef]
  42. O’Gara, P.T.; DeSanctis, R.W. Acute Aortic Dissection and Its Variants. Circulation 1995, 92, 1376–1378. [Google Scholar] [CrossRef]
  43. Levy, D.; Sharma, S.; Farci, F.; Le, J. Aortic Dissection; StatPearls: St. Petersburg, FL, USA, 2024. [Google Scholar]
  44. Gülan, U.; Calen, C.; Duru, F.; Holzner, M. Blood Flow Patterns and Pressure Loss in the Ascending Aorta: A Comparative Study on Physiological and Aneurysmal Conditions. J. Biomech. 2018, 76, 152–159. [Google Scholar] [CrossRef] [PubMed]
  45. Chung, J.; Lachapelle, K.; Wener, E.; Cartier, R.; De Varennes, B.; Fraser, R.; Leask, R.L. Energy Loss, a Novel Biomechanical Parameter, Correlates with Aortic Aneurysm Size and Histopathologic Findings. J. Thorac. Cardiovasc. Surg. 2014, 148, 1082–1089. [Google Scholar] [CrossRef] [PubMed]
  46. Isselbacher, E.M. Thoracic and Abdominal Aortic Aneurysms. Circulation 2005, 111, 816–828. [Google Scholar] [CrossRef] [PubMed]
  47. Ha, H.; Lee, S.J. Effect of Pulsatile Swirling Flow on Stenosed Arterial Blood Flow. Med. Eng. Phys. 2014, 36, 1106–1114. [Google Scholar] [CrossRef]
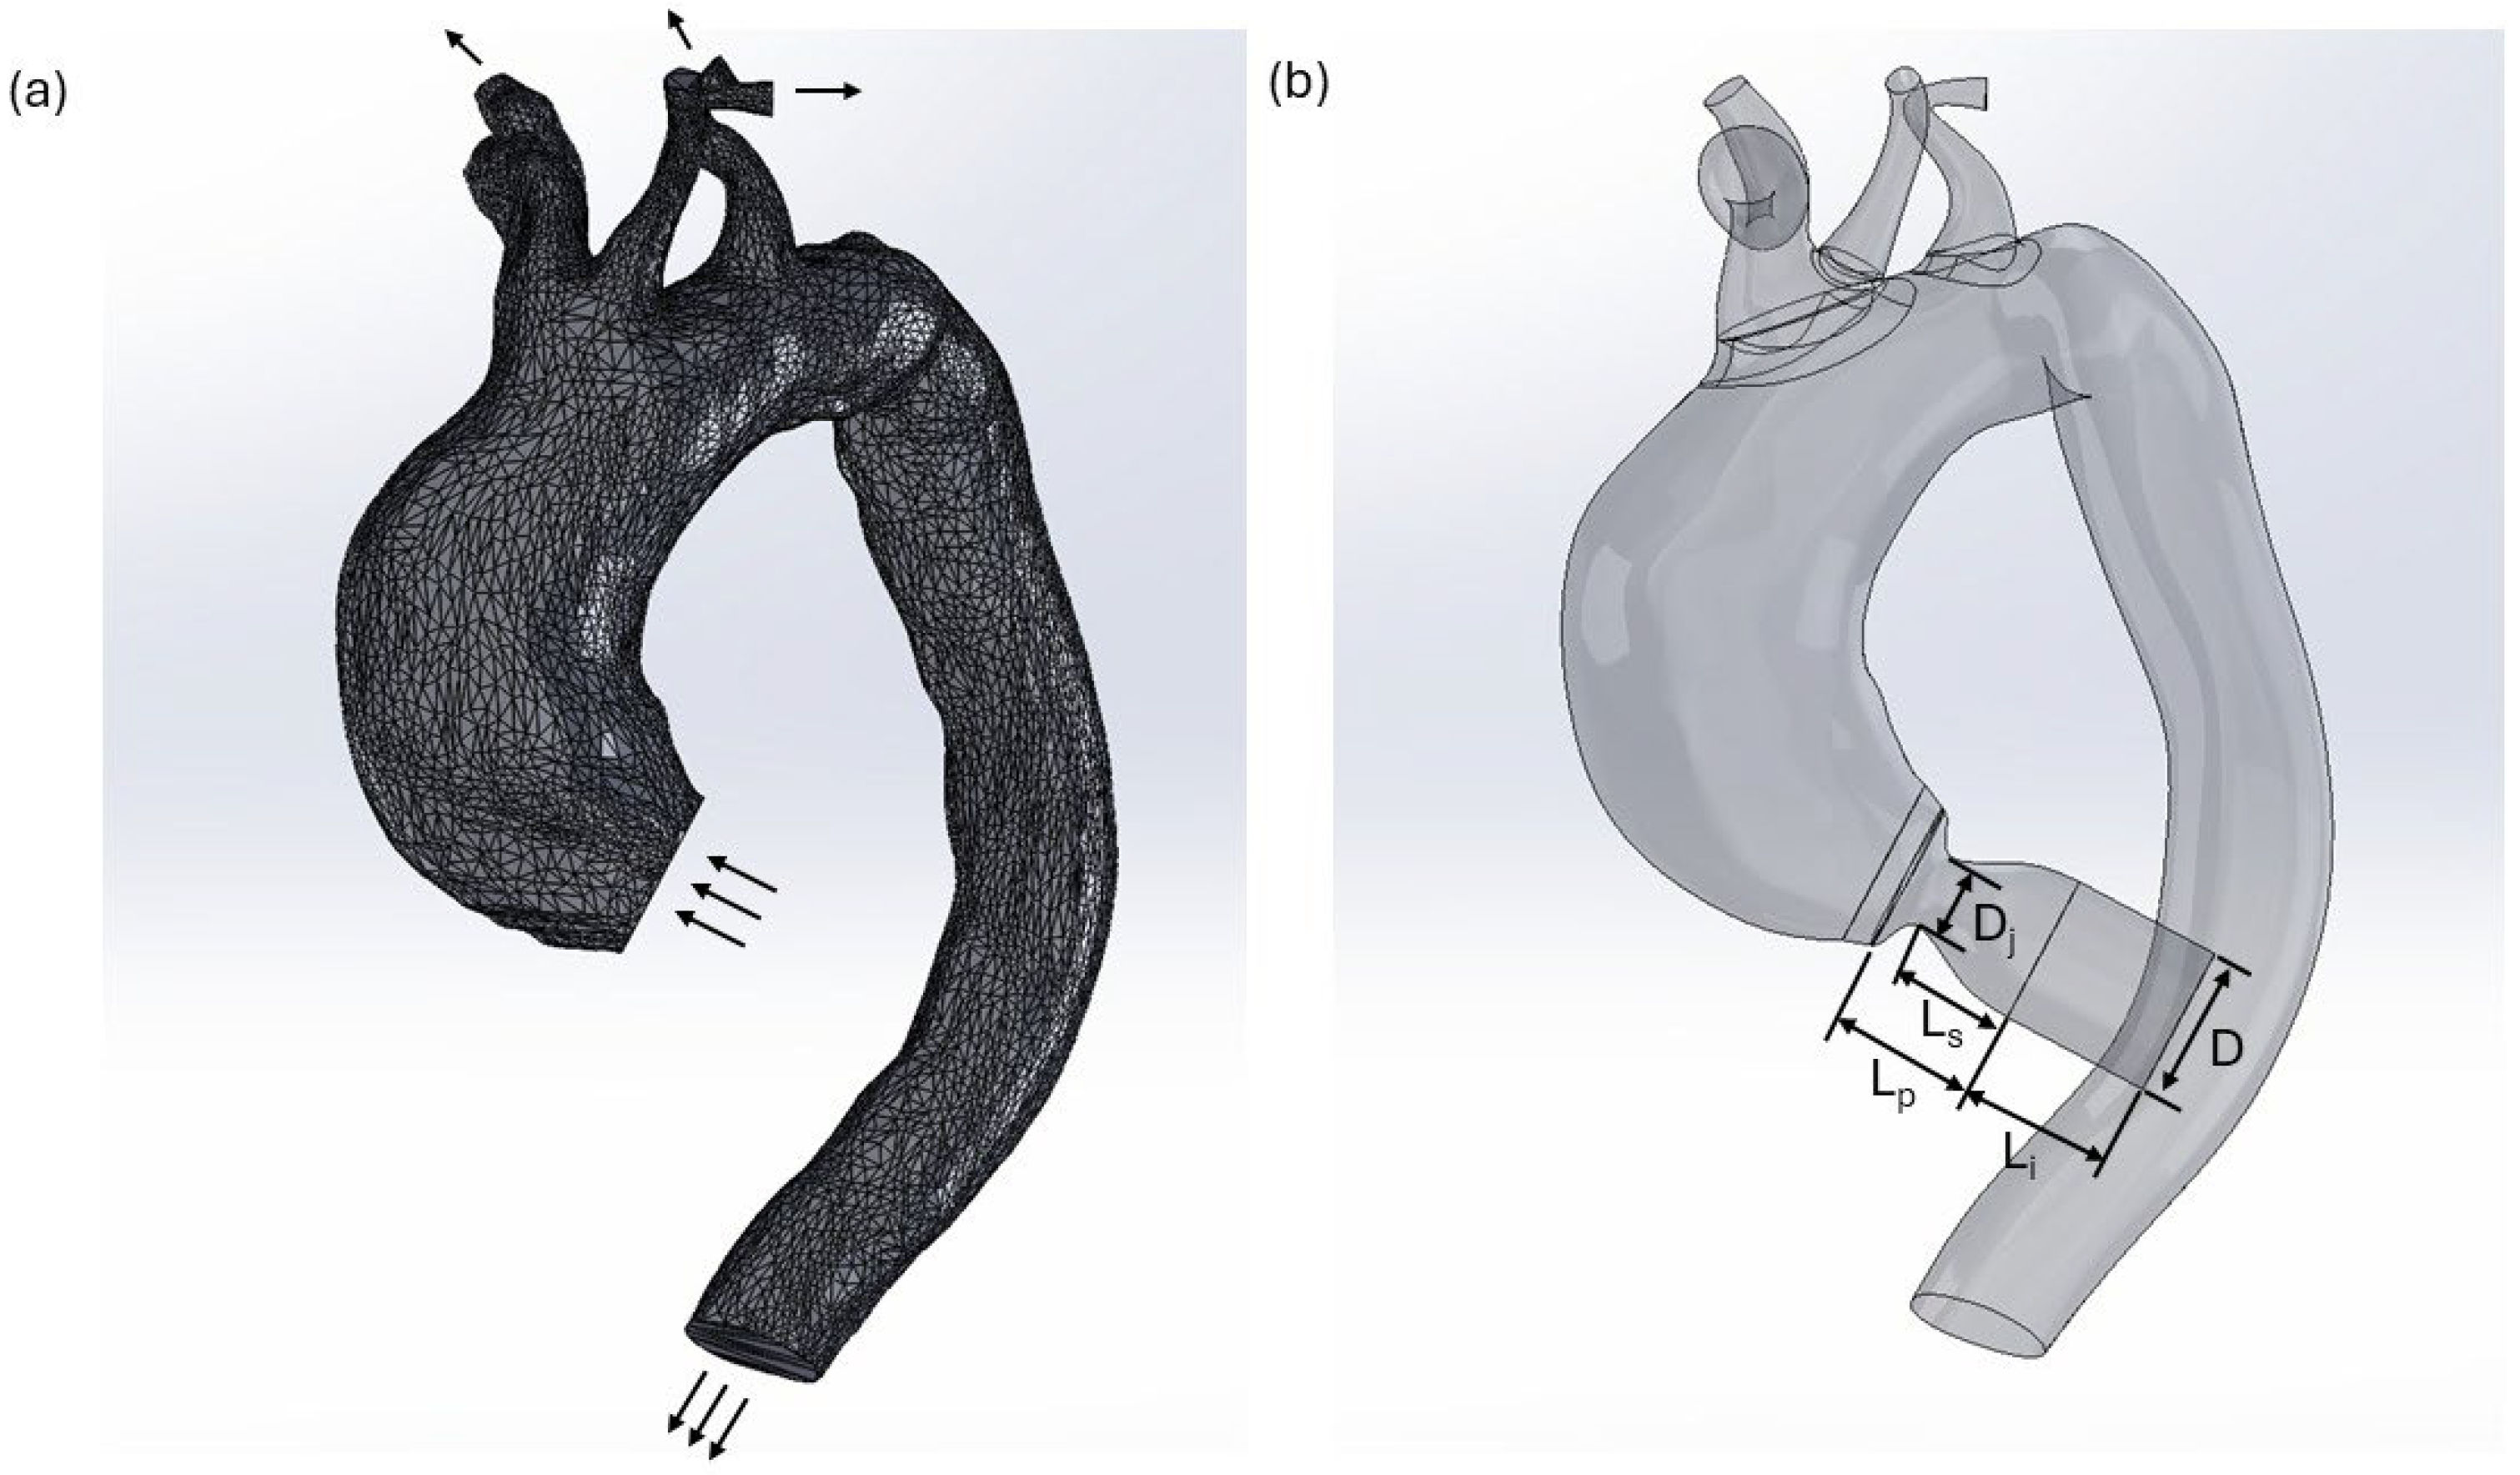
Figure 1. (a) Patient-specific geometry in STL format, (b) Reconstructed model with added aortic stenotic geometry. Here, D = Diameter of inlet, Dj = minimum diameter of stenosis, Li = Lp = 1 D, Ls = 0.8 D. The arrows denote the inlet and outlet of the fluid flow, respectively.
Jvd 04 00038 g001
Figure 2. Velocity Streamline in (a) severe, (b) moderate, (c) mild cases. The arrows represent areas with high recirculation.
Jvd 04 00038 g002
Figure 3. Flow progression inside the ascending aorta for mild, moderate, and severe stenosis. Seven planes (ag) were selected at 15° intervals from the sinotubular junction to the origin of the brachiocephalic artery.
Jvd 04 00038 g003
Figure 4. Absolute normalized helicity in the ascending aorta with aneurysm for mild, moderate, and severe aortic valve stenosis. Seven planes (ag) were selected at 15° intervals from the sinotubular junction to the origin of the brachiocephalic artery.
Jvd 04 00038 g004
Figure 5. Wall Shear Stress (Pa) at the ascending aorta region, with different aortic valve stenosis—severe, moderate, and mild (from left to right).
Jvd 04 00038 g005
Figure 6. Pressure loss coefficient at the aorta for different degrees of stenosis.
Jvd 04 00038 g006
Table 1. Mesh Sensitivity Analysis based on area weighted average of WSS at the stenosis wall.
Cell Count (Millions)WSS (Pa)Changes (% Difference)
0.5535.651.48
1.015.5660.32
1.765.5480.25
3.35.534-
Disclaimer/Publisher’s Note: The statements, opinions and data contained in all publications are solely those of the individual author(s) and contributor(s) and not of MDPI and/or the editor(s). MDPI and/or the editor(s) disclaim responsibility for any injury to people or property resulting from any ideas, methods, instructions or products referred to in the content.