Abstract
This study investigates how the Federal Open Market Committee’s (FOMC) statements impact healthcare spending, mental health trends, and stock performance in healthcare and tech sectors By analyzing FOMC’s sentiment from 2018 to 2024, we found that higher sentiment correlates with increased depressive disorders (2019–2021) and tech stock returns, especially for the “Magnificent Seven” (like Apple and Amazon). Although healthcare stocks showed weaker ties to sentiment, Granger causality tests suggest some influence, hinting at ways to adjust stock strategies based on FOMC trends. These results highlight how central bank communication can shape both mental health dynamics and investment decisions in healthcare and technology.
1. Introduction
Economic policies significantly influence public health outcomes, a topic of increasing interest among researchers and policymakers. Social, economic, and environmental policies shape public health by impacting wages, benefits, taxes, education, housing, transportation, climate policies, and other aspects of daily life [1]. These ripple effects can affect healthcare costs, life expectancy, and overall well-being. Policies that prioritize economic stability and equity can save lives and prevent disease, while adverse policies may lead to premature deaths and increased healthcare expenses. For example, Ref [2] highlights how health shocks can profoundly affect household wealth through increased medical expenses, reduced earnings, and changes in life expectancy. This underscores the intricate relationship between economic stability and health, emphasizing the importance of policies that address both domains.
The Federal Open Market Committee (FOMC) plays a central role in setting U.S. monetary policies and communicates its decisions through official statements. These statements significantly influence market expectations and behaviors across various economic sectors. While the financial and economic impacts of FOMC’s statements are well documented, their broader implications for public and mental health remain underexplored.
Existing research shows that FOMC’s statements can significantly affect asset prices, particularly longer-term treasury yields, underscoring their pivotal role in market dynamics [3]. This study seeks to extend this understanding by exploring how FOMC’s statements influence the public and mental health using sentiment analysis. Sentiment analysis identifies the sentiments or emotions expressed in textual data, classifying them as positive, negative, or more nuanced emotions like joy or fear [4]. Advanced AI models, such as transformer-based techniques, have enhanced sentiment analysis by capturing subtle language details that older methods often overlooked [5]. These advancements enable a more effective analysis of complex financial texts, providing insights into how language reflects broader economic and social trends [6].
Additionally, research demonstrates that transformer models can be adapted for targeted financial sentiment analysis across various languages and markets [7]. This flexibility supports their application in analyzing FOMC’s statements to understand public and market reactions. By applying sentiment analysis to FOMC’s statements, this study examines how their sentiment correlates with public health spending and mental health incidence data sourced from federal government websites. This approach allows us to investigate how monetary policy communication may impact public concerns, such as safety and mental health.
This study is further motivated by the significant mental health challenges posed by the COVID-19 pandemic, during which the World Health Organization (WHO) reported a 25% global increase in anxiety and depression rates [8]. Given the Federal Reserve’s aggressive monetary policies during this time, we hypothesize that the sentiment in FOMC’s statements may correlate with changes in mental health metrics, such as a reduction in depressive disorders. By analyzing FOMC’s statements from 2019 to 2024, a period encompassing the pandemic and its aftermath, we aim to uncover the broader impacts of monetary policy communication on public health. Advances in natural language processing (NLP) allow for a deeper understanding of subtle tonal shifts, providing insights into how monetary policies influence public health outcomes beyond short-term economic effects [5].
The structure of this paper is as follows. Section 2 explains the significance of the FOMC and the importance of the sentiment index. Section 3 outlines the theoretical methodology used in the study. Section 4 presents the data sources and empirical analysis. Section 5 describes the application of linear regression and correlation tests, including Pearson, Kendall, and Spearman methods. Section 6 examines the relationship between the monthly log returns of the “Magnificent Seven” technology companies and medical companies with the sentiment index, using linear Granger causality analysis. Section 7 summarizes the contributions, limitations, and future directions of the research. Finally, Section 8 concludes with a comprehensive discussion of the study’s findings and methodologies.
2. Why FOMC’s Statements and Their Sentiment Index Matter
Some might question the value of analyzing the sentiment index derived from FOMC’s statements, arguing that focus should only be on extreme monetary policies. However, FOMC’s statements are critical not only because they reflect past economic conditions, but also because they offer forward-looking guidance. This guidance helps market participants anticipate how the Federal Reserve plans to address future developments. By analyzing the sentiment of these statements over time, we gain insights into whether the Fed is proactively addressing economic changes and the significance of its responses compared to other factors.
Sentiment analysis identifies the polarity of text, classifying it as positive, negative, or neutral. In this study, a “positive” sentiment refers to language in FOMC’s statements that conveys optimism about economic conditions, such as confidence in recovery or indications of monetary tightening. Conversely, a “negative” sentiment reflects caution or concern, suggesting potential monetary easing or a more guarded economic outlook. To quantify these trends, we use a sentiment index that aggregates the proportions of positive and negative sentiments derived from text processed by the DistilBERT model. This index provides a comprehensive measure of the Federal Reserve’s communicated stance over time.
The sentiment index simplifies the complexity of FOMC’s communications, offering a unique perspective on trends and shifts in tone that may correlate with significant policy actions. It also serves as a tool for understanding the influence of these communications on economic behavior. This study aims to address the following research question: Does the sentiment expressed in FOMC’s statements influence stock market performance and healthcare trends? We hypothesize that sentiment indices derived from these statements will show significant correlations with changes in stock prices and public health metrics. By integrating sentiment scores from the DistilBERT model with psychological disorder metrics, our research provides a novel framework for evaluating the broader economic and social impacts of Federal Reserve’s communications.
The Importance of Sentiment in FOMC’s Statements
Several factors highlight the relevance of sentiment analysis for FOMC’s statements.
Forward guidance:
FOMC’s statements provide forward-looking information that shapes market expectations and behavior. This guidance influences key economic activities such as spending, investment, and saving decisions by businesses and consumers.
Market interpretation:
While economic data are publicly available, the FOMC’s interpretation and presentation of these data add valuable context. The sentiment expressed in these statements reflects the central bank’s perspective on current and future economic conditions, shaping market sentiment and influencing actions.
Policy signals:
The tone and language of FOMC’s statements signal policy intentions, such as potential monetary tightening or easing. These signals affect financial markets, including interest rates, stock prices, and other key variables [9].
Modern sentiment analysis:
In today’s fast-paced, technology-driven environment, sentiment analysis of textual data (e.g., Twitter, Weibo) is widely used to gauge public mood and reactions. Applying these techniques to FOMC’s statements offers insights into the Federal Reserve’s outlook—whether optimistic or cautious—and makes monetary policy more accessible to the general public. This methodology mirrors its success in corporate contexts, where sentiment analysis of earning calls helps investors evaluate a company’s future performance based on executives’ tone and language [10]. Similarly, analyzing FOMC’s statements provides a window into how these communications influence both market behavior and public perception.
Research also highlights the role of emotional factors in investment decision-making during uncertain times, such as the COVID-19 pandemic’s effect on the Bursa Malaysia stock market [11]. This underscores the significance of sentiment analysis in understanding market behavior under varying conditions, reinforcing the importance of studying central bank communications.
Why sentiment matters beyond the financial elite:
Some may argue that this type of analysis has little relevance to the general public, given their limited understanding of economic policies. However, this is precisely why the sentiment index is valuable—it provides a simplified view of the Federal Reserve’s stance, making it easier for the public to interpret and respond to economic changes. While significant market reactions often occur due to unexpected policy “shocks” based on private information, the regular sentiment conveyed in FOMC’s statements also plays a vital role.
Incremental information:
Every FOMC’s statement, even without major policy shifts, contributes incremental data that shape market expectations. Over time, these minor adjustments can lead to significant shifts in market sentiment and behavior.
Cumulative Impact:
The cumulative effect of consistent communication, such as persistent concerns about inflation, can gradually shift both market expectations and economic behavior.
Public communication strategy:
FOMC’s statements are part of a broader communication strategy designed to manage expectations and guide economic outcomes. By analyzing the sentiment of these statements, we gain insights into the effectiveness of this strategy and its impact on the economy.
While deriving precise policy shocks from FOMC’s statements is complex and requires refined methods, analyzing the general sentiment offers valuable insights into the Federal Reserve’s communication strategy and its influence on market expectations. The sentiment expressed in FOMC’s statements plays a critical role in shaping public and market perceptions, even in the absence of unexpected policy changes.
3. Methodology Session
3.1. Transformer Model for Sentiment Analysis
The transformer model, specifically DistilBERT, was chosen for this study due to its ability to process large, complex text data with exceptional accuracy and efficiency. FOMC’s statements often contain highly nuanced and technical language, requiring a model capable of capturing contextual relationships between words. Unlike traditional methods such as RNNs or CNNs, transformer models utilize self-attention mechanisms, enabling them to understand long-term dependencies within the text [12]. Furthermore, DistilBERT’s streamlined architecture offers a computationally efficient alternative without significant loss in performance, making it well-suited for analyzing sentiment in extensive corpora of FOMC’s statements [13]. The ability to quantify sentiment with precision is critical for developing indices that reflect the tone of monetary policies, providing a solid foundation for subsequent analyses involving healthcare and financial metrics.
This section details the use of transformer models for deriving a sentiment index from FOMC’s statements. The analysis employs the DistilBERT model to transform these documents into sentiment scores, which are then analyzed in conjunction with medical spending and psychological disorder metrics over the same period.
3.1.1. Model Description
The transformer model, introduced by [12] in “Attention Is All You Need”, revolutionized sequence-to-sequence tasks by using self-attention mechanisms rather than relying on recurrent neural networks (RNNs) or convolutional neural networks (CNNs). The model comprises an encoder and a decoder: the encoder processes input sequences into hidden states, while the decoder generates output sequences by attending to these hidden states. Transformers offer parallel processing capabilities, enabling efficient training and a superior performance across various natural language processing (NLP) tasks. This study utilizes the DistilBERT model, a distilled version of BERT, known for its efficiency and competitive performance [14].
3.1.2. Data Preparation and Preprocessing
To extract text from FOMC’s PDF files, we utilized the pdfplumber library. The pre-trained sentiment analysis model, distilbert-base-uncased-emotion, was then applied to analyze the text. The text was divided into manageable chunks to fit the model’s processing capabilities. Each chunk was analyzed using the sentiment analysis pipeline provided by the DistilBERT model. The results were aggregated to determine the overall sentiment distribution of the FOMC’s statements.
3.1.3. Constructing the Transformer Model
Initially, it was crucial to import the necessary libraries. This study employed pandas for data loading and preprocessing using the DistilBERT model [14].
The distilbert-base-uncased-emotion model is fine-tuned for detecting emotions in text, such as sadness, happiness, love, anger, fear, and surprise. Several advantages make this model particularly well-suited for this study:
Efficiency: DistilBERT is a smaller, faster, and cheaper version of BERT, with 40% fewer parameters and a 60% faster performance, while retaining over 95% of BERT’s performance on the GLUE benchmark [14].
Accuracy: despite its smaller size, DistilBERT maintains high accuracy and efficiency, making it ideal for real-time applications and large-scale data processing.
Simplified data preparation: DistilBERT simplifies data preparation by handling tasks such as case transformation, punctuation removal, and stop word removal, ensuring consistency across text inputs.
These characteristics make DistilBERT particularly suitable for analyzing a large corpus of FOMC’s statements in a single language [14].
3.1.4. Visualizing Sentiment Analysis Results
The distribution of sentiment categories was visualized using a line graph. The sample output illustrates the distribution of sentiments in the analyzed FOMC’s statements.
This methodology provides a comprehensive approach to sentiment analysis using transformer models, offering insights into the Federal Reserve’s monetary policy sentiments. For readers interested in the detailed implementation, the code can be accessed via the provided GitHub repository.
3.2. Linear Granger Causality Test Analysis
The linear Granger causality test was employed to explore the temporal relationships between the sentiment index derived from FOMC’s statements and key metrics such as healthcare spending and stock returns. This method was selected because it extends beyond simple correlations to identify whether one variable can predict another over time, aligning with the study’s objective of uncovering directional influences [15]. In this context, it was critical to determine whether changes in FOMC’s sentiment could causally influence economic and health-related outcomes. The Granger test’s ability to handle stationary time series data and capture short-term predictive dynamics makes it particularly well-suited for this analysis [16]. By utilizing this robust econometric tool, the study provides actionable insights into how monetary policy sentiment shapes financial markets and societal trends, contributing to policymaking and investment strategies.
Granger’s concept of causality, proposed by [17], is based on the ability of past values of one time series Yt to predict future values of another series Xt. Importantly, this concept focuses on predictability rather than direct causal mechanisms, indicating that past values of Yt contain useful information for forecasting Xt.
In our study, we employed the Granger causality test to examine the relationship between the FOMC’s sentiment index and stock log returns. The Granger test is particularly effective for analyzing short-term predictive relationships, aligning well with our research focus on the impact of FOMC’s sentiment within a two-month window before and after meetings. While alternative approaches such as GARCH models or error correction models (ECMs) have unique strengths—GARCH is ideal for analyzing market volatility patterns [18] and ECMs are suited for studying long-term equilibrium relationships—our objective to explore short-term interdependencies made the Granger causality test the most appropriate choice.
For this analysis, we used 42 FOMC’s statements released between January 2019 and July 2024, sourced from the Federal Reserve’s website (https://www.federalreserve.gov) (accessed on 30 August 2024). First, we used the transformer model outlined in Section 3.1 to derive a sentiment index for each corresponding month using the formula Sentiment Index = (Positive − Negative)/(Positive + Negative) [4]. Next, we incorporated the monthly log returns of the “Magnificent Seven” technology companies and of nine medical companies. The stock data were downloaded from https://www.investing.com/ (accessed on 30 August 2024), and we calculated the monthly log returns for two months before and after each Fed meeting. Finally, we aligned the stock data with the sentiment index and conducted the Granger causality test.
Before applying the Granger causality test, we ensured that all time series data met the stationarity assumption, which is a critical requirement for this analysis. For the sentiment index, we performed an augmented Dickey–Fuller (ADF) test, which confirmed stationarity with the following results:
ADF statistic: −5.134
p-value: 1.197 × 10⁻⁵
Since the ADF statistic was less than the critical value at the 1% significance level, and the p-value was well below 0.05, we rejected the null hypothesis of non-stationarity, confirming that the sentiment index was stationary. The ADF test code and detailed results are available in our GitHub repository.
For stock data, we transformed raw stock prices into monthly log returns, a standard method to achieve stationarity by eliminating trends. These transformations ensured that all input data satisfied the stationarity requirement for a valid Granger causality analysis.
The monthly log returns were calculated as follows.
Two months before the Fed meeting:
Log return two months before = ln(price at the end of the month three months before price/at the end of the month two months before)
Two months after the Fed meeting:
Log return two months after = ln(price at the end of the month one month after/price at the end of the month two months after)
The Granger causality test was then used to examine whether the sentiment index “Granger-causes” the log returns of both the “Magnificent Seven” and the medical stocks before and after FOMC meetings. We also tested the reverse relationship to determine whether stock log returns predict sentiment index changes. For each test, the F-statistic and p-values were recorded to assess statistical significance.
This study aims to determine whether the sentiment index derived from FOMC’s statements “Granger-causes” stock log returns or vice versa. Our assumption is that these variables can influence each other, and the results provide a deeper understanding of the dynamic relationships between monetary policy sentiment, financial markets, and societal outcomes.
4. Data Sources and Data Analysis
We obtained FOMC data from the Federal Reserve for the period spanning from 1 January 2019, to 1 June 2024. Public health expenditure data for the same period were sourced from https://healthdata.gov, while patient data on anxiety and depressive disorders from 2019 to 2021 were obtained from the Substance Abuse and Mental Health Services Administration (SAMHSA).
To ensure compatibility between datasets, monthly health expenditure data were aggregated into quarterly figures, aligning with the quarterly format of the FOMC data. This harmonization allowed for consistent analysis across datasets. Due to the limited availability of mental health patient data, the analysis focused specifically on the 2019–2021 period. During this timeframe, sentiment indices derived from FOMC’s statements were matched with reported cases of two mental health conditions: anxiety disorders and depressive disorders.
This approach enabled a targeted evaluation of how the sentiment expressed in FOMC’s statements correlates with trends in mental health metrics. By aligning sentiment indices with public health and mental health data, the study provides a comprehensive framework for analyzing the broader societal impacts of monetary policy communication.
First, we analyzed the sentiment of each FOMC document using a transformer-based model to calculate the respective negative and positive sentiment indices. The results of this analysis are presented in Figure 1. While the line graph does not reveal a discernible pattern, it consistently shows that the ratio of positive to negative sentiment indices in each statement adds up to 1. Additionally, the fluctuations between statements appear to be erratic, with no clear trend or regularity. To provide further context, we aggregated the positive and negative sentiment indices for all statements from 2019 to 2024 and calculated their averages.
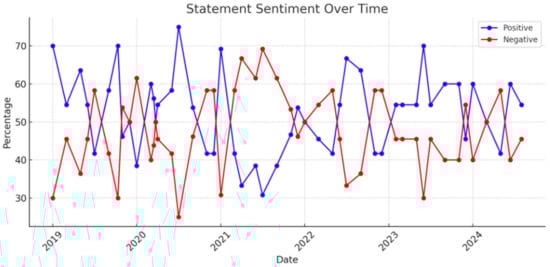
Figure 1.
Statement sentiment over time.
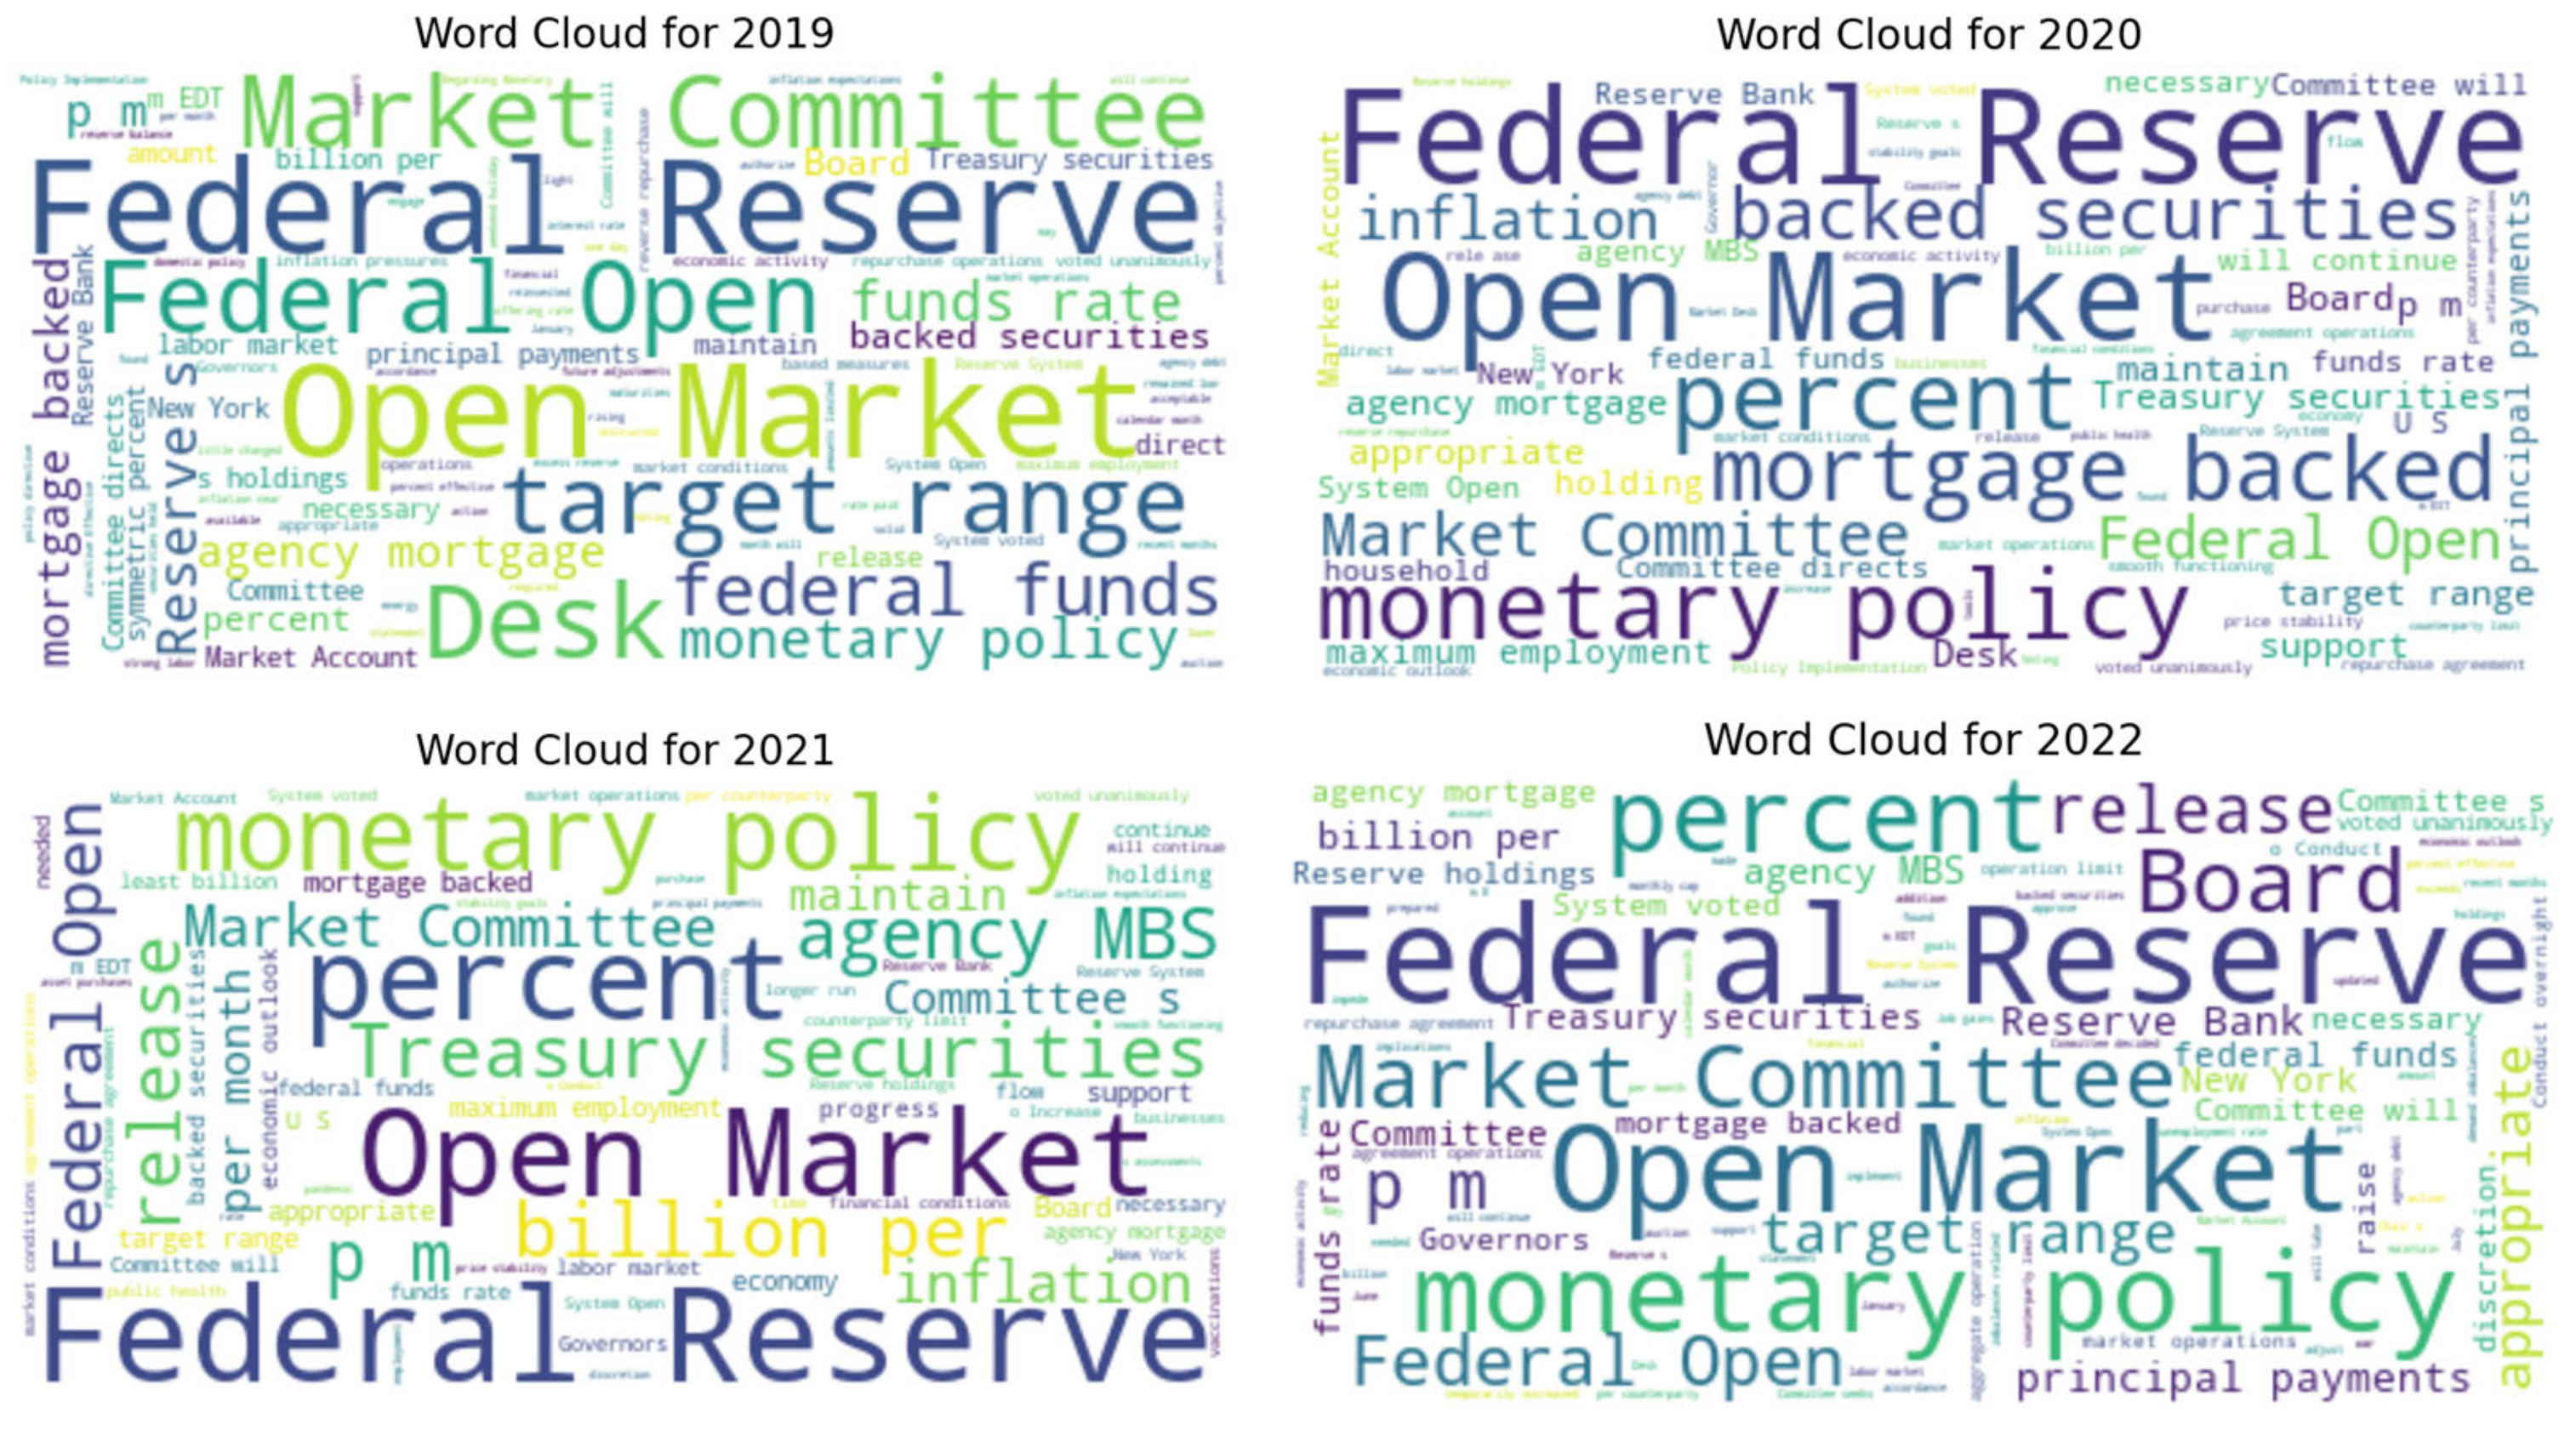
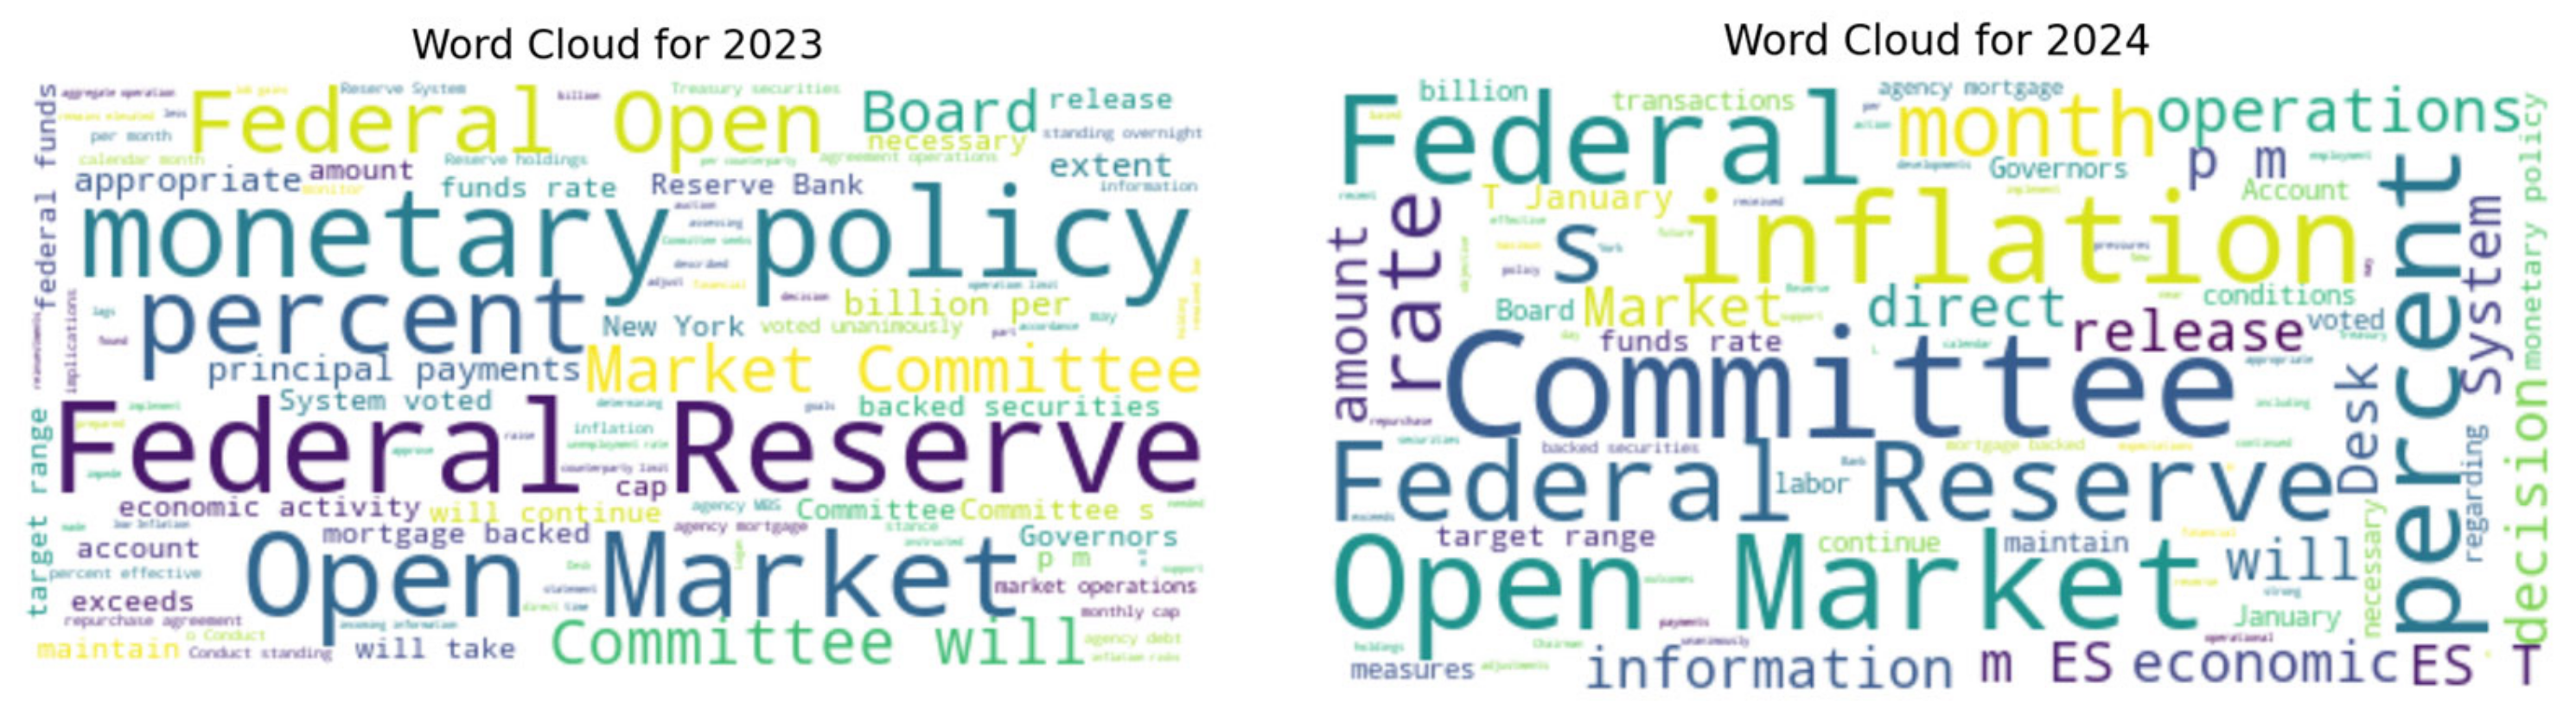
Although the initial sentiment analysis did not reveal distinct trends, we sought to uncover the underlying factors driving these fluctuations. To gain deeper insights, we consolidated all quarterly FOMC’s statements for each year and generated word clouds to visualize changes in word frequency and thematic focus over time. Figure 2 highlights notable shifts in these word clouds, categorized as follows.
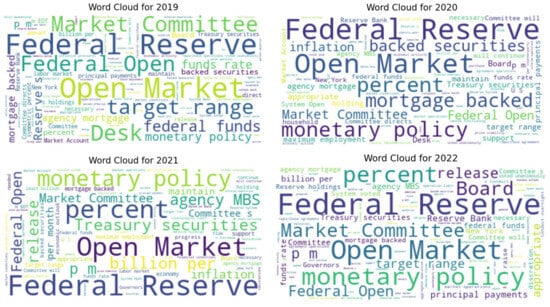
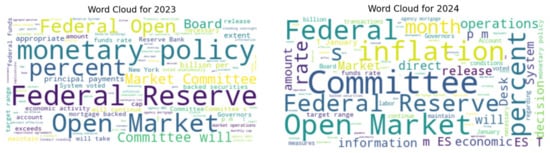
Figure 2.
Words Cloud Plots.
Keyword Frequency Dynamics
Central themes:
The terms “Federal Reserve” and “monetary policy” consistently appeared as high-frequency keywords across all years, underscoring their central role in FOMC communications.
Inflation focus:
The increased prominence of the term “inflation”, reflected in its growing font size from 2019 to 2024, signals the escalating importance of inflation in FOMC’s deliberations.
Policy tools:
The recurring presence of “Open Markets”, likely referring to open market operations, highlights its continued importance as a policy instrument.
Year-specific focus:
2019:
The prominence of terms like “federal funds rate” and “target range” points to a focus on interest rate policy decisions during this period.
2020:
The emergence of “agency MBS” (agency mortgage-backed securities) suggests interventions aimed at stabilizing financial markets through quantitative easing.
2021:
The increased visibility of “employment” reflects a shift toward prioritizing labor market recovery following the pandemic.
2022:
The appearance of terms such as “releases” and “operating restrictions” highlights discussions on policy implementation and operational constraints.
2024:
Keywords like “trading” and “direct” indicate a potential focus on new policy mechanisms or more direct market interventions.
Changes in economic topics:
Starting in 2019, the term “inflation” becomes increasingly significant, reflecting its growing influence on FOMC’s policy deliberations. From 2020 onward, the rising prominence of “mortgage backing” suggests a focus on measures aimed at stabilizing and supporting the housing market.
To gain a clearer understanding of the variations in the sentiment index across the data, we referred to the article “Forecasting Consumer Price Index with the Federal Open Market Committee Sentiment Index” for the sentiment index formula [18]. Using this approach, each FOMC statement was assigned a sentiment index score ranging from 0 to 1, where higher values indicate a more positive tone and lower values reflect a more negative tone. The sentiment index was calculated using the following formula:
Sentiment Index = (Positivei − Negativei)/(Positivei + Negativei).
The sentiment index formula used in this study, derived from [19], was chosen for its ability to normalize sentiment scores relative to the total sentiment-bearing words in each statement. This normalization ensures consistency across varying text lengths, reducing the risk of skewed sentiment interpretations. Unlike the raw sentiment score used in [20] which calculates sentiment as a simple difference between positive and negative scores, this formula provides a more refined and interpretable index for analyzing changes in tone over time. By adopting this approach, our study captures the nuanced shifts in sentiment expressed in FOMC’s statements, enabling meaningful correlations with healthcare and economic outcomes.
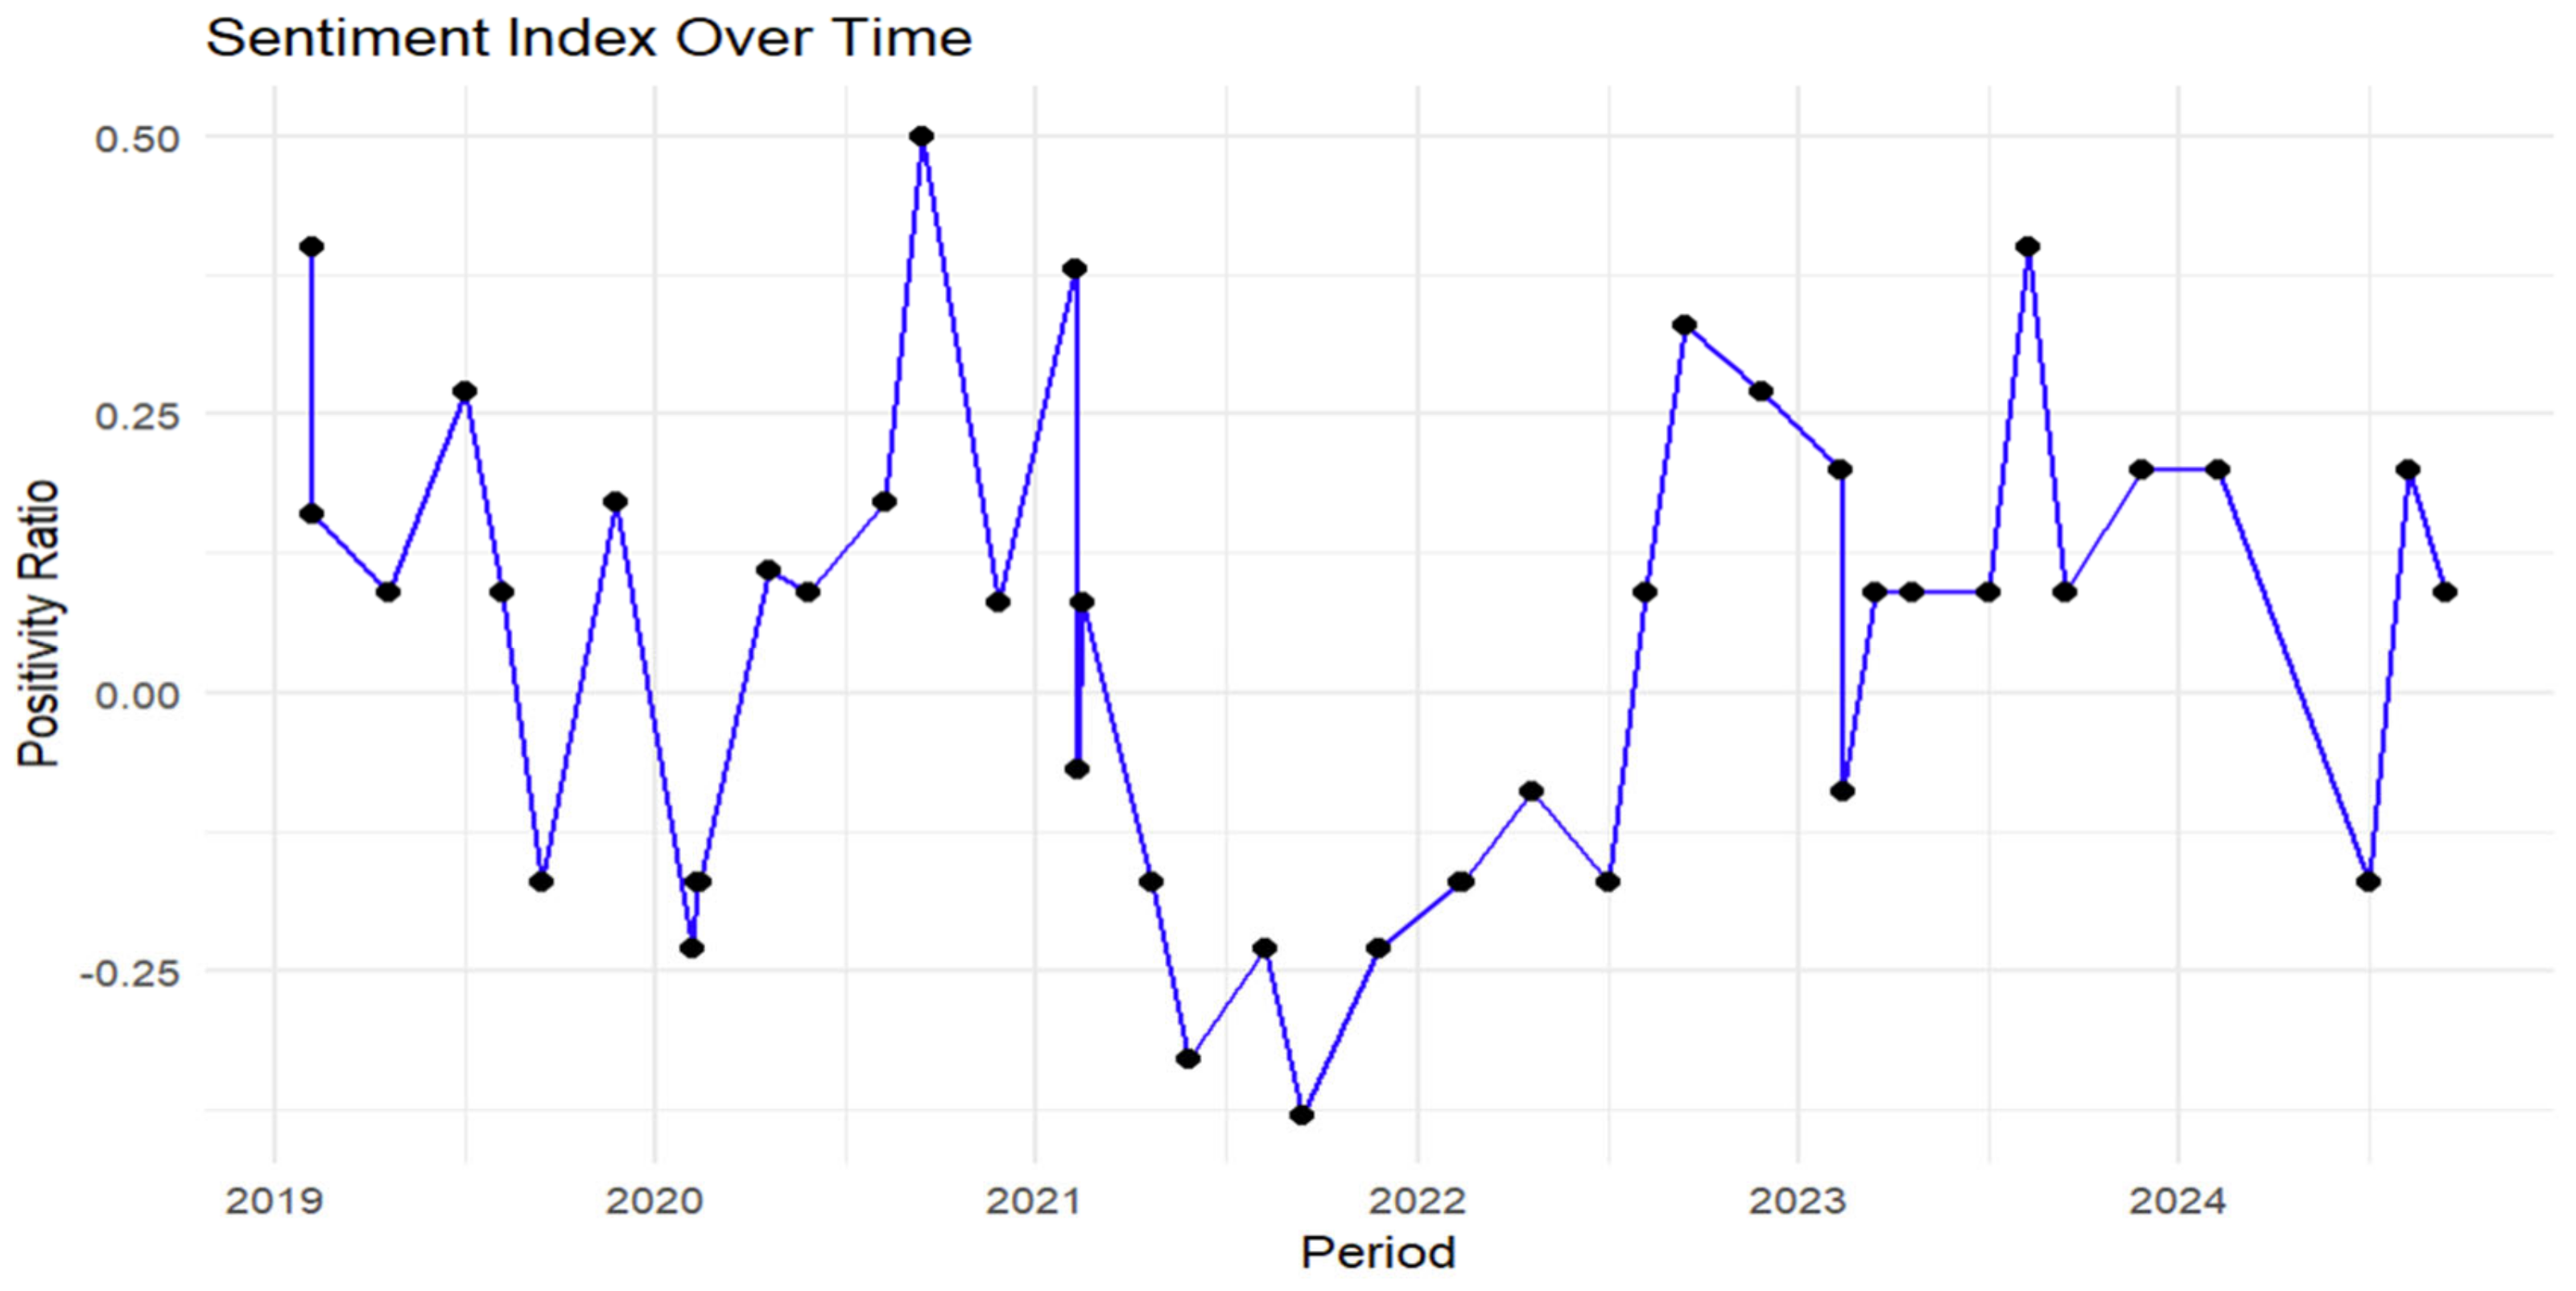
Based on these calculations, we plotted the sentiment index values on a line graph to visualize the trends over time in Figure 3. This visualization highlights the tonal shifts within FOMC’s statements throughout the analyzed period, offering insights into the Federal Reserve’s evolving communication strategy.
Figure 3.
Sentiment index over time.
5. Statistical Relationship by Correlation Coefficients in Health Science
In this section, we analyze the relationships among positive sentiment, negative sentiment, and sentiment indices derived from Federal Reserve’s statements and hospital expenditure trends. Additionally, we examine correlations between mental health metrics—specifically, the incidence rates of anxiety and depression—and the expressions of positive affect, negative affect, and sentiment indices present in Federal Reserve’s statements. This dual focus aims to uncover how the tone and sentiment of central bank communications may influence both economic and public health outcomes.
After understanding the changes in sentiment across Federal Reserve’s statements, we expanded our analysis to explore their potential impacts on public health indicators. We hypothesize that the sentiment index derived from FOMC’s statements influences hospital expenditures. Similarly, we anticipate that positive sentiment correlates with lower incidence rates of anxiety disorders, while negative sentiment correlates with higher rates, reflecting the psychological impact of economic outlooks.
To test these hypotheses, we used quarterly hospital financial and utilization reports from HealthData.gov. This dataset, covering the years 2019 to 2023, coincides with our analysis of the Fed’s quarterly statements and includes facility-level summaries detailing service capacities, hospital revenues and expenditures, and utilization metrics reported by California’s 450 hospitals and 1200 long-term care facilities. These summaries provide insights into payer-derived revenues, operational expenses, and service utilization.
The analysis began by aggregating total expenditures, including both infrastructure and operational costs. Correlation plots were then constructed to examine potential interdependencies. This involved aligning the dates of health data with those of the Federal Reserve’s sentiment publications, enabling a temporal assessment of their relationships.
Key findings:
Correlation with Healthcare Spending:
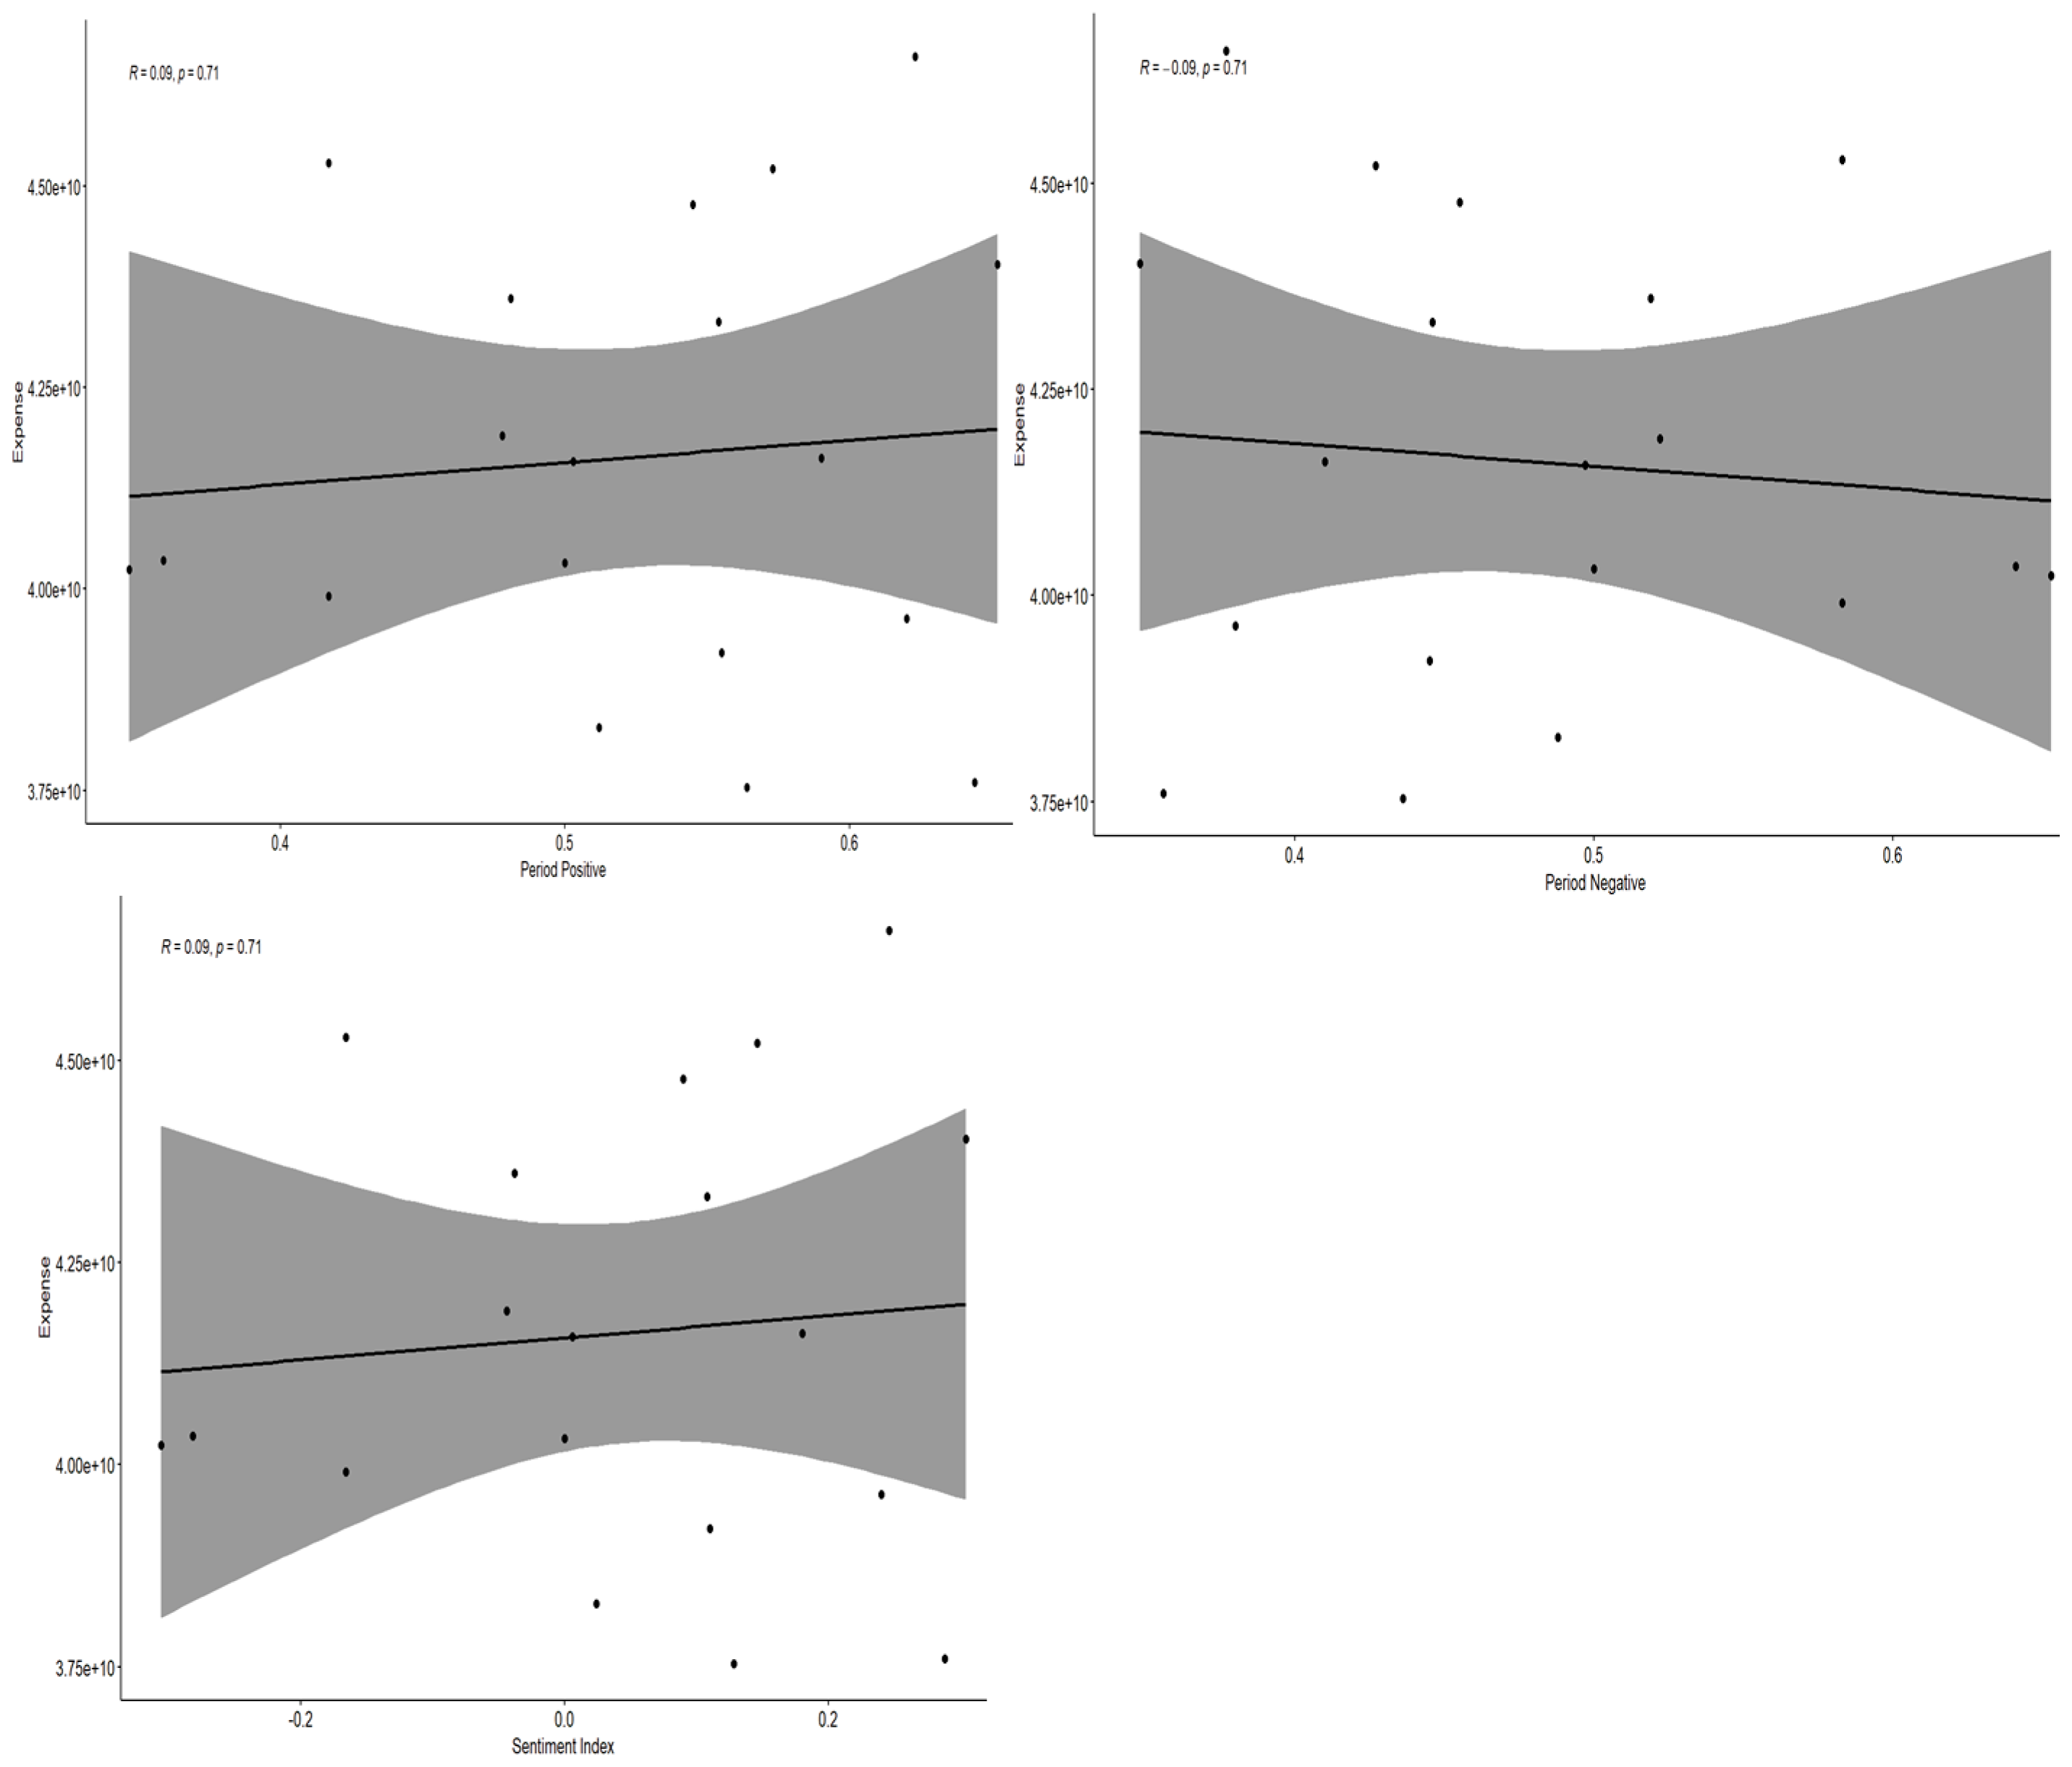
According to Figure 4, our analysis of quarterly data from 2019 to 2023 demonstrates a positive correlation between the positivity of Federal Reserve’s statements and healthcare spending. Conversely, a negative correlation was observed between the negativity of these statements and healthcare spending. Additionally, the sentiment index displayed a pattern similar to positivity, indicating a consistent positive trend.

Figure 4.
Correlation between the positive index, the negative index, and the sentiment index and expenses in hospitals.
Theoretical implications:
This trend aligns with theoretical understandings and observed realities. Public confidence in economic stability, shaped by signals from the Federal Reserve, likely enhances perceptions of financial security. This increased confidence may extend to sectors such as banking and interest rates, fostering a sense of economic vitality and resulting in greater disposable income. Consequently, individuals may feel more inclined to invest in healthcare, addressing previously neglected minor health concerns or pursuing preventive and rehabilitative medical services.
Institutional response:
From an institutional perspective, hospitals may respond to an increased demand by expanding infrastructure and upgrading capabilities, such as acquiring new diagnostic and surgical equipment, to meet the heightened need for healthcare services.
Context of the COVID-19 pandemic:
It is important to note that our study spans from 2019 to 2023, a period coinciding with the COVID-19 pandemic. This was a time of unprecedented strain on healthcare systems and of increased medical expenditures. While our analysis focuses on the relationship between sentiment indices and healthcare spending, some observed trends in healthcare expenditure may also reflect direct effects of the pandemic, such as increased demand for medical services, pandemic-related policy interventions, and shifts in healthcare priorities.
Limitations and insights:
While the scope of our data is limited to a relatively short timeframe and specific intervals, our conclusions provide a broad overview rather than a definitive analysis. Nonetheless, these findings offer valuable preliminary insights into the potential influence of economic sentiment on healthcare spending behaviors. They highlight the complex interplay between economic signals and public health decisions, paving the way for further research to refine and expand on these initial observations.
Subsequently, we investigated the correlation between mental health statistics and the sentiment index. Using data compiled from samhsa.gov, we aggregated the total number of patients from 2019 to 2021. Our analysis encompassed various psychological disorders, including alcohol- and substance-related disorders, anxiety disorders, depressive disorders, trauma- and stressor-related disorders, and bipolar disorders. Among these, the trends in reported cases of anxiety and depressive disorders emerged as the most prominent, which is why our discussion focuses specifically on these two conditions.
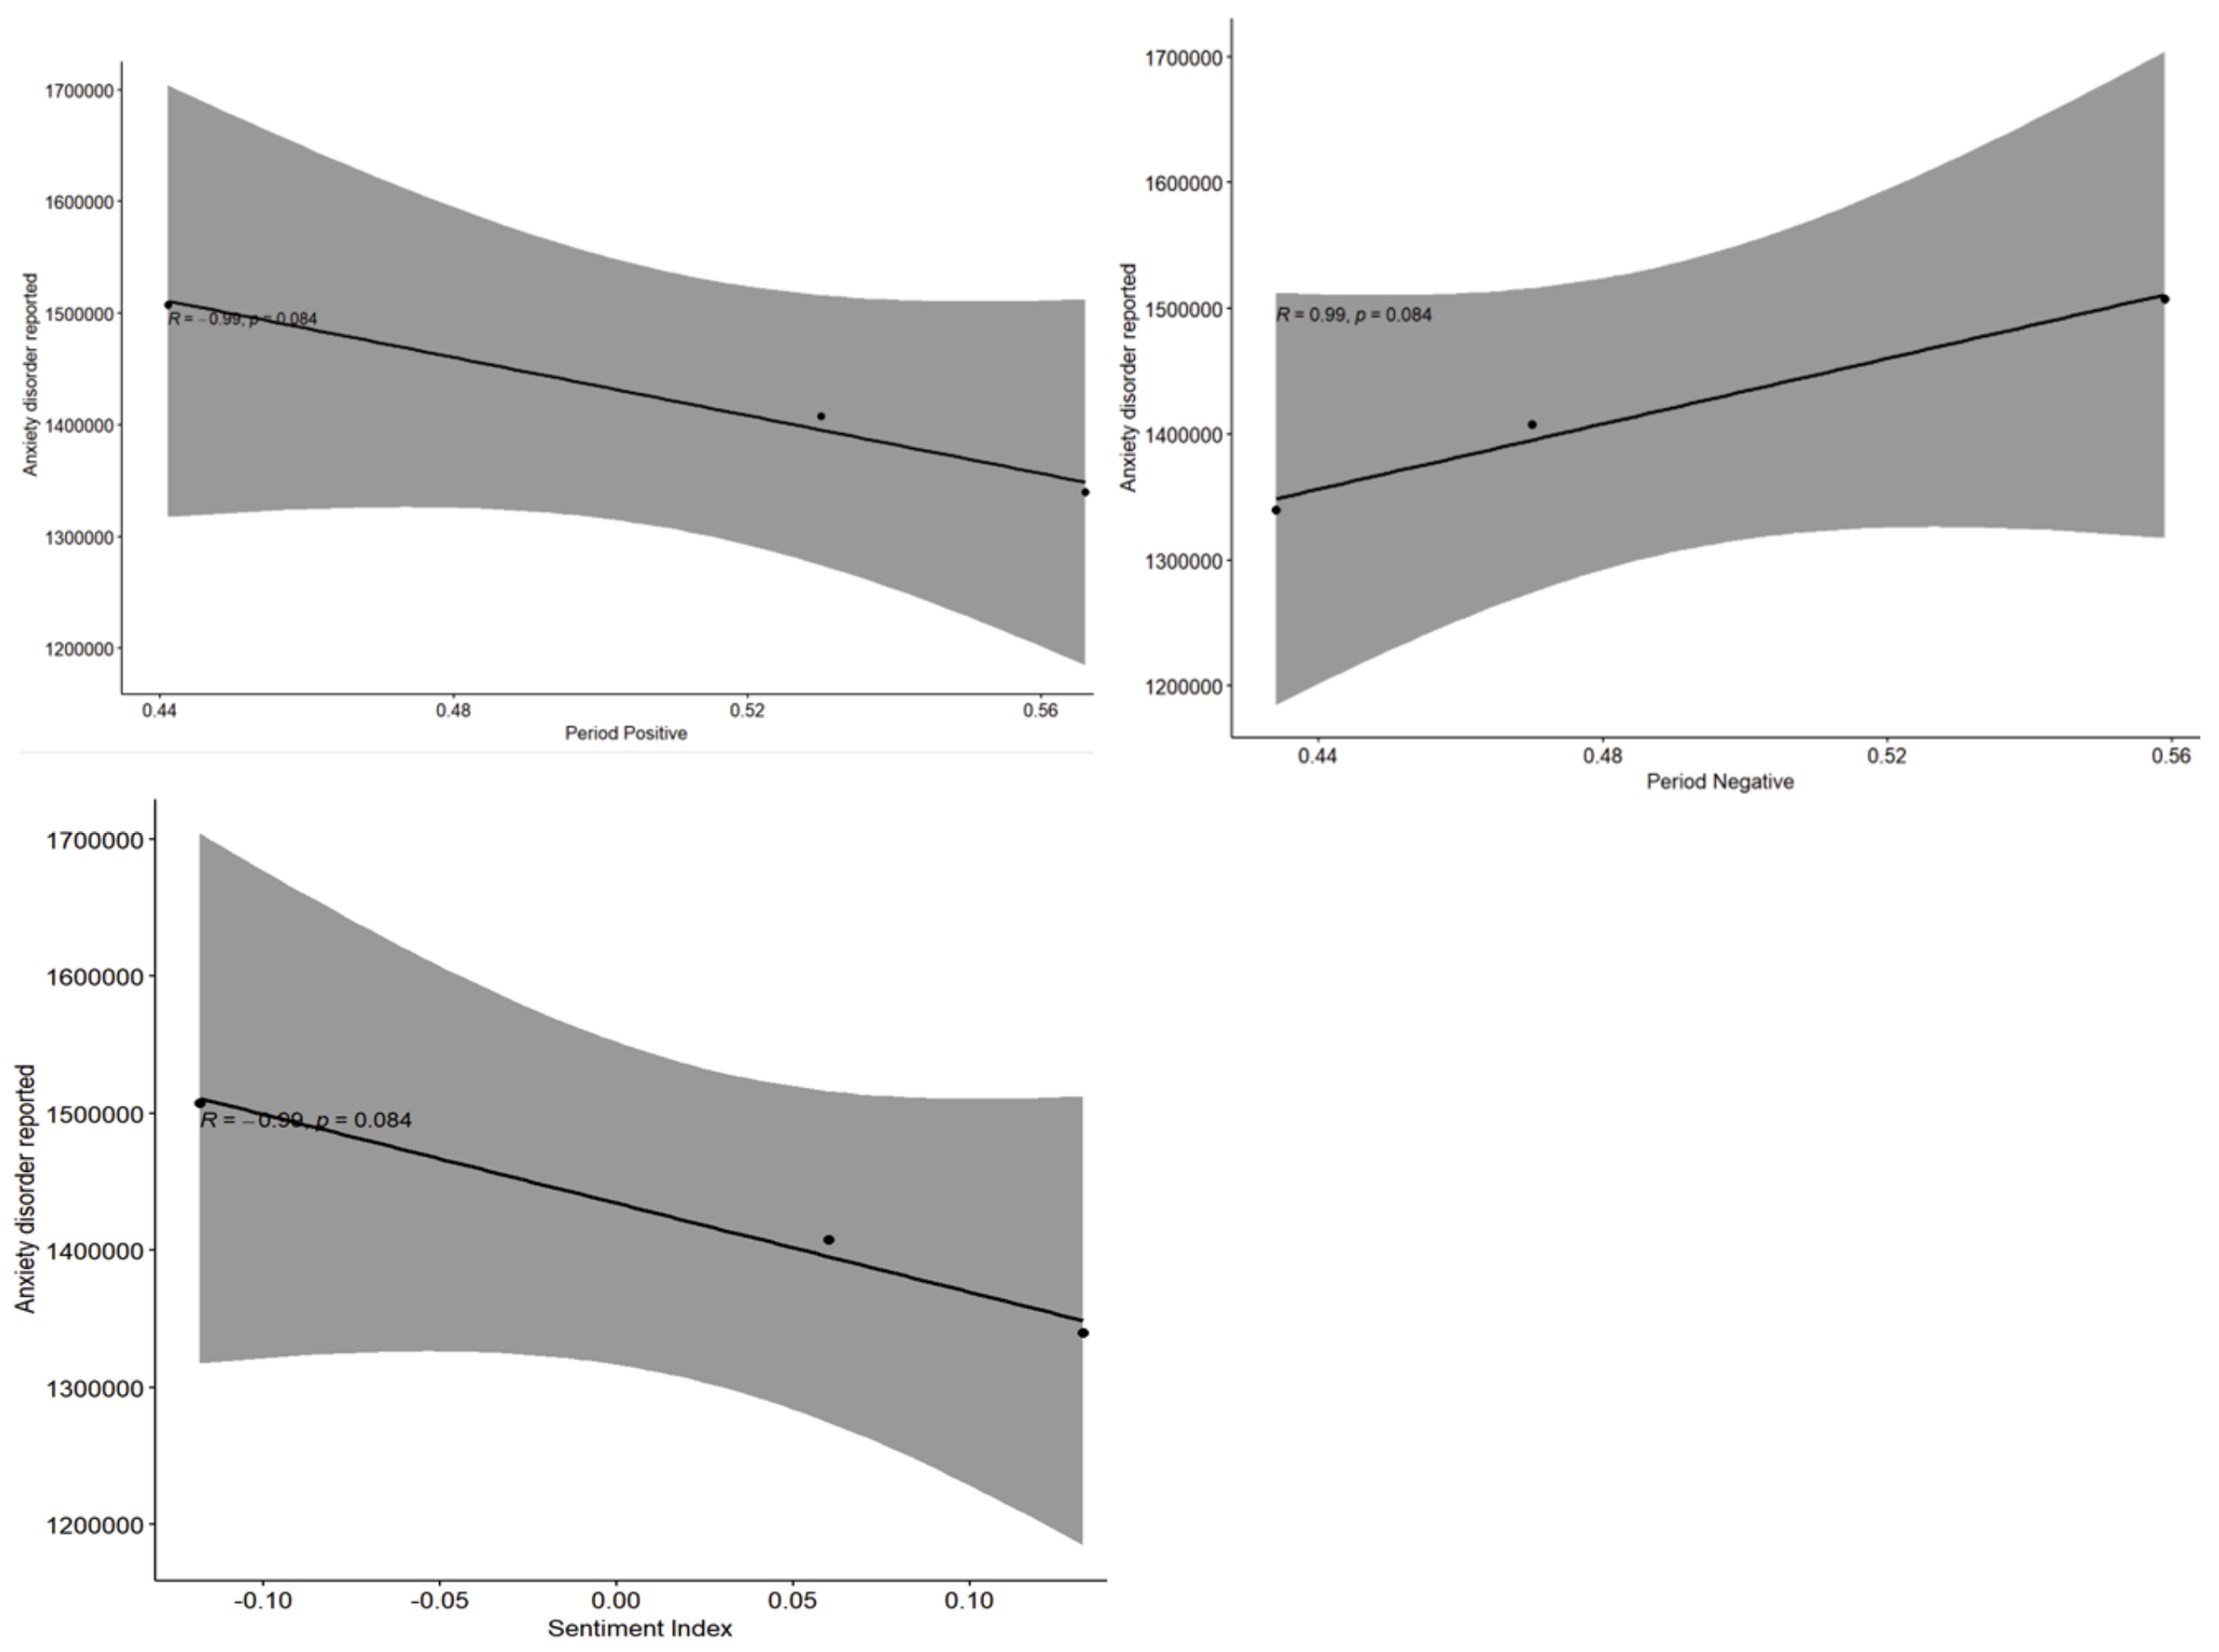
Figure 5 illustrates the relationship between positive sentiment indicators and anxiety disorders. The analysis revealed a clear trend: as positive sentiment indicators increased, the reported cases of anxiety disorders significantly decreased. The correlation coefficient (R = −0.99) indicates a strong negative correlation. However, the p-value of 0.084 exceeds the conventional threshold for statistical significance (p < 0.05). This suggests that, although the observed correlation is strong, we cannot entirely rule out the possibility that it occurred by chance.

Figure 5.
Correlation between the positive index, the negative index, and the sentiment index and anxiety disorders reported by hospitals.
While the period analyzed (2019–2021) coincides with the COVID-19 pandemic—a time of heightened psychological stress and uncertainty—our results suggest that the Federal Reserve’s positive monetary policies may have played a significant role in alleviating public anxiety. The increasing sentiment index, driven by optimistic Federal Reserve’s statements and accommodative economic policies, likely provided a counterbalance to pandemic-related fears. This implies that the positive impacts of these policies may have outweighed the psychological toll of the pandemic, resulting in an overall decrease in reported anxiety disorders during this time.
The correlation analysis, based on the available data, suggests several potential social phenomena.
Positive economic policies
A positive sentiment in economic policies may signify broader social or economic improvements, such as economic growth, increased employment, and social stability. These improvements can foster optimism about the future and potentially reduce the prevalence of anxiety and related mental health issues.
Effectiveness of public policies
Enhanced access to healthcare, improved economic conditions, or expanded mental health services might contribute to better living conditions. These improvements, facilitated by positive public policies, may help reduce anxiety levels within the population.
However, the limited sample size constrains our ability to draw definitive conclusions about the relationship between sentiment indicators in Federal Reserve’s statements and anxiety disorders. While the current dataset provides preliminary insights, a larger sample size would likely offer a clearer understanding of these associations. Such findings could support the development of targeted interventions aimed at improving public mental health outcomes.
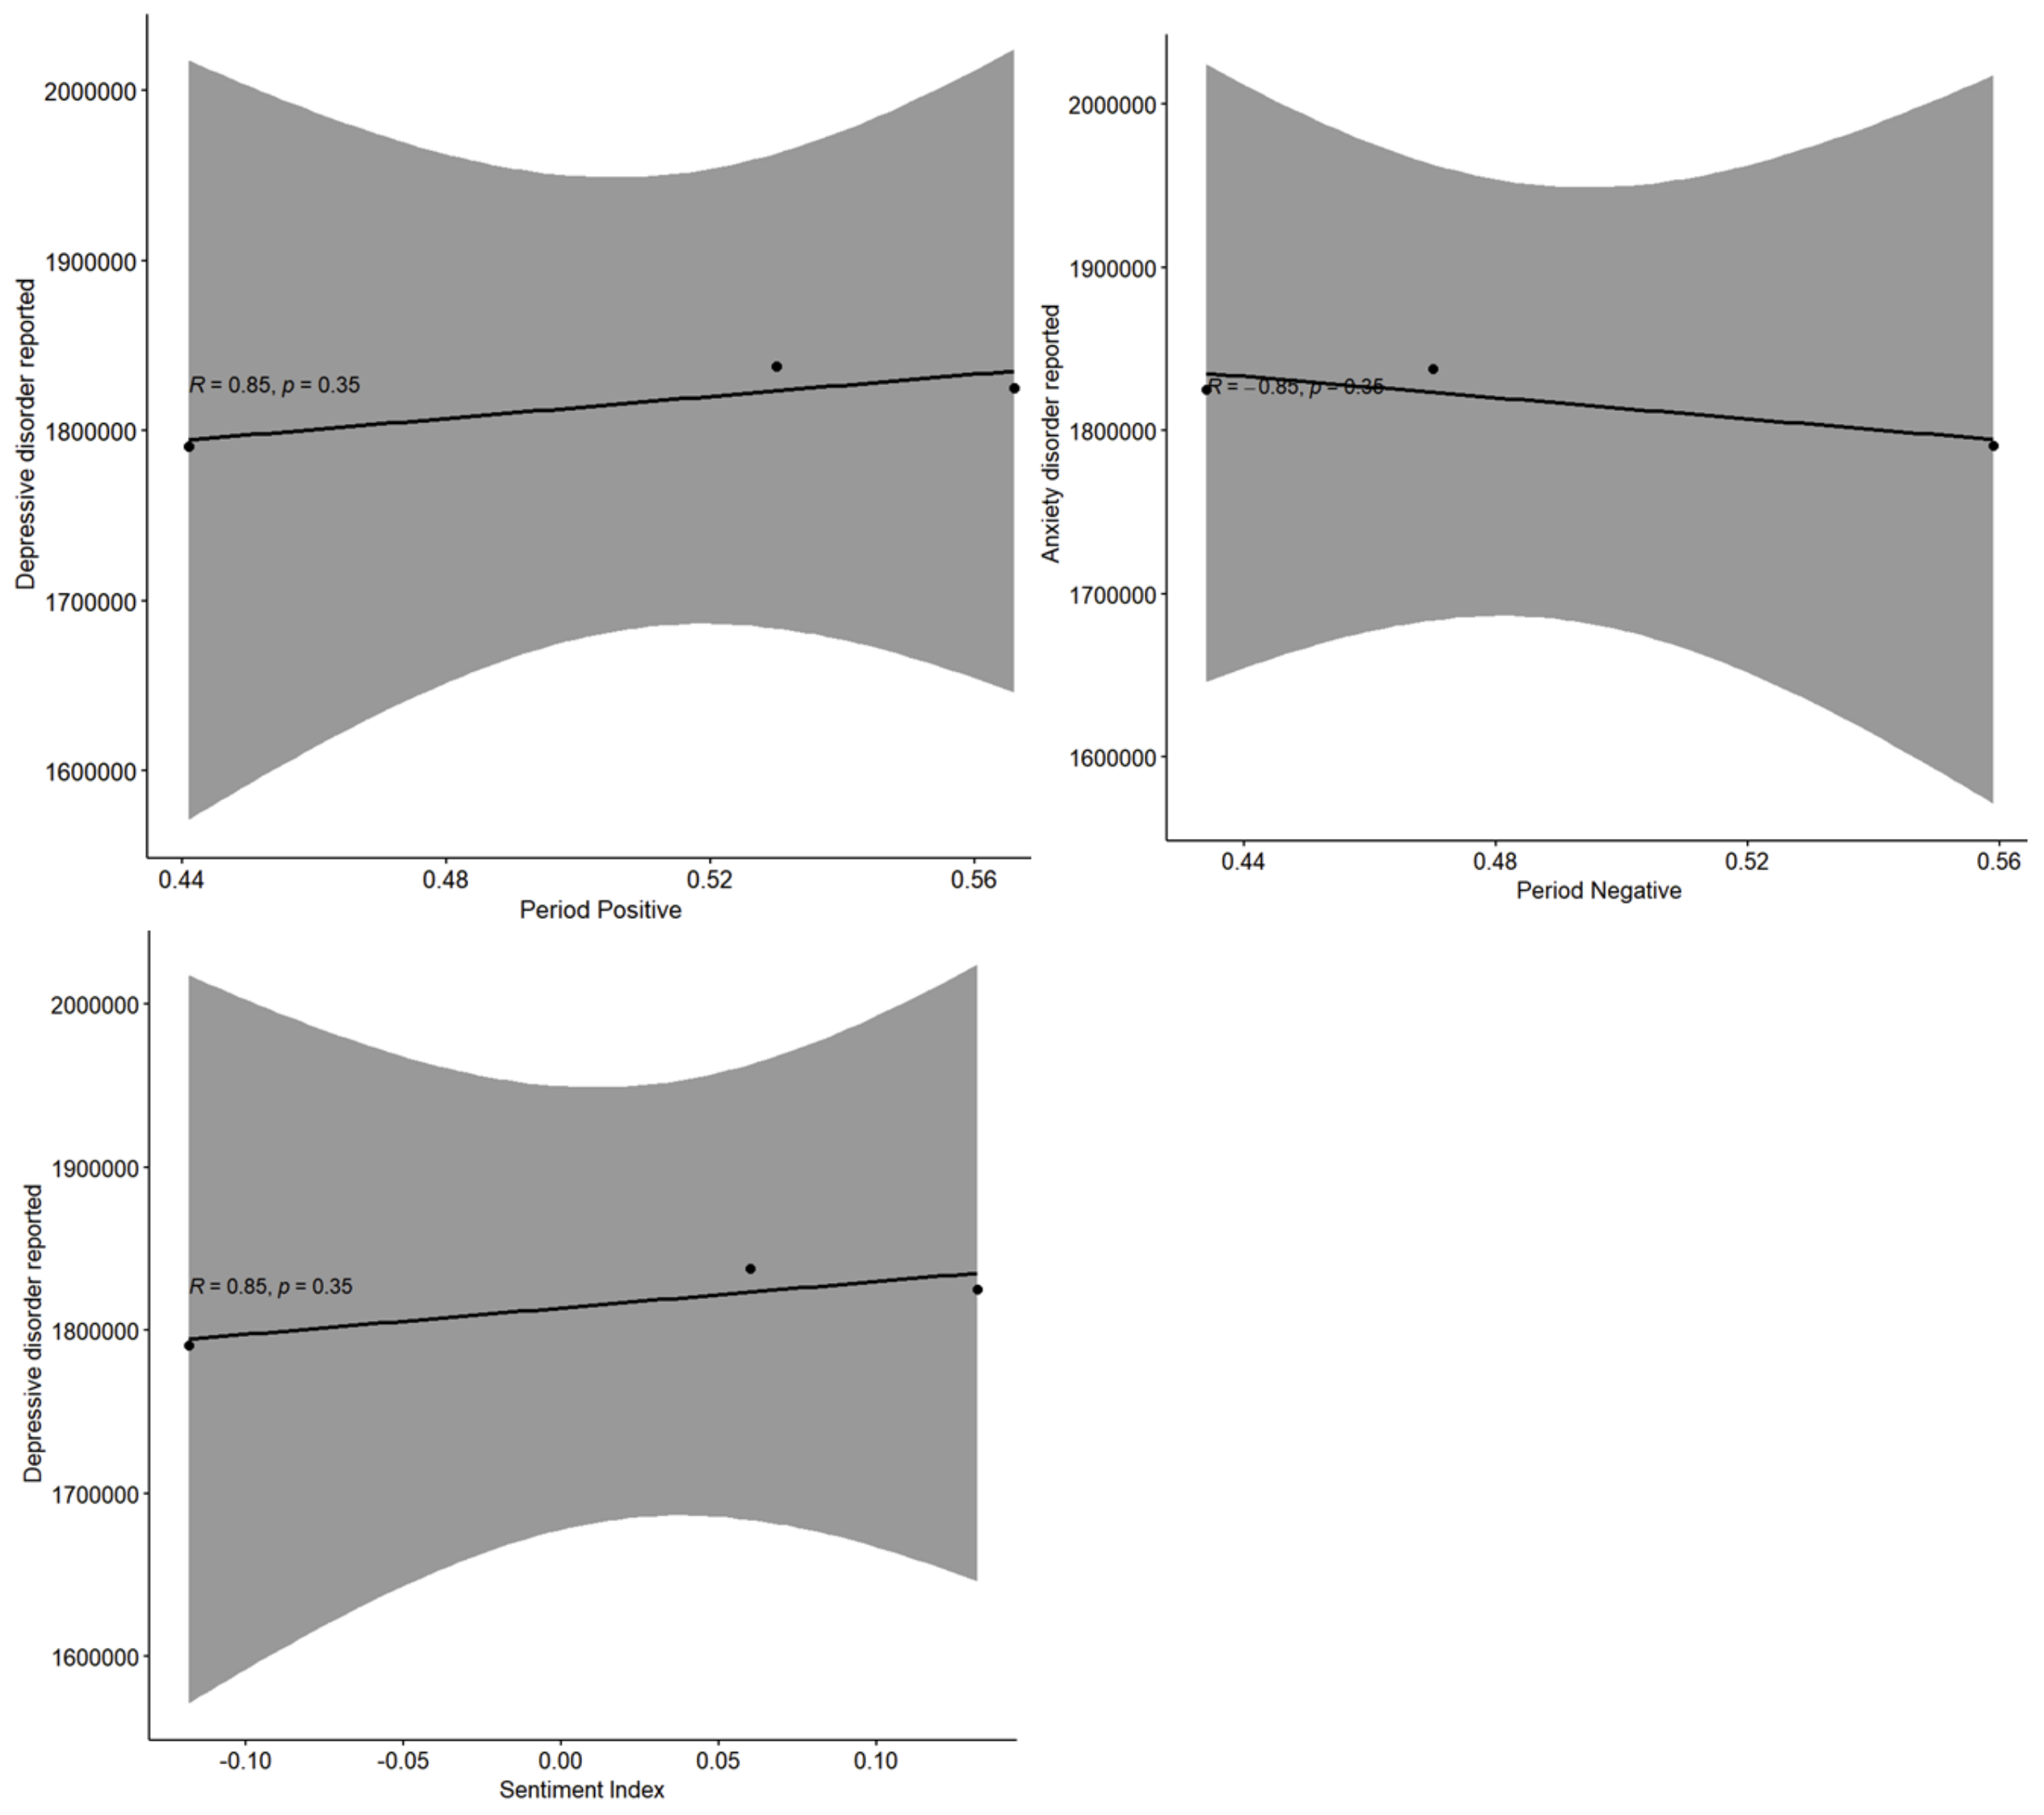
Figure 6 shows a notable increase in the number of individuals experiencing depression from 2019 to 2023 which correlates positively with the sentiment and mood indices expressed in Federal Reserve’s statements. This finding contrasts with our initial hypothesis, as conventional wisdom suggests that positive Federal Reserve’s statements—often signaling economic growth or rising interest rates—should correspond with a decline in anxiety and depression rates. However, the data reveal the opposite trend.

Figure 6.
Correlation between the positive index, the negative index, and the sentiment index and depressive disorders reported by hospitals.
The correlation coefficient (R = 0.85) indicates a strong positive relationship between positive sentiment indices and reported cases of depression. Nonetheless, the p-value of 0.35 exceeds the conventional significance threshold of 0.05, meaning we cannot confidently rule out the possibility that this correlation occurred by chance. This highlights the need for further investigation to better understand the underlying factors contributing to this unexpected result.
While our study period (2019–2023) encompasses the COVID-19 pandemic, a time marked by unprecedented social, economic, and psychological challenges, it is possible that the observed positive correlation between sentiment indices and depression rates reflects the complex interplay of external factors. The Federal Reserve’s optimistic statements, aimed at stabilizing markets and fostering economic recovery, may have inadvertently heightened public expectations or emphasized economic uncertainties for vulnerable populations.
Additionally, the ongoing pandemic likely exacerbated mental health issues, such as depression, due to factors like prolonged isolation, job instability, and fear of illness. These external stressors may have overridden the potential calming effects of a positive sentiment in Federal Reserve’s statements, thereby contributing to the upward trend in reported depression rates. This suggests that, while positive sentiment policies may influence economic confidence, their impact on mental health outcomes during a period of crisis requires deeper exploration.
6. Statistical Analysis Comparing the Relationship Between Magnificent Seven Stocks and the FOMC’s Sentimental Index with Medical Companies
In our initial analysis of the relationship between the FOMC’s sentiment index and healthcare costs, we encountered several limitations. Consequently, we shifted our focus toward analyzing how the sentiment index influences stock returns. This change was motivated by the hypothesis that the sentiment expressed in FOMC’s statements significantly impacts investor behavior, particularly in sectors like technology which are highly sensitive to macroeconomic conditions. To test this, we selected a group of influential tech companies, commonly referred to as the “Magnificent Seven” (Microsoft, Meta, Apple, Amazon, Tesla, and Nvidia). Our objective was to examine how these stocks react to FOMC’s sentiment around Fed meetings.
The selected stocks represent companies with a substantial market share which are highly responsive to macroeconomic conditions and investor sentiment. The FOMC’s statements, which provide insights into monetary policy, inflation, and economic growth, have a critical influence on market behavior. By analyzing the relationship between the log returns of these stocks before and after FOMC meetings and the FOMC’s sentiment index, we aim to identify patterns that reveal how investor sentiment and market expectations shift in response to key policy announcements.
To quantify this relationship, we calculated the log returns for each stock for the two months preceding and the two months following each Fed meeting. We selected a two-month window because we hypothesized that FOMC’s statements may have delayed effects on the economy. Preliminary analyses using a one-month window showed that the correlation between the monthly log returns of all companies and the sentiment index was nearly zero. By extending the window to two months, we were able to capture a more comprehensive view of changes in market reactions to FOMC’s statements.
This extended approach provides valuable insights into how sentiment surrounding policy announcements influences the technology sector, offering a clearer understanding of the sector’s responsiveness to changes in economic sentiment. By analyzing the relationship between the FOMC’s sentiment index and stock returns over this adjusted timeframe, we aim to uncover meaningful patterns that could inform both investment strategies and policymaking.
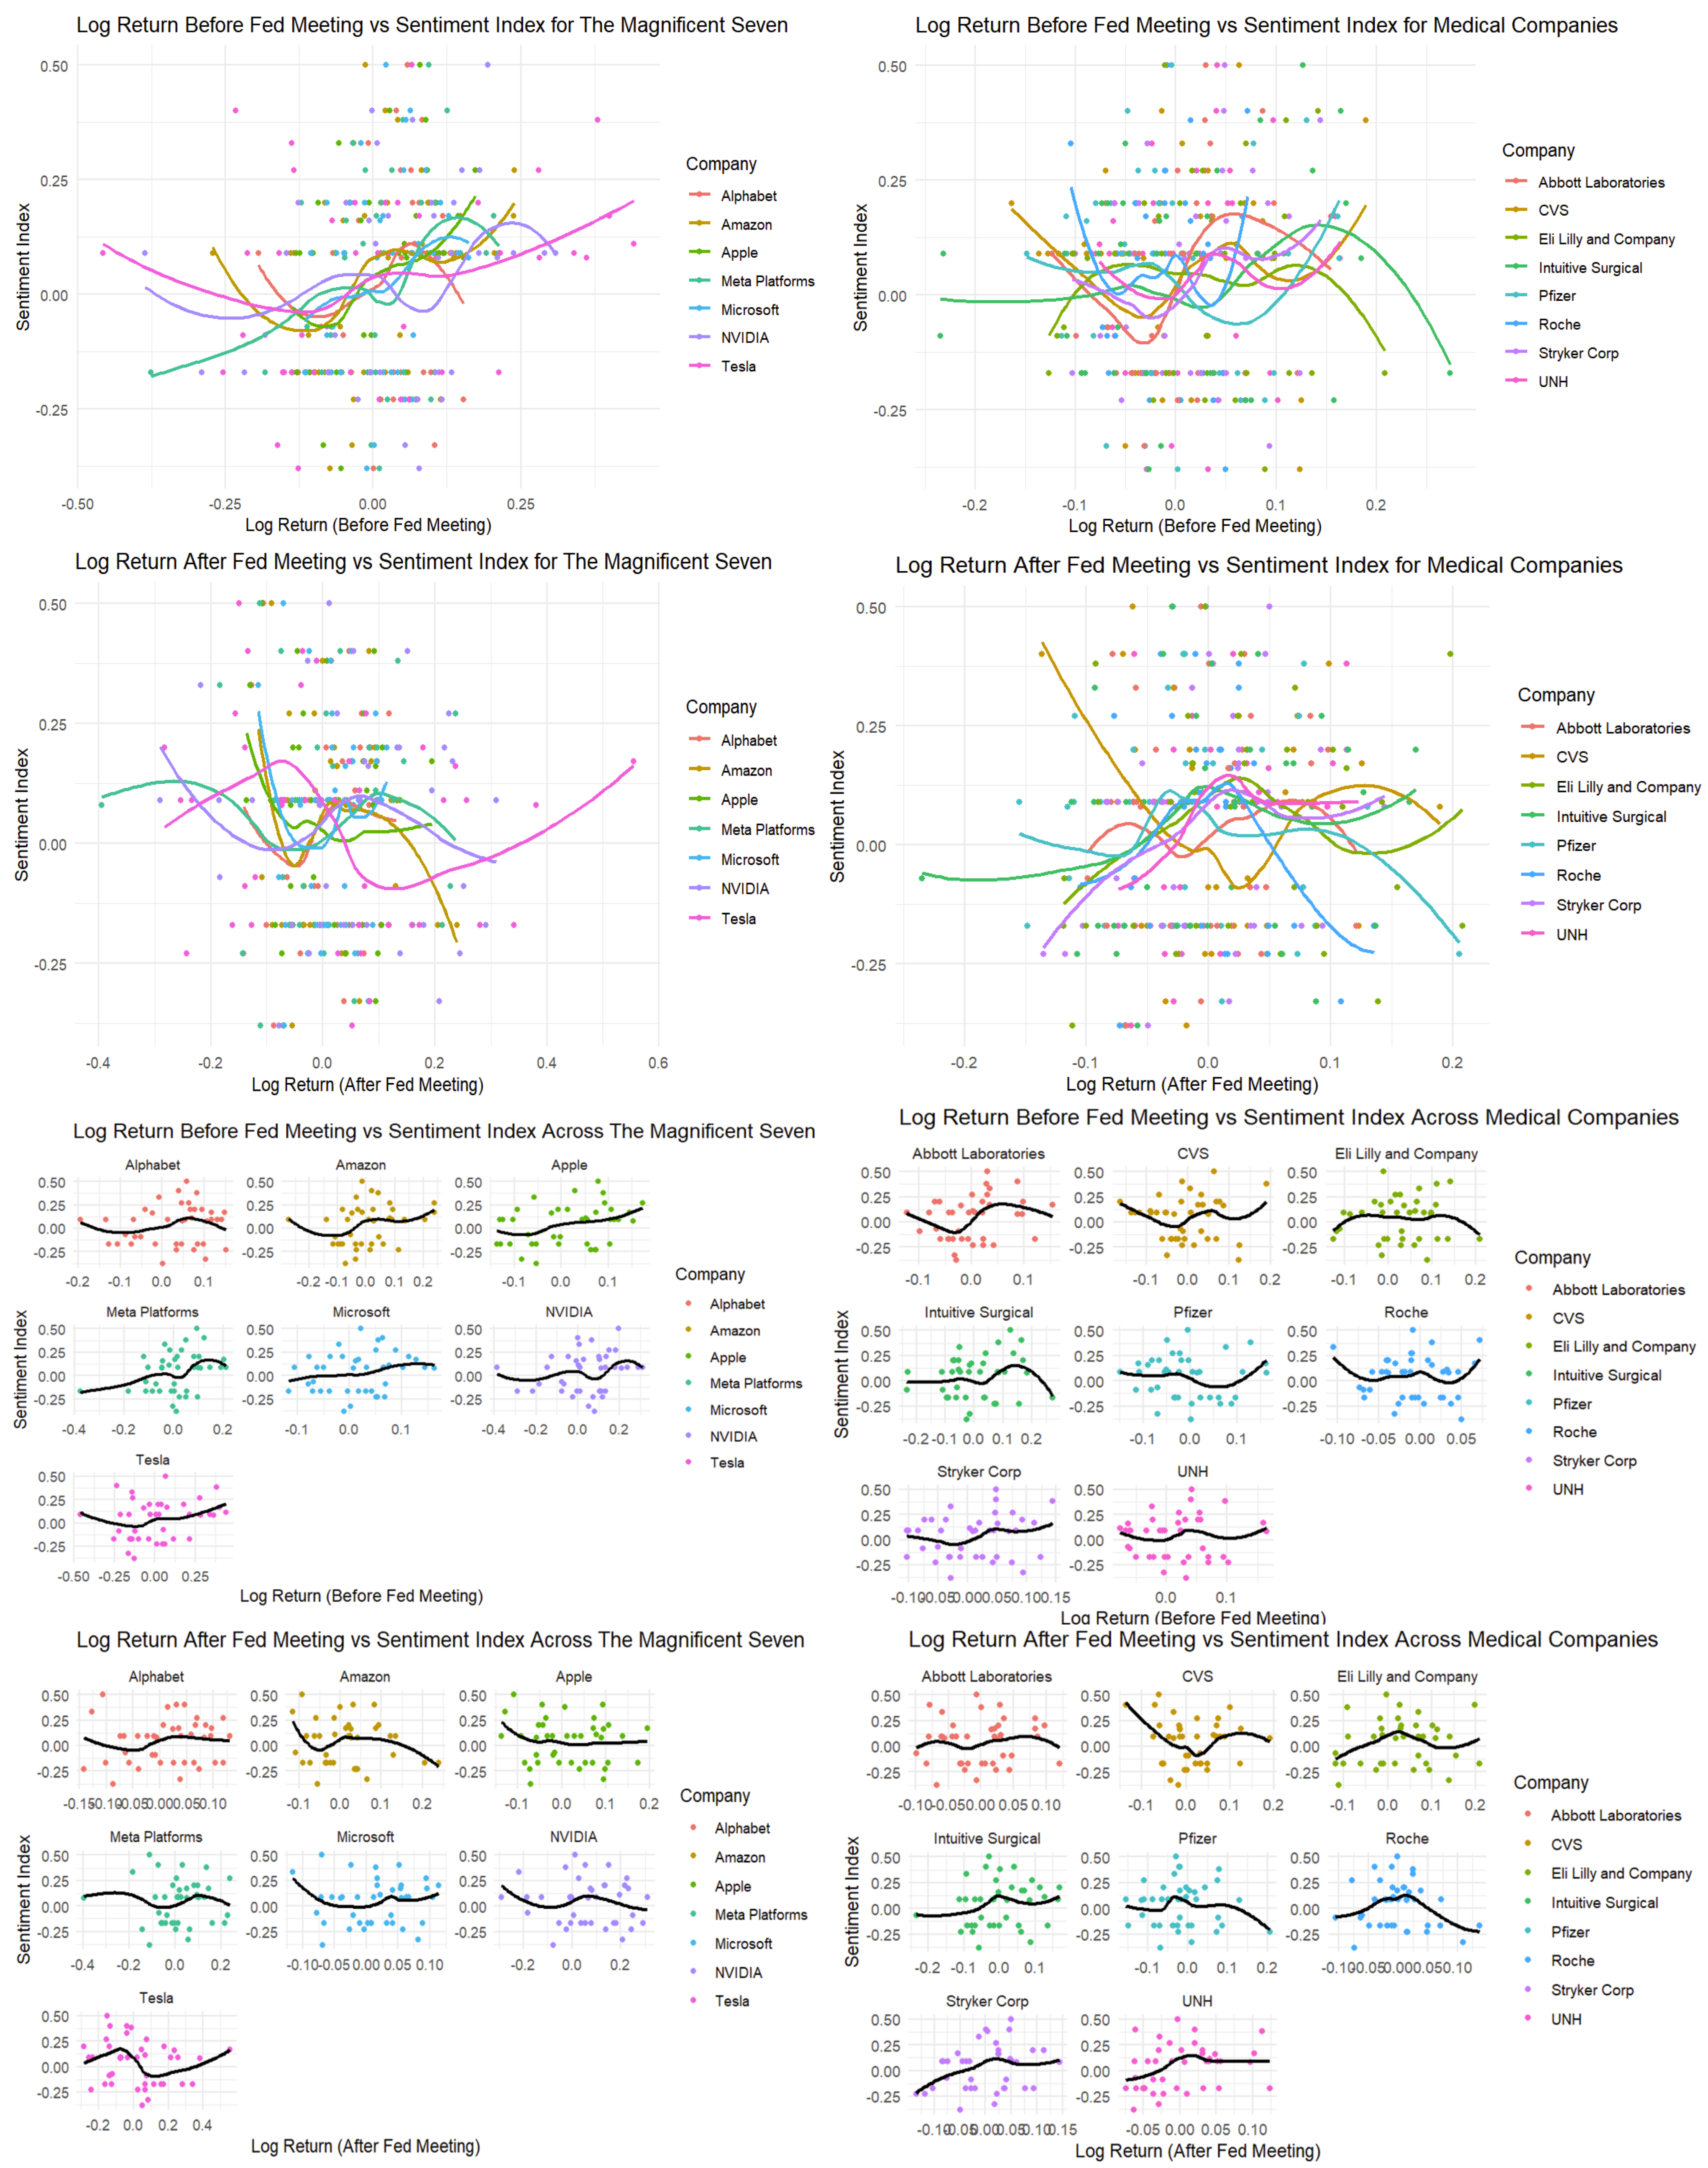
Figure 7 illustrates that, in our analysis of the Magnificent Seven, no clear linear relationship was evident between the “pre-meeting” and the “post-meeting” charts. However, the correlation coefficients suggest that technology companies are generally positively correlated with the sentiment index prior to Federal Reserve meetings. This indicates that investors in the tech sector tend to adopt a more optimistic economic outlook ahead of these meetings, likely driven by expectations that the Federal Reserve will maintain accommodative monetary policies to support economic growth.
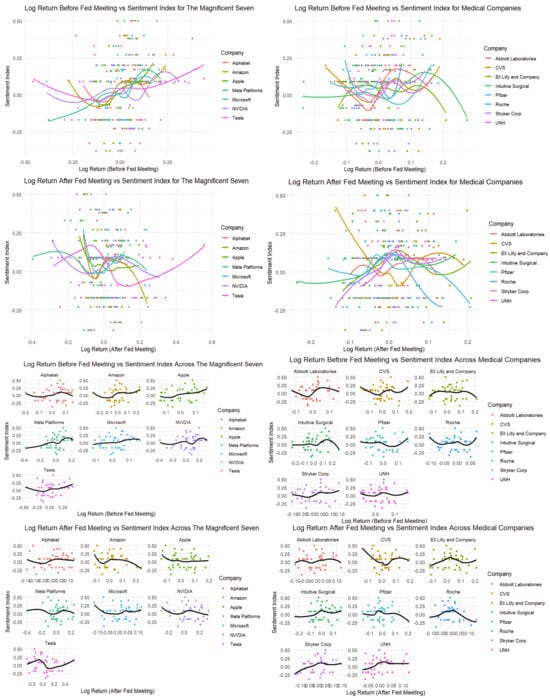
Figure 7.
Comparison of log return vs. sentiment index before and after Fed meetings for the Magnificent Seven companies.
For most technology companies, we observed a positive correlation between their performance and the sentiment index prior to Fed meetings, reflecting favorable market expectations. Specifically, companies such as Alphabet, Meta platforms, and Apple exhibited stronger positive correlations, suggesting that investors anticipated a better performance for these companies ahead of the meetings. This trend implies that expected policy changes are often priced into the market before FOMC meetings. The anticipation of low interest rates likely enhanced the appeal of these companies, which are heavily reliant on future growth and innovation. Since the discount rate for future cash flows in technology companies is particularly sensitive to changes in interest rates, investors may expect the Federal Reserve to maintain low rates, thereby improving the capital efficiency of these companies. This expectation translates into upward momentum in their stock prices prior to FOMC meetings.
This finding aligns with what is discussed in “Monetary Policy and Stock Market Reactions: Evidence from the Technology Sector” [21], which highlights that technology companies are particularly sensitive to changes in interest rates due to their reliance on future cash flows.
For medical companies, unlike the Magnificent Seven, we did not identify any specific trends before or after the FOMC releases. Their log return range, from −0.2 to 0.2, is notably smaller than that of the Magnificent Seven which ranges from −0.5 to 0.6. Additionally, the log returns for medical companies are close to zero and show little sensitivity to the sentiment index from FOMC’s statements. This suggests that the sentiment expressed in these statements has a minimal impact on the performance of medical companies.
However, following the Fed meetings, the correlation between many technology companies and sentiment indices generally declined and, in some cases, turned negative. This shift indicates that investor sentiment may have adjusted post-meeting as the market weighed the uncertainties introduced by the Federal Reserve’s actual policy decisions. It is also plausible that FOMC’s statements have a delayed economic impact—investors may realize after the meeting that certain policy changes, such as interest rate hikes, could increase the cost of capital and potentially compress profit margins.
In contrast, data for medical companies exhibited a relatively stable range, making it difficult to precisely assess the impact of the FOMC’s sentiment index on their performance. This limited fluctuation suggests that medical companies are less sensitive to changes in market sentiment or broader economic expectations compared to the Magnificent Seven. Their stability may reflect a greater resilience to macroeconomic factors, possibly due to the essential nature of their services.
Tesla serves as a notable example of the dynamic impact of sentiment and monetary policy. Prior to Fed meetings, Tesla demonstrated a strong positive correlation with sentiment indices, reflecting market optimism about the future of technology and green energy innovations. However, after the meetings, Tesla’s correlation with the sentiment index turned negative during certain periods between 2019 and 2024. This change is likely attributable to concerns that rising interest rates could negatively affect capital-intensive companies like Tesla which rely heavily on substantial capital investments for growth and innovation. This highlights the dual nature of sentiment-driven expectations and the tangible impact of monetary policy decisions on different sectors.
The initial conclusions mentioned above are based on the line graphs we generated which illustrate an instantaneous relationship at a given point in time. This approach primarily reveals whether two variables change simultaneously at the same point in time (correlation), but it does not provide insights into whether a temporal causal relationship exists—i.e., whether one variable predicts changes in the other.
As discussed in “Monetary Policy and Stock Market Reactions: Evidence from the Technology Sector”, FOMC’s statements often influence investors’ expectations in ways that create lagging effects on technology stock prices. To further explore whether federal government’s statements influence the future monthly log returns of technology, internet, or medical companies’ stocks, we conducted an in-depth analysis using the Granger causality test.
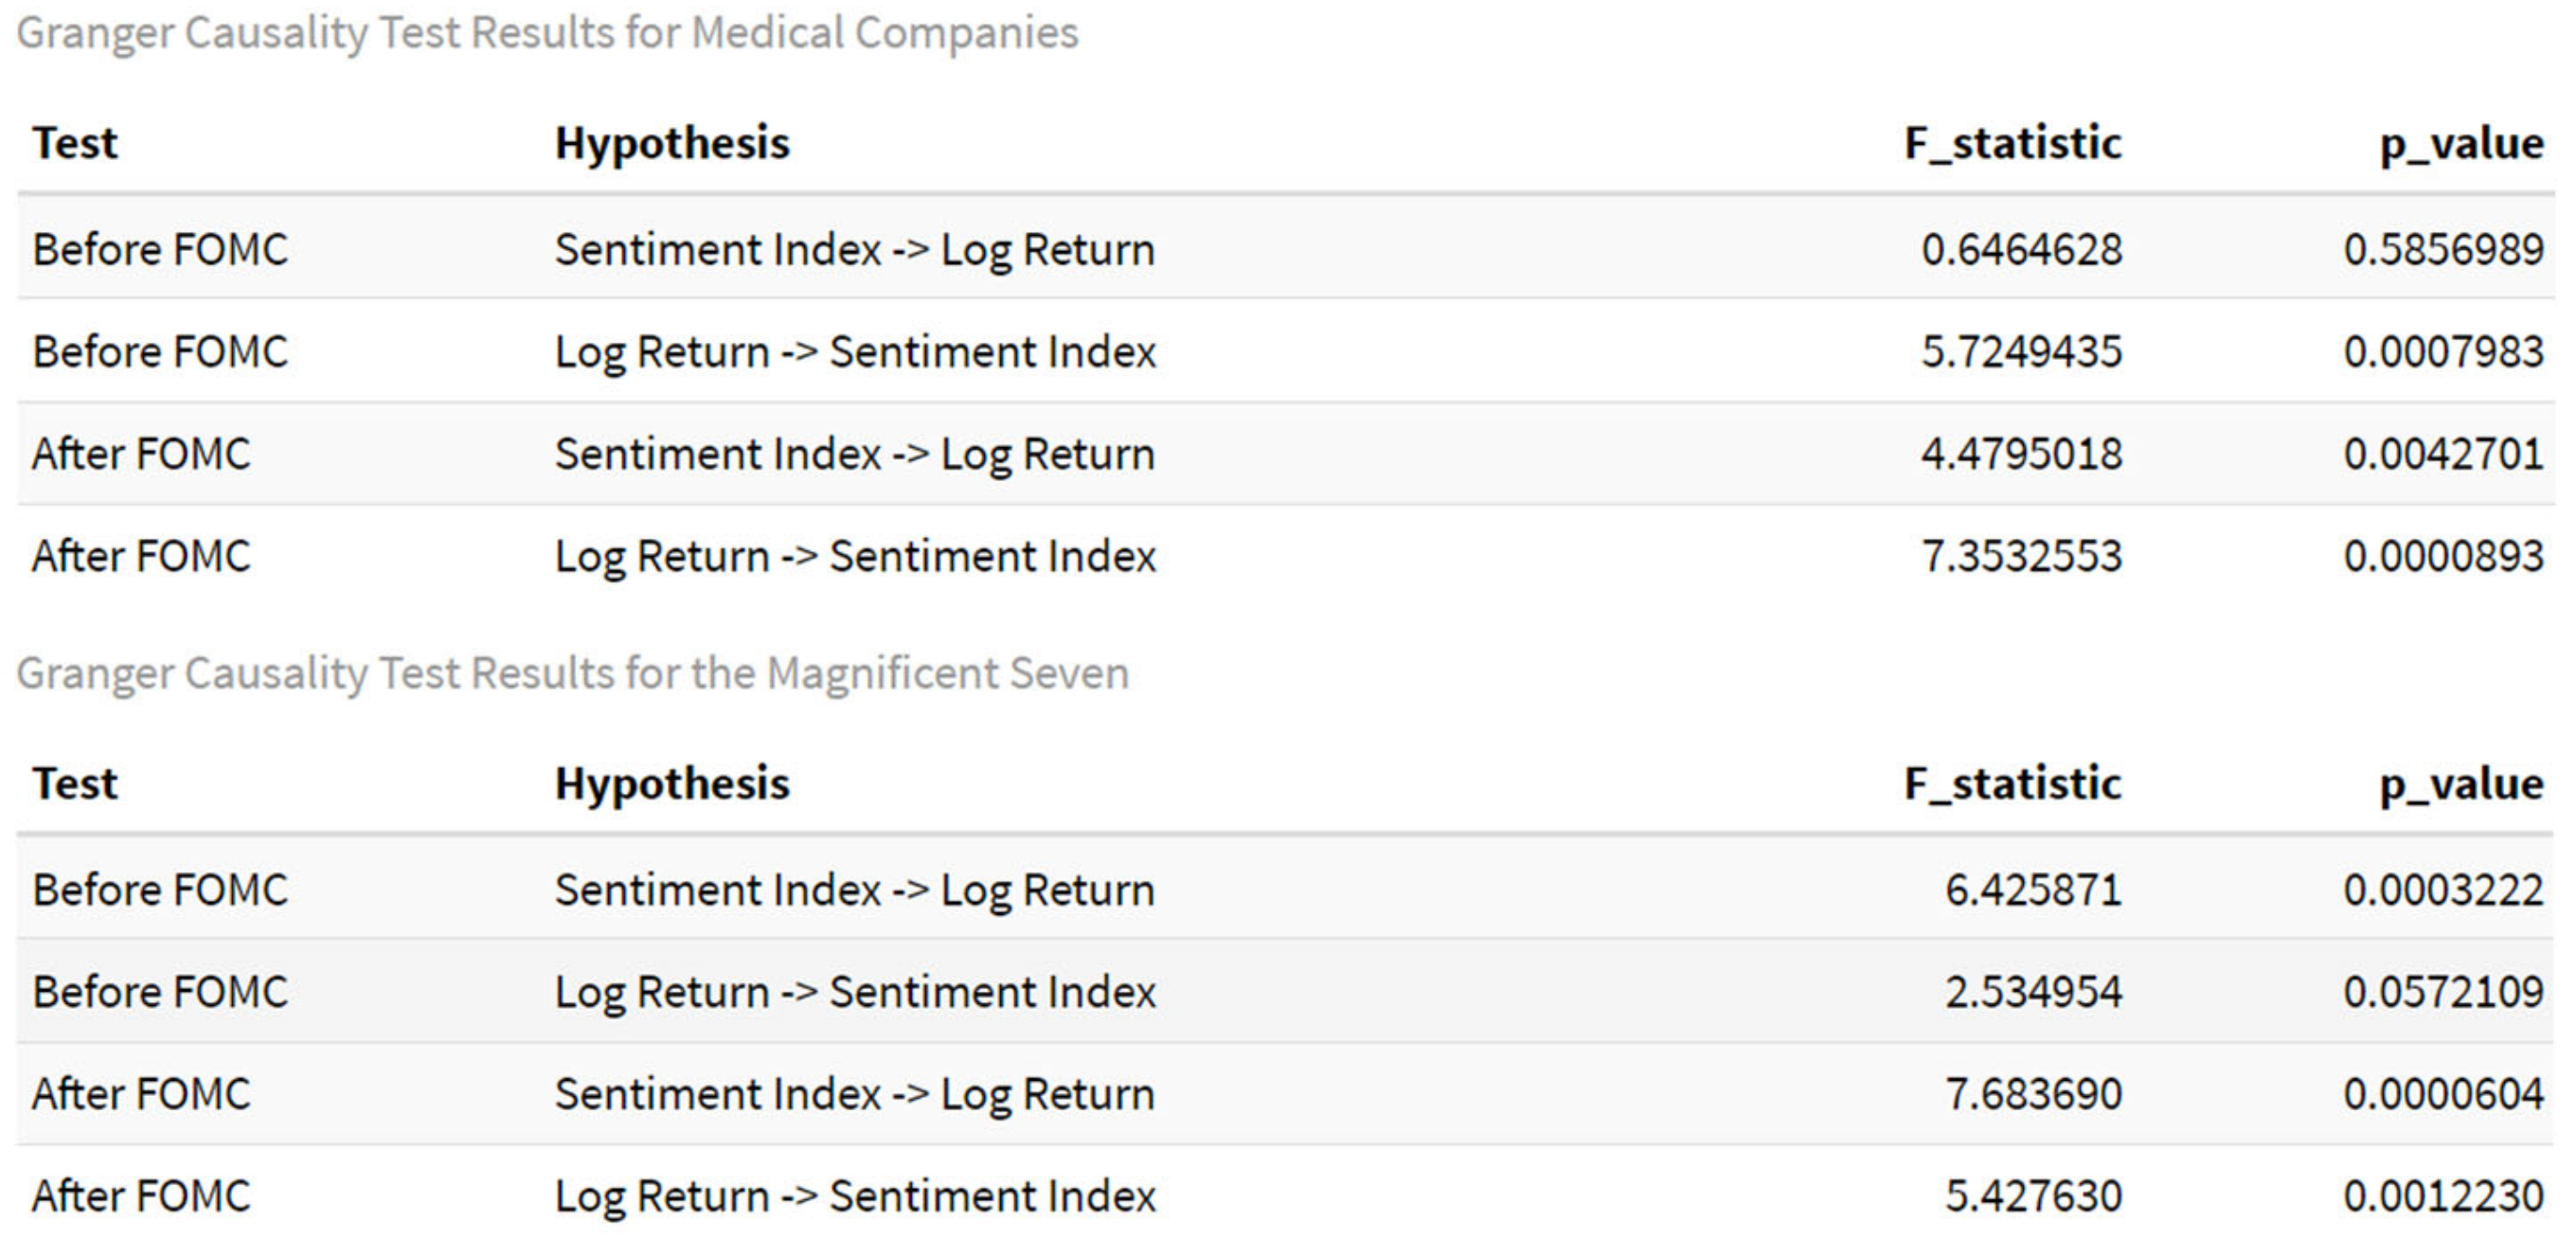
Figure 8 illustrates the relationship between the monthly log returns of stocks—both before and after Fed meetings—and the sentiment index. For each scenario, we performed two key operations.
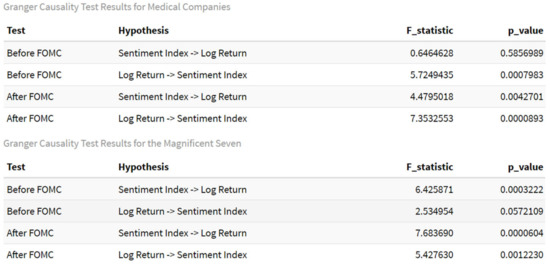
Figure 8.
Granger causality test results for the log returns of medical companies’ stocks and the Magnificent Seven’s stocks.
Forward Granger causality test:
This test assesses whether the sentiment index affects the monthly log returns of stocks before the Fed meeting.
Reverse Granger causality test:
This test evaluates whether the monthly log returns of stocks before the Fed meeting influence the sentiment index.
We applied the same operations to the monthly log returns of stocks after the Fed meeting to investigate potential causal relationships between market behavior and sentiment indices. Specifically, Granger causality tests were used to analyze the statistical significance of these relationships. A p-value below 0.05 indicates that we reject the null hypothesis, suggesting that one variable significantly contributes to predicting changes in another. Conversely, a p-value above 0.05 suggests no strong causal relationship between the variables.
For instance, the monthly log returns of medical companies before the Fed meeting exhibit predictive power over the sentiment index (p-value = 0.0008 < 0.05). This finding suggests that market behavior prior to the meeting may provide insights into the sentiment reflected in the Fed’s statement. However, the reverse relationship does not hold: the sentiment index does not significantly influence the monthly log returns before the meeting (p-value = 0.59 > 0.05). This result aligns with the logical premise that the statement cannot retrospectively predict market behavior that occurred prior to its release.
Interestingly, it was surprising to find that the monthly log returns of medical companies could predict the sentiment index to some extent. Our initial analysis, which focused on linear relationships at specific time points, suggested no such relationship. This unexpected result underscores the value of temporal analyses like the Granger causality test in uncovering nuanced relationships that may not be evident from simpler correlation analyses.
For the Magnificent Seven companies (Alphabet, Amazon, Apple, Meta, Microsoft, Tesla, and NVIDIA), we conducted a detailed analysis to understand the relationship between their monthly log returns and the FOMC’s sentiment index. The results reveal a strong causal relationship between the sentiment index and the monthly log returns, both before and after Fed meetings.
Before the meeting:
The sentiment index significantly predicts the log returns of these companies, with a p-value of 0.0003 (<0.05). However, the reverse relationship—where the log returns predict the sentiment index—is not statistically significant, with a p-value of 0.0572. Although not below the conventional threshold, this proximity suggests a potential weak influence.
After the meeting:
A strong bidirectional relationship emerges. The sentiment index significantly affects log returns (p-value = 0.00006 < 0.05), and the log returns also significantly influence the sentiment index (p-value = 0.0012 < 0.05). These findings imply that the Fed’s statements not only impact the stock returns of these major companies, but that their performance may also reflect or influence the broader market’s sentiment after the meetings.
Linear analyses, such as line graphs or contemporaneous regression, do not show strong correlations between sentiment indices and monthly log returns either before or after the Fed meetings. This lack of a direct relationship suggests that sentiment indices and market returns are not strongly related at specific time points.
However, the Granger causality test introduces a time-lagged perspective, allowing us to assess whether past sentiment indices provide predictive information about future market returns. This analysis suggests that historical changes in sentiment indices can predict future market behavior, even when no strong contemporaneous correlation is present. It reflects the delayed effect of policy changes after Fed meetings, as markets take time to fully absorb and respond to these shifts.
Post-meeting policy changes, such as interest rate decisions, often introduce uncertainty into the market which is reflected in shifts in sentiment indices. The Granger causality tests demonstrate how historical changes in sentiment indices influence market reactions to future uncertainties, providing investors with a valuable tool for anticipating market developments and mitigating potential risks. For instance, if negative sentiment indices are historically found to correlate with downward market corrections after Fed meetings, investors could preemptively reduce their exposure to risky assets. Similarly, tracking sentiment indices post-meeting enables traders to identify early signs of market adjustments before these shifts are fully reflected in stock prices. This predictive capability allows investors to hedge against risks, strategically reallocate resources to more stable assets, and reduce portfolio volatility across both medical and technology sectors. Such insights are critical for understanding the dynamic interplay between monetary policy decisions and market behavior, helping investors optimize their strategies in response to sentiment-driven trends.
The gradual weakening of monthly log returns prior to Fed meetings suggests that investors may become increasingly cautious in anticipation of potential tightening signals in Fed’s statements. This forward-looking behavior emphasizes the anticipatory nature of market dynamics ahead of key policy announcements.
Our findings have significant implications for the investment community, particularly in developing investment strategies and risk management practices. The analysis suggests that positive sentiment indices ahead of FOMC meetings correlate with a strong performance in technology stocks, such as Alphabet and Tesla, presenting a potential short-term trading opportunity within the technology sector. In contrast, the subdued response of healthcare stocks highlights their stability, making them appealing investments for those seeking resilience during periods of economic uncertainty. Furthermore, the results of the Granger causality study suggest a predictive relationship between the FOMC’s sentiment index and stock returns, enabling investors to effectively hedge risk by monitoring sentiment trends. This allows for portfolio optimization by strategically reallocating between volatile technology stocks and stable healthcare assets based on monetary policy signals. By focusing on the unique responses of these sectors, this study demonstrates how monetary policy communication influences market behavior, providing actionable insights for investors to make informed decisions and adjust strategies in line with sector-specific sensitivities.
In conclusion, the correlation analysis highlights that prior to Fed meetings, technology companies benefit from positive investor expectations, often driven by forward-looking market sentiment, resulting in a stronger stock performance. However, after the meetings, as policy uncertainty increases—such as the potential for interest rate hikes—investor caution grows, leading to more complex or negative impacts on stock performance. In contrast, the stable performance of healthcare companies indicates a reduced sensitivity to FOMC’s sentiment fluctuations, underscoring their resilience to macroeconomic shifts. This dichotomy emphasizes the differing responses between capital-intensive technology firms and the healthcare sector to economic policy decisions. Additionally, the Granger causality analysis reveals that the FOMC’s sentiment index can predict monthly log returns for medical companies, and these returns, in turn, reflect the sentiment index of Fed meetings. This finding equips companies and investors with the tools to anticipate future market behavior by leveraging sentiment data from both before and after specific Fed actions, allowing them to prepare effectively for potential policy shifts.
7. Discussion
7.1. Contribution Summary
Relating to Existing Literature
Study in [3] established the significant influence of monetary policy on financial markets, particularly in shaping asset prices and market expectations. However, these studies predominantly focus on immediate asset price responses and lack an interdisciplinary perspective that considers public health metrics. Our research extends this line of inquiry by integrating advanced natural language processing (NLP) techniques, specifically transformer models, to derive sentiment indices from FOMC’s statements. These indices are then correlated with both stock performance and public health outcomes, providing a broader understanding of monetary policy’s societal impacts.
While earlier work, such as [22], explored the impact of investor sentiment on small-cap stocks during periods of market volatility, our analysis examines how the macroeconomic sentiment influences sector-specific dynamics, particularly in technology and healthcare. Notably, the weak correlation between the positive sentiment and reduced anxiety rates observed in our study underscores the complex interplay of socio-economic factors that require further investigation. This finding highlights the need for a more nuanced approach to understanding how monetary policy communication extends beyond financial markets to affect public well-being.
Our study examines how the language and statements in Federal Reserve’s communications influence emotional states (e.g., positive or negative sentiment) through the use of a transformer model. Using the sentiment index calculated for each quarterly Fed’s statement, as described in our methodology, we correlated these indices with healthcare costs and mental health trends. The analysis focused on the period from 2019 to 2023 due to the significant impact of the COVID-19 pandemic, which served as a dominant factor influencing both economic markets and public health.
The pandemic emphasized the critical importance of understanding how monetary policies, as reflected in FOMC’s statements, affected healthcare spending and mental health during this unprecedented time. Our primary objective was to evaluate the impact of positive or negative monetary policies on healthcare costs through correlation analysis. By bridging financial, technological, and healthcare sectors, this study offers a comprehensive view of how central bank communications impact not only markets, but also societal well-being.
In addition, we explored the potential effects of economic policies on mental health. Due to data limitations, we analyzed the prevalence of anxiety and depression from 2019 to 2021. Our findings suggest that economic policies may have differing effects on mental health, such as a reduction in anxiety but an increase in depression. These variations could be influenced by factors beyond monetary policy, including the psychological toll of the pandemic or stress related to a work–life balance. The limited dataset also leaves open the possibility that some results occurred by chance.
Despite these constraints, the insights derived from existing data provide meaningful trend analyses. These findings offer valuable perspectives for understanding the intersection of economic policies, healthcare, and mental health, contributing to future research and informing policymaking in medical and social development contexts.
We also leveraged stock data from the Investing website to calculate monthly log returns for two types of companies—the Magnificent Seven and medical companies—before and after FOMC’s statements. By combining the sentiment index with log return data from two months before and after Fed meetings, we compared the differences between these two groups. While we observed a positive correlation between technology companies and the sentiment index before FOMC meetings, this correlation often weakened or turned negative afterward. In contrast, medical companies demonstrated a more stable range of log returns, or even no significant impact from FOMC’s statements. This suggests that healthcare stocks are less sensitive to market sentiment influenced by FOMC’s announcements.
These findings align with the work of [23], who observed that policy announcements tend to create short-term volatility spikes, particularly in high-growth sectors like technology. This underscores the contrasting sensitivity of these two sectors to monetary policy announcements. However, while the initial linear correlation analysis did not reveal significant relationships, the Granger causality test demonstrated that medical companies do have a relationship with the FOMC’s statement’s sentiment index. Specifically, the sentiment index can predict the monthly log returns for medical companies, and these returns, in turn, can reflect changes in the sentiment index. This suggests that, although medical companies may appear less reactive to the immediate market sentiment, their performance is still linked to broader economic signals from Fed policy actions. These insights enable companies to better anticipate market movements by utilizing known sentiment indices from before and after specific points in time, thereby preparing more effectively for future Fed actions.
Our study makes significant contributions in three key areas.
Sector-specific analysis
This study bridges a gap in the literature by analyzing the distinct responses of two critical sectors—technology (Magnificent Seven) and healthcare—to FOMC’s sentiment. This sector-specific approach provides insights directly relevant to investment strategies and market behavior. These findings align with the work of [24], who demonstrated that FOMC’s sentiment strongly predicts the immediate reactions of large-cap technology stocks. While [22] found that investor sentiment has a greater impact on small-cap stocks during volatile market periods, our examination of large-cap stocks across both sectors adds a unique perspective to the existing literature.
Insights on sentiment and stock performance
By employing Granger causality tests, we reveal the predictive relationship between FOMC’s sentiment and the performance of major stocks. This analysis adds a temporal dimension beyond a simple correlation, offering a deeper understanding of how market reactions evolve pre- and post-Fed-announcements.
Integration of public health and financial data
Beyond stock markets, this research explores the broader societal implications of monetary policy, linking FOMC’s sentiment to healthcare expenditure and mental health metrics. This interdisciplinary approach expands the scope of monetary policy analysis to include public health outcomes, an often overlooked area in economic research.
It is important to note, however, that the absence of strong or significant correlations in certain areas does not detract from the value of this research. The lack of clear relationships between monetary policies and trends such as healthcare costs or mental health outcomes may indicate the influence of other factors. These include the pandemic or broader socio-economic conditions, which may play a more dominant role. This suggests that, while monetary policy does impact market sentiment, its influence on healthcare spending and mental health may be more nuanced and dependent on other variables, requiring further research and more comprehensive data to fully understand these complex dynamics.
While our study makes significant contributions, it is also essential to acknowledge its limitations and propose directions for future research.
7.2. Limitations and Future Directions
Our study faces several limitations that should be considered when interpreting the findings.
Data constraints:
The analysis is restricted by the availability and granularity of public health and financial data. For instance, mental health data were only available for a limited period (2019–2021), which may not fully capture the long-term effects of FOMC’s sentiment on public health trends. Similarly, the financial data may not account for sector-wide variability beyond the companies analyzed.
Model limitations:
The transformer model used for sentiment analysis may not fully account for contextual subtleties or implicit meanings in FOMC’s statements. This limitation could result in underestimating or overestimating the sentiment’s true impact, particularly in areas where nuanced or indirect messaging plays a significant role.
Causality limitations:
While Granger causality tests are effective in identifying temporal relationships, they do not establish true causality. Observed relationships may be confounded by unobserved factors such as local politics, economic conditions, or cultural influences that fall outside the scope of this study.
Future directions
Building on these limitations, future research could focus on the following areas.
Expanding sector coverage and timeline:
Including additional sectors such as energy, finance, or consumer goods, and analyzing data over a longer timeframe, could help determine whether the observed patterns hold across industries with varying sensitivities to monetary policy.
Advancing NLP techniques:
Exploring more advanced and domain-specific natural language processing (NLP) techniques could enhance the accuracy of sentiment analysis. Methods that capture finer contextual embeddings or employ specialized lexicons for financial and policy texts may better account for nuanced messaging in FOMC’s statements.
Global comparisons:
Investigating whether similar trends exist for other central banks, such as the European Central Bank (ECB) or the Bank of England, could provide insights into whether these effects are unique to the U.S. context or part of broader global phenomena.
8. Conclusions
This study analyzed FOMC’s statements from 2019 to 2023 to understand their impact on healthcare spending, mental health, and stock performance, particularly during the COVID-19 pandemic. Using advanced NLP models, we created a sentiment index for each statement and correlated it with public health and stock market data.
Our findings suggest that positive monetary policies can boost public confidence and healthcare spending, while mental health outcomes are more variable, likely influenced by factors beyond monetary policy, such as the pandemic’s broader effects. In terms of stock performance, technology companies were more reactive to the pre-announcement sentiment, whereas medical companies demonstrated greater stability. The Granger causality test further revealed that, while healthcare stocks appeared less sensitive at first, they exhibited a predictive relationship with the sentiment index, indicating a lagged response to monetary policy signals.
While these findings offer valuable insights, they are not without limitations. Constraints such as limited data availability and potential confounding factors underscore the need for further research. Future studies with more comprehensive datasets and extended analyses could help clarify the broader impacts of monetary policies on public health and market dynamics.
Author Contributions
All the authors have made significant contributions to this review. D.L.; data curation, writing—review and editing, original draft preparation, visualization, software, and formal analysis., investigation. J.-M.K.; conceptualization, writing—review and editing, resources supervision, methodology, funding acquisition. All authors have read and agreed to the published version of the manuscript.
Funding
This study has not received funding from any external agencies.
Informed Consent Statement
Not applicable for this research.
Data Availability Statement
All data and related Python code can be accessed through the related database websites. https://github.com/13954380607/Dongnan-Liu/tree/main accessed on 30 August 2024.
Acknowledgments
The authors thank the editors of the journal and anonymous reviewers for their relevant suggestions and comments.
Conflicts of Interest
The authors declare no potential conflicts of interest with respect to the research, authorship, and/or publication of this article.
References
- Bonitatibus, S. Measuring the Health Outcomes of Social, Economic, and Environmental Policies. Available online: https://www.americanprogress.org/article/measuring-the-health-outcomes-of-social-economic-and-environmental-policies/ (accessed on 21 April 2022).
- Smith, J. Consequences and predictors of new health events. In Analyses in the Economics of Aging; Wise, D.A., Ed.; University of Chicago Press: Chicago, IL, USA, 2005; pp. 213–237. [Google Scholar] [CrossRef]
- Gürkaynak, R.S.; Sack, B.; Swanson, E. Do actions speak louder than words? The response of asset prices to monetary policy actions and statements. Int. J. Cent. Bank. 2005, 1, 55–93. [Google Scholar]
- Eklund, J.; Kim, J.M. Forecasting Consumer Price Index with Federal Open Market Committee Sentiment Index. J. Forecast. 2024, 43, 1795–1813. [Google Scholar] [CrossRef]
- Fatouros, G.; Soldatos, J.; Kouroumali, K.; Makridis, G.; Kyriazis, D. Transforming sentiment analysis in the financial domain with ChatGPT. Mach. Learn. Appl. 2023, 14, 100508. [Google Scholar] [CrossRef]
- Wessel, D.; Milstein, E. What Did the Fed Do in Response to the COVID-19 Crisis? Brookings. Available online: https://www.brookings.edu/articles/fed-response-to-covid19/#:~:text=In%20response%2C%20the%20Fed%20set,the%20program%20from%20Treasury%2C%20which (accessed on 2 January 2024).
- Pan, R.; García-Díaz, J.A.; Garcia-Sanchez, F.; Valencia-García, R. Evaluation of transformer models for financial targeted sentiment analysis in Spanish. PeerJ Comput. Sci. 2023, 9, e1377. [Google Scholar] [CrossRef]
- Kupcová, I.; Danišovič, Ľ.; Klein, M.; Harsanyi, S. Effects of the COVID-19 pandemic on mental health, anxiety, and depression. BMC Psychol. 2023, 11, 108. [Google Scholar] [CrossRef] [PubMed]
- Tadle, R.C. FOMC minutes sentiments and their impact on financial markets. J. Econ. Bus. 2022, 118, 106021. [Google Scholar] [CrossRef]
- Li, F. The information content of forward-looking statements in corporate filings—A naïve Bayesian machine learning approach. J. Account. Res. 2010, 48, 1049–1102. [Google Scholar] [CrossRef]
- Yeoh, E.D.; Chung, T.; Wang, Y. Sentiment analysis and investment decision making: Exploring the role of emotional factors in Bursa Malaysia with selected stocks during COVID-19. In Opportunities and Risks in AI for Business Development; Springer: Berlin/Heidelberg, Germany, 2024; pp. 23–38. [Google Scholar] [CrossRef]
- Vaswani, A.; Shazeer, N.; Parmar, N.; Uszkoreit, J.; Jones, L.; Gomez, A.N.; Kaiser, L.; Polosukhin, I. Attention is all you need. arXiv 2017, arXiv:1706.03762. [Google Scholar]
- Sanh, V.; Debut, L.; Chaumond, J.; Wolf, T. DistilBERT, a distilled version of BERT: Smaller, faster, cheaper and lighter. arXiv 2019, arXiv:1910.01108. [Google Scholar]
- Shrivastava, V. Sentiment Analysis Using Transformers. Analytics Vidhya. Available online: https://www.analyticsvidhya.com/blog/2022/02/sentiment-analysis-using-transformers/ (accessed on 8 February 2022).
- Granger, C.W.J. Investigating causal relations by econometric models and cross-spectral methods. Econometrica 1969, 37, 424–438. [Google Scholar] [CrossRef]
- Engle, R.F.; Granger, C.W.J. Co-integration and error correction: Representation, estimation, and testing. Econometrica 1987, 55, 251–276. [Google Scholar] [CrossRef]
- Shojaie, A.; Fox, E.B. Granger causality: A review and recent advances. Annu. Rev. Stat. Appl. 2022, 9, 289–319. [Google Scholar] [CrossRef] [PubMed]
- Sheikh, S. Mastering GARCH Models for Financial Time Series: Advanced Volatility Forecasting. Medium. Available online: https://medium.com/@sheikh.sahil12299/mastering-volatility-forecasting-with-garch-models-a-deep-dive-into-financial-market-dynamics-8df73c037b7e (accessed on 23 November 2024).
- Ye, H.; Wu, Y.; Zhang, Z.; Li, F. Sentiment analysis using VADER: Application to FOMC statements. Mathematics 2022, 10, 1307. [Google Scholar] [CrossRef]
- Tatman, R. Sentiment Analysis in R; Kaggle: San Francisco, CA, USA, 2017; Available online: https://www.kaggle.com/code/rtatman/tutorial-sentiment-analysis-in-r (accessed on 6 December 2024).
- Ozdagli, A.; Weber, M. Monetary Policy Through Production Networks: Evidence from the Stock Market; Becker Friedman Institute for Economics: Chicago, IL, USA, 2024; Available online: https://bfi.uchicago.edu/wp-content/uploads/paper_OW.pdf (accessed on 23 November 2024).
- Baker, M.; Wurgler, J. Investor sentiment and the cross-section of stock returns. J. Financ. 2006, 61, 1645–1680. [Google Scholar] [CrossRef]
- Corbet, S.; Dunne, J.J.; Larkin, C. Quantitative easing announcements and high-frequency stock market volatility: Evidence from the United States. Res. Int. Bus. Financ. 2019, 48, 219–227. [Google Scholar] [CrossRef]
- Osowska, M.; Wójcik, D. Predicting the reaction of financial markets to Federal Open Market Committee post-meeting statements. J. Financ. Technol. 2024, 6, 145–175. [Google Scholar] [CrossRef]

Disclaimer/Publisher’s Note: The statements, opinions and data contained in all publications are solely those of the individual author(s) and contributor(s) and not of MDPI and/or the editor(s). MDPI and/or the editor(s) disclaim responsibility for any injury to people or property resulting from any ideas, methods, instructions or products referred to in the content. |
© 2025 by the authors. Licensee MDPI, Basel, Switzerland. This article is an open access article distributed under the terms and conditions of the Creative Commons Attribution (CC BY) license (https://creativecommons.org/licenses/by/4.0/).