Abstract
Multidisciplinary design and construction teams are challenged to communicate and coordinate across complex building systems, including architectural, structural, mechanical, electrical, and piping (MEP). To support this coordination, disciplinary 3D models are combined and coordinated before installation. Studies show that besides the use of 3D models, industry professionals sketch building components to discuss coordination issues and find resolutions that require them to recall the building components in the model. In current practices, 3D models are explored with Building Information Modeling (BIM) tools presented on 2D screens, while Virtual Reality (VR) can provide users with an immersive environment to explore. This paper presents the results of an experiment that studied the effects of VR’s immersive environment on the participants’ complex MEP system recall compared to BIM via sketching. The comparison criteria were the 3D geometry properties of the piping system and the users’ self-awareness in the model categorized under color, shape, dimension, piping, and viewpoint. The results showed significant improvement in recall of shape, dimension, and piping when the model was explored in VR.
1. Introduction
Construction projects require the coordination of different Architecture, Engineering, and Construction (AEC) disciplines with complex designs. Traditionally, the coordination process is based on 2D drawings. Visualizing complex building systems in this method is difficult, and accommodating design changes are challenging [1]. With the introduction of Building Information Modelling (BIM) to the industry, AEC professionals now use 3D models for coordination among various trades. BIM authoring software creates scaled, parametric, and object-oriented 3D models for building systems [2]. BIM review software combines different building system models into a single model, called the federated model [3], and determines the conflicts between the systems by comparing disciplinary-specific 3D models in a process called 3D coordination [4]. The 3D coordination process has brought high value to construction projects by resolving field conflicts before installation [5]. Project team members are familiar with their scope-specific model. They are exposed to the federated model in the 3D coordination process, which contains a combination of building systems, including architectural, structural, mechanical, electrical, and piping (MEP), and it continuously gets updated with additional details or changes required for resolving the system conflicts throughout the project. It is crucial for team members to understand the federated model and the relevance of the scope-specific models to each other to communicate the design issues and system conflicts and suggest resolutions. While BIM supports design issue definition, AEC team members need to brainstorm to resolve problems and make decisions [6]. Current BIM user interfaces, such as shared screen displays, do not support these problem-solving interactions. Observational study results showed that to work through problems together, AEC professionals draw sketches of the building components on paper or whiteboards to discuss design issues and recommend resolutions [6,7]. Sketching is based on a memory task that requires recall of the objects to be drawn [8]. Unlike BIM, which presents 3D models on 2D screens, Virtual Reality (VR) is a technology that provides an environment for the user to be immersed in the model. This research takes up the question of whether immersive VR supports users’ ability to recall the building system configurations to sketch building components for discussing design conflicts in the 3D coordination process.
1.1. Virtual Reality
Virtual Reality (VR) is a technology that simulates the reality human beings experience in the real world. It is a computer-aided technology that gives the user an illusion of being in a virtual world [9]. Immersive VR hardware fall under two categories: projected systems and head-mounted display (HMD). In projected systems, a 3D model is projected on a curved screen or walls, ceiling, and floor of a large room-sized cube [10]. The HMD is worn over the head that blocks the user’s view of the physical environment. It projects the digital world as images to each eye of the user, simulating the natural optic function that provides an immersive 360-degree environment for the user to explore. The HMD systems that provide three degrees of freedom (3DOF) track the head’s three rotational movements around the x, y, and z axes, which are also called pitch, yaw, and roll. The six degrees of freedom (6DOF) HMD systems track the rotational movements and capture the user’s location. With 3DOF HMD, users are fixed in one location and can explore the model with head rotations. They can move in the space without actual physical movement by utilizing controllers or navigation tools in the interface, or be teleported, meaning users hypothetically transfer from one point to another without traversing the space between them. On the other hand, 6DOF HMD allows users to walk in the digital space like a physical setup while exploring with head movements. The HMD systems are more affordable than projected systems and require less maintenance cost.
Among the building systems, the architectural system has been the main focus in the AEC research studies using VR. These studies found VR to be a useful tool for understanding architectural designs and their layouts, including the architectural design review of campus buildings [11,12], courtrooms [13,14], hospitals [15,16], hotels [17], and office buildings [18]. A few studies reviewed MEP systems with VR. In Zaker and Coloma (2018)’s study, a BIM modeler and an MEP installer explored a complex MEP system in a service room of a building with 6DOF HMD. They checked the system conditions, equipment maintenance space, conflicts of MEP with architectural and structural systems, and installation processes. Participants found this simulation useful for 3D coordination in day-to-day design review practice [19]. Liu et al. (2020) observed a large number of design review meetings with projected VR that included both AEC professionals and the owner’s facility maintenance staff, who found VR to be a useful tool to evaluate the design for operation and maintenance. However, the research team found that VR alone is not enough for efficient design review meetings and needs to be incorporated with other visual media, such as drawings and models [20]. Han and Leite (2021) conducted an experiment on the design review of a facility with a complex piping system. The results showed a significant increase in participants’ performance using 3DOF HMD compared to a desktop in detecting design errors and planning for construction sequence [21]. Astaneh Asl and Dossick (2022) conducted an experiment to compare remote AEC team collaboration efficiency using 3DOF HMD versus BIM and videoconferencing on a desktop for the coordination of architectural, structural, and MEP systems. The results showed an improvement in team performance in VR compared to BIM [22].
1.2. Memory Recall
The design seems inconceivable without drawings. In construction projects, drawings and sketches are used at all stages of design [23]. Design thinking is a dialectic between different forms of ‘seeing’ that draw on different cognitive processes and knowledge types [24]. Sketching and cognition are closely coupled [8]. Cognitive processes and structures are reflected in sketching structures [25]. Drawing from memory requires a generation process that recalls an image from the visual representation in memory [26]. Memory is derived from a cognitive map, also called a mental map [27]. That mental map is an inner visualization of routes and environmental relationships that includes object–environment relationships [28]. Mental mapping relies on two different concepts of remembering environmental layouts and target points [29]. A map might be created by exposure to the real environment or origins from symbolic abstractions of the environment [30]. The creation of a mental map is trained most when a sense of body position, movements, and acceleration is provided [31]. Since VR technology simulates reality through a digital abstraction of the environment and allows users to feel present in its digital world to explore, research studies have been conducted on the effects of VR on memory recall [32].
Prior studies on 3D model recall using VR in the context of buildings are mainly focused on the building layout, geometric shapes, and photos. Ruddle et al. (1999) studied the effects of exploring models with 3DOF HMD on users’ recall of building spaces in comparison with a desktop monitor. Users were asked to learn the layout of two large virtual buildings with more than seventy rooms. They were then asked to find five specific spaces in the building. The results showed that users could find the spaces quicker in VR with less wasteful movements [33]. Brooks et al. (1999) conducted a study with a desktop VR and compared the model recall of two groups of participants, the Active group, who controlled camera navigation using a joystick, and the Passive group, who observed the navigation. Groups explored a building with four spaces and four pieces of furniture. The Active group showed better recall of the spatial layout, while no significant differences were observed in the recall of objects and their locations. However, prior to these assessments, subjects were asked to draw the layout of the rooms shortly after navigation. The accuracy of these drawings was determined through a scoring system. The results showed a significant benefit in spatial recall performance for subjects in the Active group [34]. This outcome was consistent with Attree et al. (1996), who also found a significant benefit of active navigation on memory for the spatial layout of a set of rooms [35]. Richardson et al. (1999) compared the performance of two groups in learning a layout of a campus building using 2D plans, desktop VR, and a physical walk-through of the building. They concluded that participants using VR had a similar cognitive mechanism for layout recall as those who explored the building physically, but users could be disoriented in the VR [36]. Mania et al. (2003) studied the recall of object locations with different geometric shapes using 3DOF HMD. The results show that participants had more confidence in their responses and were more accurate when they memorized the model with immersive VR instead of the desktop monitor immediately after exposure to the virtual model. However, the accuracy and confidence in responses dropped considerably after one week, and model recall was independent of the hardware they used to explore the model [37]. Wallet et al. (2011) conducted a study in which two virtual versions of a city were created; one included buildings without color or texture, and the other included buildings with color, textures, and details. The study used projected VR with a joystick for navigation. Participants were asked to: (1) reproduce the virtual route in the real world, (2) draw the visualized route, and (3) arrange a set of images taken along the route in chronological order. Participants who learned the route in the detailed virtual environment performed significantly better on all three assessment methods [38].
When working on memory research, the concept of a memory palace can be useful. A memory palace is an ancient memorization technique where non-spatial information is associated with different aspects of the imagined environment, such as people, objects, or rooms, to assist in their recall [39]. Krokos et al. (2019) conducted a comparative experiment with 3DOF HMD and a desktop monitor where photos of famous characters were distributed in space located at different parts of a furnished room. The results revealed that VR improved recall accuracy compared to the desktop platform [40]. Reggente et al. (2019) conducted an experiment with three unique virtual environments with different architectural designs serving as memory palaces. In each memory palace, participants saw a sequence of fifteen 3D objects using 6DOF VR. The experimental group could click on each object to lock it in place, while the control group did not have this capability. The results showed that the experimental group recalled significantly more objects compared to the control group [41]. Gerald et al. (2021) provided two buildings with different architectural designs of Palladian and Curved as memory palaces for the participants to explore with 6DOF HMD and remember playing cards that were distributed in various places. The Palladian design had straight walls with multiple interconnected rooms. The Curved design had curved walls with no symmetric arrangements of architectural structures but few routes for the participants to choose to explore the building. Overall, the participants remembered significantly more cards when using VR than a desktop. No statistical differences were found in the effects of architectural design on memory recall [42].
Prior research studies show that memory recall is improved using VR compared to a desktop. In the context of buildings, these studies focused on the recall of architectural building layouts, focused on the location of walls in the plan, and simple geometric shapes. MEP systems, such as pipes and ducts, have smaller dimensions compared to architectural components, such as doors and walls. They have rectangular or circular cross-sections that are continued in their route. Previous studies have mainly been conducted by researchers from non-AEC fields, including computer science and psychology. This is the first study of its kind in terms of studying the recall of MEP systems from the perspective of AEC professionals and their needs. This research study aimed to examine if VR’s immersive environment can assist with users’ recall of complex MEP systems and their layout compared to current practices of exploring 3D models on 2D screens with the goal of design experts’ ability to understand each other’s systems and to sketch building components in 3D coordination processes.
2. Materials and Methods
A controlled experiment was designed to study the effects of VR’s immersive environment on the federated model recall compared to BIM’s representation of the 3D model on a 2D screen. In the experiment, BIM was set as the control platform, and questionnaires were designed to collect the data. The experiment was conducted through an in-class activity assignment in a graduate-level Virtual Construction course. Student participants worked individually in two groups assigned by the research team where they needed to explore two different but comparable complex federated models of architectural, structural, and MEP systems in the BIM and VR platforms, with the design review focusing mainly on the piping system and its relationship to other building systems.
The experiment was conducted in the sixth week of the class. To help students prepare for this assignment, they were trained for a total of five hours to perform design reviews and 3D coordination with BIM and VR in the first five weeks of the class. Students then applied their skillsets in two homework assignments and a group project on a medical building with complex MEP systems. They were exposed to a total of eight federated models before the experiment.
2.1. Participants
The experiment participants were twenty-four graduate students enrolled in the Virtual Construction course. In the first week of the class, students’ educational background, industry experience, and previous experience with BIM and VR were surveyed to assist in grouping them into comparable teams to reduce the effects of background experience on the results. Students’ educational backgrounds were mainly in architecture and civil engineering. The average industry work experience of the participants was three years. Six students had worked as 3D modelers in the industry. They were either exposed to VR a few times or did not have any previous experience.
2.2. Digital Setup
A VR Application (App) was used in this experiment installed on smartphones that supported 3DOF, which tracked the head orientation and enabled the users to look around while they were virtually fixed in one location. This VR App displayed the content by dividing the screen in the middle and presenting each half to the corresponding eye via glasses, called Viewer, which were attached to the screen. Only one type of Viewer was used in this experiment, which had a fixed pupillary distance. To set up a stereoscopic view in the App, a 360-degree spherical image was required. Teleportation could be defined in the interface to link multiple 360-degree spherical images and allow the user to explore the digital world at different locations. The BIM review software practiced in the course was Autodesk Navisworks [43], installed on PCs supporting 6DOF, which allowed users to both look around and walk around virtually inside the model. To design a controlled experiment, there was a need to set up the BIM platform to provide the same 3DOF experience in VR as for the BIM users.
The research study was set up based on the federated model of a mechanical room with complex MEP systems. Figure 1 shows the expanded static 360-degree spherical photos of the mechanical room. To explore the model with BIM, viewpoints were created in Autodesk Navisworks. Viewpoint was a 3D snapshot taken of the model as it was displayed on the screen view. The viewpoints were created from the eye level of an avatar with a height of 5 feet 6 inches. Users were restricted from using the Walk mode to go around the model and change location as it would give them a 6DOF experience. They were only allowed to explore the model using the defined Saved Viewpoints and Look Around navigation tool that enabled them to look around using a computer mouse, which gave them a 3DOF experience for controlled comparison with the VR tool. Users could toggle between the viewpoints by clicking on the two viewpoints in the Navisworks interface. The field of view in Navisworks was set to 90 degrees to replicate the same field of view of the VR App. The VR content was created using the Rendering tools in Autodesk Navisworks. A static 360-degree spherical photo was captured at the location of each viewpoint from the same avatar eye level in BIM. Teleportation was defined to link the viewpoints to enable users to toggle between them in VR during model exploration. In the VR App’s interface, teleportation was seen as a diamond at the location of the other viewpoint. By gazing at it, users were transported to the location of the new viewpoint.
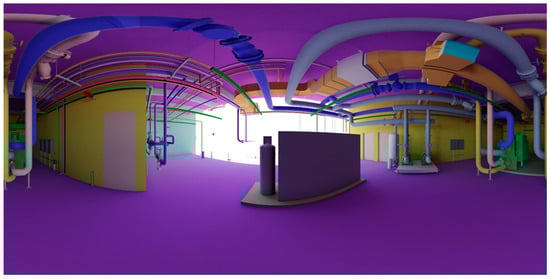
Figure 1.
Expanded 360-degree spherical photo of the mechanical room.
Two models, A and B, with similar building system complexity, were created based on the mechanical room’s federated model using Autodesk Navisworks’ Visibility tool. The mechanical room’s structural and MEP systems were partially visible to the user in models A and B. The architectural model and three large pieces of equipment were kept visible in both models as the benchmark for comparison. Figure 2 shows the expanded 360-degree spherical photos of models A and B captured from two viewpoints and the teleportation setup. The viewpoints were located close to the Northern and Southern walls of the mechanical room.
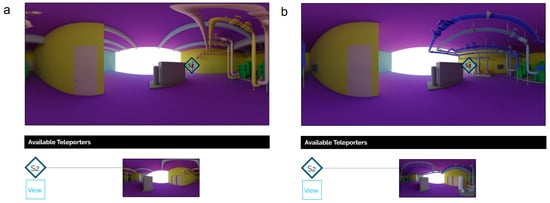
Figure 2.
VR digital setup for (a) Model A and (b) Model B.
2.3. Questionnaires
Two questionnaires of A and B were designed to assess the participants’ model recall that included questions about the federated models of A and B, respectively. The research team specified the model properties that are important in the 3D coordination process and selected them as criteria to be studied in this experiment, and used them in the design of the questionnaire. The list of the study criteria is presented in Table 1. These criteria address the object properties as well as the user’s self-awareness in the model. In current BIM practices, systems are color-coded as specified in BIM execution planning [3]. The color codes help to differentiate the building systems in 3D coordination. Understanding the objects’ shapes and dimensions, as well as their position and location in the model, are crucial criteria that support understanding the interferences of the objects and proposing resolutions. It was also important to study the awareness of users’ location and orientation in the model, as well as their distance from the objects, to address the location of the system conflicts in the model and check for maintenance space. The user’s location and distance from the objects were studied for the user’s self-awareness criteria. To capture the user’s overall understanding of the complex piping system, the piping route was added as a separate criterion. Participants were asked to draw the pipeline in elevation and plan and specify their connection to MEP equipment based on what they recalled from the model.

Table 1.
Mean and standard deviation of accurate model recall by group and model.
Questionnaire A asked the participants to name the colors of five different objects in the model. For Model A, these objects were two pipes, chillers, mechanical equipment, and the floor. Participants were then asked to draw two adjacent parts of equipment, considering the shape and their relative size to each other and the surrounding objects. Given the mechanical equipment in Model A, the participants were expected to show the height of the cylindrical part lower than the cuboid part. They were asked to compare the height of the equipment with the chillers as well as assess their understanding of dimensions. The figures of the chillers in Model A were provided to the participants, as presented in Figure 3a. The equipment’s colors were changed to light gray, as seen in Figure 3, to not provide cues to the users to recall the colors. In Questionnaire B, the colors of two pipes, pumps, tank, and walls were questioned, as were the dimensions and placement of the tank and its feeder, both cylindrical. The feeder’s height was lower than the tank’s, and participants were asked to compare the height of the tank with the adjacent door. The figures of the pumps in Model B were provided to the participants as presented in Figure 3b. Participants were asked to specify the location of the pipe connections to the equipment and draw the piping route in elevation in both questionnaires A and B. An empty plan of the mechanical room, as seen in Figure 3c, was provided in the questionnaires for the participants to show the location of the equipment and their sizes on the plan. They were then asked to draw the pipeline in relevance to the equipment, as well as specifying their own location in the model at the viewpoints on the plan.
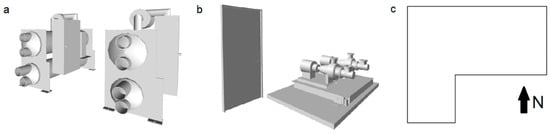
Figure 3.
Questionnaire figures: (a) chillers in elevation, (b) pumps in elevation, (c) mechanical room plan.
2.4. Procedure
The twenty-four participants were divided equally into two experiment groups named BV and VB based on the sequence of the platforms they were exposed to the models, where letter B represented BIM, and letter V represented VR. First, Group BV explored Model A with BIM, and Group VB explored it in VR. Each group was given fifteen minutes to memorize the model. This duration was selected to give students enough time to explore and memorize the model before their eyes feel fatigued in the VR environment based on the VR App company’s recommendation. They were then asked to fill out Questionnaire A. To explore Model B, groups switched the platforms. They were given the same amount of time to memorize the model and were then asked to answer Questionnaire B.
Before participants saw the models, they were given an explanation about the study criteria and what aspects of the design they needed to pay attention to and memorize during model exploration. However, they were not given any information about which specific objects would be in the questionnaires. After they were finished looking at Model A, the participants were asked a number of questions about the model they reviewed to assess how the BIM or VR platforms supported the recall of the object properties of the piping systems and their relevance to each other and to other systems as well as user self-awareness in the model. Figure 4 shows the procedure graphically.
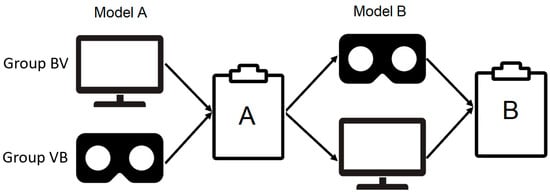
Figure 4.
Experiment Procedure.
3. Results
A point-based system was developed to analyze the model recall data collected from questionnaires A and B. Zero points were considered for no-answer and wrong responses, while 1 point was rewarded for correct answers for each criterion. For the color criterion, the point for accurately recalling each of the five object colors was considered 0.2. For the shape criterion, recalling each shape of the two equipment parts was worth 0.5 points. If the 3D shape was not indicated in the response, but the 2D drawing on the plan could show the shape in 2D for the equipment part, 0.25 points were awarded. Recalling the width, length, and height of each part of the equipment was worth 0.5 points. Specifying the dimension of equipment parts in relevance to each other was worth 0.25 points. The same number of points were given to the dimension recall in relevance to the surrounding objects. Four pipes in each model were connected to the piping equipment. Recalling the connection of each pipe to the equipment was worth 0.25 points for the connection to the equipment criterion. For the four remaining criteria of pipeline position in elevation and plan and location in elevation and plan, each pipe was evaluated separately. Correct responses for each pipe were awarded 0.25 points. The user’s location was evaluated based on the area in the model; it was specified for two viewpoints. Participants were expected to show the location of the first viewpoint close to chillers next to the southern wall and the second viewpoint close to the mechanical equipment next to the Northern wall. Recalling the location for each viewpoint was worth 0.5 points. If the location was specified close to the correct wall but not to the equipment, 0.25 points were awarded. The relative distance of the viewpoint from the wall and equipment was then evaluated by assigning 0.25 point for each distance in each viewpoint.
Although we only had the information on 12 participants in each group, they were each scored 38 times for each of the different criteria. Per Faes et al. (2009) [44], our effective sample size was large enough to draw statistically meaningful conclusions. Table 1 and Table 2 display the mean and standard deviation across each of the twelve criteria for the groups and for each platform, respectively. Table 1 shows that regardless of group, when using VR, the participants performed better or on par, on average, with the exception of object color for the BV group and user location for the VB group, as seen in bold. It should be noted that these differences of 0.03 and 0.06, respectively, are quite small. Additionally of interest, and noted in italics, is for those in the VB group, there were notable declines in the average score when going from using VR in Model A to BIM for Model B for equipment shape and the three different dimension criteria. Table 2 presents the mean and standard deviation of scores for participants using BIM versus VR, regardless of the model. These statistics reveal that participants performed better across all twelve criteria except color, where they performed the same. Figure 5 shows the results graphically.
Table 2.
Mean and standard deviation of accurate model recall by platform.
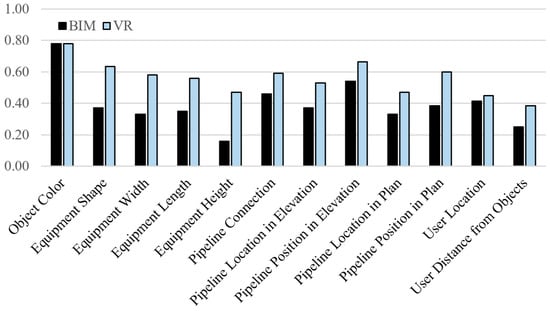
Figure 5.
The accuracy of the federated model recalls in each platform.
As multiple scores were recorded on each participant in the study, there was a positive correlation across the scores in each criterion. The generalized estimation equation (GEE) framework [43] allows us to model the relationship between platform type and model across each of the criteria while using the correlation within participants and across groups to increase efficiency. We assumed an exchangeable covariance matrix which implies that the correlations between the scores on any two criteria for a particular participant are the same. Another benefit of GEE models is that they do not require strict distributional assumptions on the response while still providing consistent estimates of the coefficients [45]. To perform inference on the model coefficients, we used Wald tests with robust standard errors [46]. Our model for the mean scores is provided in Equation (1), along with a description of the explanatory variables in Table 3 and interpretations of all the coefficients in Table 4. It should be noted that we collapsed the twelve criteria into just five criteria to decrease model complexity and enhance interpretability. The five criteria are color, shape, dimension, pipeline, and viewpoint, as seen in Table 2.
Table 3.
Description of explanatory variables in GEE model.
Table 4.
Interpretation of parameters in GEE model.
Equation (1) represents the GEE model for student i = 1, …, 24, criterion j = 1, …, 4, using platform k = 1, 2 (where 1 = BIM, 2 = VR) looking at model l = 1, 2 (where 1 = Model A, 2 = Model B).
The correlation matrix is defined is Equation (2), where α represents the correlation between any two scores for student i, on criterion j.
Indicator variables, as mentioned in the descriptions above, are binary variables that take on a value of 0 or 1 to indicate if the observation belongs to a certain category. All of the explanatory variables in this model are indicators. If the predictors B and VR are 0, then the model is for the average score of students looking at Model A using BIM. To find the average score on one of the criteria, say Shape, the indicators Dim, Pipe, and View will all be equal to 0. When all the criteria indicators are 0, the model will calculate the average score for the color criterion because it is the reference level.
Coefficients β7 to β10 represent the interaction between a specific criterion and the platform. Quite literally, the predictors are multiplied. This is a necessary component of the model because it allows us to determine how much VR increased (or decreased) the average scores on each criterion compared to when using BIM. Positive values for these estimated coefficients would indicate that scores were higher, on average, when students used VR compared to BIM. To better understand how to use this model in practice, we will present three examples. First, the average score for students who were evaluating the dimension criterion on Model A using VR is μ = β0 + β2 + β6 since all indicators are 0 except for Dim and VR, which have a value of 1. Second, the average score for students evaluating the color criterion on Model B using BIM is μ = β0 + β1 as B = 1 is the only non-zero indicator. When all of the criteria indicators are 0, this implies the model is for the color criterion. Finally, the model for students evaluating the view criterion for Model B using VR is μ = β0 + β1 + β5 + β6 + β10. The estimated model results can be found in Table 5, where significant predictors–those with p-values smaller than the significance level of 0.05-are denoted in bold. Each row displays the estimated coefficient value, standard error, 95% confidence interval, Z test statistic, and p-value of each estimated β coefficient in the model. The estimated correlation, , is 0.33.
Table 5.
GEE Model summary results.
Here, we discuss the implications and limitations of these results in more detail. First, we will compare the score differences between VR and BIM within each group, BV in Table 6 and VB in Table 7. In both tables, each row refers to the average difference in the score of VR–BIM for each of the five criteria. As we saw in the summary statistics in Table 1, those in the BV group performed better when using VR on all criteria, except color. While none of these differences were statistically significant since all p-values were greater than 0.05, there was an increase in performance when using VR compared to BIM on the dimension criterion of 18% and on the shape criterion of 19%, on average. Focusing on the VB group, on the other hand, with the exception of color, students performed significantly better on the remaining four criteria. The smallest average difference was seen with the viewpoint criterion at 16%, and the largest difference was in the shape criterion at 35%.
Table 6.
Group BV performance in VR versus BIM.
Table 7.
Group VB performance in VR versus BIM.
Finally, in Table 8, we compared VR to BIM directly. Overall, students performed better across all criteria when using VR. There was no difference between the average score on the color criterion, which aligns with what we saw in Table 2, though this was not significant. The largest improvements in the score when using VR were the dimension (26%), shape (27%) and pipeline (16%) criterion, all of which were statistically significant. While students did score higher on average on the viewpoint criterion when using VR, this difference was not significant. Both groups could recall the colors of the objects across Model A and Model B using either platform more than other research study criteria, as noted by the negative coefficient values of β1 through β5. For the rest of the criteria, on average, both VB and BV groups could recall the parts of the model better when they were immersed in the VR environment than when they had explored them on the desktop screen with BIM.
Table 8.
Overall participant results in VR versus BIM.
4. Discussion
Since AEC professionals use sketching and drawing to discuss design and coordination issues besides using 3D models, this research study was conducted to test if VR’s immersive environment can help memory recall of complex MEP systems by sketching. Prior research studies showed an improvement in individuals’ memory recall of architectural layout and simple geometries using VR compared to a desktop. In a controlled experiment, we compared the individual performance in VR compared to BIM’s representation of 3D models on a desktop based on the 3D geometry properties of a complex piping system and the users’ self-awareness in the model categorized under color, shape, dimension, piping routes and viewpoint that were important for 3D coordination process. We found a significant improvement in recall of shape, dimension, and piping routes when the model was explored in VR compared to desktop. Participants, on average, showed higher recall of their location in the model, examined by viewpoint criterion, in VR, but it was not statistically significant. Participants, on average, recalled object colors similarly in both platforms of VR and BIM. Overall, this research study showed promising results for memory recall of complex MEP systems using immersive VR in comparison to the current use of BIM-based platforms to sketch building systems components for brainstorming design issues to find solutions and make decisions in 3D coordination processes.
Since the experiment had a small sample size, and the results of one case study cannot be generalized, further studies need to be conducted with larger sample sizes and various MEP system configurations. In this study, the system component dimensions were relatively large and located at a close distance from the users. Both BIM and VR platforms were compatible with eyeglasses. For future studies where smaller dimension MEP system recall is examined, visual acuity is recommended to be measured prior to the experiment to consider its effects. The viewer used in the study had fixed lens spacing, and the platform did not have the capability for eye tracking. Further studies are recommended to be conducted with hardware with adjustable lens spacing based on the user’s pupillary distance and capability of eye tracking. The controlled experiments in this study were conducted with a 3DOF HMD that required the research team to set up the BIM platform in a way that provided the same 3DOF experience in VR as for the BIM users. In the industry, AEC professionals explore models with 6DOF using BIM software navigation tools, such as Walk. Additionally, the participants were graduate students with a few years of industry experience and exposure to BIM practices. This required the research team to simplify the federated models in the experiment. A similar controlled study with 6DOF VR is recommended to allow the team members to walk inside the model and experience it the way models are explored with BIM. Future research studies need to be conducted with AEC industry professionals to explore to what extent immersive VR can support their memory recall of complex MEP systems.
Supplementary Materials
The data can be downloaded at: https://www.mdpi.com/article/10.3390/virtualworlds2030012/s1.
Author Contributions
Conceptualization, B.A. and C.S.D.; methodology, B.A.; validation, B.A. and W.N.R.; formal analysis, B.A. and W.N.R.; investigation, B.A.; resources, C.S.D.; data curation, B.A.; writing, original draft preparation, B.A. and W.N.R.; writing, review and editing, C.S.D.; visualization, B.A.; supervision, C.S.D.; project administration, B.A. All authors have read and agreed to the published version of the manuscript.
Funding
This research received no external funding.
Institutional Review Board Statement
The study was conducted in accordance with the Declaration of Helsinki, and approved by the Institutional Review Board of the University of Washington, Seattle (#STUDY00006457).
Informed Consent Statement
Informed consent was obtained from all subjects involved in the study.
Data Availability Statement
The data are provided in the supplementary materials. The original responses of the participants to the questionnaires are confidential in nature and may only be provided after anonymizing by the corresponding author upon reasonable request. The BIM model used in the experiment was provided by Skanska. Direct requests for receiving the model may be made to Skanska or to the corresponding author to coordinate.
Conflicts of Interest
This research study was conducted in collaboration with a start-up company that is no longer in business, and the mobile application used for this study is no longer in the market. The third author was the Strategic Advisor of the company with a small number of shares. The name of the company and the mobile application are not provided in this manuscript.
References
- Tatum, C.B.; Korman, T.M. MEP Coordination in Building and Industrial Projects; CIFE Working Paper 54 CIFE; Stanford University: Stanford, CA, USA, 1999. [Google Scholar]
- Eastman, C.; Teicholz, P.; Sacks, R.; Liston, K. BIM Handbook: A Guide to Building Information Modeling; John Wiley & Sons: Hoboken, NJ, USA, 2011. [Google Scholar]
- Leite, F.L. BIM for Design Coordination: A Virtual Design and Construction Guide For Designers, General Contractors, and MEP Subcontractors; John Wiley & Sons: Hoboken, NJ, USA, 2019. [Google Scholar]
- Messner, J.; Anumba, C.; Dubler, C.; Goodman, S.; Kasprzak, C.; Kreider, R.; Leicht, R.; Saluja, C.; Zikic, N. BIM Project Execution Planning Guide, Version 2.2; Computer Integrated Construction Research Program; The Pennsylvania State University: State College, PA, USA, 2019. [Google Scholar]
- Staub-French, S.S.; Khanzode, A. 3D and 4D modeling for design and construction coordination: Issues and lessons learned. J. Inf. Technol. Constr. 2007, 12, 381–407. [Google Scholar]
- Dossick, C.S.; Neff, G. Messy Talk and Clean Technology: Communication, Problem-Solving and Collaboration Using Building Information Modelling. Eng. Proj. Organ. J. 2011, 1, 83–93. [Google Scholar] [CrossRef]
- Astaneh Asl, B.; Dossick, C.S. How could virtual reality facilitate AEC team collaboration. In Proceedings of the 17th Annual Engineering Project Organization Conference, Vail, CO, USA, 25–27 June 2019. [Google Scholar]
- Scrivener, S.A.; Ball, L.J.; Tseng, W. Uncertainty and sketching behaviour. Des. Stud. 2000, 21, 465–481. [Google Scholar] [CrossRef]
- Jerald, J. The VR Book: Human-Centered Design for Virtual Reality; Morgan & Claypool: San Rafael, CA, USA, 2005. [Google Scholar]
- Cruz-Neira, C.; Sandin, D.J.; DeFanti, T.A.; Kenyon, R.V.; Hart, J.C. The CAVE: Audio visual experience automatic virtual environment. Commun. ACM 1992, 35, 64–72. [Google Scholar] [CrossRef]
- Castronovo, F.; Nikolic, D.; Liu, Y.; Messner, J. An evaluation of immersive virtual reality systems for design reviews. In Proceedings of the 13th International Conference on Construction Applications of Virtual Reality, Reston, VA, USA, ASCE, 30–31 October 2013. [Google Scholar]
- Du, J.; Zou, Z.; Shi, Y.; Zhao, D. CoVR: Cloud-Based Multiuser Virtual Reality Headset System for Project Communication of Remote Users. J. Constr. Eng. Manag. 2018, 144, 04017109. [Google Scholar] [CrossRef]
- Majumdar, T.; Fischer, M.A.; Schwegler, B.R. Conceptual design review with a virtual reality mock-up model. In Proceedings of the Building on IT: Joint International Conference on Computing and Decision Making in Civil and Building Engineering, 2902–2911, Reston, VA, USA, ASCE, 14–16 June 2006. [Google Scholar]
- Maldovan, K.D.; Messner, J.I.; Faddoul, M. Framework for reviewing mockups in an immersive environment, In Proceedings of the 6th International Conference on Construction Applications of Virtual Reality, Orlando, FL, USA, 3–4 August 2006.
- Wahlstrom, M.; Aittala, M.; Kotilainen, H.; Yli-Karhu, T.; Porkka, J.; Nykanen, E. Cave for Collaborative Patient Room Design: Analysis with End-User Opinion Contrasting Method. Virtual Real. 2010, 14, 197–211. [Google Scholar] [CrossRef]
- Lin, Y.C.; Chen, Y.P.; Yien, H.W.; Huang, C.Y.; Su, Y.C. Integrated BIM, game engine and VR technologies for healthcare design: A case study in cancer hospital. Adv. Eng. Inform. 2018, 36, 130–145. [Google Scholar] [CrossRef]
- Astaneh Asl, B.; Dossick, C.S. Immersive Virtual Reality Mockup versus Physical Mockup: Effects of Immersive Virtual Environment on AECO Team Decision-Making Process. Eng. Proj. Organ. J. 2023, 11. [Google Scholar] [CrossRef]
- Westerdahl, B.; Sunesson, K.; Wernemyr, C.; Roupé, M.; Johansson, M.; Allwood, C.M. Users’ evaluation of a virtual reality architectural model compared with the experience of the completed building. Autom. Constr. 2006, 15, 150–165. [Google Scholar] [CrossRef]
- Zaker, R.; Coloma, E. Virtual reality-integrated workflow in BIM enabled projects collaboration and design review: A case study. Vis. Eng. 2018, 6, 4. [Google Scholar] [CrossRef]
- Liu, Y.; Castronovo, F.; Messner, J.; Leicht, R. Evaluating the impact of virtual reality on design review meetings. J. Comput. Civ. Eng. 2020, 34, 04019045. [Google Scholar] [CrossRef]
- Han, B.; Leite, F. Measuring the impact of immersive virtual reality on construction design review applications: Head-mounted display versus desktop monitor. J. Constr. Eng. Manag. 2021, 147, 04021042. [Google Scholar] [CrossRef]
- Astaneh Asl, B.; Dossick, C.S. Immersive VR versus BIM for AEC Team Collaboration in Remote 3D Coordination Processes. Buildings 2022, 12, 1548. [Google Scholar] [CrossRef]
- Herbert, D.M. Study drawings in architectural design: Their properties as a graphic medium. J. Archit. Educ. 1988, 41, 26–38. [Google Scholar]
- Goldschmidt, G. The dialectics of sketching. Creat. Res. J. 1991, 4, 123–143. [Google Scholar] [CrossRef]
- van Summers, P. Drawing and Cognition; Cambridge University Press: Cambridge, MA, USA, 1994. [Google Scholar]
- Guérin, F.; Ska, B.; Belleville, S. Cognitive processing of drawing abilities. Brain Cogn. 1999, 40, 464–478. [Google Scholar] [CrossRef] [PubMed]
- Eichenbaum, H. Prefrontal–hippocampal interactions in episodic memory. Nat. Rev. Neurosci. 2017, 18, 547–558. [Google Scholar] [CrossRef] [PubMed]
- Tolman, E.C. Cognitive maps in rats and men. Psychol. Rev. 1948, 55, 189–208. [Google Scholar] [CrossRef]
- Newman, E.L.; Caplan, J.B.; Kirschen, M.P.; Korolev, I.O.; Sekuler, R.; Kahana, M.J. Learning your way around town: How virtual taxicab drivers learn to use both layout and landmark information. Cognition 2007, 104, 231–253. [Google Scholar] [CrossRef]
- Burgess, N.; Maguire, E.A.; O’Keefe, J. The human hippocampus and spatial and episodic memory. Neuron 2002, 35, 625–641. [Google Scholar] [CrossRef]
- Hartley, T.; Lever, C.; Burgess, N.; O’Keefe, J. Space in the brain: How the hippocampal formation supports spatial cognition. Phil. Trans. R. Soc. 2014, 369, 20120510. [Google Scholar] [CrossRef] [PubMed]
- Smith, S.A. Virtual reality in episodic memory research: A review. Psychon. Bull. Rev. 2019, 26, 1213–1237. [Google Scholar] [CrossRef] [PubMed]
- Ruddle, R.A.; Payne, S.J.; Jones, D.M. Navigating large-scale virtual environments: What differences occur between helmet-mounted and desktop displays? Presence 1999, 8, 157–168. [Google Scholar] [CrossRef]
- Brooks, B.M.; Attree, E.A.; Rose, D.F.; Clifford, B.R.; Leadbetter, A.G. The specificity of memory enhancement during interaction with a virtual environment. Memory 1999, 7, 65–78. [Google Scholar] [CrossRef] [PubMed]
- Attree, E.A.; Brooks, B.M.; Rose, F.D.; Andrews, T.K.; Leadbetter, A.G.; Clifford, B.R. Memory processes and virtual environments: I can’t remember what was there, but I can remember how I got there. Implications for people with disabilities. In Proceedings of the First European Conference on Disability, Virtual Reality and Associated Technologies, Reading, UK, 8–10 July 1996. [Google Scholar]
- Richardson, A.E.; Montello, D.R.; Hegarty, M. Spatial knowledge acquisition from maps and from navigation in real and virtual environments. Mem. Cogn. 1999, 27, 741–750. [Google Scholar]
- Mania, K.; Troscianko, T.; Hawkes, R.; Chalmers, A. Fidelity metrics for virtual environment simulations based on spatial memory awareness states. Presence 2003, 12, 296–310. [Google Scholar] [CrossRef]
- Wallet, G.; Sauzéon, H.; Pala, P.A.; Larrue, F.; Zheng, X.; N’Kaoua, B. Virtual/real transfer of spatial knowledge: Benefit from visual fidelity provided in a virtual environment and impact of active navigation. Cyberpsychology Behav. Soc. Netw. 2011, 14, 417–423. [Google Scholar] [CrossRef]
- Harman, J. Creating a memory palace using a computer. In Proceedings of the CHI ’01 Extended Abstracts on Human Factors in Computing Systems, Seattle, WA, USA, 31 March 2001; pp. 407–408. [Google Scholar] [CrossRef]
- Krokos, E.; Plaisant, C.; Varshney, A. Virtual memory palaces: Immersion aids recall. Virtual Real. 2019, 23, 1–15. [Google Scholar] [CrossRef]
- Reggente, N.; Essoe, J.K.; Baek, H.Y.; Rissman, J. The method of loci in virtual reality: Explicit binding of objects to spatial contexts enhances subsequent memory recall. J. Cogn. Enhanc. 2020, 4, 12–30. [Google Scholar] [CrossRef]
- Gerard, P.F.; Leymarie, F.F.; Latham, W. The Effect of Spatial Design on User Memory Performance Using the Method of Loci in VR. In Proceedings of the 7th International Conference of the Immersive Learning Research Network (iLRN), Eureka, CA, USA, 17 May–10 June 2021. [Google Scholar]
- Available online: https://www.autodesk.com/products/navisworks/ (accessed on 8 April 2023).
- Faes, C.; Molenberghs, G.; Aerts, M.; Verbeke, G.; Kenward, M.G. The Effective Sample Size and an Alternative Small-Sample Degrees-of-Freedom Method. Am. Stat. 2009, 63, 389–399. Available online: http://www.jstor.org/stable/25652320 (accessed on 8 April 2023). [CrossRef]
- Liang, K.Y.; Zeger, S.L. Longitudinal data analysis using generalized linear models. Biometrika 1986, 73, 13–22. [Google Scholar] [CrossRef]
- Fitzmaurice, G.M.; Laird, N.M.; Ware, J.H. Applied Longitudinal Analysis; John Wiley & Sons: Hoboken, NJ, USA, 2012. [Google Scholar]


Disclaimer/Publisher’s Note: The statements, opinions and data contained in all publications are solely those of the individual author(s) and contributor(s) and not of MDPI and/or the editor(s). MDPI and/or the editor(s) disclaim responsibility for any injury to people or property resulting from any ideas, methods, instructions or products referred to in the content. |
© 2023 by the authors. Licensee MDPI, Basel, Switzerland. This article is an open access article distributed under the terms and conditions of the Creative Commons Attribution (CC BY) license (https://creativecommons.org/licenses/by/4.0/).