
Effects of Patterned Electromagnetic Fields and Light-Emitting Diodes on Cancer Cells: Impact on Cell Density and Biophoton Emission When Applied Individually vs. Simultaneously


Abstract
1. Introduction
2. Methods and Materials
2.1. Cells
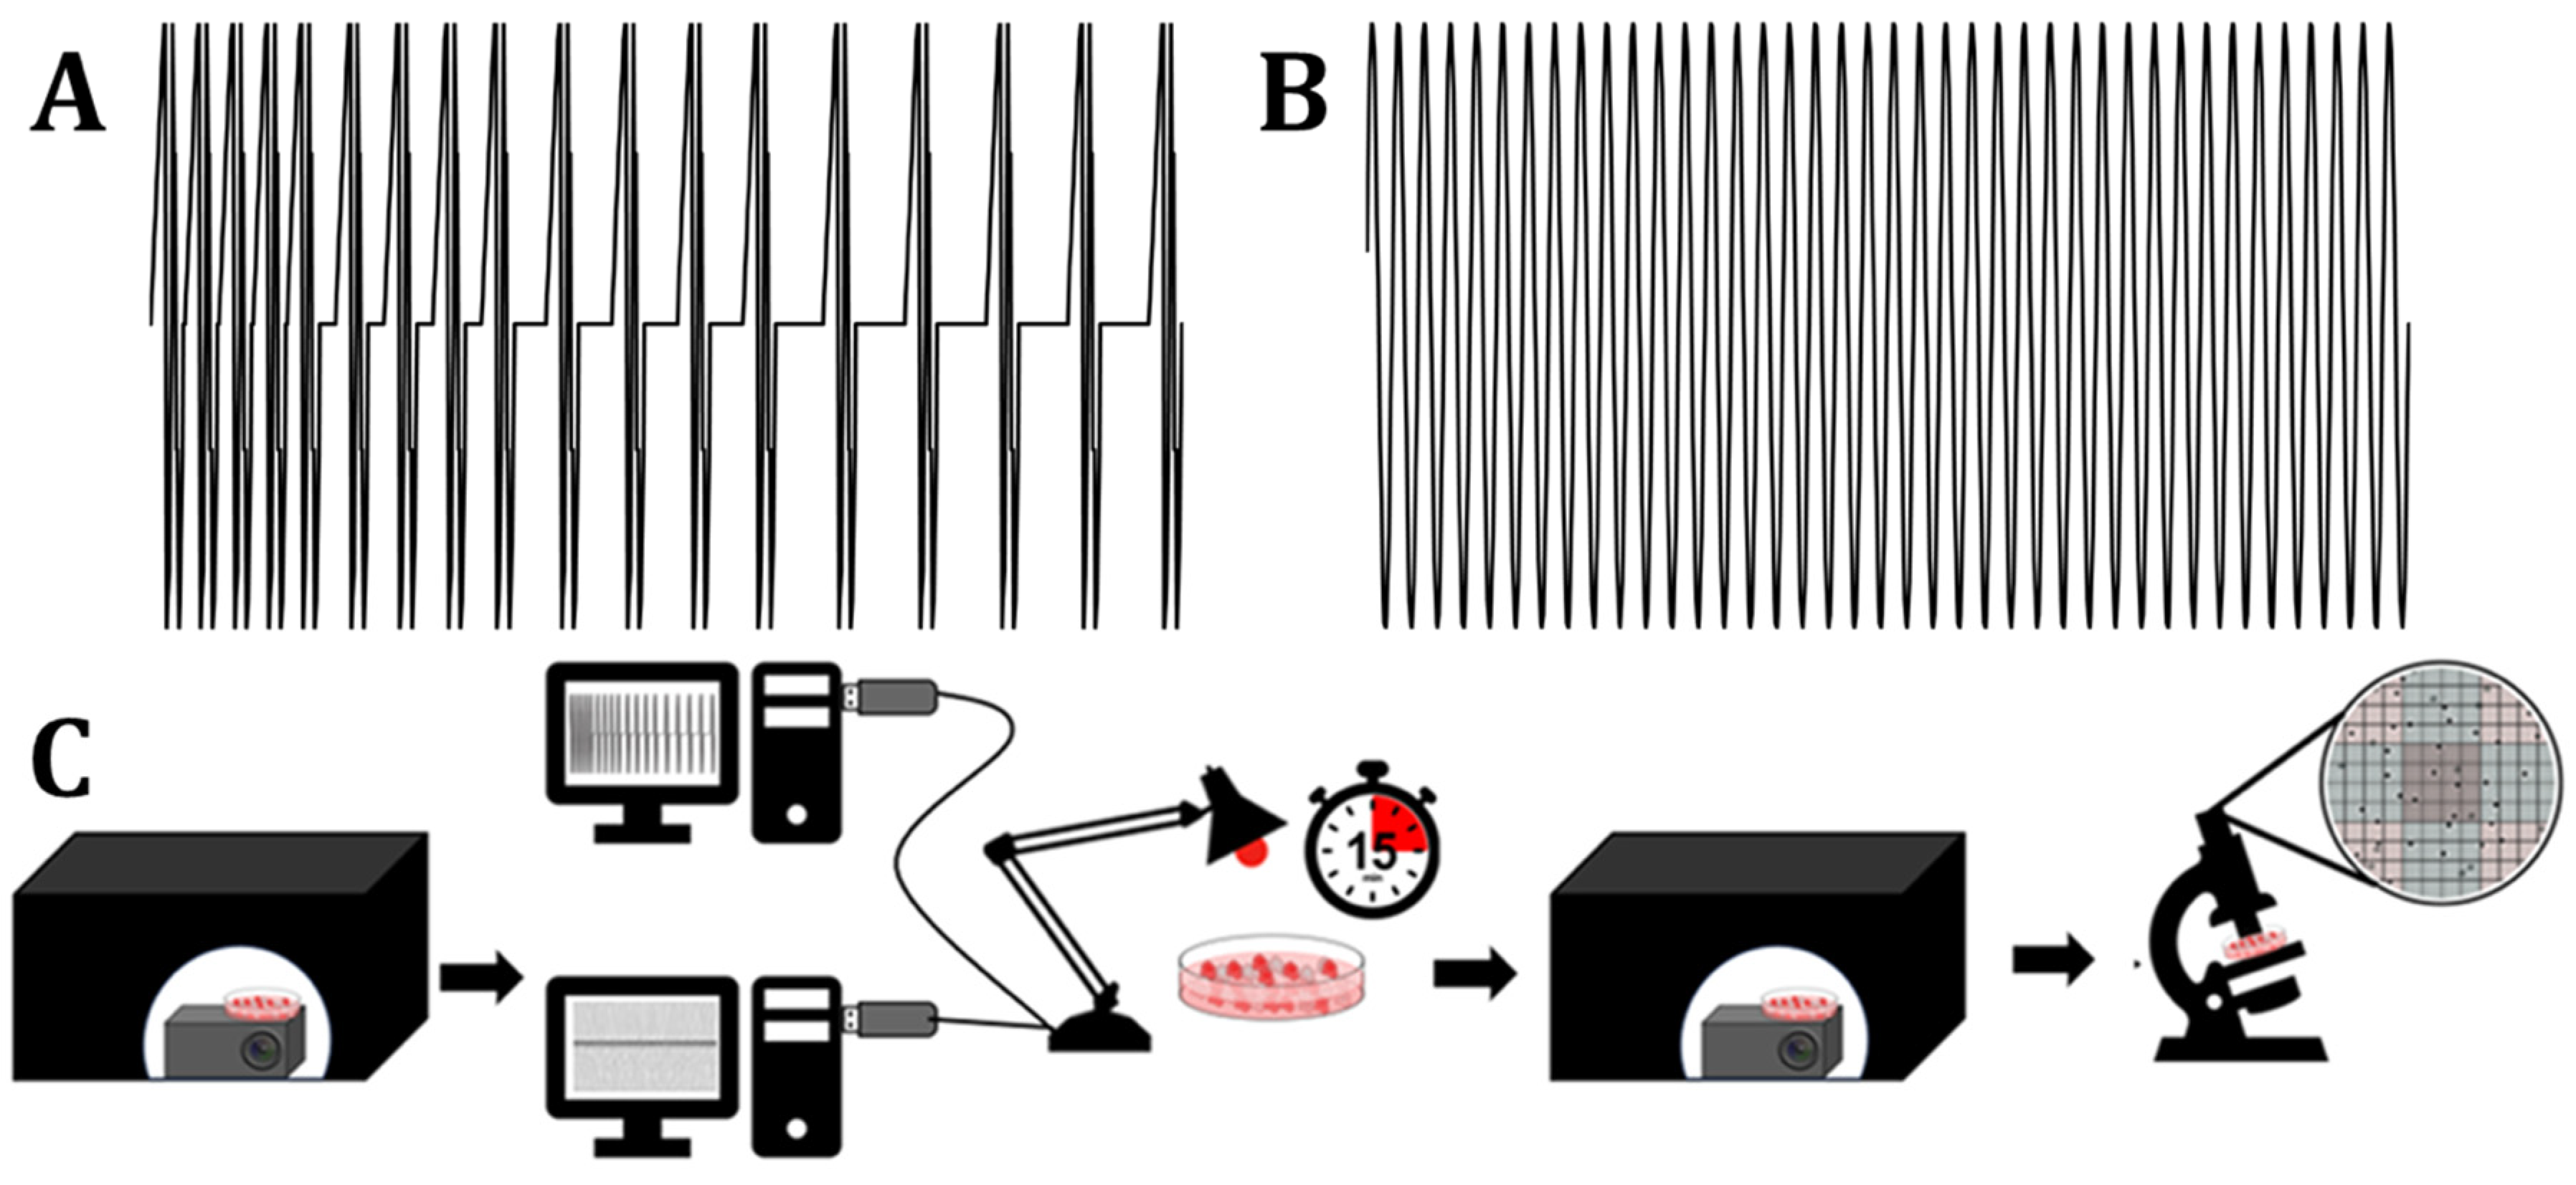
2.2. Procedure
3. Results
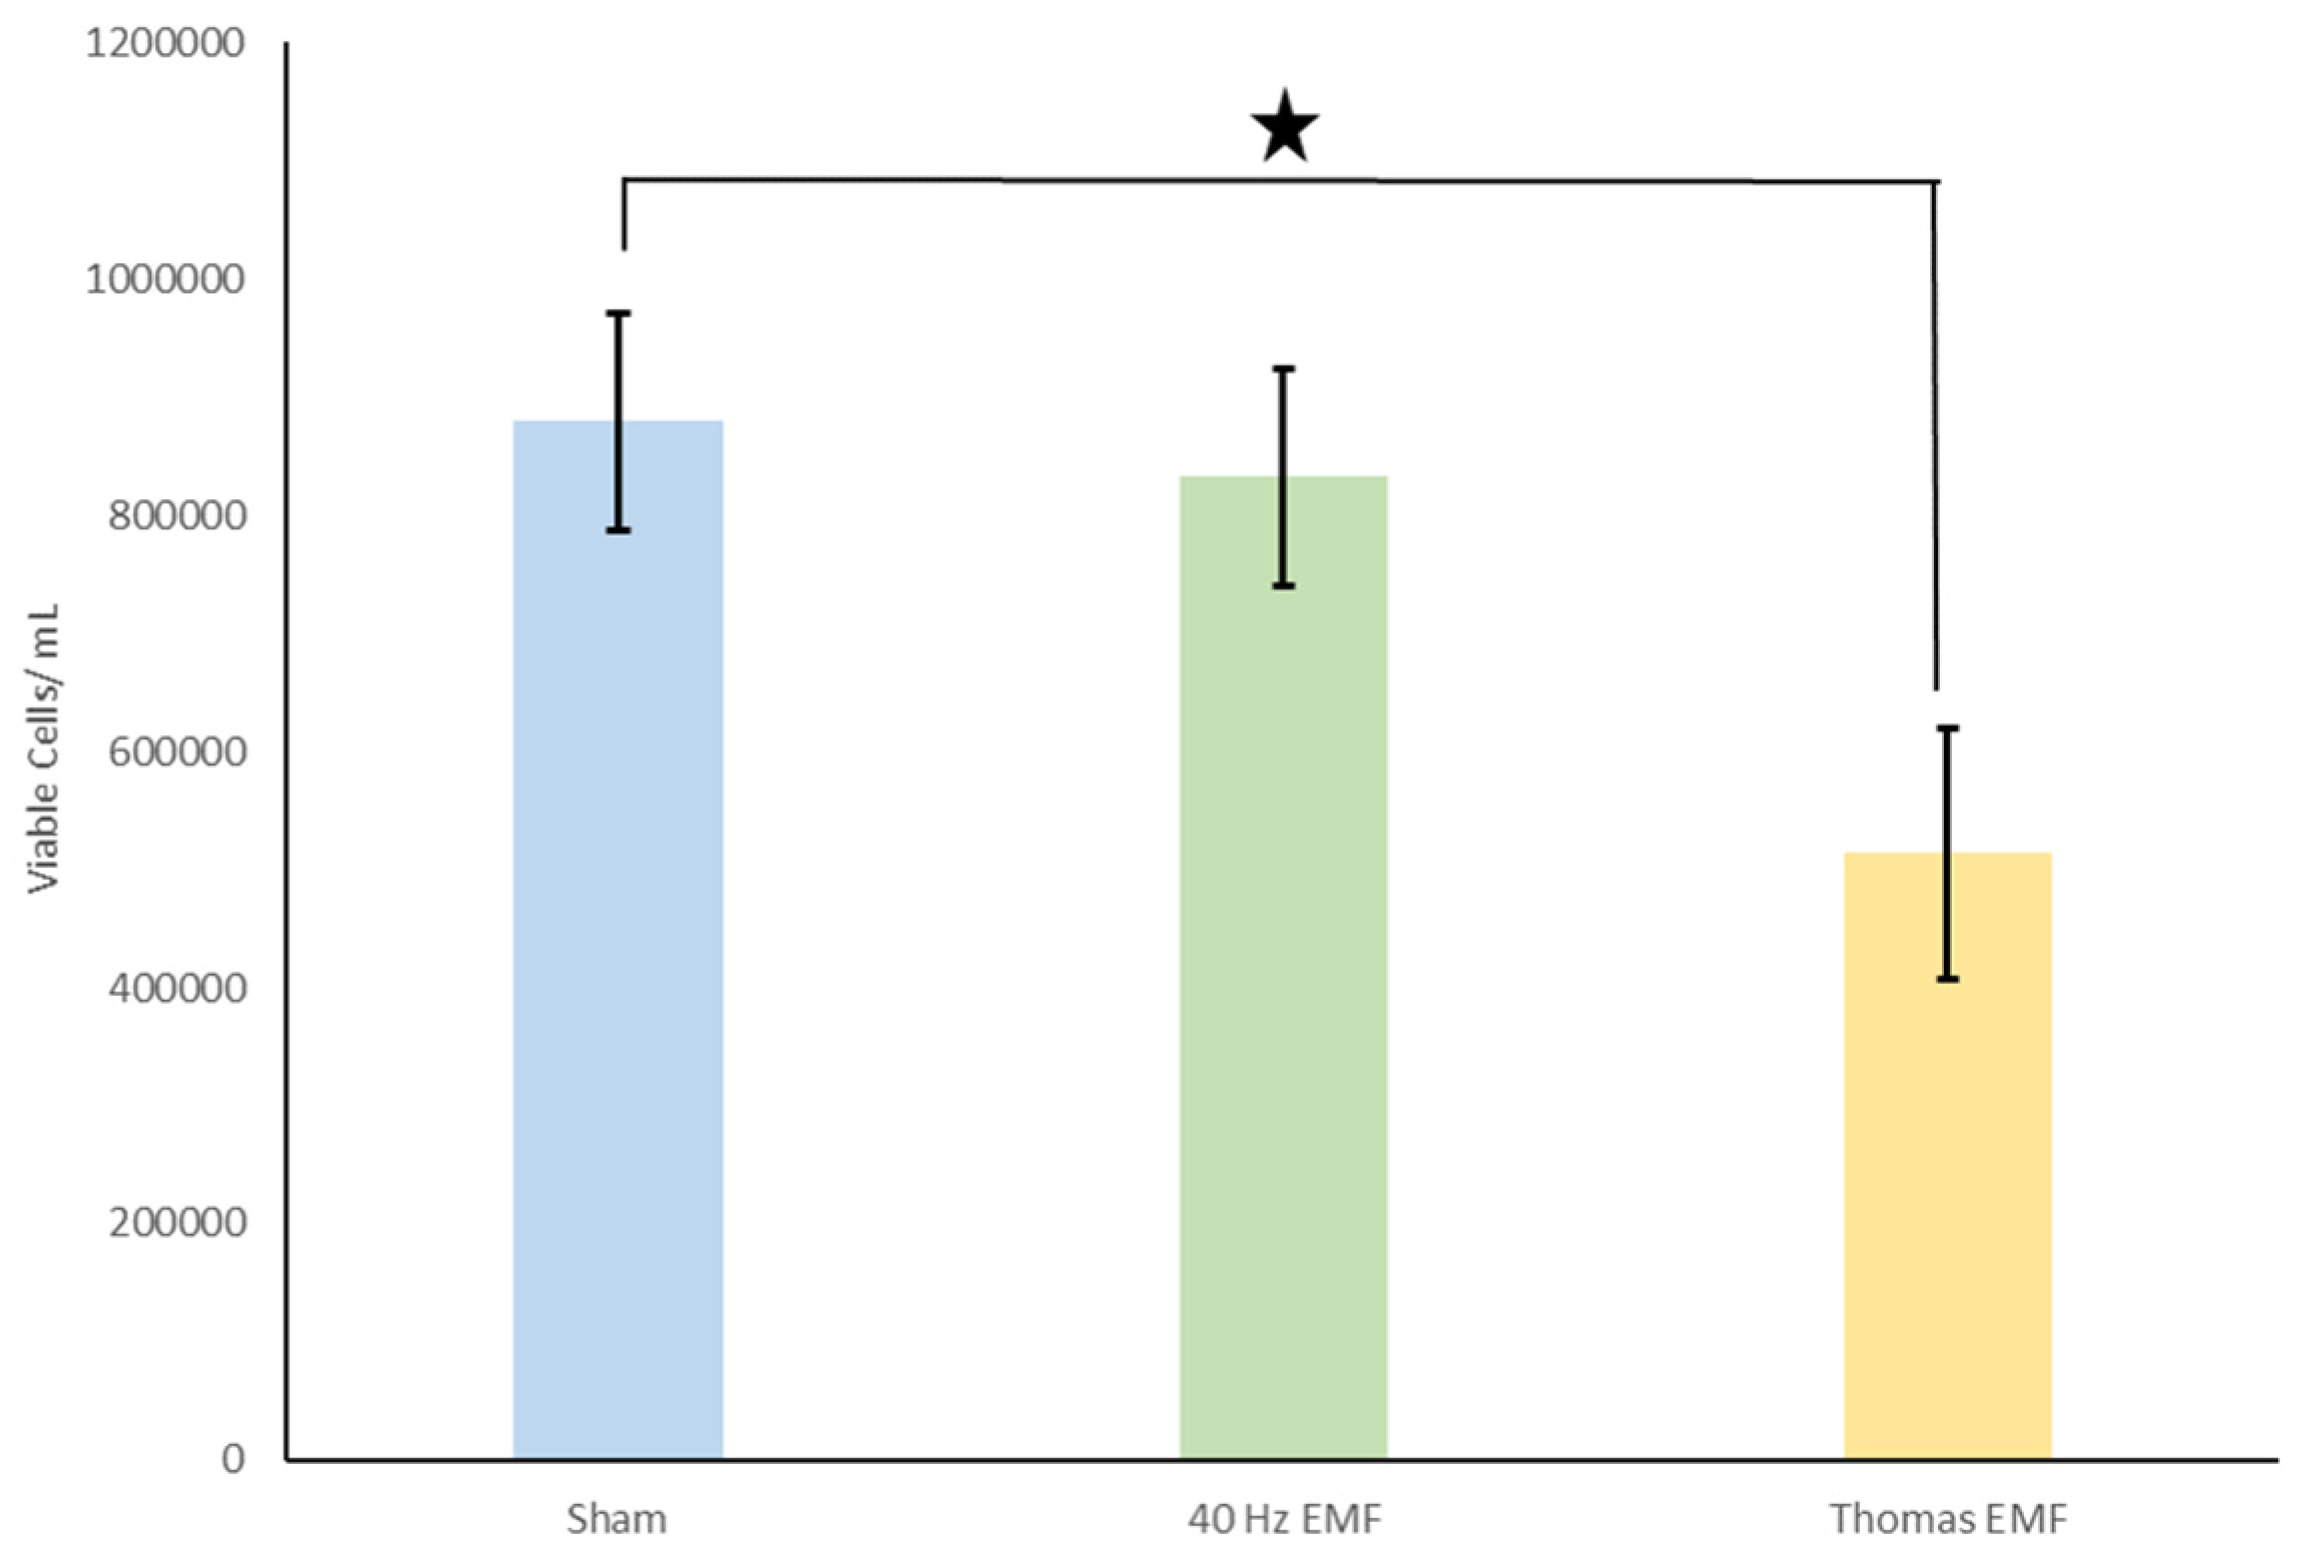
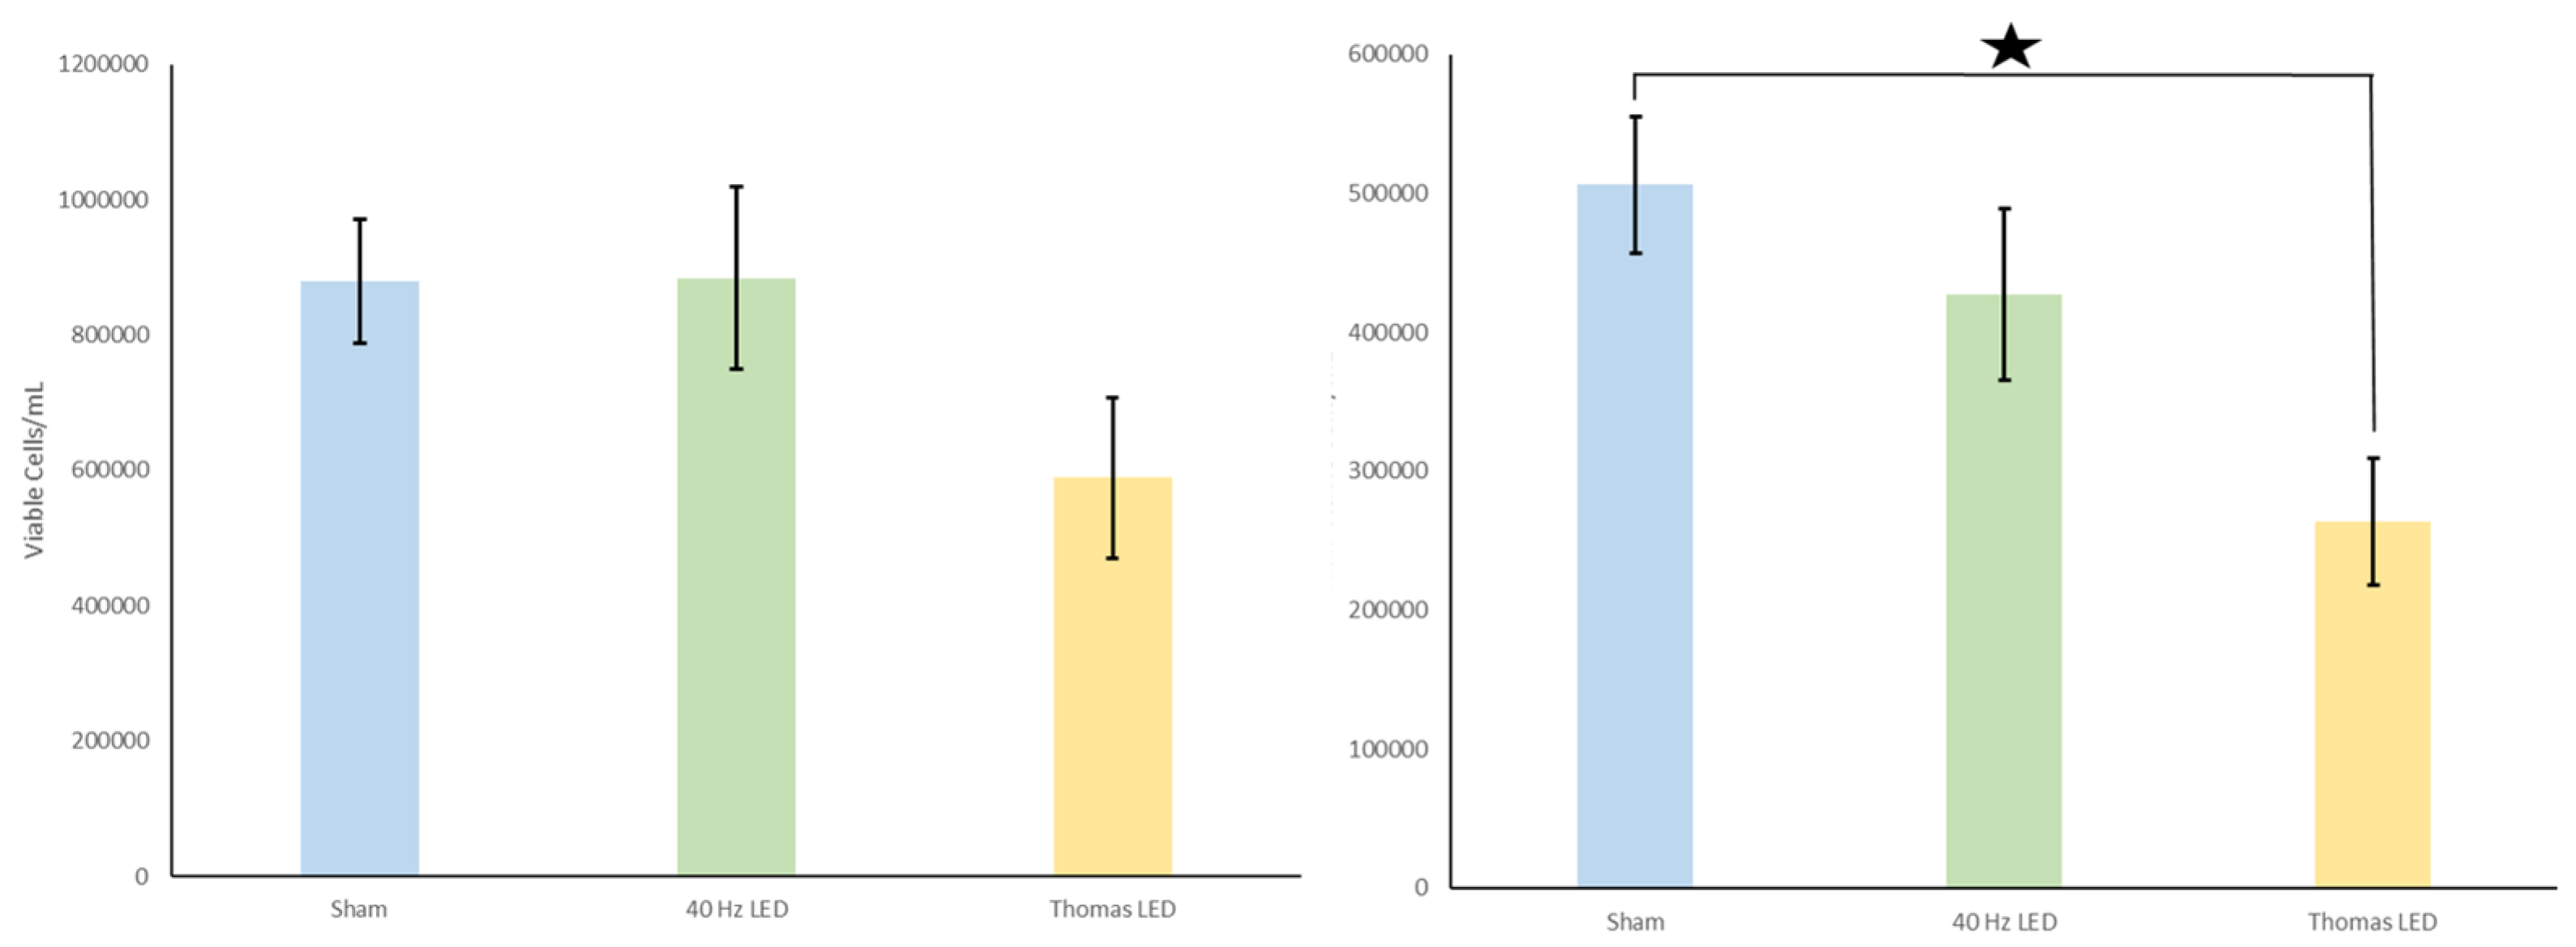
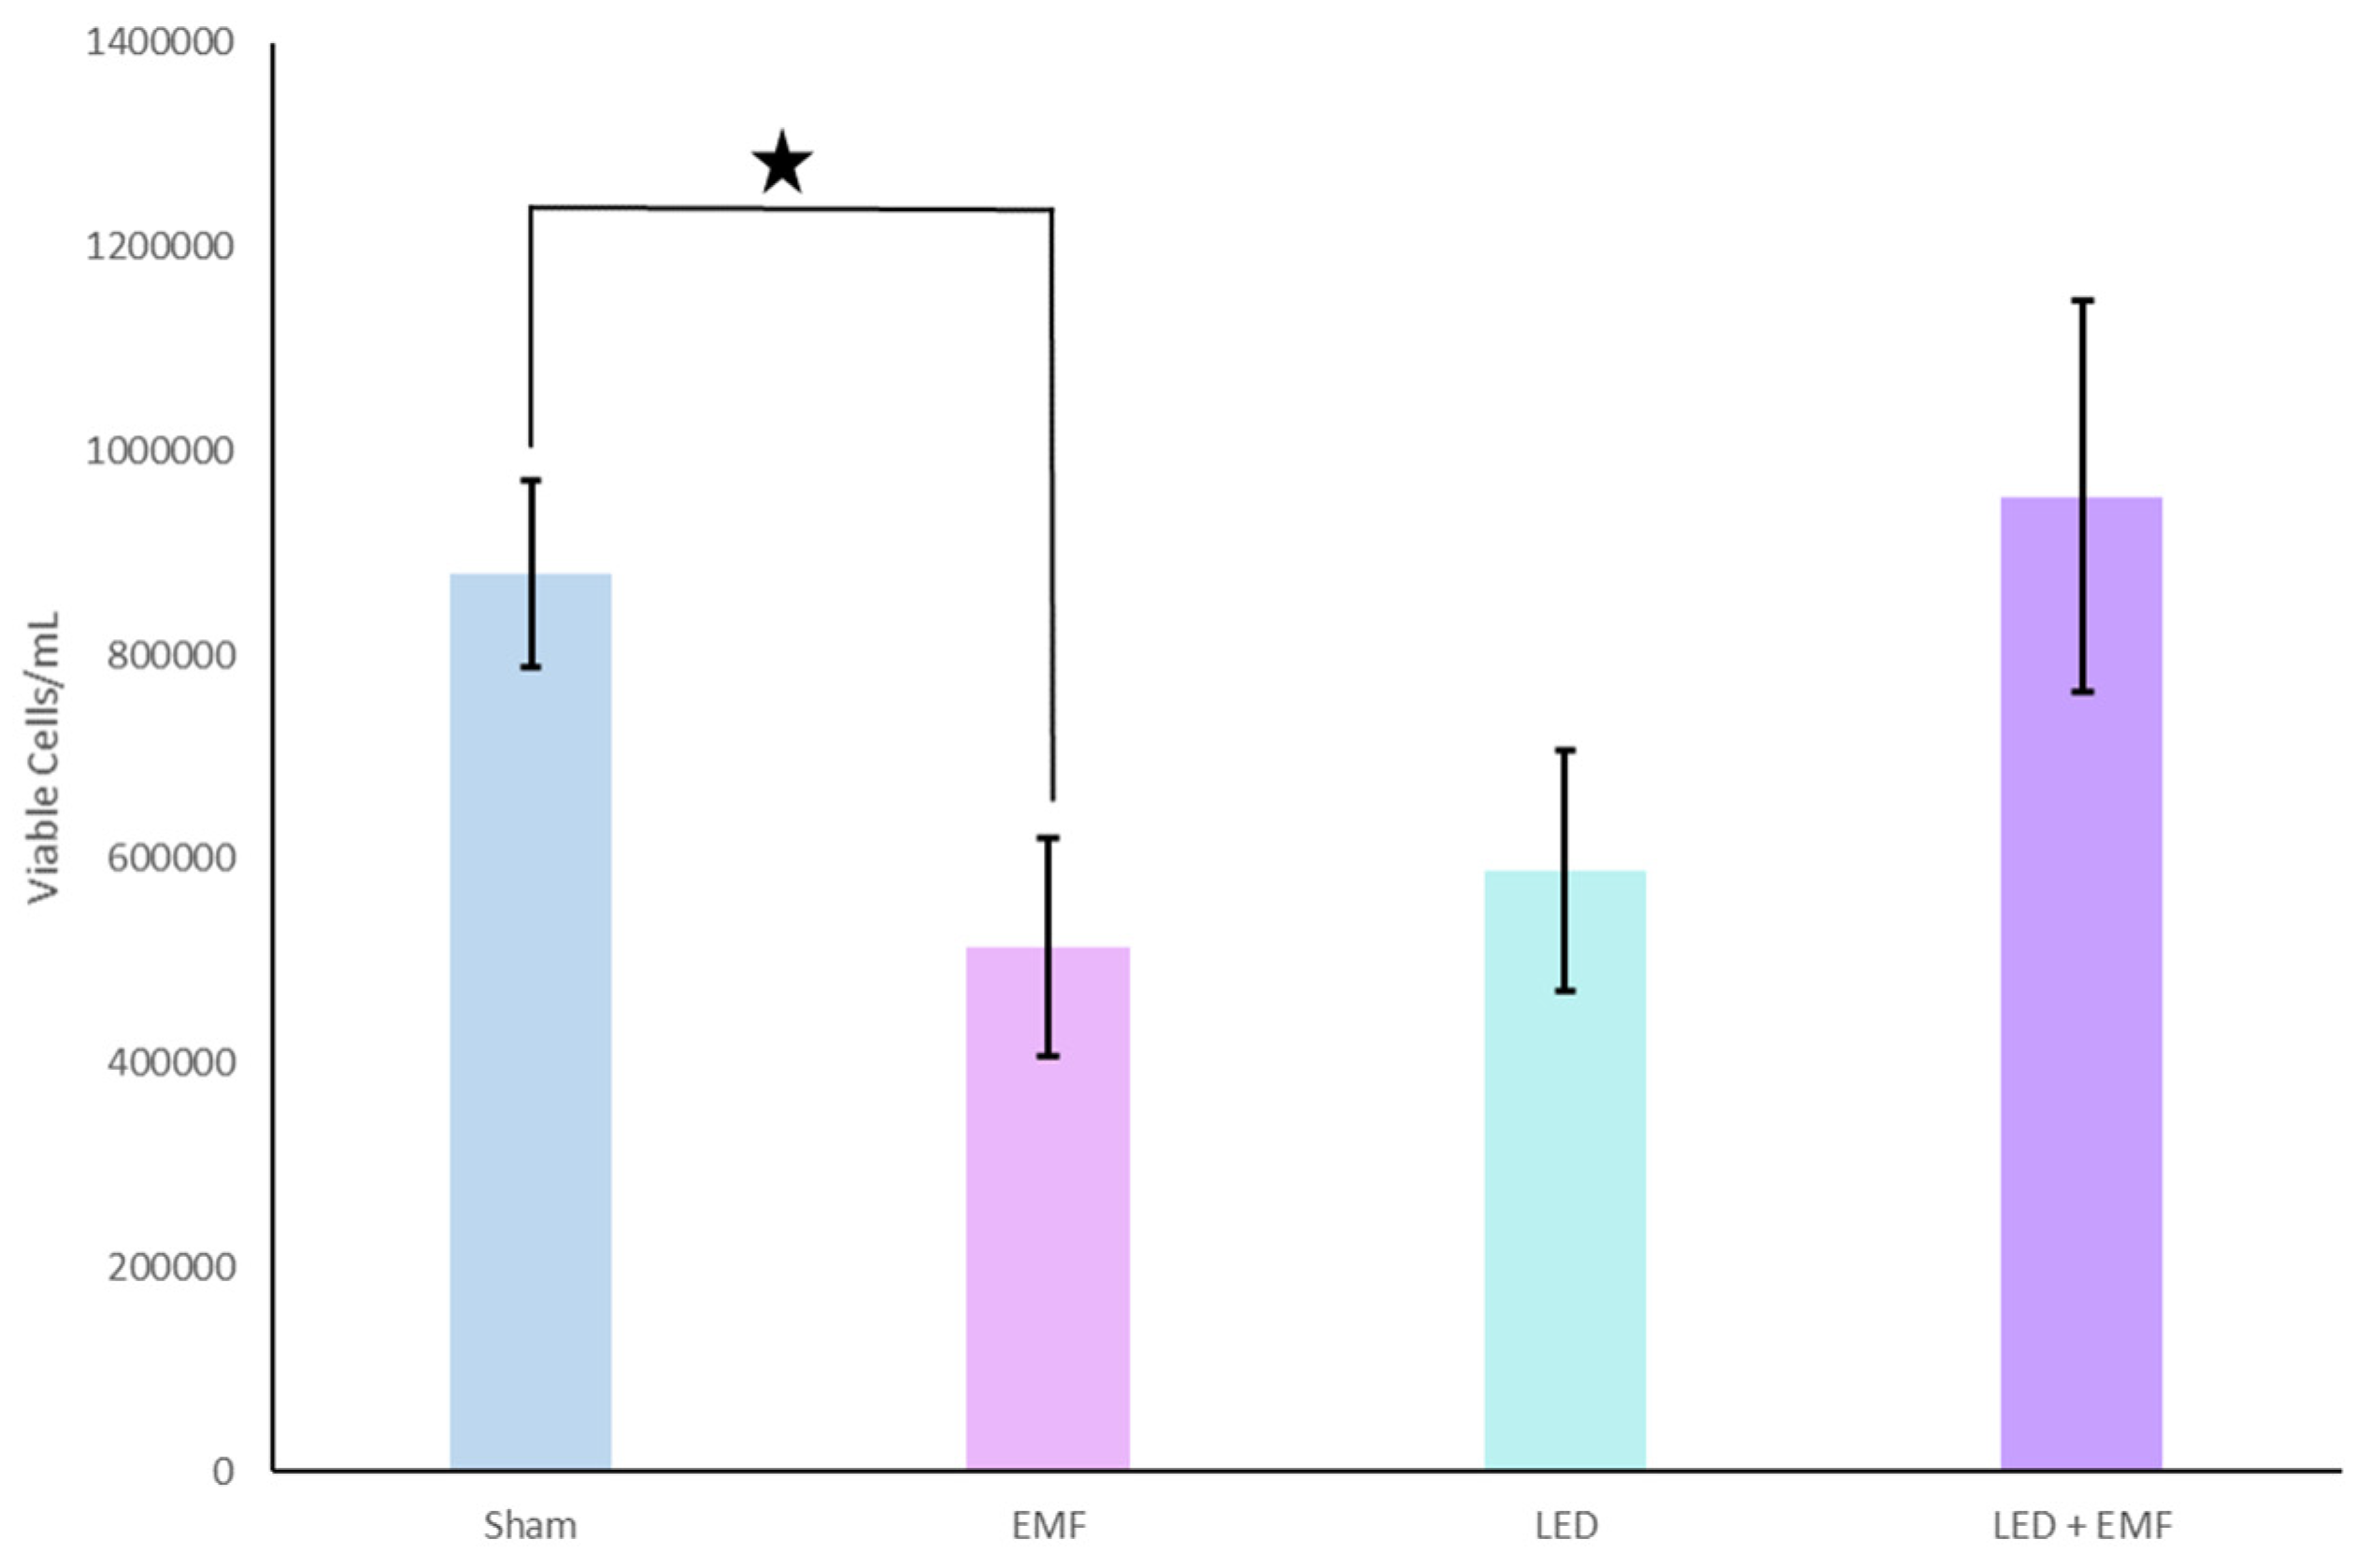
3.1. Cell Viability with LED and EMF Application
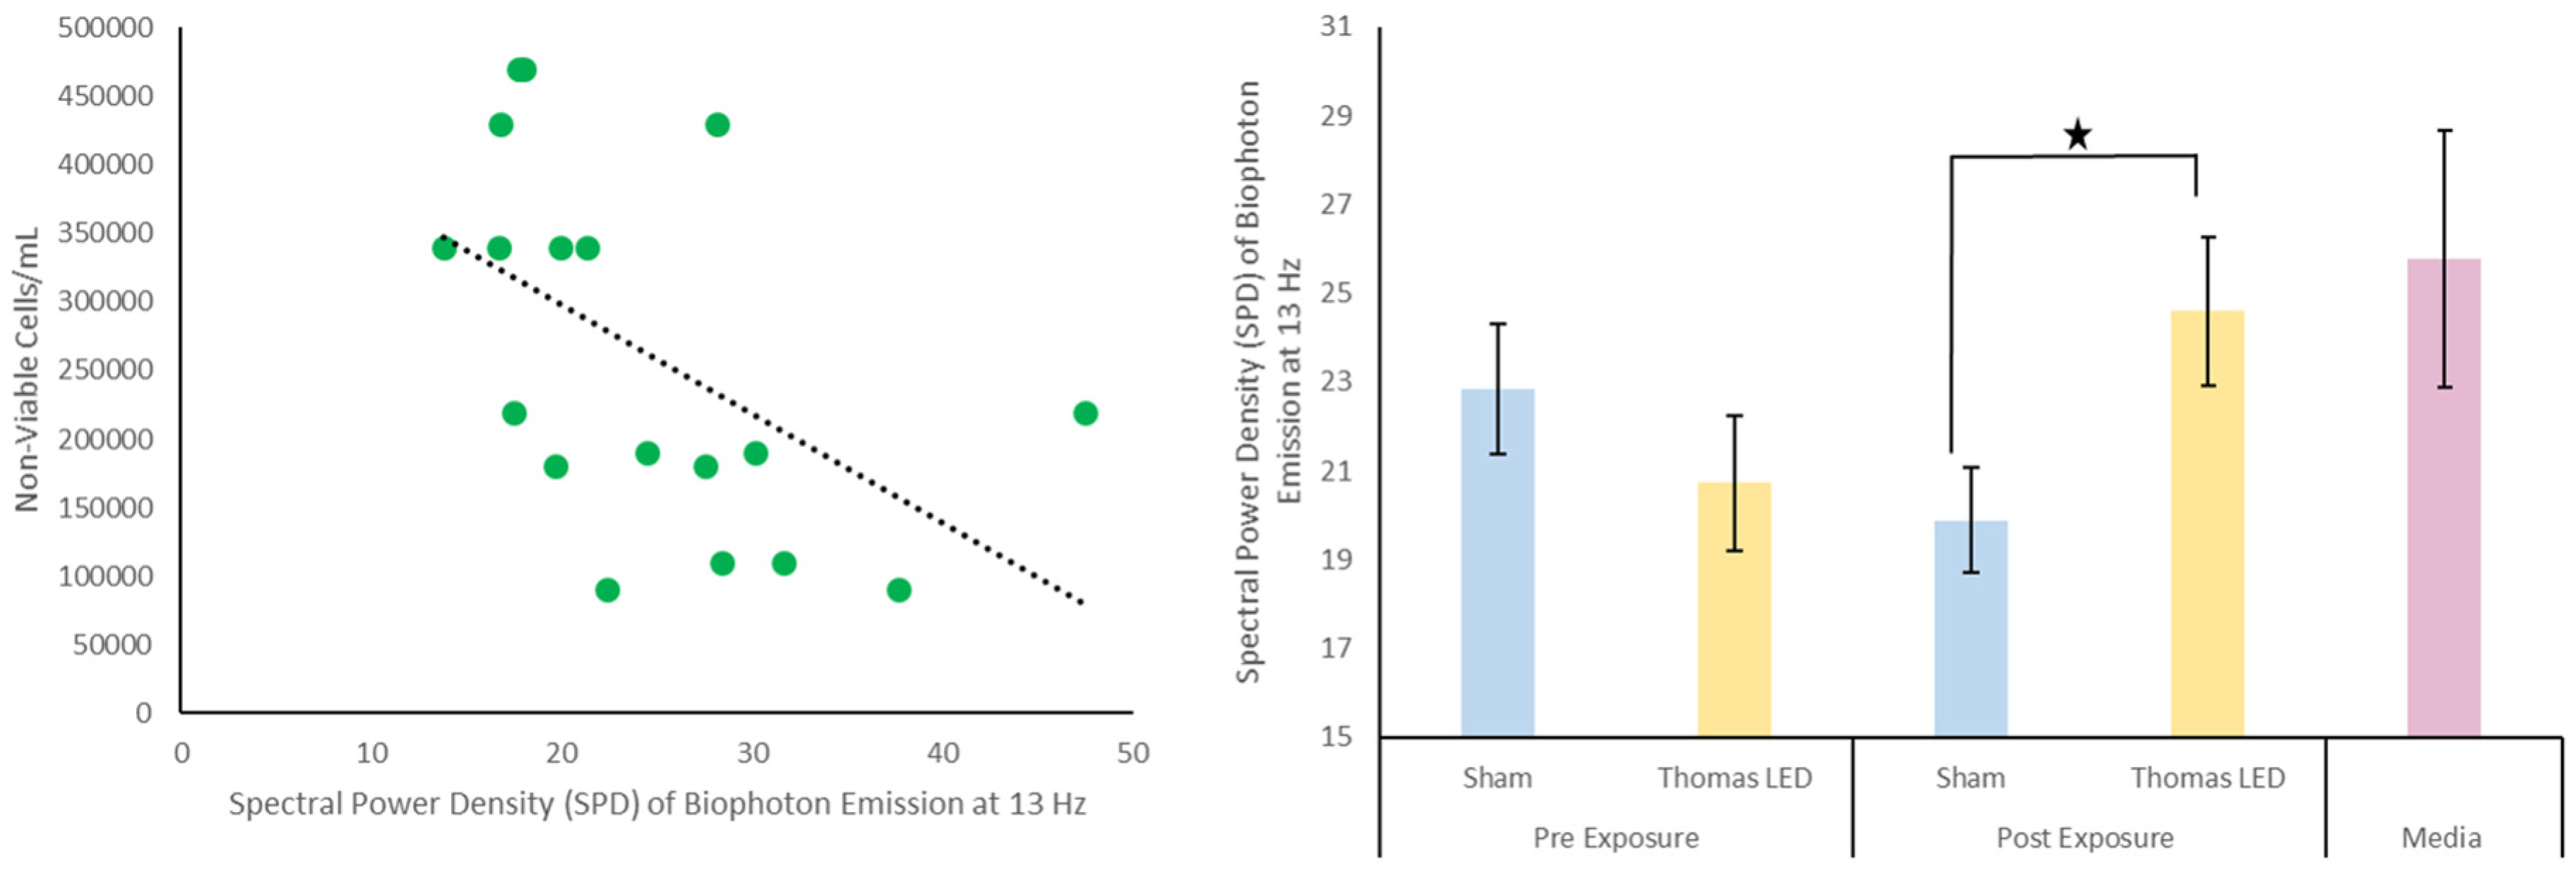
3.2. Biophoton Emission Periodicity and Cell Viability
4. Discussion
Author Contributions
Funding
Data Availability Statement
Conflicts of Interest
References
- Tafur, J.; Van Wijk, E.P.A.; Van Wijk, R.; Mills, P.J. Biophoton Detection and Low-Intensity Light Therapy: A Potential Clinical Partnership. Photomed. Laser Surg. 2010, 28, 23–30. [Google Scholar] [CrossRef]
- Cohen, J.; Vo, N.T.K.; Chettle, D.R.; McNeill, F.E.; Seymour, C.B.; Mothersill, C.E. Quantifying Biophoton Emissions from Human Cells Directly Exposed to Low-Dose Gamma Radiation. Dose Response 2020, 18, 1559325820926763. [Google Scholar] [CrossRef]
- Buckner, C.A.; Buckner, A.L.; Koren, S.A.; Persinger, M.A.; Lafrenie, R.M. Exposure to a specific time-varying electromagnetic field inhibits cell proliferation via cAMP and ERK signaling in cancer cells. Bioelectromagnetics 2018, 39, 217–230. [Google Scholar] [CrossRef] [PubMed]
- Walker, N.; Denegar, C.R.; Preische, J. Low-intensity pulsed ultrasound and pulsed electromagnetic field in the treatment of tibial fractures: A systematic review. J. Athl. Train. 2007, 42, 530–535. [Google Scholar] [PubMed]
- Ermakov, A.M.; Ermakova, O.N.; Popov, A.L.; Manokhin, A.A.; Ivanov, V.K. Opposite effects of low intensity light of different wavelengths on the planarian regeneration rate. J. Photochem. Photobiol. B Biol. 2020, 202, 111714. [Google Scholar] [CrossRef] [PubMed]
- Schindl, A.; Merwald, H.; Schindl, L.; Kaun, C.; Wojta, J. Direct stimulatory effect of low-intensity 670 nm laser irradiation on human endothelial cell proliferation. Br. J. Dermatol. 2003, 148, 334–336. [Google Scholar] [CrossRef]
- Wu, H.P.P.; Persinger, M.A. Increased mobility and stem-cell proliferation rate in Dugesia tigrina induced by 880 nm light emitting diode. J. Photochem. Photobiol. B 2011, 102, 156–160. [Google Scholar] [CrossRef]
- Choi, D.H.; Lee, K.H.; Kim, J.H.; Kim, M.Y.; Lim, J.H.; Lee, J. Effect of 710 nm visible light irradiation on neurite outgrowth in primary rat cortical neurons following ischemic insult. Biochem. Biophys. Res. Commun. 2012, 422, 274–279. [Google Scholar] [CrossRef] [PubMed]
- Matsumoto, N.; Yoshikawa, K.; Shimada, M.; Kurita, N.; Sato, H.; Iwata, T.; Higashijima, J.; Chikakiyo, M.; Nishi, M.; Kashihara, H.; et al. Effect of light irradiation by light emitting diode on colon cancer cells. Anticancer Res. Sep. 2014, 34, 4709–4716. [Google Scholar]
- Ohara, M.; Kawashima, Y.; Katoh, O.; Watanabe, H. Blue light inhibits the growth of B16 melanoma cells. JPN J. Cancer Res. 2002, 93, 551–558. [Google Scholar] [CrossRef]
- Walleczek, J. Electromagnetic field effects on cells of the immune system: The role of calcium signalling. FASEB J. 1992, 6, 3177–3185. [Google Scholar] [CrossRef] [PubMed]
- Ross, C.L.; Harrison, B.S. Effect of time-varied magnetic field on inflammatory response in macrophage cell line RAW 264.7. Electromag. Biol. Med. 2013, 32, 59–69. [Google Scholar] [CrossRef] [PubMed]
- Li, X.; Zhang, M.; Bai, L.; Bai, W.; Xu, W.; Zhu, H. Effects of 50 Hz pulsed electromagnetic fields on the growth and cell cycle arrest of mesenchymal stem cells: An in vitro study. Electromagn. Biol. Med. 2012, 31, 356–364. [Google Scholar] [CrossRef]
- Whissell, P.D.; Persinger, M.A. Emerging synergisms between drugs and physiologically- patterned weak magnetic fields: Implications for neuropharmacology and the human population in the twenty-first century. Curr. Neuropharmacol. 2007, 5, 278–288. [Google Scholar] [CrossRef] [PubMed]
- Kivrak, E.G.; Yurt, K.K.; Kaplan, A.A.; Alkan, I.; Altun, G. Effects of Electromagnetic Field Exposure on the Antioxidant Defense System. J. Microsc. Ultrastruct. 2017, 5, 167–176. [Google Scholar] [CrossRef]
- Kim, J.H.; Lee, J.K.; Kim, H.G.; Kim, K.B.; Kim, H.R. Possible Effects of Radiofrequency Electromagnetic Field Exposure on Central Nerve System. Biomol. Ther. 2019, 27, 265–275. [Google Scholar] [CrossRef]
- Grossman, N.; Bono, D.; Dedic, N.; Kodandaramaiah, S.B.; Rudenko, A.; Suk, H.J.; Cassara, A.M.; Neufeld, E.; Kuster, N.; Tsai, L.H.; et al. Noninvasive Deep Brain Stimulation via Temporally Interfering Electric Fields. Cell 2017, 169, 1029–1041. [Google Scholar] [CrossRef]
- Cifra, M.; Fields, J.Z.; Farhadi, A. Electromagnetic cellular interactions. Prog. Biophys. Mol. Biol. 2011, 105, 223–246. [Google Scholar] [CrossRef]
- Buckner, C.A.; Buckner, A.L.; Koren, S.A.; Persinger, M.A.; Lafrenie, R.M. The effects of electromagnetic fields on B16-BL6 cells are dependent on their spatial and temporal character. Bioelectromagnetics 2016, 38, 165–174. [Google Scholar] [CrossRef]
- Dotta, B.T.; Buckner, C.A.; Cameron, D.; Lafrenie, R.F.; Persinger, M.A. Biophoton emissions from cell cultures: Biochemical evidence for the plasma membrane as the primary source. Gen. Phys. Biophys. 2011, 3, 301–309. [Google Scholar]
- Inaba, H. Super-high sensitivity systems for detection and spectral analysis of ultraweak photon emission from biological cells and tissues. Experientia 1988, 44, 530–559. [Google Scholar] [CrossRef]
- Murugan, N.J.; Persinger, M.A.; Karbowski, L.M.; Dotta, B.T. Ultraweak Photon Emissions as a Non-Invasive, Early-Malignancy Detection Tool: An In Vitro and In Vivo Study. Cancers 2020, 12, 1001. [Google Scholar] [CrossRef]
- Dotta, B.T.; Lafrenie, R.M.; Karbowski, L.M.; Persinger, M.A. Photon emission from melanoma cells during brief stimulation by patterned magnetic fields: Is the source coupled to rotational diffusion within the membrane? Gen. Phys. Biophys. 2014, 33, 63–73. [Google Scholar] [CrossRef] [PubMed][Green Version]
- Persinger, M.A.; Dotta, B.T.; Karbowski, L.M.; Murugan, N.J. Inverse relationship between photon flux densities and nanotesla magnetic fields over cell aggregates: Quantitative evidence for energetic conservation. FEBS Open Bio 2015, 5, 413–418. [Google Scholar] [CrossRef] [PubMed]
- Ahmed, U.A.M.; Khalifa, I.A.; EL-Sheikh, I.A. The biological effects of the Magnetic Field in Healing Humans and Preventing Insects from Infecting and Harming Plants Using Schrodinger Quantum and Maxwell’s Equations. J. Surv. Fish. Sci. 2023, 10, 790–799. [Google Scholar]
- Sefidbakht, Y.; Moosavi-Movahedi, A.A.M.; Hosseinkhani, S.; Khodagholi, F.; Torkzadeh-Mahani, M.; Foolad, F.; Faraji-Dana, R. Effects of 940 MHz EMF on bioluminescence and oxidative response of stable luciferase producing HEK cells. Photochem. Photobiol. Sci. 2014, 13, 1082–1092. [Google Scholar] [CrossRef] [PubMed]
- Bereta, M.; Janousek, L.; Cifra, M.; Cervinoka, K. Low frequency electromagnetic field effects on ultra-weak photon emission from yeast cells. In Proceedings of the 2016 ELEKTRO, Strbske Pleso, Slovakia, 16–18 May 2016; pp. 478–481. [Google Scholar]
- Buckner, C.A.; Buckner, A.L.; Koren, S.A.; Persinger, M.A.; Lafrenie, R.M. Inhibition of Cancer Cell Growth by Exposure to a Specific Time-Varying Electromagnetic Field Involves T-Type Calcium Channels. PLoS ONE 2015, 10, e0124136. [Google Scholar] [CrossRef]
- Murugan, N.J.; Karbowski, L.M.; Persinger, M.A. Synergistic interactions between temporal coupling of complex light and magnetic pulses upon melanoma cell proliferation and planarian regeneration. Electromagn. Biol. Med. 2017, 36, 141–148. [Google Scholar] [CrossRef]
- Rain, B.D.; Plourde-Kelly, A.D.; Lafrenie, R.M.; Dotta, B.T. Induction of apoptosis in B16-BL6 Melanoma Cells Following Exposure to Electromagnetic Fields modelled after Intercellular Calcium Waves. FEBS Open Bio 2023. in submission. [Google Scholar]
- Elmore, S. Apoptosis: A Review of Programmed Cell Death. Toxicol. Pathol. 2007, 35, 495–516. [Google Scholar] [CrossRef]
- Mach, Q.H.; Persinger, M.A. Behavioral changes with brief exposures to weak magnetic fields patterned to stimulate long-term potentiation. Brain Res. 2009, 1261, 45–53. [Google Scholar] [CrossRef] [PubMed]


Disclaimer/Publisher’s Note: The statements, opinions and data contained in all publications are solely those of the individual author(s) and contributor(s) and not of MDPI and/or the editor(s). MDPI and/or the editor(s) disclaim responsibility for any injury to people or property resulting from any ideas, methods, instructions or products referred to in the content. |
© 2023 by the authors. Licensee MDPI, Basel, Switzerland. This article is an open access article distributed under the terms and conditions of the Creative Commons Attribution (CC BY) license (https://creativecommons.org/licenses/by/4.0/).
Share and Cite
Ravindran, R.; Branigan, K.S.; Lefebvre, L.M.; Dotta, B.T. Effects of Patterned Electromagnetic Fields and Light-Emitting Diodes on Cancer Cells: Impact on Cell Density and Biophoton Emission When Applied Individually vs. Simultaneously. Appl. Biosci. 2023, 2, 542-549. https://doi.org/10.3390/applbiosci2040034
Ravindran R, Branigan KS, Lefebvre LM, Dotta BT. Effects of Patterned Electromagnetic Fields and Light-Emitting Diodes on Cancer Cells: Impact on Cell Density and Biophoton Emission When Applied Individually vs. Simultaneously. Applied Biosciences. 2023; 2(4):542-549. https://doi.org/10.3390/applbiosci2040034
Chicago/Turabian StyleRavindran, Rahul, Kate S. Branigan, Landon M. Lefebvre, and Blake T. Dotta. 2023. "Effects of Patterned Electromagnetic Fields and Light-Emitting Diodes on Cancer Cells: Impact on Cell Density and Biophoton Emission When Applied Individually vs. Simultaneously" Applied Biosciences 2, no. 4: 542-549. https://doi.org/10.3390/applbiosci2040034
APA StyleRavindran, R., Branigan, K. S., Lefebvre, L. M., & Dotta, B. T. (2023). Effects of Patterned Electromagnetic Fields and Light-Emitting Diodes on Cancer Cells: Impact on Cell Density and Biophoton Emission When Applied Individually vs. Simultaneously. Applied Biosciences, 2(4), 542-549. https://doi.org/10.3390/applbiosci2040034