Abstract
The main research question of this review involved the identification of the various physiological and physical determinants of flat-water kayaking. A systematic search was conducted using three databases (PubMed, Google Scholar, and Microsoft Academic) between 1991 and December 2022. Quality assessment was performed using a version of the National Heart, Lung and Blood Institute checklist tailored for cross-sectional and observational studies. A total of 169 articles were identified in the initial screening. After duplicate removal and further screening for relevance, a total of 17 articles were included in the review. Altogether, it was found that flat-water kayaking performance was strongly correlated with maximum oxygen uptake (VO2max), aerobic and anaerobic thresholds, peak aerobic and anaerobic capacity measure in lab and on the water, and upper and lower-body strength and power, which were measured using heavy resistance, as well as isometric and isokinetic implements. What is less clear is the association between total lean mass and flat-water kayaking performance. However, this may largely be due to the differences in when the measurements were taken.
1. Introduction
Sprint kayaking is performed in a straight line over calm water in a one-, two-, or four-person kayak (K1, K2, or K4, respectively), covering distances of 200, 500, and 1000 m [1,2]. Winning performance requires sprint kayakers to produce and maintain the highest average boat velocity over a set distance [3,4]. To achieve this, sprint kayakers must generate high propulsive forces to overcome the drag forces that act upon the kayak to move forward [5]. The winning medal times at the 2020 Olympic games for female K1 over 200 and 500 m distances were 38.120 s and 107.655 s, respectively, while for male K1 over 200 and 1000 m distances were 33.985 s and 200.643 s, respectively [6]. Interestingly, sprint kayakers rarely specialise in one race distance; many race across several distances despite the stark differences in race times [7].
Regardless of race distance, such performance requires the complex integration of physical and physiological components, with each distance requiring a slightly different demand [2]. For example, maximal aerobic power is a greater predictor of 1000 m sprint kayaking performance compared to that of 200 m, while the opposite is true for maximal anaerobic power (i.e., greater prediction for 200 than 1000 m performance) [2]. Despite the clear differences in physiological requirements between sprint kayaking distances, the relationship between upper-body strength and performance is less clear. For example, McKean and Burkett [8] observed weakening relationships between bench press and pull-up one repetition maximum (1RM) and 200, 500, and 1000 m performance over a three-year period in males, while the opposite was true in females. On the other hand, while some studies have demonstrated a relationship between lean body mass and sprint kayaking performance [9], there are other studies that have found this to be untrue [2,10]. Given the seemingly unclear conclusions that have been drawn from the multitude of studies examining the varying aspects of sprint kayaking performance, there is a need to perform a review to unify these findings. An article that reviews the determinants of sprint kayaking performance will help practitioners in adopting the appropriate training regimes. Therefore, our aim is to critically review the physiological and physical determinants of sprint kayaking performance. A secondary aim is to inform future research and provide guidelines for practitioners
2. Results
2.1. Studies Included in the Review
During the initial search, 125 articles were retrieved from Google Scholar, 17 from PubMed, and 27 from Microsoft Academic, resulting in a total of 169 articles. After manually removing duplicates, there were 159 articles left for review. After reviewing the abstracts for relevant studies, 117 studies were excluded, resulting in 42 articles for retrieval. Upon screening the full texts for relevant information, a further 23 articles were excluded, resulting in a total of 17 articles being included for this review. The study was conducted in accordance with the PRISMA checklist. The PRISMA inclusion/exclusion process is graphically represented in Figure 1.
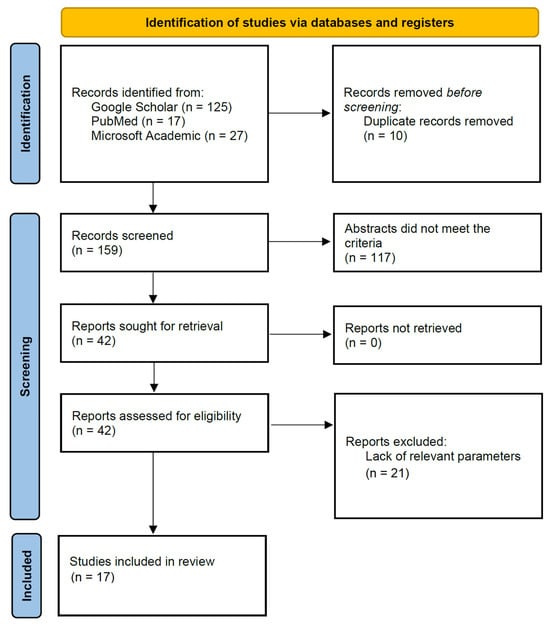
Figure 1.
PRISMA flow chart detailing search strategy.
Only observational studies that sought to examine any type of relationship (using correlational or regression statistics) between various types of physiological or physical variables (e.g., aerobic/anaerobic capacity, strength, and muscle girth) and sprint kayaking performance (i.e., on-water or ergometer time trial performance) were included in this review.
In total, we identified 11 studies that investigated the relationship between physiological measures and sprint kayaking performance in 146 participants; 14 studies investigated measures of strength in 376 participants; and 7 explored measures of anthropometry in 280 participants. Post hoc G*Power (G power 3.1.9.7, Dusseldorf, Germany), based on a large effect size (p = 0.5), indicated that the power obtained for studies investigating the relationship between physiological measures and sprint kayaking performance ranged from 0.32 to 0.93; studies investigating the relationship between strength measures and sprint kayaking performance ranged from 0.40 to 0.99; and studies investigating the relationship between anthropometry measures and sprint kayaking performance ranged from 0.40 to 0.99.
2.2. Quality Assessment Rating
The National Heart, Lung and Blood Institute (NHLBI) checklist produces a qualitative rating (“poor”, “fair”, and “good”) after weighing the various criteria in the paper. Specifically, requiring the critical appraisal of the various criteria laid out in the checklist, the raters came to a conclusion about the quality rating of the study based on how the subjective severity of each criterion influences the study’s overall risk of bias. The checklist does not provide definitive score-to-rating guidelines. Of note, several criteria were not applicable to the cross-sectional study designs used in the studies included in this review (e.g., “Was the time frame sufficient so that one could reasonably expect to see an association between exposure and outcome if it existed?” and “Was loss to follow-up after baseline 20% or less?”). Most of the studies fulfilled the same criteria in general (Table 1); thus, a “poor” rating was only conferred if there was a failure to fulfil a criterion that critically influenced the risk of bias. A total of 4 studies obtained a “good” rating, while 12 studies obtained a “fair” rating. Only one study obtained a “poor” rating. Hence, the current data should be considered to have a low risk of bias.

Table 1.
Characteristics and NHLBI checklist rating of studies included in the review.
3. Discussion
3.1. Physiological Determinants
3.1.1. Metabolic Factors
Maximum Oxygen Uptake
Maximal oxygen uptake (VO2max) represents the highest capacity that can be used to transport and utilise oxygen during exercise [24]. The mechanisms that underpin VO2max can be grouped into central (i.e., ability of the cardiorespiratory system to transport oxygen) and peripheral factors (i.e., the ability to extract and utilise oxygen) [25]. Refer to the work of Bassett and Howley [24] for a full review. In brief, the central factors pertain to cardiac output and arteriovenous O2 difference. On the other hand, peripheral factors pertain to musculoskeletal factors. Though some debate exists, it is generally accepted that central factors limit performance to a greater extent than peripheral factors [24,26]. However, peripheral factors may be influential in exercise and can affect cardiovascular function to improve VO2max [24,27]. Despite the debate in the literature, VO2max is, in general, an indicator of sporting success [28].
Maximal oxygen consumption testing is regularly used to measure aerobic capacity in sprint kayaking. Of the ten available studies that investigated the relationship between VO2max and sprint kayaking performance, nine show a positive inverse relationship (Table 2). Absolute VO2max and VO2peak values have a large to near-perfect [29] inverse correlation with 200 m [−0.59 ≥ r ≥ −0.86] [14,21,22], a large to very-large inverse correlation with 500 m [−0.56 ≥ r ≥ −0.71] [9,12,16], and a moderate to near-perfect inverse correlation with 1000 m [−0.30 ≥ r ≥ −0.90] [14,15,16,18] in relation to sprint kayaking performance. The relationship between relative VO2max and VO2peak values with sprint kayaking performance has been found to be similar. For example, a very large correlation with 200 m [r = −0.76] [14], a small-to-very large inverse correlation with 500 m [−0.21 ≥ r ≥ −0.82] [12,16,30], and a moderate-to-very large inverse correlation with 1000 m [−0.30 ≥ r ≥ −0.84] [14,15,16,17] have been reported within the literature. Only one study has reported opposing findings; Lopez-Plaza et al. [17] found that VO2max was not correlated to 200 m or 1000 m performance [−0.16 ≥ r ≥ −0.18]. However, this study estimated VO2max using a multistage shuttle run test (mp3 version, Coachwise, UK), which, given the differences in locomotion between sprint kayaking and running, may not provide a valid assessment of VO2max.
Table 2.
Relationship between VO2max and VO2peak with sprint kayaking performance.
Based on the findings of Borges et al. [14] and Fry and Morton [16], it appears that the relationship between VO2max and performance is stronger as the distance of the event increases (Table 2). Given that longer durations have a higher total energy demand and turnover, there is a greater need for aerobic ATP resynthesis. The duration of these longer events (e.g., ~35.197 s, 112.494 s, and 211.447 s for 200 m, 500 m, and 1000 m, respectively) means that the relative contribution from the aerobic pathway is increased and that from the anaerobic pathways is reduced as the distance increases [31]. Those with a higher absolute and relative VO2max can achieve higher rates of ATP resynthesis to fuel performance. Interestingly, even in elite samples, VO2max is still related to performance [22], which practically suggests that all levels who compete at longer distances should seek to improve VO2max. For those shorter distances, it is important; however, given the moderate correlations, other factors (e.g., anaerobic) could be involved.
Aerobic and Anaerobic Thresholds
The aerobic threshold is often referred to as the lowest intensity at which there is a sustained increase in blood lactate concentration above resting values; this typically occurs between 40 and 60% VO2max [32]. When measured via gas exchange, the aerobic threshold can be defined in three ways—using ventilatory equivalents (intensity where there is a rise in the ventilatory equivalent of O2 but not CO2), the excess CO2 method (intensity where there is an excess CO2 production), or the V slope method (intensity where there is a visual inflexion of the minute utilisation of CO2 compared to O2) [33]. At exercise intensities greater than the aerobic threshold, there is a linear increase in oxygen consumption (VO2), carbon dioxide (CO2) output, and ventilation. The aerobic threshold has been identified as a predictor of performance in a variety of endurance sports (e.g., running and cycling) and abilities (i.e., trained and untrained) [34,35].
Available data on the relationship between aerobic threshold and sprint kayaking at different distances are limited to two studies [14,16] (Table 3). Both studies concluded that the aerobic threshold has a large inverse correlation with 200 m [r = −0.65] [14], 500 m [r = −0.48] [16], and 1000 m [−0.63 ≥ r ≥ −0.68] [14,16] performance times. The 200 m and 500 m events are of high intensity; hence, they result in the accumulation of high levels of lactate. Therefore, it is plausible that a high aerobic threshold would be favourable as it indicates that athletes would have a higher capacity to buffer hydrogen ions and/or reuse lactate as a fuel [36,37]. Thus, those with a high aerobic threshold can sustain work at the required intensity for a longer period.
Table 3.
Relationship between aerobic threshold and sprint kayaking performance.
While the aerobic threshold has been reported to be a determinant of sprint kayaking performance, it has also been reported that athletes work at an intensity much higher than the aerobic threshold, as indicated by the high level of anaerobic contributions [12]. In view of that, the anaerobic threshold, which is the highest sustained exercise intensity above which production is supplemented by anaerobic mechanisms, may be a more important factor to performance as it is likely closer to the sprint performance exercise intensity.
To the best of our knowledge, only four studies have investigated the relationship between anaerobic threshold and performance times, with all displaying significant correlations (Table 4). The anaerobic threshold has a large to very large correlation with 200 m [−0.54 ≥ r ≥ −0.74] [2,14], a large to very large inverse correlation with 500 m [−0.52 ≥ r ≥ −0.89] [2,12], and a very large inverse correlation with 1000 m performance times [−0.71 ≥ r ≥ −0.83] [15].
Table 4.
Relationship between anaerobic threshold and sprint kayaking performance.
There is a relationship between anaerobic threshold and performance; anaerobic capacity is still important for longer events as it aids in the high-intensity elements. For instance, overcoming the high inertia at the start, as well as sprint finishes. Similarly to VO2max, the relationship between anaerobic threshold and performance times is stronger as the distances increase. This is due to the ability to utilise lactate to resynthesise glucose and the greater capacity to buffer the hydrogen ions, thus allowing athletes to work at a higher intensity for a longer period of time [36,38,39]. Therefore, athletes should look to develop the ability to sustain a high fractional utilisation of their VO2max to become physiologically efficient in sprint kayaking. It is recommended that training at or above the anaerobic threshold intensity is effective in improving the anaerobic threshold in both elite and non-elite individuals [40].
Peak Aerobic Power/Anaerobic Capacity
The peak power and anaerobic capacity are two determinants of performance. Peak power represents the maximum instantaneous power that can be achieved during exercise and on a kayak ergometer over a single stroke period [41]. Anaerobic capacity is the maximal amount of ATP resynthesized via anaerobic metabolism during short-duration, maximal exercise [42]. Biological factors such as muscle size, muscle volume, muscle architecture (e.g., pennation angle and fascicle length), neuromuscular activation, and the ability to develop contractile force affect peak power. Consequently, peak power is an important function that underpins the mechanisms of power output [43,44,45,46].
Several studies have investigated the relationship between peak power output on a kayak ergometer and sprint kayaking performance, reporting a large inverse correlation with 200 m [−0.68 ≥ r ≥ −0.69] [2,10], a large to very large inverse correlation with 500 m [−0.63 ≥ r ≥ −0.84] [2,9], and a large inverse correlation with 1000 m kayaking performance [r = −0.65] [2] (Table 5). Regarding anaerobic capacity, two studies reported a very large inverse correlation between performance times and anaerobic capacity (i.e., 30 s work) [200 m: −0.73 ≥ r ≥ −0.74; 500 m: r = −0.87; 1000 m: r = −0.74) [2,10] (Table 6). With this, fatigue index (i.e., the difference between the peak and minimum power in a Wingate cycle ergometer test) demonstrated a large inverse correlation with 200 m and 500 m, respectively [−0.52 ≥ r ≥ −0.54] [2]. This relationship is not unexpected given that sprint kayaking also has a large lower-limb contribution [47].
Table 5.
Relationship between peak power and sprint kayaking performance.
Table 6.
Relationship between anaerobic capacity and sprint kayaking performance.
As sprint kayaking requires the locomotion of the athlete’s mass, they require a high relative peak power (i.e., W per kg body mass) and anaerobic capacity [14]. Only one study has identified a relationship between the power-to-weight ratio [r = −0.66, large] and 1000 m performance [14]. However, this is not as important compared to land-based sports, as the bodyweight is supported by the water. This demonstrates the importance of upper-limb muscular power in kayaking performance [12]. Hence, it is recommended that athletes improve their power in the upper extremities to enhance kayaking performance.
Other Metabolic Variables
Skeletal muscle oxygenation may determine sprint kayaking performance-related variables (e.g., cadence) [48]. The tissue saturation index is the difference between the change in deoxyhaemoglobin (i.e., when haemoglobin does not combine with oxygen) and oxyhaemoglobin (i.e., haemoglobin combined with oxygen), which indicates the average oxygen saturation of the muscle. Measuring changes in these muscle oxygenation parameters can be used to gain an insight into muscle metabolism [14].
Two studies have determined the relationship between tissue saturation index and kayaking performance (Table 7). Firstly, Borges et al. [14] observed a moderate relationship between tissue saturation index and 200 and 1000 m performance. Paquette et al. [21] found a significantly very large to near-perfect inverse correlation between 200 m time and the oxygen saturation of the latissimus dorsi, biceps brachii, and vastus lateralis. In addition, a large to very large correlation between 200 m time and the deoxyhaemoglobin concentration of the latissimus dorsi and vastus lateralis muscles, as well as a combination of deoxyhaemoglobin concentration of the latissimus dorsi, biceps brachii, and vastus lateralis. Furthermore, a very large correlation was observed between 500 and 1000 m time and the combined deoxyhaemoglobin concentration of the latissimus dorsi, biceps brachii, and vastus lateralis [21]. In addition, Borges et al. [14] found a moderate inverse correlation between 200 m performance and deoxyhaemoglobin concentration, as well as a moderate inverse correlation with 1000 m and deoxyhaemoglobin concentration (see Table 7).
Table 7.
Relationship between tissue saturation index and sprint kayaking performance.
These data indicate that there is greater tissue saturation, higher deoxyhaemoglobin levels, and a greater unloading within the muscles. During the stroke, the forearm muscles are required to perform isometric contractions to hold the paddle, whereas the shoulder complex and muscles such as latissimus dorsi are responsible for the propulsive force in the kayak stroke (specifically at the draw phase of the kayak stroke) [14,49]. These differences may reflect the musculature of the paddle stroke and the ability to rapidly extract oxygen to provide energy to the working muscles. The implication of this may mean that if more haemoglobin is present, more O2 can be contained in the body; therefore, the stronger the aerobic capacity. Practically, those working with sprint kayakers need to adopt training and nutritional strategies to maximise haemoglobin mass within their athletes.
3.2. Strength and Power
Faster kayak velocities have been attributed to greater stroke rates [47,50], which have been identified as a key indicator of sprint kayaking performance [51]. A higher stroke rate translates to a lower stroke time and thus, a more limited window of time in which force can be produced to propel the kayak. As such, it is critical that the athlete produces the greatest amount of force possible in the short interval of each stroke in order to optimise sprint kayaking performance. This requires a high impulse and rate of force development (RFD). Maximal strength capacity, which is the ability to produce the maximal amount of external force [52], has been positively correlated with RFD [53,54,55], highlighting the importance of strength in sprint kayaking performance. Power, which is the product of force and velocity, has also been linked to higher RFD [56], warranting investigating into how power correlates with sprint kayaking performance in the literature.
3.2.1. Upper-Body Pulling Capacity
The majority of studies that have investigated the relationship between sprint kayaking performance and muscular strength have typically measured upper-body pulling and pushing strength. It was found that there was a moderate to very large relationship between upper-limb pulling and pushing strength and sprint kayaking performance, whether the metric was time trial (TT) performance across multiple distances [pulling: −0.49 ≥ r ≥ −0.85; pushing: −0.53 ≥ r ≥ −0.97] or power output on a kayak ergometer [pulling: 0.83 ≤ r ≤ 0.86; pushing: 0.59 ≤ r ≤ 0.74]. These are consolidated in Table 8.
Table 8.
Relationship between upper-body capacity and sprint kayaking performance.
Studies examining the relationship between upper-body pulling strength and on-water sprint kayaking TT duration across various race distances have found large to very large inverse correlations, whether it was with the bench pull [−0.68 ≥ r ≥ −0.85] [11,15], pull-up [−0.59 ≥ r ≥ −0.85], isokinetic pulling power and strength in a simulated kayak stroke [−0.47 ≥ r ≥ −0.66] [2,10], or isometric measures of upper-body pulling strength [−0.70 ≥ r ≥ −0.80] [23]. Further, isometric measures have also been associated with a greater kayak ergometer power output [0.83 ≤ r ≤ 0.86] [19]. It was further reported in another study that the change in isometric bench pull peak force after a period of strength training was positively correlated to the change in 200 m kayak ergometer power output [r = 0.52] [19]. This suggests that isometric strength measures may not just be a suitable alternative to dynamic strength measures when examining transfer to sprint kayaking performance, but that isometric strength itself is a variable that warrants development in sprint kayakers.
Given this wealth of evidence, it is clear that there is a strong role for upper-body pulling strength in sprint kayaking performance. This is unsurprising due to the pulling contribution in horizontal arm action during a paddle stroke [57] that is required to produce an adequate amount of propulsive force to overcome the drag forces acting on the moving kayak and accelerate the boat. However, beyond maximum strength, strength endurance is also critical for sprint kayaking performance, given the multiple strokes that need to be produced consistently over the course of the race. Akca and Muniroglu [11] found that performance in a 1 min bench pull test at 40% 1RM was inversely correlated with 200 m [r = −0.71], 500 m [r = −0.85], and 1000 m [r = −0.65] TT durations. These findings were supported by Broďáni et al. [13], who also found that a test of power endurance in the bench pull was inversely correlated with 200 m [r = −0.51] and 500 m [r = −0.49] TT durations, demonstrating that the strength endurance of the upper-body pulling muscles is also key in sprint kayaking performance. This makes sense given that sprint kayak events are at least 30 s in duration [6] and require multiple kayak strokes to be produced cyclically over the duration of the race. Given the strength and volume of these data, it is important that practitioners make a concerted effort to improve the upper-body pulling capacities of their athletes, whether through dynamic and/or isometric means.
3.2.2. Upper-Body Pushing Capacity
Existing evidence also clearly indicates a strong role of upper-body pushing strength in sprint kayaking performance. Several studies have demonstrated a large to near-perfect inverse correlation between 1RM and 3RM bench press strength and TT durations across 200 m [−0.56 ≥ r ≥ −0.85], 500 m [−0.55 ≥ r ≥ −0.91], and 1000 m [−0.62 ≥ r ≥ −0.97] distances [8,16,22], as well as a large correlation with 120 s all-out kayak ergometer performance [r = 0.59] [9]. Interestingly, Akca and Muniroglu [11] did not find any correlation between 1RM bench press strength and TT duration. This is possibly owing to the non-standard bench press technique (i.e., keeping the lower back in contact with the bench) that was employed, and the participants may not have been confident with maximal exertion in such a position. Nevertheless, all other studies that measured 1RM or 3RM bench press strength found an inverse correlation with TT duration across multiple distances. In addition to dynamic strength measurements, isometric bench press peak force and RFD were inversely correlated with 200 m sprint kayak TT duration [−0.53 ≥ r ≥ −0.75], as well as being positively correlated with kayak ergometer mean power output [0.64 ≤ r ≤ 0.79] [19]. Altogether, these findings provide strong evidence in relation to the importance of upper-body pushing strength in sprint kayaking performance.
These data are of no surprise given the upper-body kinematics of paddling outlined in a study by Mann and Kearney [57], where they described both a push and pull component of horizontal arm action during a paddle stroke. The ability to produce a greater pushing strength should translate to a greater force production in the aforementioned push component and thus, a better sprint kayaking performance. Further, Akca and Muniroglu [11] found that performance in a 1 min bench press test at 40% 1RM was inversely correlated with 200 m [r = −0.80], 500 m [r = −0.89], and 1000 m [r = −0.72] TT durations, suggesting the importance of upper-body strength endurance in sprint kayaking performance. Surprisingly, Broďáni et al. [13] found that there were no correlations between tests of maximum power and power endurance in the bench press and the 200 m, 500 m, and 1000 m events. However, it must be noted that the study procedures were unclear. That is, the loading conditions and process for selecting loads were not reported. This is important as the load has a direct impact on the magnitude of the power value during pushing and pulling exercise [58]. Moreover, the sprint kayaking times were taken from an unknown period between 2019 and 2021 (the corresponding author was contacted but no reply was received). Thus, the results must be interpreted with caution.
3.2.3. Lower-Body Capacity
While there is a greater relative abundance of research demonstrating correlations between upper-body pulling and pushing strength and sprint kayaking performance, it does not discount the importance of lower-body strength on sprint kayaking performance. Isometric squat peak force has been found to have a moderate to large correlation with 200 m TT duration [−0.44 ≥ r ≥ −0.67] and 200 m kayak ergometer power output [0.47 ≤ r ≤ 0.61] [19]. Moreover, Pickett et al. [22] found that isometric mid-thigh pull force at 0.03 s was correlated with 200 m TT duration [r = −0.49], while Hamano et al. [9] found that isokinetic knee flexion strength was positively correlated with the average power produced during a 120 s all-out kayak ergometer test [0.71 ≤ r ≤ 0.72]. It was also reported that the change in isometric squat peak force after a period of training was positively correlated to the change in 200 m ergometer kayaking power output [r = 0.52] [20]. While Pickett et al. [22] reported no significant relationship between deadlift strength and sprint kayaking performance, this may have been due to the 2 min rest periods between maximal attempts, which may have been too short [59,60] and likely reduced maximal force production in subsequent sets, thus potentially hindering the expression of a more accurate 1RM. Additionally, López-Plaza et al. [17,18] found that countermovement jump performance was inversely correlated with 200 m [r = −0.23], 500 m [r = −0.39], and 1000 m [r = −0.23] TT durations, indicating the importance of lower-body power in sprint kayaking performance. These are consolidated in Table 9.
Table 9.
Relationship between lower-body capacity and sprint kayaking performance.
Together, these studies provide evidence for the importance of lower-body strength and power in enhancing sprint kayaking performance. This is unsurprising, given how the greater involvement of leg musculature during kayaking is one of the differentiating factors between international-, national-, and club-level kayakers [47], as well as there being evidence to show that lower-limb force production is responsible for up to 21% of the force produced during a paddle stroke and 16% of the average kayak speed [61]. While there are far fewer studies that have shown a positive association between lower-body strength and power and sprint kayaking performance, this is largely due to the dearth of studies that have investigated this relationship in the first place, with only 5 out of the 12 studies in this review having conducted lower-body strength and/or power tests.
While it was shown in Table 2 that the relationship between VO2max and performance is stronger as the distance of the event increases, the magnitude of the relationship between strength measures and kayaking performance distance is distinct. For example, Akca and Muniroglu [11] reported that the relationship between strength measures and 500 m kayaking performance was higher than that observed for 200 m and 1000 m events. This was supported by the findings of van Someren and Howatson [2], who also reported a higher correlation between strength measures and 500 m kayaking performance compared to 200 m kayaking performance. However, McKean and Burkett [8] reported that strength measures had the highest correlation with 1000 m kayaking performance after three years of training. One possible reason for the current observation could be that 200 m kayakers, in general, place a lot of focus on developing maximum strength, as the event requires them to generate a high amount of force in order for the boat to travel fast over the short distance. Hence, kayakers in this event would likely have similar strength statuses. In this case, performance for the 200 m event would then have to a greater dependence on other factors. On the other hand, kayakers in longer-distance events may have placed more emphasis on developing their aerobic and anaerobic capacity and less on strength development. Hence, kayakers with greater strength levels may then be able to have an edge over their competitors.
In conclusion, there is a large amount of evidence to suggest that both upper- and lower-body strength are key in sprint kayaking performance. As such, significant emphasis should be placed on strength training. Strength training has been shown to contribute positively to increases in RFD [62,63], with one study showing that maximal strength may account for up to 80% of the variance in RFD in the 150–250 ms range [64]. If increases in maximal strength are sought, strength training should be performed at higher relative intensities, i.e., 80% and above [65,66].
3.3. Physical Determinants
3.3.1. Anthropometry
Athletes’ anthropometric characteristics might also influence performance in sprint kayaking. In sprint kayaking, distinct anthropometry has been linked to higher-level performances. For example, elite sprint kayakers tend to be taller and heavier than their sub-elite counterparts [16,67,68]. Similarly, successful male kayakers have a certain morphology and anthropometric attributes [10,16]. As such, their stature, arm span, leg length, and arm fat mass have a positive relationship with their performance [9]. Whilst this information is important for applied practitioners working with sprint kayakers, there is little information on how these anthropometric characteristics differ between race distances. Indeed, most studies have simply provided anthropometric characteristics between distinctive levels of performance. In addition, these data were identified almost 20 years ago and there is a need to pull this information together. It is important as some talent identification programmes, e.g., handball, futsal, and rhythmic gymnastics, base some characteristics such as stature as a determinant to identify talented athletes [69,70,71]. Furthermore, a recent study identified and included stature and body mass within their identification model, and anthropometry made up 16% of the priority in relation to identifying talent in sprint kayaking athletes [72]. Importantly, readers should be aware that only body mass is modifiable; if sprint kayakers are aiming to increase body mass, then this should be conducted by accruing lean body mass. Therefore, practitioners may wish to monitor body composition variables alongside changes in body mass.
3.3.2. Muscle Girth and Mass
Muscle girth and fibre size have been positively correlated with force production [73]. An increased muscle girth theoretically translates to an increase in sarcomere formation and thus the potential for the formation of more actin–myosin cross-bridges, allowing for a higher force production. However, it must be noted that force production has both neural and muscular components, and a larger muscle girth does not necessarily translate to a greater ability to produce force, especially when compared across different training populations [74,75]. That said, the comparison may be more appropriate for relatively homogenous well-trained populations [76,77] such as across groups of kayakers. This is consolidated in Table 10.
Table 10.
Relationship between lean mass and/or muscle girths and sprint kayaking performance.
Multiple studies have found an inverse correlation between the girths of the upper limbs and chest with sprint kayaking TT duration [−0.42 ≥ r ≥ −0.80] [2,10,11,16], as well as a positive correlation with kayak ergometer power output [r = 0.83] [9]. Of note, the nature of most anthropometric measurements would mean that bicep girth also includes the triceps, while a chest girth measurement would also include the muscles of the back, such as the latissimus dorsi. The triceps and chest are heavily involved in upper-body pushing action, while the biceps and latissimus dorsi are heavily involved in upper-body pulling action. As mentioned above, these are actions that are heavily involved in the propulsion of the kayak [57]. As such, it appears that a better muscular development of these areas is associated with a better sprint kayaking performance.
Further, lower-limb girths have been both inversely correlated with sprint kayaking TT duration [−0.77 ≥ r ≥ −0.81] [11] and positively correlated with kayak ergometer power output [r = 0.91] [9]. Once again, this is expected given the earlier established importance of lower limb force production on sprint kayaking performance [47,61]; increased muscular development in these areas should lead to a better sprint kayaking performance.
Lastly, trunk girth has been positively correlated with kayak ergometer power output [0.74 ≤ r ≤ 0.75] [9]. This association is expected given the high and constant activation of the trunk musculature throughout a paddling cycle [47], as well as a notational analysis demonstrating the importance of trunk actions in sprint kayaking performance. Considered in conjunction with the earlier established relationship between muscle girth and force production in a relatively homogenous training population, it is expected that better-developed muscles would aid performance through enhanced strength and power.
On the other hand, the correlation between total lean body mass and sprint kayaking performance is less clear. While Hamano et al. [9] found that total, arm, leg, and trunk lean mass was positively correlated with kayak ergometer power output [0.64 ≤ r ≤ 0.90], two other studies investigating the relationship between lean body mass and on-water sprint kayaking TT duration did not [2,10]. A possible explanation could be the method by which lean body mass was derived (dual-energy x-ray absorptiometry scans vs. skinfold analysis). Another possible explanation could be the difference in the way sprint kayaking performance was determined (kayak ergometer in the work of Hamano et al. [9] vs. on-water kayaking in the works of van Someran and Howatson [2] and van Someran and Palmer [10]). Testing on the kayak ergometer does not account for technical competency such as the ability to maintain equilibrium on the boat. Another possibility could be the differences in the period of their macrocycle in which the participants were tested. As short-term gains in myofibrillar hypertrophy likely have a negligible impact on force production [78], a lack of correlation between lean mass and sprint kayaking performance could potentially be due to individuals being tested earlier in their off-season. Given the lack of clarity and the dearth of the current body of evidence, more work has to be carried out in this area to ascertain the relationship between lean body mass and sprint kayaking performance before we can draw any definitive conclusions.
Nonetheless, there is sufficient evidence to suggest that upper- and lower-limbs as well as trunk, girths are positively associated with sprint kayaking performance, indicating that it may be prudent to dedicate a certain portion of the athletes’ training sessions towards muscular hypertrophy. While muscle hypertrophy generally occurs across a broad range of intensities [79], it is important to note that sets should generally be taken closer to failure than if the goal were solely maximal strength [65]. Further, most individuals have a limited amount of time to train and may be better served by performing sets on the heavier side in order to shorten the amount of time taken to reach failure, concurrently fulfilling the dual role of developing higher force production capabilities.
3.4. Gaps in the Research
Based on the results of this review, there are a limited number of studies that have investigated the metabolic requirements for successful sprint kayaking performance. A comprehensive assessment of the metabolic requirements and determinants of sprint kayaking performance will support athletes when programming training regimens. Therefore, future studies should look to do this, especially pertaining to work surrounding the lactate threshold, e.g., transition from a heavy to a severe domain, which is particularly lacking.
The relationship between VO2max and anaerobic threshold with race performance is stronger as the race distance increases. However, the relationship between peak power, anaerobic capacity, aerobic threshold, and anaerobic power reserve to race distance is unclear and requires establishment [80]. This is especially important, given that sprint kayakers rarely specialise in one race distance. Establishing the relationship between physiological and physical qualities with race distance will support sprint kayakers when looking to track performance over time [81], as well as in planning and programming their training. Therefore, there is a gap in research relating to identifying how an athlete should train in order to be successful over a range of race distances over time. Whilst correlational and cross-sectional data are useful, researchers should employ more robust interventional methodologies.
When discussing the literature concerning the relationship between strength and sprint kayaking performance, there is a plethora of studies suggesting the importance of both upper-body pulling and pushing capacity in improving sprint kayaking performance and kayak ergometer power. However, this abundance of research does not apply to the relationship between lower-body capacity and sprint kayaking performance. Given that the lower body theoretically plays an important role in sprint kayaking performance based on its kinematics, there is a need for further research exploring the effects of lower-body muscle function (e.g., lower-body strength and the rate of force production) on said performance. Another point to take note of is that only one study included in the review investigated the relationship between strength measures and kayaking performance specifically in females, with results showing a small correlation [18]. The strength measures used were mainly medicine ball throws, which differed from the traditional strength measurements (e.g., 1RM, isometric, and isokinetic). Furthermore, the participants were young female athletes that might not have developed technical proficiency yet. Hence, more studies investigating the relationship between maximal strength (e.g., 1RM, isometric, and isokinetic peak force) and sprint kayaking are required to better understand the influence of muscular strength on sprint kayaking performance in female athletes.
Even the relationship between lean mass and sprint kayaking performance is unclear. There are almost just as many studies that have shown a positive correlation as there are those that do not. It might be worthwhile to consider longitudinal studies carried out over an entire competition period (between the off-season and competitive season), where correlations between lean mass and sprint kayaking performance are constantly monitored. Furthermore, using a long-term athletic development approach, researchers and/or practitioners could track changes in lean mass and the effect this has on performance. A final consideration to make is that there may be some point of diminishing returns and/or a negative effect of increasing lean mass on sprint kayaking performance, as it is likely to affect relative strength and power—a relationship that may be more pertinent with longer-distance races.
3.5. Practical Recommendations
From the review, several variables that are key for sprint kayaking performance have been identified. Specifically, it seems that aerobic and anaerobic thresholds, VO2max, 1RM pull-up and bench press strength, and muscle girths were all highly correlated with sprint kayaking performance across 200, 500, and 1000 m race distances; thus, improving these would be key for enhancing said performance.
From a practical standpoint, practitioners may monitor the maximal aerobic power (MAP) of the athletes. This variable can be used as an indication of the athletes’ cardiovascular function. The MAP profiles will have to be determined individually and specifically for on-water performances [80,82]. Similarly, given the importance of upper-body strength in sprint kayaking performance, maximal strength testing should be performed early on in the training cycle. Practitioners may adopt either 1RM or isometric tests for bench presses, bench pulls, and squats to monitor the strength development of the athletes.
Practitioners may use the MAP obtained to determine the appropriate training intensity to improve the athletes’ anaerobic and aerobic capacities. Each individual should train at an appropriate percentage of MAP and work–rest ratios to elicit favourable changes in either anaerobic or aerobic capacities—the focus of which will depend on what the individual lacks, as well as their training phase within the periodization cycle. Practitioners may also determine the strength training loads based on individual 1RM values. The appropriate weights should match the varying intensities across the athlete’s training macrocycle, with the overarching goal of being able to produce as much force as possible in both upper- and lower-body exercises.
4. Materials and Methods
Search Strategy
The studies included for review in this paper were gathered according to the Preferred Reporting Items for Systematic reviews and Meta-analyses (PRISMA) guidelines [83]. The literature search and verification were conducted by the two lead authors (A.D. and Y-S.L.)
A systematic search of three databases was performed (PubMed, Google Scholar, and Microsoft Academic). Only articles published in English were considered. Using Boolean logic, databases were searched to identify articles containing the following keywords and combinations:
(a) ‘kayaking’ OR ‘sprint’ OR ‘flat water’ OR ‘kayaking’ OR ‘water-sport’ OR ‘kayak’ OR ‘kayak ergometer’;
(b) ‘VO2’ OR ‘maximal oxygen uptake’ OR ‘oxygen consumption’ OR ‘lactate threshold’ OR ‘economy’ OR ‘anaerobic power’ OR ‘aerobic capacity’ OR ‘power at VO2max’ OR ‘VO2 at lactate threshold’ OR ‘metabolic accumulation’ OR ‘blood lactate’ OR ‘anaerobic threshold’ OR ‘critical power’ OR Critical speed’ OR ‘acceleration’ OR ‘arm span’ OR ‘sitting height’ OR ‘height’ OR ‘stature’ OR ‘body mass’ OR ‘flexibility’ OR ‘strength’ OR ‘endurance’ OR ‘anthropometry’ OR ‘physiological’ OR ‘physical’ OR ‘power’ OR ‘maximal power’ OR ‘power:weight ratio’ OR ‘skinfold’ OR ‘fat-free mass’ OR ‘lean mass’ OR ‘body composition’ OR ‘fat mass’.
5. Conclusions
There is a seemingly unclear conclusion in previous studies examining the determinants of sprint kayak performance; our aim was to critically review the physiological and physical determinants of sprint kayak performance in order to support future research and provide guidelines for practitioners. Our review of the existing literature has highlighted the need for clarity with notable gaps, with insights for future research and practical application. As such, the strong relationship between VO2max and anaerobic threshold and race performance, with increasing race distances, highlights the importance of these determinants in shaping the competitive outcomes for sprint kayak performance. However, given that the relationship between peak power, anaerobic capacity, aerobic threshold, and anaerobic power reserve and race distance is unclear highlights the need for further research. The call for establishing these relationships, as identified by Sandford et al. [80] is especially pertinent given the multifaceted nature of sprint kayaking, where athletes often compete across various race distances. Understanding how physiological and physical qualities interplay with race distance is imperative not only for tracking performance over time, as highlighted by Winchcombe et al. [81], but also for informing the design of effective training programmes that can enhance the overall performance across an array of race distances.
This review also underscores the need for a more nuanced exploration of the relationship between lower-body muscle function and sprint kayaking performance. While upper-body pulling and pushing capacity have been extensively studied, the lower body’s role remains less clear, despite its theoretical importance in the kinematics of sprint kayaking. Future research should investigate the effects of lower-body muscle function, such as the strength and rate of force production, on overall performance.
The complex and inconclusive nature of the relationship between lean mass and sprint kayaking performance requires further investigation, with considerations for longitudinal studies spanning entire competition periods. Monitoring the correlations between lean mass and performance over time, as well as adopting a long-term athletic development approach, could provide a clearer understanding of how changes in lean mass may impact performance. Additionally, the exploration of potential diminishing returns or negative effects of increasing lean mass on performance, particularly in longer-distance races, adds a layer of complexity that warrants further attention.
Moving forward, researchers and practitioners should strive for more robust interventional methodologies to complement correlational and cross-sectional data. By addressing these research gaps, we can better guide the training and development of sprint kayakers, ultimately optimising their performance across a variety of race distances, as well as advancing our understanding of the intricate interplay between physiological and physical determinants in relation to sprint kayaking.
Author Contributions
Conceptualization: Y.S.L., A.D., D.L., F.T. and J.F.T.F.; methodology: Y.S.L. and A.D.; validation: Y.S.L., A.D., D.L. and J.F.T.F.; formal analysis: Y.S.L. and A.D.; data curation: Y.S.L. and A.D.; writing—original draft preparation: Y.S.L. and A.D.; writing—review and editing: D.L., F.T. and J.F.T.F.; supervision: D.L. and J.F.T.F. All authors have read and agreed to the published version of the manuscript.
Funding
This research received no external funding.
Institutional Review Board Statement
Not applicable.
Informed Consent Statement
Not applicable.
Data Availability Statement
No new data were created or analyzed in this study. Data sharing is not applicable to this article.
Conflicts of Interest
The authors declare no conflicts of interest.
Abbreviations
The following abbreviations are used in this manuscript:
| 1RM | 1 repetition maximum |
| 3RM | 3 repetition maximum |
| ATP | Adenosine triphosphate |
| VO2max | Maximal oxygen uptake |
References
- Dingley, A.F.; Willmott, A.P.; Fernandes, J.F.T. Self-selected versus standardised warm-ups; physiological response on 500 m sprint kayak performance. Sports 2020, 8, 156. [Google Scholar] [CrossRef] [PubMed]
- van Someren, K.; Howatson, G. Prediction of flatwater kayaking performance. Int. J. Sports Physiol. Perform. 2008, 3, 207–218. [Google Scholar] [CrossRef]
- Baker, J. Biomechanics of paddling. In Proceedings of the ISBS-Conference Proceedings Archive, Melbourne, Australia, 2–6 July 2012. [Google Scholar]
- McDonnell, L.K.; Hume, P.A.; Nolte, V. A deterministic model based on evidence for the associations between kinematic variables and sprint kayak performance. Sports Biomech. 2013, 12, 205–220. [Google Scholar] [CrossRef]
- Baudouin, A.; Hawkins, D. A biomechanical review of factors affecting rowing performance. Br. J. Sports Med. 2002, 36, 396–402. [Google Scholar] [CrossRef]
- International Canoe Federation. World Top Athletes List in Canoe Sprint. 2018. Available online: https://www.canoeicf.com/canoe-sprint-world-championships/montemor-o-velho-2018/results (accessed on 21 May 2025).
- Zouhal, H.; Le Douairon Lahaye, S.; Ben Abderrahaman, A.; Minter, G.; Herbez, R.; Castagna, C. Energy system contribution to Olympic distances in flat water kayaking (500 and 1,000 m) in highly trained subjects. J. Strength Cond. Res. 2012, 26, 825–831. [Google Scholar] [CrossRef]
- McKean, M.R.; Burkett, B.J. The Influence of Upper-Body Strength on Flat-Water Sprint Kayak Performance in Elite Athletes. Int. J. Sports Physiol. Perform. 2014, 9, 707–714. [Google Scholar] [CrossRef]
- Hamano, S.; Ochi, E.; Tsuchiya, Y.; Muramatsu, E.; Suzukawa, K.; Igawa, S. Relationship between performance test and body composition/physical strength characteristic in sprint canoe and kayak paddlers. J. Sports Med. 2015, 6, 191–199. [Google Scholar]
- van Someren, K.; Palmer, G.S. Prediction of 200-m sprint kayaking performance. Can. J. Appl. Physiol. 2003, 28, 505–517. [Google Scholar] [CrossRef]
- Akca, F.; Muniroglu, S. Anthropometric-somatotype and strength profiles and on-water performance in Turkish elite kayakers. Int. J. Appl. Sports Sci. 2008, 20, 22–34. [Google Scholar]
- Bishop, D.; Bonetti, D.; Dawson, B. The influence of pacing strategy on VO2 and supramaximal kayak performance. Med. Sci. Sports Exerc. 2002, 34, 1041–1047. [Google Scholar] [CrossRef] [PubMed]
- Broďáni, J.; Dvořáčková, N.; Czaková, M.; Malík, Z.; Lopata, P. Share of strength parameters of bench press and barbell bench pull on a horizontal bench in sports performance in kayak disciplines. Phys. Educ. Theory Methodol. 2021, 21, 90–95. [Google Scholar] [CrossRef]
- Borges, T.O.; Dascombe, B.; Bullock, N.; Coutts, A.J. Physiological characteristics of well-trained junior sprint kayak athletes. Int. J. Sports Physiol. Perform. 2015, 10, 593–599. [Google Scholar] [CrossRef]
- Forbes, S.C.; Fuller, D.L.; Krentz, J.R.; Chilibeck, P.D. Anthropometric and physiological predictors of flat-water 1000 m kayak performance in young adolescents and the effectiveness of a high volume Training Camp. Int. J. Exerc. Sci. 2009, 2, 106–114. [Google Scholar] [CrossRef]
- Fry, R.W.; Morton, A.R. Physiological and kinanthropometric attributes of elite flatwater kayakists. Med. Sci. Sports Exerc. 1991, 23, 1297. [Google Scholar] [CrossRef]
- López-Plaza, D.; Alacid, F.; Muyor, J.M.; López-Miñarro, P.Á. Sprint kayaking and canoeing performance prediction based on the relationship between maturity status, anthropometry and physical fitness in young elite paddlers. J. Sports Sci. 2017, 35, 1083–1090. [Google Scholar] [CrossRef]
- López-Plaza, D.; Alacid, F.; Rubio-Arias, J.Á.; López-Miñarro, P.Á.; Muyor, J.M.; Manonelles, P. Morphological and physical fitness profile of young female sprint kayakers. J. Strength Cond. Res. 2019, 33, 1963–1970. [Google Scholar] [CrossRef]
- Lum, D.; Aziz, A.R. Relationship between isometric force–time characteristics and sprint kayaking performance. Int. J. Sports Physiol. Perform. 2012, 16, 474–479. [Google Scholar] [CrossRef]
- Lum, D.; Barbosa, T.M.; Balasekaran, G. Sprint kayaking performance enhancement by isometric strength training inclusion: A randomized controlled trial. Sports 2021, 9, 16. [Google Scholar] [CrossRef]
- Paquette, M.; Bieuzen, F.; Billaut, F. Muscle oxygenation rather than VO2max as a strong predictor of performance in sprint canoe-kayak. Int. J. Sports Physiol. Perform. 2018, 13, 1299–1307. [Google Scholar] [CrossRef] [PubMed]
- Pickett, C.W.; Nosaka, K.; Zois, J.; Hopkins, W.G.; Blazevich, A.J. Maximal upper-body strength and oxygen uptake are associated with performance in high-level 200-m sprint kayakers. J. Strength Cond. Res. 2018, 32, 3186–3192. [Google Scholar] [CrossRef]
- Ualí, I.; Herrero, A.J.; Garatachea, N.; Marín, P.J.; Alvear-Ordenes, I.; García-López, D. Maximal strength on different resistance training rowing exercises predicts start phase performance in elite kayakers. J. Strength Cond. Res. 2012, 26, 941–946. [Google Scholar] [CrossRef]
- Bassett, D.R.; Howley, E.T. Limiting factors for maximum oxygen uptake and determinants of endurance performance. Med. Sci. Sports Exerc. 2000, 32, 70–84. [Google Scholar] [CrossRef]
- Lundby, C.; Montero, D.; Joyner, M. Biology of VO2 max: Looking under the physiology lamp. Acta Physiol. 2017, 220, 218–228. [Google Scholar] [CrossRef]
- Levine, B.D. VO2max: What do we know, and what do we still need to know? J. Physiol. 2008, 586, 25–34. [Google Scholar] [CrossRef]
- Wang, L.; Lee, Y.; Wu, Y.; Zhang, X.; Jin, C.; Huang, Z.; Wang, Y.; Wang, Z.; Kris-Etherton, P.; Wu, S.; et al. A prospective study of waist circumference trajectories and incident cardiovascular disease in China: The Kailuan cohort study. Am. J. Clin. Nutr. 2021, 113, 338–347. [Google Scholar] [CrossRef]
- Joyner, M.J.; Coyle, E.F. Endurance exercise performance: The physiology of champions. J. Physiol. 2008, 586, 35–44. [Google Scholar] [CrossRef]
- Cohen, D. Statistical Power Analysis for the Behavioral Science, 2nd ed.; Lawrence Erlbaum: Mahwah, NJ, USA, 1988. [Google Scholar]
- López-Plaza, D.; Manonelles, P.; López-Miñarro, P.Á.; Muyor, J.M.; Alacid, F. A longitudinal analysis of morphological characteristics and body proportionality in young elite sprint paddlers. Phys. Sports Med. 2019, 47, 479–486. [Google Scholar] [CrossRef] [PubMed]
- Chamari, K.; Padulo, J. ‘Aerobic’ and ‘Anaerobic’ terms used in exercise physiology: A critical terminology reflection. Sports Med.-Open 2015, 1, 9. [Google Scholar] [CrossRef] [PubMed]
- Tanner, R.; Gore, C. Physiological Tests for Elite Athletes; Human Kinetics: Champaign, IL, USA, 2013. [Google Scholar]
- Gaskill, S.; Ruby, B.; Walker, A.; Sanchez, O.; Serfass, R.; Leon, A. Validity and reliability of combining three methods to determine ventilatory threshold. Med. Sci. Sports Exerc. 2001, 33, 1841–1848. [Google Scholar] [CrossRef]
- Costill, D.L.; Thomason, H.; Roberts, E. Fractional utilization of the aerobic capacity during distance running. Med. Sci. Sports 1973, 5, 248–252. [Google Scholar] [CrossRef]
- Weltman, A. The Blood Lactate Response to Exercise; Human Kinetics: Champaign, IL, USA, 1995. [Google Scholar]
- Chatham, J.C. Lactate—The forgotten fuel! J. Physiol. 2002, 542, 333. [Google Scholar] [CrossRef]
- Van Hall, G. Lactate as a fuel for mitochondrial respiration. Acta Physiol. Scand. 2000, 168, 643–656. [Google Scholar] [CrossRef]
- Brooks, G.A. Lactate doesn’t necessarily cause fatigue: Why are we surprised? J. Physiol. 2001, 536, 1. [Google Scholar] [CrossRef] [PubMed]
- Brooks, G.A. Lactate: Link between glycolytic and oxidative metabolism. Sports Med. 2007, 37, 341–343. [Google Scholar] [CrossRef]
- Ghosh, A.K. Anaerobic threshold: Its concept and role in endurance sport. Malays. J. Med. Sci. 2004, 11, 24. [Google Scholar] [PubMed]
- Osborne, M.; Chapman, D.; Gardner, S. Ergometer-based maximal neuromuscular power. In Physiological Tests for Elite Athletes; Tanner, R., Gore, C., Eds.; Human Kinetics: Champaign, IL, USA, 2013; pp. 45–57. [Google Scholar]
- Green, S. Applied Physiology. Med. J. Aus 1946, 2, 844. [Google Scholar]
- Aagard, P.; Andersen, J.L.; Dyhre-Poulsen, P.; Leffers, A.-M.; Wagner, A.; Magnusson, S.P.; Halkjær-Kristensen, J.; Simonsen, E.B. A mechanism for increased contractile strength of human pennate muscle in response to strength training: Changes in muscle architecture. J. Physiol. 2001, 534, 613–623. [Google Scholar] [CrossRef]
- Blazevich, A.J.; Coleman, D.R.; Horne, S.; Cannavan, D. Anatomical predictors of maximum isometric and concentric knee extensor moment. Eur. J. Appl. Physiol. 2009, 105, 869–878. [Google Scholar] [CrossRef]
- Driss, T.; Vandewalle, H. The measurement of maximal (anaerobic) power output on a cycle ergometer: A critical review. BioMed Res. Int. 2013, 2013, e589361. [Google Scholar] [CrossRef]
- Kordi, M.; Folland, J.; Goodall, S.; Haralabidis, N.; Maden-Wilkinson, T.; Sarika Patel, T.; Leeder, J.; Barratt, P.; Howatson, G. Mechanical and morphological determinants of peak power output in elite cyclists. Scand. J. Med. Sci. Sports 2020, 30, 227–237. [Google Scholar] [CrossRef]
- Brown, B.M.; Lauder, M.; Dyson, R. Notational analysis of sprint kayaking: Differentiating between ability levels. Int. J. Perform. Analysis Sport 2011, 11, 171–183. [Google Scholar] [CrossRef]
- Shastri, L.; Alkhalil, M.; Forbes, C.; El-Wadi, T.; Rafferty, G.; Ishida, K.; Formenti, F. Skeletal muscle oxygenation during cycling at different power output and cadence. Physiol. Rep. 2019, 7, e13963. [Google Scholar] [CrossRef]
- Fleming, N.; Donne, B.; Fletcher, D.; Mahony, N. A biomechanical assessment of ergometer task specificity in elite flatwater kayakers. J. Sports Sci. Med. 2012, 11, 16–25. [Google Scholar] [PubMed]
- Hay, J.G.; Yanai, T. Evaluating the Techniques of Elite U.S. Kayakers. A Report to U.S. Olympic Committee and U.S. Canoe and Kayak Team; University of Iowa: Iowa City, IA, USA, 1996. [Google Scholar]
- Gomes, B.B.; Ramos, N.V.; Conceição, F.; Sanders, R.; Vaz, M.; Vilas-Boas, J.P. Paddling time parameters and paddling efficiency with the increase in stroke rate in kayaking. Sports Biomech. 2022, 21, 1303–1311. [Google Scholar] [CrossRef]
- Zatsiorsky, V.; Kraemer, W.; Fry, A. Science and Practice of Strength Training, 3rd ed.; Human Kinetics: Champaign, IL, USA, 2020. [Google Scholar]
- Bazyler, C.D.; Sato, K.; Wassinger, C.A.; Lamont, H.S.; Stone, M.H. The efficacy of incorporating partial squats in maximal strength training. J. Strength Cond. Res. 2014, 28, 3024–3032. [Google Scholar] [CrossRef]
- Mirkov, D.M.; Nedeljkovic, A.; Milanovic, S.; Jaric, S. Muscle strength testing: Evaluation of tests of explosive force production. Eur. J. Appl. Physiol. 2004, 91, 147–154. [Google Scholar] [CrossRef] [PubMed]
- Mosti, M.P.; Carlsen, T.; Aas, E.; Hoff, J.; Stunes, A.K.; Syversen, U. Maximal strength training improves bone mineral density and neuromuscular performance in young adult women. J. Strength Cond. Res. 2014, 28, 2935–2945. [Google Scholar] [CrossRef]
- Häkkinen, K.; Myllylä, E. Acute effects of muscle fatigue and recovery on force production and relaxation in endurance, power and strength athletes. J. Sports Med. Phys. Fit. 1990, 30, 5–12. [Google Scholar]
- Mann, R.V.; Kearney, J. A biomechanical analysis of the Olympic-style flatwater kayak stroke. Med. Sci. Sports Exerc. 1980, 12, 183. [Google Scholar] [CrossRef]
- Fernandes, J.F.T.; Lamb, K.L.; Twist, C. A comparison of load-velocity and load-power relationships between well-trained young and middle-aged males during three popular resistance exercises. J. Strength Cond. Res. 2018, 32, 1440–1447. [Google Scholar] [CrossRef] [PubMed]
- González-Hernández, J.M.; Jimenez-Reyes, P.; Janicijevic, D.; Tufano, J.J.; Marquez, G.; Garcia-Ramos, A. Effect of different interset rest intervals on mean velocity during the squat and bench press exercises. Sports Biomech. 2020, 22, 834–847. [Google Scholar] [CrossRef]
- Willardson, J.M.; Burkett, L.N. The effect of rest interval length on bench press performance with heavy vs. light loads. J. Strength Cond. Res. 2006, 20, 396–399. [Google Scholar] [CrossRef]
- Nilsson, J.E.; Rosdahl, H.G. Contribution of leg-muscle forces to paddle force and kayak speed during maximal-effort flat-water paddling. Int. J. Sports Physiol. Perform. 2016, 11, 22–27. [Google Scholar] [CrossRef]
- Aagaard, P.; Simonsen, E.B.; Andersen, J.L.; Magnusson, P.; Dyhre-Poulsen, P. Increased rate of force development and neural drive of human skeletal muscle following resistance training. J. Appl. Physiol. 2002, 93, 1318–1326. [Google Scholar] [CrossRef]
- Andersen, L.L.; Andersen, J.L.; Zebis, M.K.; Aagaard, P. Early and late rate of force development: Differential adaptive responses to resistance training? Scand. J. Med. Sci. Sports 2010, 20, e162–e169. [Google Scholar] [CrossRef]
- Andersen, L.L.; Aagaard, P. Influence of maximal muscle strength and intrinsic muscle contractile properties on contractile rate of force development. Eur. J. Appl. Physiol. 2006, 96, 46–52. [Google Scholar] [CrossRef]
- Fink, J.; Kikuchi, N.; Yoshida, S.; Terada, K.; Nakazato, K. Impact of high versus low fixed loads and non-linear training loads on muscle hypertrophy, strength and force development. Springerplus 2016, 5, 698. [Google Scholar] [CrossRef] [PubMed]
- Schoenfeld, B.J.; Contreras, B.; Vigotsky, A.D.; Peterson, M. Differential Effects of Heavy Versus Moderate Loads on Measures of Strength and Hypertrophy in Resistance-Trained Men. J. Sports Sci. Med. 2016, 15, 715–722. [Google Scholar] [PubMed]
- Ackland, T.R.; Ong, K.B.; Kerr, D.A.; Ridge, B. Morphological characteristics of Olympic sprint canoe and kayak paddlers. J. Sci. Med. Sport. 2003, 6, 285–294. [Google Scholar] [CrossRef] [PubMed]
- Aitken, D.; Jenkins, D.G. Anthropometric-based selection and sprint kayak training in children. J. Sports Sci. 1998, 16, 539–543. [Google Scholar] [CrossRef]
- Di Cagno, A.; Baldari, C.; Battaglia, C.; Brasili, P.; Merni, F.; Piazza, M.; Toselli, S.; Ventrella, A.R.; Guidetti, L. Leaping ability and body composition in rhythmic gymnasts for talent identification. J. Sports Med. Phys. Fit. 2008, 48, 341–346. [Google Scholar]
- Galy, O.; Zongo, P.; Chamari, K.; Chaouachi, A.; Michalak, E.; Dellal, A.; Castagna, C.; Hue, O. Anthropometric and physiological characteristics of Melanesian futsal players: A first approach to talent identification in Oceania. Biol. Sport. 2015, 32, 135–141. [Google Scholar] [CrossRef] [PubMed]
- Mohamed, H.; Vaeyens, R.; Matthys, S.; Multael, M.; Lefevre, J.; Lenoir, M.; Philppaerts, R. Anthropometric and performance measures for the development of a talent detection and identification model in youth handball. J. Sports Sci. 2009, 27, 257–266. [Google Scholar] [CrossRef] [PubMed]
- Yasin, S.N.; Ma’mun, A.; Rusdiana, A.; Abdullah, A.G.; Nur, L. The Talent Identification of Kayak Athletes: A Research-based on Analytic Hierarchy Process. Int. J. Hum. Move Sports Sci. 2020, 8, 395–402. [Google Scholar] [CrossRef]
- Gilliver, S.F.; Degens, H.; Rittweger, J.; Sargeant, A.J.; Jones, D.A. Variation in the determinants of power of chemically skinned human muscle fibres. Exp. Physiol. 2009, 94, 1070–1078. [Google Scholar] [CrossRef]
- DiNaso, J. The Relationship Between Thigh Muscle Size and 1RM Squat Strength Among Bodybuilders, Powerlifters, and Olympic Weightlifters. Master’s Thesis, Eastern Illinois University, Charleston, IL, USA, 2003. [Google Scholar]
- Meijer, J.P.; Jaspers, R.T.; Rittweger, J.; Seynnes, O.R.; Kamandulis, S.; Brazaitis, M.; Skurvydas, A.; Pišot, R.; Šimunič, B.; Narici, M.V.; et al. Single muscle fibre contractile properties differ between body-builders, power athletes and control subjects. Exp. Physiol. 2015, 100, 1331–1341. [Google Scholar] [CrossRef]
- Brechue, W.F.; Abe, T. The role of FFM accumulation and skeletal muscle architecture in powerlifting performance. Eur. J. Appl. Physiol. 2002, 86, 327–336. [Google Scholar] [CrossRef]
- Jones, M.T.; Jagim, A.R.; Haff, G.G.; Carr, P.J.; Martin, J.; Oliver, J.M. Greater Strength Drives Difference in Power between Sexes in the Conventional Deadlift Exercise. Sports 2016, 4, 43. [Google Scholar] [CrossRef]
- Roberts, M.D.; Haun, C.T.; Vann, C.G.; Osburn, S.C.; Young, K.C. Sarcoplasmic Hypertrophy in Skeletal Muscle: A Scientific “Unicorn” or Resistance Training Adaptation? Front. Physiol. 2020, 11, 816. [Google Scholar] [CrossRef]
- Schoenfeld, B.J.; Grgic, J.; Ogborn, D.; Krieger, J.W. Strength and hypertrophy adaptations between low- vs. high-load resistance training: A systematic review and meta-analysis. J. Strength Cond. Res. 2017, 31, 3508. [Google Scholar] [CrossRef]
- Sandford, G.N.; Laursen, P.B.; Buchheit, M. Anaerobic speed/power reserve and sport performance: Scientific basis, current applications and future directions. Sports Med. 2021, 51, 2017–2028. [Google Scholar] [CrossRef] [PubMed]
- Winchcombe, C.E.; Binnie, M.J.; Doyle, M.M.; Hogan, C.; Peeling, P. Development of an On-Water Graded Exercise Test for Flat-Water Sprint Kayak Athletes. Int. J. Sports Physiol. Perform. 2019, 14, 1244–1249. [Google Scholar] [CrossRef] [PubMed]
- Laursen, P.B. Training for intense exercise performance: High-intensity or high-volume training? Scand. J. Med. Sci. Sports 2010, 20 (Suppl. 2), 1–10. [Google Scholar] [CrossRef] [PubMed]
- Page, M.J.; McKenzie, J.E.; Bossuyt, P.M.; Boutron, I.; Hoffmann, T.C.; Mulrow, C.D.; Shamseer, L.; Tetzlaff, J.M.; Akl, E.A.; Brennan, S.E.; et al. The PRISMA 2020 statement: An updated guideline for reporting systematic reviews. BMJ 2021, 372, 71. [Google Scholar] [CrossRef]

Disclaimer/Publisher’s Note: The statements, opinions and data contained in all publications are solely those of the individual author(s) and contributor(s) and not of MDPI and/or the editor(s). MDPI and/or the editor(s) disclaim responsibility for any injury to people or property resulting from any ideas, methods, instructions or products referred to in the content. |
© 2025 by the authors. Licensee MDPI, Basel, Switzerland. This article is an open access article distributed under the terms and conditions of the Creative Commons Attribution (CC BY) license (https://creativecommons.org/licenses/by/4.0/).