
Current Cut Points of Three Falls Risk Assessment Tools Are Inferior to Calculated Cut Points in Geriatric Evaluation and Management Units


Abstract
1. Introduction
Aims
2. Results of the Study
2.1. Demographics
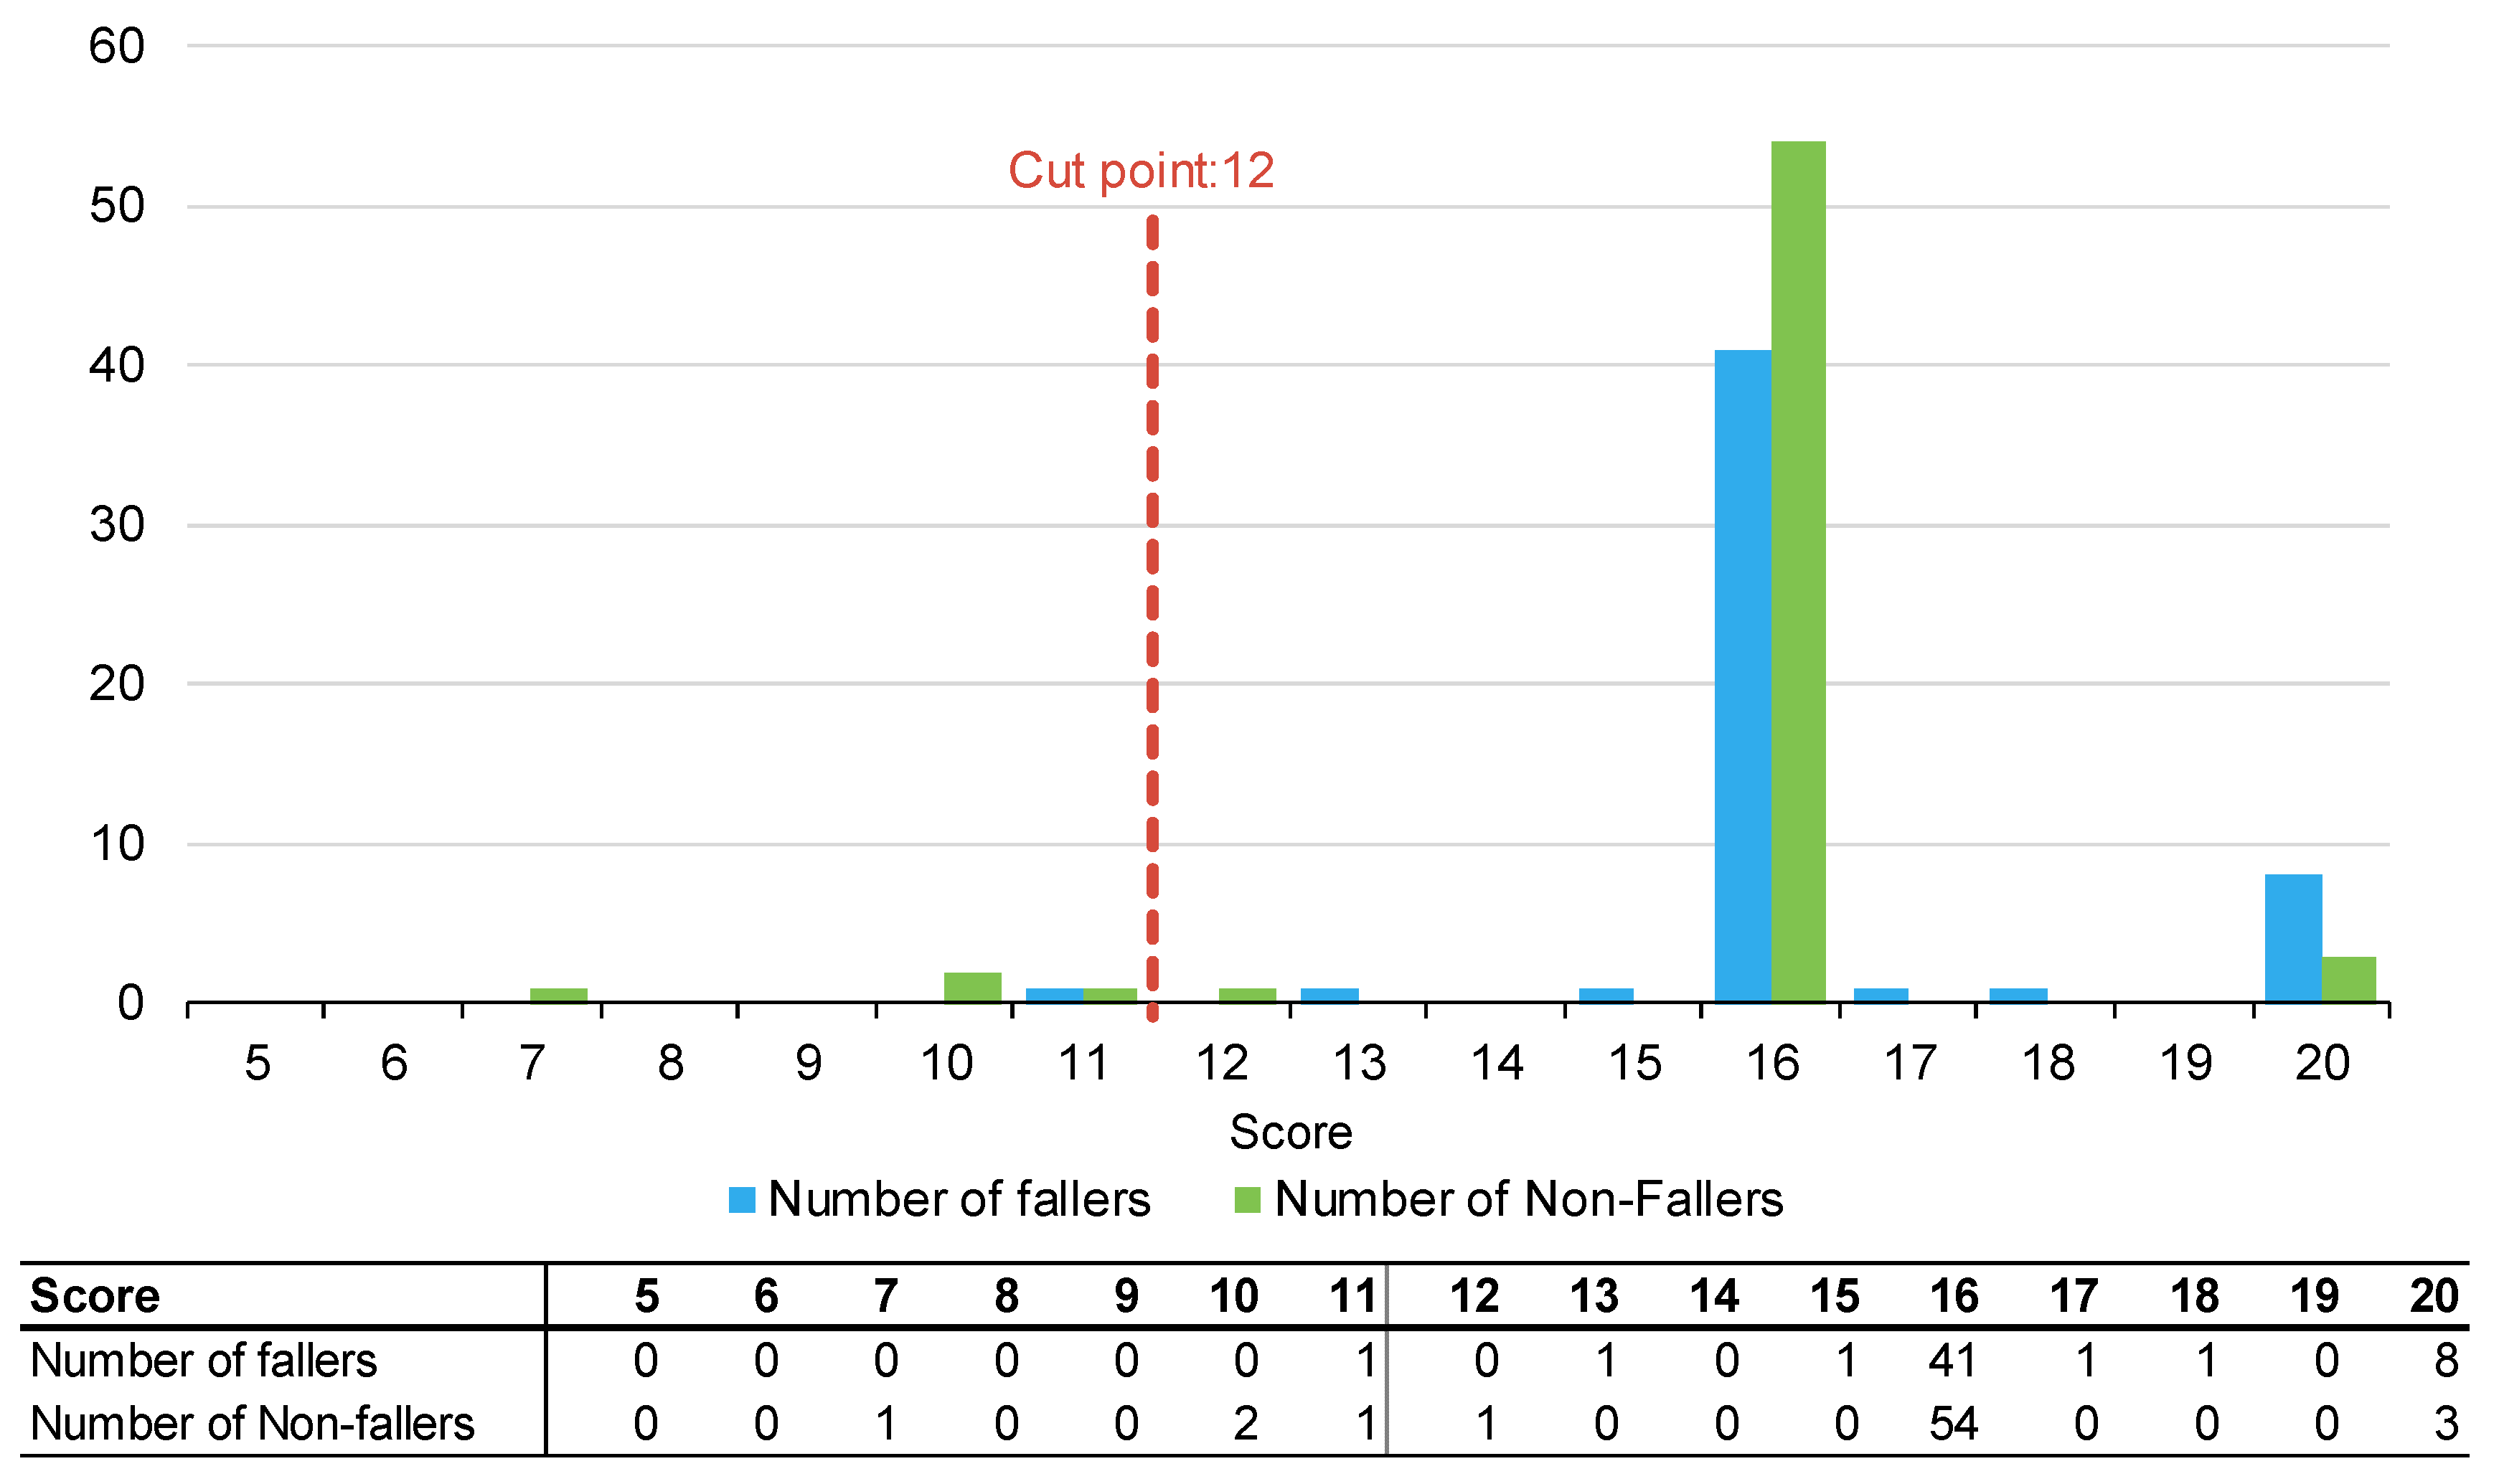
2.2. Comparing Predictive Accuracy Using Default Cut Points
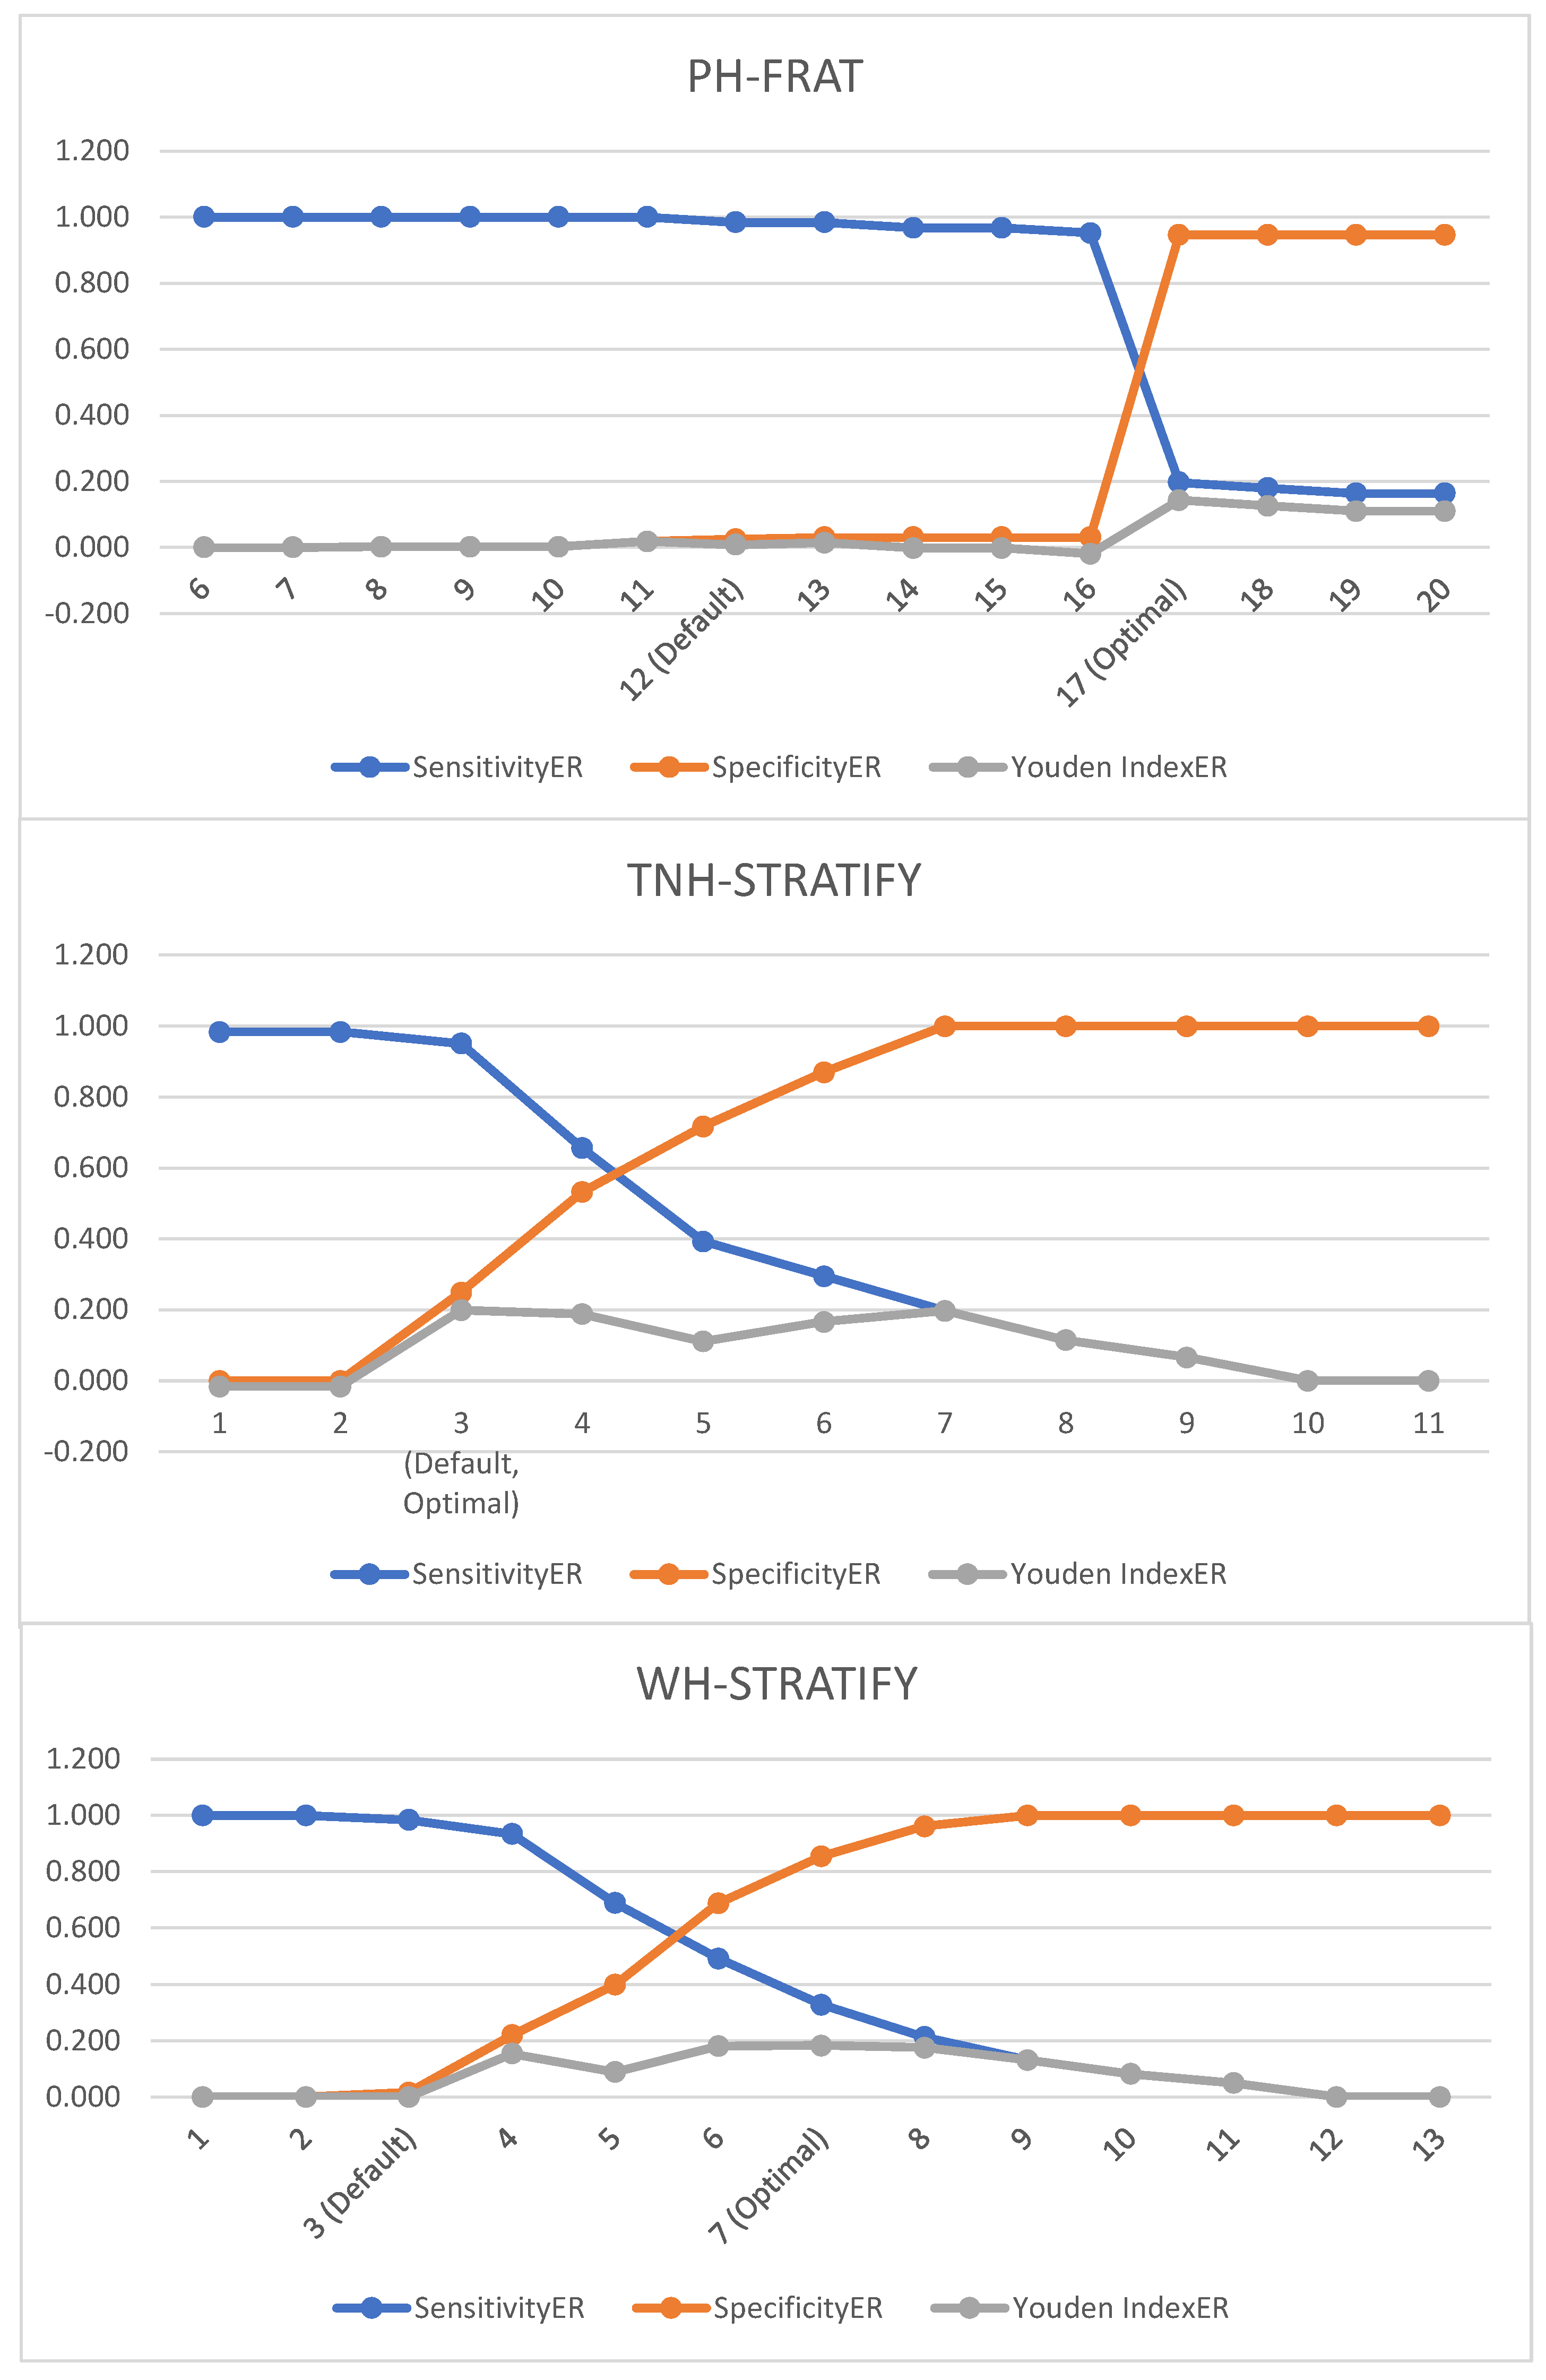
2.3. Predictive Accuracy Using Optimal Cut Points
3. Discussion
Limitations of the Study
4. Methods
4.1. Participants and Data Collection
4.2. Classification of Predicted Fallers and Non-Fallers
4.3. Scoring of Falls Risk Assessment Tools
4.4. Ethics
4.5. Statistical Analysis
4.6. Deriving Optimal Cut Points
5. Conclusions
Author Contributions
Funding
Institutional Review Board Statement
Informed Consent Statement
Data Availability Statement
Conflicts of Interest
Appendix A. Falls Risk Assessment Tool Data Definition

| Questions/Risk Factors | Descriptions | ||
|---|---|---|---|
| 1. Demographics Age (years) Gender: Female, Male | Source: (including the time frame of when the search is for)
| ||
| 2. Is the patient aged 80 or older? Yes/No | Source: (including the time frame of when the search is for)
Age (to the whole year) | ||
| 3. Length of stay Days | Source: (including the time frame of when the search is for)
| ||
4. Was there a recent fall?
| Source: (including the time frame of when the search is for)
Search for keywords “Fall” or “Falls” on EMR on the patient’s GEM admission | ||
| 5. Is the patient taking the following medications—sedatives, antidepressants, anti-parkinson’s, diuretics, anti-hypertensives, hypnotics, or opioids? No/Taking one/Taking two/Taking more than two Class(es): Sedatives, Antidepressant, Anti-Parkinson’s, Diuretics, Anti-hypertensives, Hypnotics, Opioids | Source: (including the time frame of when the search is for)
Medication classes that are charted or documented on admission to the GEM unit including both regular and as-required medications:
| ||
6. Is the patient affected by psychological conditions including: anxiety, depression, reduced cooperation, reduced insight, or reduced judgment?
| Source: (including the time frame of when the search is for)
| ||
7. What is the patient’s cognition?
| Source: (including the time frame of when the search is for)
| ||
8. What is the patient’s level of mobility? supervision or assistance when mobilising?
| Source: (including the time frame of when the search is for)
| ||
| 9. Does the patient require frequent toileting of bowels +/− bladder? Yes/No | Source: (including the time frame of when the search is for)
| ||
| 10. Does the patient have vision impairment which affects everyday functioning? Yes/No | Source: (including the time frame of when the search is for)
| ||
| 11. Does the patient present with drug/alcohol-related issues? Yes/No | Source: (including the time frame of when the search is for)
| ||
| 12. Does the patient require a language interpreter? Yes/No | Source: (including the time frame of when the search is for)
EMR search term for “Interpreter” | ||
13. Does the patient have any recent change in functional status or medications that affect the safety of mobility?
| Source: (including the time frame of when the search is for)
| ||
14. Does the patient experience dizziness or postural hypotension?
| Source: (including the time frame of when the search is for)
| ||
| PH-FRAT score Low Risk: 5–11 Medium: Risk: 12–15 High Risk: 16–20 A score of 12 or above suggests an increased risk of falls Automatic High risk A recent change in functional status and/or medications affecting the safety of mobility (or anticipated) Dizziness/postural hypotension | Risk factor | Level | Risk score |
| Recent Falls (To score this, complete history of falls, overleaf) | none in the last 12 months | 2 | |
| one or more between 3 and 12 months ago | 4 | ||
| one or more in the last 3 months | 6 | ||
| one or more in the last 3 months whilst inpatient/resident | 8 | ||
| Medications (Sedatives, Anti-Depressants Anti-Parkinson’s, Diuretics Anti-hypertensives, hypnotics) | not taking any of these | 1 | |
| taking one | 2 | ||
| taking two | 3 | ||
| taking more than two | 4 | ||
| Psychological (Anxiety, Depression Cooperation, Insight or Judgement esp. re mobility) | does not appear to have any of these | 1 | |
| appears mildly affected by one or more | 2 | ||
| appears moderately affected by one or more | 3 | ||
| appears severely affected by one or more | 4 | ||
| Cognitive status (AMTS: Hodkinson Abbreviated Mental Test Score) | AMTS 9 or 10/10 OR intact | 1 | |
| AMTS 7–8 mildly impaired | 2 | ||
| AMTS 5–6 moderately impaired | 3 | ||
| AMTS 4 or less severely impaired | 4 | ||
| Risk Score (Low Risk: 5–11 Medium: Risk: 12–15 High Risk: 16–20) | /20 | ||
| Automatic High-Risk Status: (if ticked then circle HIGH risk below) | |||
| |||
| NH-STRATIFY score A score of 3 or more is considered High Risk | Risk factors | Risk score | |
| Fall: During current Admission | Yes = 3, No = 0 | ||
| Fall: Within 12 months | Yes = 1, No = 0 | ||
| Mental State-Current cognition—confused, impulsive, agitated, or cognitively impaired | Yes = 1, No = 0 | ||
| Mobility: Patient needs supervision or assistance when mobilising | Yes = 1, No = 0 | ||
| Impaired Balance and/or hemiplegia | Yes = 1, No = 0 | ||
| Age 80 or older | Yes = 1, No = 0 | ||
| Frequent toileting bowels +/− bladder | Yes = 1, No = 0 | ||
| Vision impairment—that affects everyday functioning | Yes = 1, No = 0 | ||
| Drug and alcohol: patient presents with drug/alcohol-related issues | Yes = 1, No = 0 | ||
| WH-STRATIFY score A score of 3 or above is considered High falls risk | Risk factors | Risk score | |
| Fall: During current Admission | Yes = 3, No = 0 | ||
| Fall: Within 12 months | Yes = 1, No = 0 | ||
| Language: patient is NESB | Yes = 1, No = 0 | ||
| Current cognition—confused, impulsive, agitated, or cognitively impaired | Yes = 1, No = 0 | ||
| Vision impairment—that affects everyday functioning | Yes = 1, No = 0 | ||
| Mobility: Patient needs supervision or assistance when mobilising | Yes = 1, No = 0 | ||
| Impaired Balance and/or hemiplegia | Yes = 1, No = 0 | ||
| Age 80 or older | Yes = 1, No = 0 | ||
| Frequent toileting bowels +/− bladder | Yes = 1, No = 0 | ||
| Medications affecting mobility: anti-hypertensives, diuretics, sedatives, opioids or S11 | Yes = 1, No = 0 | ||
| Drug and alcohol: patient presents with drug/alcohol-related issues | Yes = 1, No = 0 | ||
Appendix B. Summary Statistics by Falls Risk Assessment Tool
| Score | Number of Patients (%) | Number of Fallers (%) | Length of Stay, Days (%) | Number of Falls | ||||
|---|---|---|---|---|---|---|---|---|
| PH-FRAT | ||||||||
| 5 | 0 | (0%) | 0 | (0%) | 0 | (0%) | 0 | (0%) |
| 6 | 0 | (0%) | 0 | (0%) | 0 | (0%) | 0 | (0%) |
| 7 | 1 | (1%) | 0 | (0%) | 2 | (0%) | 0 | (0%) |
| 8 | 0 | (0%) | 0 | (0%) | 0 | (0%) | 0 | (0%) |
| 9 | 0 | (0%) | 0 | (0%) | 0 | (0%) | 0 | (0%) |
| 10 | 2 | (2%) | 0 | (0%) | 13 | (1%) | 0 | (0%) |
| 11 | 2 | (2%) | 1 | (2%) | 36 | (2%) | 1 | (2%) |
| 12 | 1 | (1%) | 0 | (0%) | 5 | (0%) | 0 | (0%) |
| 13 | 1 | (1%) | 1 | (2%) | 31 | (1%) | 1 | (2%) |
| 14 | 0 | (0%) | 0 | (0%) | 0 | (0%) | 0 | (0%) |
| 15 | 1 | (1%) | 1 | (2%) | 24 | (1%) | 1 | (2%) |
| 16 | 95 | (82%) | 41 | (76%) | 1896 | (80%) | 46 | (75%) |
| 17 | 1 | (1%) | 1 | (2%) | 56 | (2%) | 1 | (2%) |
| 18 | 1 | (1%) | 1 | (2%) | 32 | (1%) | 1 | (2%) |
| 19 | 0 | (0%) | 0 | (0%) | 0 | (0%) | 0 | (0%) |
| 20 | 11 | (9%) | 8 | (15%) | 264 | (11%) | 10 | (16%) |
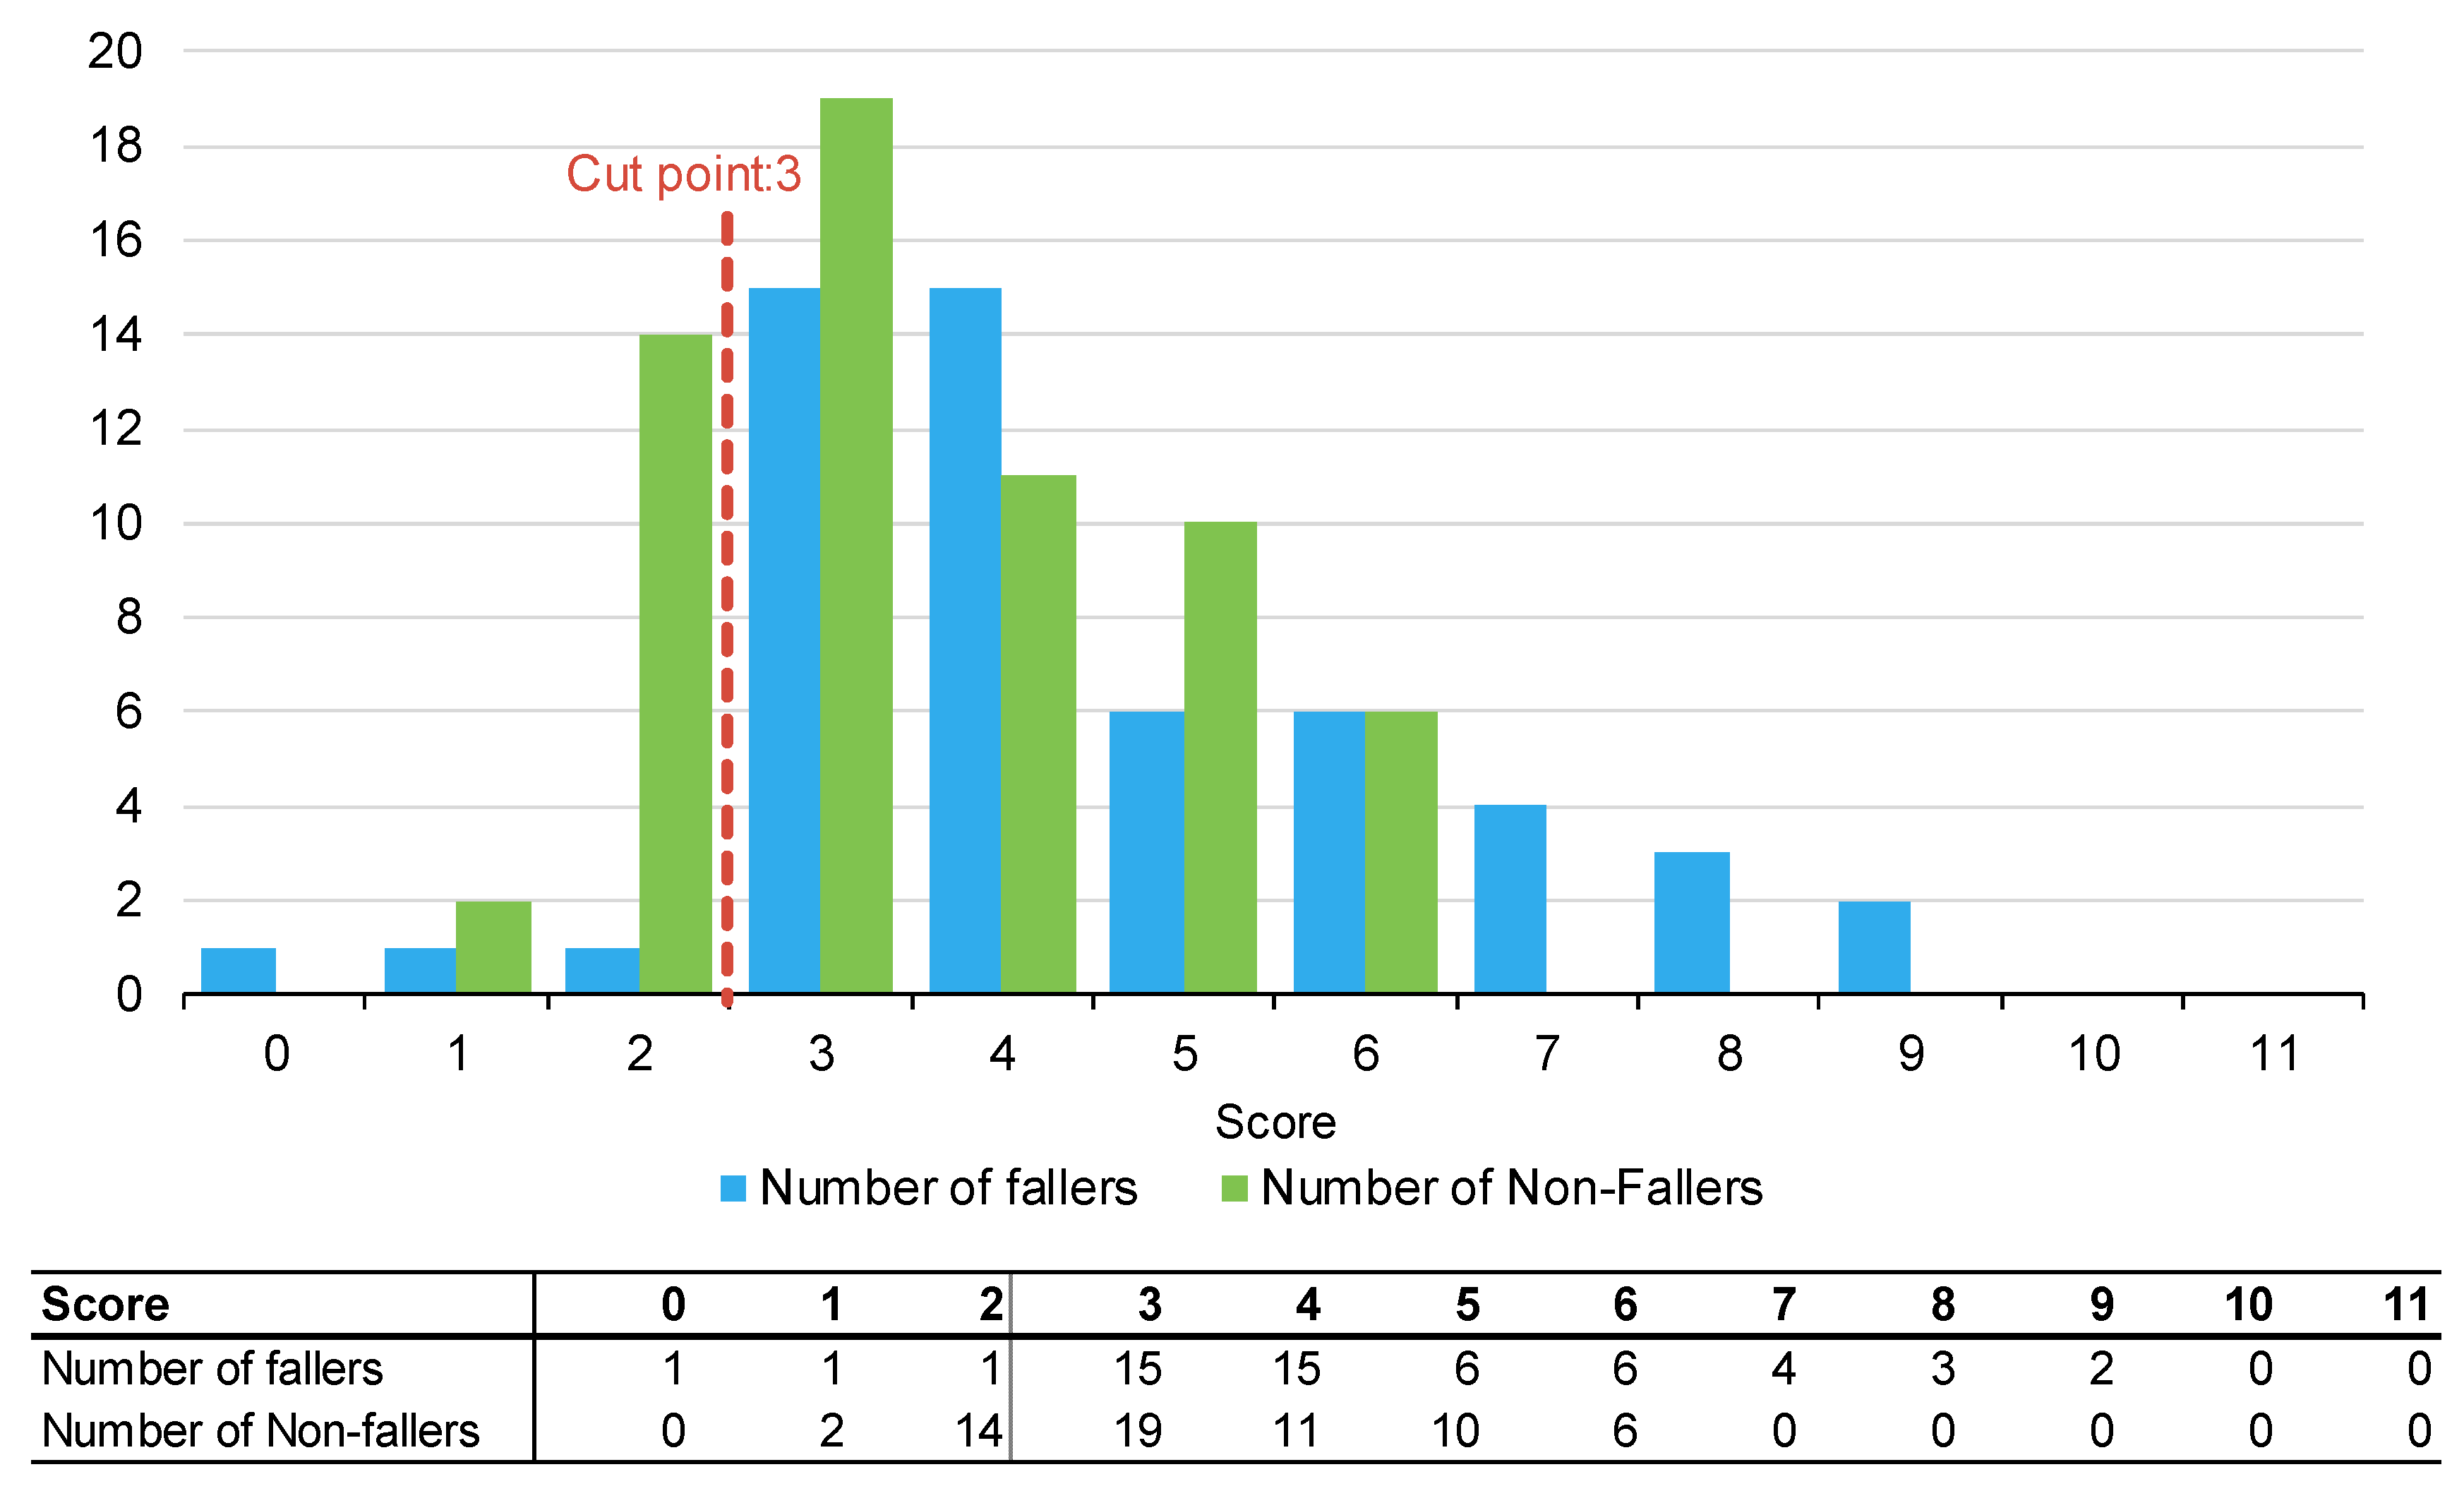
| TNH-STRATIFY | ||||||||
| 0 | 1 | (1%) | 1 | (2%) | 35 | (1%) | 1 | (2%) |
| 1 | 3 | (3%) | 1 | (2%) | 31 | (1%) | 1 | (2%) |
| 2 | 15 | (13%) | 1 | (2%) | 205 | (9%) | 1 | (2%) |
| 3 | 34 | (29%) | 15 | (28%) | 624 | (26%) | 18 | (30%) |
| 4 | 26 | (22%) | 15 | (28%) | 722 | (31%) | 16 | (26%) |
| 5 | 16 | (14%) | 6 | (11%) | 247 | (10%) | 6 | (10%) |
| 6 | 12 | (10%) | 6 | (11%) | 274 | (12%) | 6 | (10%) |
| 7 | 4 | (3%) | 4 | (7%) | 89 | (4%) | 5 | (8%) |
| 8 | 3 | (3%) | 3 | (6%) | 65 | (3%) | 3 | (5%) |
| 9 | 2 | (2%) | 2 | (4%) | 67 | (3%) | 4 | (7%) |
| 10 | 0 | (0%) | 0 | (0%) | 0 | (0%) | 0 | (0%) |
| 11 | 0 | (0%) | 0 | (0%) | 0 | (0%) | 0 | (0%) |
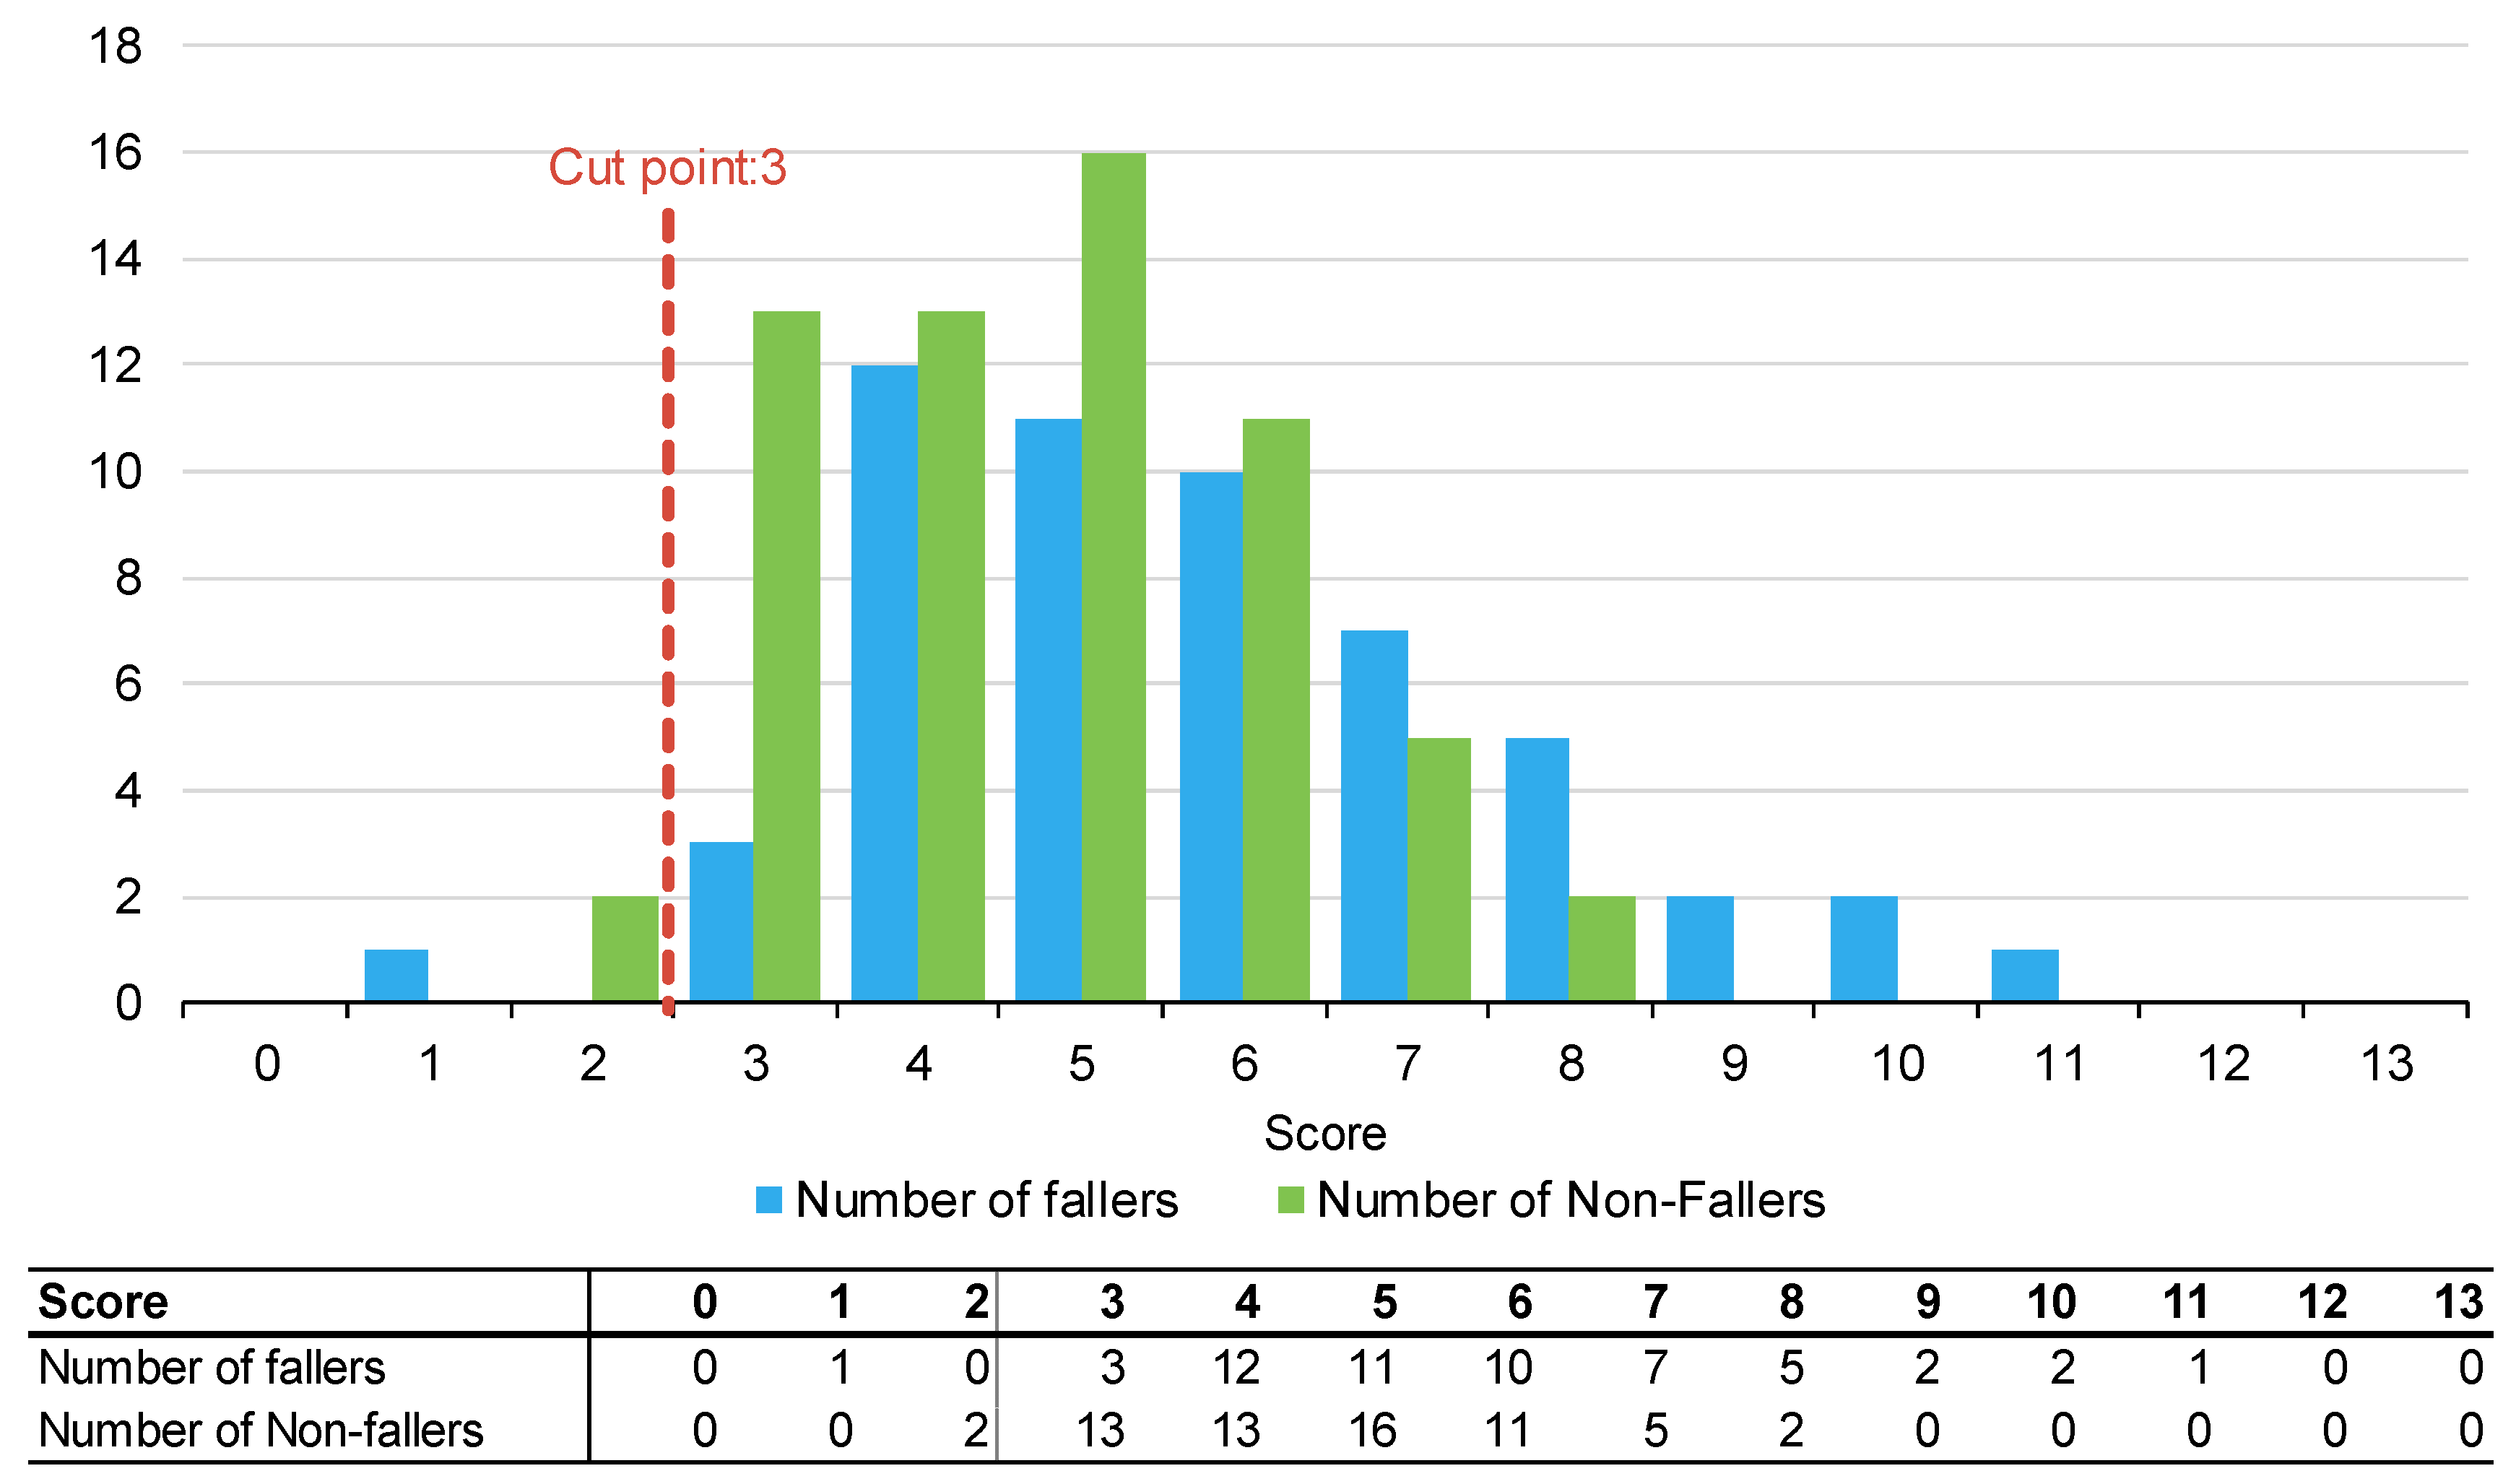
| WH-STRATIFY | ||||||||
| 0 | 0 | (0%) | 0 | (0%) | 0 | (0%) | 0 | (0%) |
| 1 | 1 | (1%) | 1 | (2%) | 35 | (1%) | 1 | (2%) |
| 2 | 2 | (2%) | 0 | (0%) | 14 | (1%) | 0 | (0%) |
| 3 | 16 | (14%) | 3 | (6%) | 222 | (9%) | 3 | (5%) |
| 4 | 25 | (22%) | 12 | (22%) | 469 | (20%) | 15 | (25%) |
| 5 | 27 | (23%) | 11 | (20%) | 587 | (25%) | 12 | (20%) |
| 6 | 21 | (18%) | 10 | (19%) | 461 | (20%) | 10 | (16%) |
| 7 | 12 | (10%) | 7 | (13%) | 307 | (13%) | 7 | (11%) |
| 8 | 7 | (6%) | 5 | (9%) | 134 | (6%) | 5 | (8%) |
| 9 | 2 | (2%) | 2 | (4%) | 43 | (2%) | 3 | (5%) |
| 10 | 2 | (2%) | 2 | (4%) | 44 | (2%) | 2 | (3%) |
| 11 | 1 | (1%) | 1 | (2%) | 43 | (2%) | 3 | (5%) |
| 12 | 0 | (0%) | 0 | (0%) | 0 | (0%) | 0 | (0%) |
| 13 | 0 | (0%) | 0 | (0%) | 0 | (0%) | 0 | (0%) |

| Cut-Off Score | SensitivityER | SpecificityER | Youden IndexER |
|---|---|---|---|
| PH-FRAT | |||
| 6 | 1.00 | 0.00 | 0.00 |
| 7 | 1.00 | 0.00 | 0.00 |
| 8 | 1.00 | 0.00 | 0.00 |
| 9 | 1.00 | 0.00 | 0.00 |
| 10 | 1.00 | 0.00 | 0.00 |
| 11 | 1.00 | 0.02 | 0.02 |
| 12 (Cut-off) | 0.98 | 0.03 | 0.01 |
| 13 | 0.98 | 0.03 | 0.01 |
| 14 | 0.97 | 0.03 | −0.00 |
| 15 | 0.97 | 0.03 | −0.00 |
| 16 | 0.95 | 0.03 | −0.02 |
| 17 | 0.20 | 0.95 | 0.14 |
| 18 | 0.18 | 0.95 | 0.13 |
| 19 | 0.16 | 0.95 | 0.11 |
| 20 | 0.16 | 0.95 | 0.11 |
| TNH-STRATIFY | |||
| 1 | 0.98 | 0.00 | −0.02 |
| 2 | 0.98 | 0.00 | −0.02 |
| 3 (Cut-off) | 0.95 | 0.25 | 0.20 |
| 4 | 0.66 | 0.53 | 0.19 |
| 5 | 0.39 | 0.72 | 0.11 |
| 6 | 0.30 | 0.87 | 0.17 |
| 7 | 0.20 | 1.00 | 0.20 |
| 8 | 0.12 | 1.00 | 0.16 |
| 9 | 0.07 | 1.00 | 0.07 |
| 10 | 0.00 | 1.00 | 0.00 |
| 11 | 0.00 | 1.00 | 0.00 |
| WH-STRATIFY | |||
| 1 | 1.00 | 0.00 | 0.00 |
| 2 | 1.00 | 0.00 | 0.00 |
| 3 (Cut-off) | 0.98 | 0.02 | 0.00 |
| 4 | 0.93 | 0.22 | 0.15 |
| 5 | 0.69 | 0.40 | 0.09 |
| 6 | 0.49 | 0.69 | 0.18 |
| 7 | 0.33 | 0.86 | 0.18 |
| 8 | 0.21 | 0.96 | 0.18 |
| 9 | 0.13 | 1.00 | 0.13 |
| 10 | 0.08 | 1.00 | 0.08 |
| 11 | 0.05 | 1.00 | 0.05 |
| 12 | 0.00 | 1.00 | 0.00 |
| 13 | 0.00 | 1.00 | 0.00 |
Appendix C. WH STRATIFY Interventions
| Questions | Optional Answer | Optional Answer | If Yes—Drop Down Multi Choice Options |
| Fall: Current Admission | No (score 0) | Yes patient has had a fall during current admission (score 3) | Bathroom Supervision at all times Ensure physiotherapy is involved in the care Consider referral to OT Handover History of falls to oncoming shift Monitor postural BP for 48/24. Report drop of 20 mmHg |
| Fall: Within 12 months | No (0) | Yes patient has had fall/s in the last 12 months (1) | Provide falls prevention education Monitor postural BP for 48/24. Report drop of 20 mmHg |
| Language: | Speaks and understands English | Patient does not speak or understand English (1) | Phone interpreter-falls education/orientation/4AT Write common word translations on the patient whiteboard Ask the family to assist with orientation/falls education |
| Current cognition | No Cognitive impairment (0) | Confused, impulsive, agitated, or cognitively impaired (1) | Lolo bed with crash mats Bathroom supervision at all times Falls Mat alarm Locate the patient closer to the nurses’ station Portable Video Monitoring Overnight Request family stay with the patient Assess for constipation/overflow/bowel sounds Complete 4AT and report a score of 4+ to HMO Pain assessment Toilet regime pre + post meals Review the About Me form Mobilise regularly Update patient whiteboard each shift |
| Vision impairment | No Visual impairment (0) | Yes visual impairment that affects everyday functioning (1) | Vision impaired sign above the bed Consider using a manual handbell Ensure glasses are within reach Co-locate with other patients if suitable |
| Mobility Impaired | No Mobility Impairment (0) | Yes patient needs supervision or assistance when mobilising (1) | Refer to Physiotherapy if change in baseline function Ensure gait aid is within reach at all times |
| Impaired Balance: | No Balance Impairment (0) | Yes Patient has impaired balance and/or hemiplegia (1) | Refer to Physiotherapy Reinforce PT mobility instructions Ensure gait aid is within reach at all times Bathroom supervision at all times |
| Age, over 80: | No (0) | Yes patient is 80 years or older (1) | Educate on increased falls risk |
| Frequent toileting/urgency: | No (0) | yes patient requires frequent toileting: bladder +/− bowels (1) | Bedside commode or access to bottle Consider proximity to the toilet Check urine—FWT or MSU Toileting regime Monitor for constipation and overflow Educate on suitable continence aids Consider a bladder scan for retention |
| Medications affecting mobility: | One or none (0) | 2 or more: antihypertensives, diuretics, sedatives, opioids, or S11 (1) | Educate patient—increased falls risk due to meds |
| Drug and alcohol issues | No (0) | Yes patient presents with drug/alcohol-related issues (1) | Consider referral to addiction medicine |
| Patient falls risk: | Low Risk = less than 3 | High Risk—3 or more | |
| Standard Falls risk strategies—All Patients | Focus is on identifying risk factors and implementing prevention strategies regardless of risk rating. | Discuss strategies to keep patients safe in the hospital Reduce all clutter Call bell always within reach Gait aid is always within reach Use non-slip footwear during daytime—not socks Dress in day clothes if available | |
References
- Tan, K.M.; Austin, B.; Shaughnassy, M.; Higgins, C.; McDonald, M.; Mulkerrin, E.C.; O’keeffe, S.T. Falls in an acute hospital and their relationship to restraint use. Ir. J. Med. Sci. 2005, 174, 28–31. [Google Scholar] [CrossRef] [PubMed]
- Morse, J.M. Enhancing the safety of hospitalization by reducing patient falls. Am. J. Infect. Control. 2002, 30, 376–380. [Google Scholar] [CrossRef] [PubMed]
- Oliver, D.; Healy, F. Falls risk prediction tools for hospital inpatients: Do they work? Nurs. Times. 2009, 105, 18–21. [Google Scholar]
- von Renteln-Kruse, W.; Krause, T. Fall events in geriatric hospital in-patients. Results of prospective recording over a 3 year period. Z. Gerontol. Geriatr. 2004, 37, 9–14. [Google Scholar] [CrossRef]
- Healey, F.; Scobie, S.; Oliver, D.; Pryce, A.; Thomson, R.; Glampson, B. Falls in English and Welsh hospitals: A national observational study based on retrospective analysis of 12 months of patient safety incident reports. Qual. Saf. Health Care. 2008, 17, 424–430. [Google Scholar] [CrossRef] [PubMed]
- Australian Commission on Safety and Quality in Healthcare. Preventing Falls and Harm From Falls in Older People. Best Practice Guideline for Australian Hospitals. 2009. Available online: https://www.safetyandquality.gov.au/publications-and-resources/resource-library/preventing-falls-and-harm-falls-older-people-best-practice-guidelines-australian-hospitals (accessed on 1 April 2022).
- Health, W. About Western Health. Available online: https://www.westernhealth.org.au (accessed on 1 April 2022).
- Department of Health & Human Services. Falls Risk Assessment Tool (FRAT). 1999. Available online: https://content.health.vic.gov.au/sites/default/files/migrated/files/collections/policies-and-guidelines/b/b2b_1a_frat_pdf.pdf (accessed on 1 April 2022).
- Stapleton, C.; Hough, P.; Oldmeadow, L.; Bull, K.; Hill, K.; Greenwood, K. Four-item fall risk screening tool for subacute and residential aged care: The first step in fall prevention. Australas. J. Ageing 2009, 28, 139–143. [Google Scholar] [CrossRef]
- Hill, K.; Vrantsidis, F.; Haralambous, B.; Fearn, M.; Smith, R.; Murray, K.; Sims, J.; Dorevitch, M. An Analysis of Research on Preventing Falls and Falls Injury in Older People: Community, Residential Care and Hospital Settings (2004 Update); Injury Prevention Section by the National Ageing Research Institute; Commonwealth of Australia: Canberra, Australia, 2004.
- Oliver, D.; Healey, F.; Haines, T.P. Preventing Falls and Fall-Related Injuries in Hospitals. Clin. Geriatr. Med. 2010, 26, 645–692. [Google Scholar] [CrossRef]
- Hill, K.D.; Vu, M.; Walsh, W. Falls in the acute hospital setting & mdash; impact on resource utilisation. Aust. Health Rev. 2007, 31, 471. [Google Scholar]
- Aranda-Gallardo, M.; de Luna-Rodriguez, M.E.; Canca-Sanchez, J.C.; Moya-Suarez, A.B.; Morales-Asencio, J.M. Validation of the STRATIFY falls risk-assessment tool for acute-care hospital patients and nursing home residents: Study protocol. J. Adv. Nurs. 2015, 71, 1948–1957. [Google Scholar] [CrossRef]
- Welch, C.; Hassan-Smith, Z.K.; Greig, C.A.; Lord, J.M.; Jackson, T.A. Acute Sarcopenia Secondary to Hospitalisation—An Emerging Condition Affecting Older Adults. Aging Dis. 2018, 9, 151. [Google Scholar] [CrossRef] [PubMed]
- Yeung, S.S.Y.; Reijnierse, E.M.; Pham, V.K.; Trappenburg, M.C.; Lim, W.K.; Meskers, C.G.M.; Maier, A.B. Sarcopenia and its association with falls and fractures in older adults: A systematic review and meta-analysis. J. Cachexia Sarcopenia Muscle 2019, 10, 485–500. [Google Scholar] [CrossRef] [PubMed]
- Montero-Odasso, M.; van der Velde, N.; Martin, F.C.; Petrovic, M.; Tan, M.P.; Ryg, J.; Aguilar-Navarro, S.; Alexander, N.B.; Becker, C.; Blain, H.; et al. World guidelines for falls prevention and management for older adults: A global initiative. Age Ageing 2022, 51, afac205. [Google Scholar] [CrossRef] [PubMed]
- de Morton, N.; Lane, K. Validity and reliability of the de Morton Mobility Index in the subacute hospital setting in a geriatric evaluation and management population. J. Rehabil. Med. 2010, 42, 956–961. [Google Scholar] [CrossRef]
- Haines, T.P.; Hill, K.; Walsh, W.; Osborne, R. Design-Related Bias in Hospital Fall Risk Screening Tool Predictive Accuracy Evaluations: Systematic Review and Meta-Analysis. J. Gerontol. A. Biol. Sci. Med. Sci. 2007, 62, 664–672. [Google Scholar] [CrossRef]
- Barker, A.; Kamar, J.; Graco, M.; Lawlor, V.; Hill, K. Adding value to the STRATIFY falls risk assessment in acute hospitals. J. Adv. Nurs. 2010, 67, 450–457. [Google Scholar] [CrossRef]
- Scott, V.; Votova, K.; Scanlan, A.; Close, J. Multifactorial and functional mobility assessment tools for fall risk among older adults in community, home-support, long-term and acute care settings. Age Ageing 2007, 36, 130–139. [Google Scholar] [CrossRef]
- Latt, M.D.; Loh, K.F.; Ge, L.; Hepworth, A. The validity of three fall risk screening tools in an acute geriatric inpatient population. Australas. J. Ageing 2016, 35, 167–173. [Google Scholar] [CrossRef]
- Wabe, N.; Siette, J.; Seaman, K.L.; Nguyen, A.D.; Raban, M.Z.; Close, J.C.T.; Lord, S.R.; Westbrook, J.I. The use and predictive performance of the Peninsula Health Falls Risk Assessment Tool (PH-FRAT) in 25 residential aged care facilities: A retrospective cohort study using routinely collected data. BMC Geriatr. 2022, 22, 271. [Google Scholar] [CrossRef]
- Fryer, C.; Mackintosh, S.; Batchelor, F.; Hill, K.; Said, C. The effect of limited English proficiency on falls risk and falls prevention after stroke. Age Ageing 2012, 41, 104–107. [Google Scholar] [CrossRef]
- Wong Shee, A.; Phillips, B.; Hill, K. Comparison of two fall risk assessment tools (FRATs) targeting falls prevention in sub-acute care. Arch. Gerontol. Geriatr. 2012, 55, 653–659. [Google Scholar] [CrossRef] [PubMed]
- Victorian COVID-19 Data. Data Updates on COVID-19 Including Graphs Showing Case Numbers, Location and Age Group. 2023. Available online: https://www.coronavirus.vic.gov.au/victorian-coronavirus-covid-19-data (accessed on 1 April 2022).
- Haines, T.P.; Bennell, K.L.; Osborne, R.H.; Hill, K.D. A new instrument for targeting falls prevention interventions was accurate and clinically applicable in a hospital setting. J. Clin. Epidemiol. 2006, 59, 168–175. [Google Scholar] [CrossRef] [PubMed]


| Profile | All | Fallers | Non-Fallers | p-Value |
|---|---|---|---|---|
| Number (%) | 116 (100%) | 54 (47%) | 62 (53%) | 0.46 |
| Mean age years (SD) | 80.10 (8.6) | 81.00 (8.40) | 79.30 (8.80) | 0.28 |
| Mean length of stay in days (SD) | 20.30 (16.9) | 28.00 (20.20) | 13.70 (9.40) | <0.01 |
| Male (%) | 50 (43%) | 28 (52%) | 22 (35%) | 0.08 |
| Metric | PH-FRAT | TNH-STRATIFY | WH-STRATIFY | |||
|---|---|---|---|---|---|---|
| SensitivityER | 0.98 | (0.95, 1.00) | 0.95 | (0.89, 1.00) | 0.98 | (0.94, 1.00) |
| SpecificityER | 0.02 | (0.00, 0.06) | 0.25 | (0.13, 0.38) | 0.02 | (0.00, 0.04) |
| Youden IndexER | 0.01 | (−0.04, 0.05) | 0.20 | (0.07, 0.34) | 0.00 | (−0.04, 0.03) |
| Cut-Off Score | SensitivityER | SpecificityER | Youden IndexER |
|---|---|---|---|
| PH-FRAT | |||
| 6 | 1.00 | 0.00 | 0.00 |
| 7 | 1.00 | 0.00 | 0.00 |
| 8 | 1.00 | 0.00 | 0.00 |
| 9 | 1.00 | 0.00 | 0.00 |
| 10 | 1.00 | 0.00 | 0.00 |
| 11 | 1.00 | 0.02 | 0.02 |
| 12 (Default) | 0.98 | 0.03 | 0.01 |
| 13 | 0.98 | 0.03 | 0.01 |
| 14 | 0.97 | 0.03 | −0.00 |
| 15 | 0.97 | 0.03 | −0.00 |
| 16 | 0.95 | 0.03 | −0.02 |
| 17 (Optimal) | 0.20 | 0.95 | 0.14 |
| 18 | 0.18 | 0.95 | 0.13 |
| 19 | 0.16 | 0.95 | 0.11 |
| 20 | 0.16 | 0.95 | 0.11 |
| TNH-STRATIFY | |||
| 1 | 0.98 | 0.00 | −0.02 |
| 2 | 0.98 | 0.00 | −0.02 |
| 3 (Default, Optimal) | 0.95 | 0.25 | 0.20 |
| 4 | 0.66 | 0.53 | 0.19 |
| 5 | 0.39 | 0.72 | 0.11 |
| 6 | 0.30 | 0.87 | 0.17 |
| 7 | 0.20 | 1.00 | 0.20 |
| 8 | 0.12 | 1.00 | 0.12 |
| 9 | 0.07 | 1.00 | 0.07 |
| 10 | 0.00 | 1.00 | 0.00 |
| 11 | 0.00 | 1.00 | 0.00 |
| WH-STRATIFY | |||
| 1 | 1.00 | 0.00 | 0.00 |
| 2 | 1.00 | 0.00 | 0.00 |
| 3 (Default) | 0.98 | 0.02 | 0.00 |
| 4 | 0.93 | 0.22 | 0.15 |
| 5 | 0.69 | 0.40 | 0.09 |
| 6 | 0.49 | 0.69 | 0.18 |
| 7 (Optimal) | 0.33 | 0.86 | 0.18 |
| 8 | 0.21 | 0.96 | 0.18 |
| 9 | 0.13 | 1.00 | 0.13 |
| 10 | 0.08 | 1.00 | 0.08 |
| 11 | 0.05 | 1.00 | 0.05 |
| 12 | 0.00 | 1.00 | 0.00 |
| 13 | 0.00 | 1.00 | 0.00 |
| Metric | PH-FRAT | TNH-STRATIFY | WH-STRATIFY | |||
|---|---|---|---|---|---|---|
| SensitivityER | 0.20 | (0.09, 0.32) | 0.95 | (0.89, 1.00) | 0.33 | (0.19, 0.47) |
| SpecificityER | 0.95 | (0.87, 1.00) | 0.25 | (0.13, 0.38) | 0.86 | (0.72, 0.96) |
| Youden IndexER | 0.14 | (0.01, 0.29) | 0.20 | (0.07, 0.34) | 0.18 | (0.00, 0.35) |
| Sensitivity | 0.19 | (0.09, 0.29) | 0.94 | (0.88, 1.00) | 0.31 | (0.19, 0.44) |
| Specificity | 0.95 | (0.89, 1.00) | 0.26 | (0.16, 0.37) | 0.89 | (0.81, 0.95) |
| Youden Index | 0.14 | (0.02, 0.26) | 0.20 | (0.08, 0.33) | 0.20 | (0.06, 0.33) |
| Tool | Scoring System | Risk Factor Assessed | Possible Score |
|---|---|---|---|
| PH-FRAT | Total score range: 5–20 Cut point: 12 Weighting of one risk factor (recent falls) If having one either change in functional status/medication or dizziness/postural hypotension, the score is set to 16. If having both conditions, the score is set to 20. | Recent falls | 2, 4, 6 or 8 |
| Medication | 1–4 | ||
| Psychological | 1–4 | ||
| Cognitive status | 1–4 | ||
| Change in functional status/medication | 16 or 20 | ||
| Dizziness/postural hypotension | 16 or 20 | ||
| TNH-STRATIFY | Total score range: 0–11 Cut point: 3 Weighting of one risk factor (falls history—current admission) | Age | 0 or 1 |
| Falls history—current admission | 0 or 3 | ||
| Falls history—previous 12 months | 0 or 1 | ||
| Mental state | 0 or 1 | ||
| Mobility | 0 or 1 | ||
| Balance | 0 or 1 | ||
| Toileting needs | 0 or 1 | ||
| Vision impairment | 0 or 1 | ||
| Drug/alcohol abuse | 0 or 1 | ||
| WH-STRATIFY | Total score range: 0–13 Cut point: 3 Weighting of one risk factor (falls history—current admission) | Age | 0 or 1 |
| Falls history—current admission | 0 or 3 | ||
| Falls history—previous 12 months | 0 or 1 | ||
| Mental state | 0 or 1 | ||
| Mobility | 0 or 1 | ||
| Balance | 0 or 1 | ||
| Toileting needs | 0 or 1 | ||
| Vision impairment | 0 or 1 | ||
| Drug/alcohol abuse | 0 or 1 | ||
| NESB | 0 or 1 | ||
| Medications affecting mobility | 0 or 1 |
Disclaimer/Publisher’s Note: The statements, opinions and data contained in all publications are solely those of the individual author(s) and contributor(s) and not of MDPI and/or the editor(s). MDPI and/or the editor(s) disclaim responsibility for any injury to people or property resulting from any ideas, methods, instructions or products referred to in the content. |
© 2023 by the authors. Licensee MDPI, Basel, Switzerland. This article is an open access article distributed under the terms and conditions of the Creative Commons Attribution (CC BY) license (https://creativecommons.org/licenses/by/4.0/).
Share and Cite
Lee, V.; Appiah-Kubi, L.; Vogrin, S.; Zanker, J.; Mitropoulos, J. Current Cut Points of Three Falls Risk Assessment Tools Are Inferior to Calculated Cut Points in Geriatric Evaluation and Management Units. Muscles 2023, 2, 250-270. https://doi.org/10.3390/muscles2030019
Lee V, Appiah-Kubi L, Vogrin S, Zanker J, Mitropoulos J. Current Cut Points of Three Falls Risk Assessment Tools Are Inferior to Calculated Cut Points in Geriatric Evaluation and Management Units. Muscles. 2023; 2(3):250-270. https://doi.org/10.3390/muscles2030019
Chicago/Turabian StyleLee, Vivian, Linda Appiah-Kubi, Sara Vogrin, Jesse Zanker, and Joanna Mitropoulos. 2023. "Current Cut Points of Three Falls Risk Assessment Tools Are Inferior to Calculated Cut Points in Geriatric Evaluation and Management Units" Muscles 2, no. 3: 250-270. https://doi.org/10.3390/muscles2030019
APA StyleLee, V., Appiah-Kubi, L., Vogrin, S., Zanker, J., & Mitropoulos, J. (2023). Current Cut Points of Three Falls Risk Assessment Tools Are Inferior to Calculated Cut Points in Geriatric Evaluation and Management Units. Muscles, 2(3), 250-270. https://doi.org/10.3390/muscles2030019