Abstract
The amount of municipal solid waste (MSW) generation in Canada was 34 million tonnes in 2018. Responsible waste management is challenging, but essential to protect the environment and to prevent the contamination of the ecosystem on which we rely. Landfilling is the least desirable option, and diversion through thermo-chemical conversion to value-added products is a good option for difficult-to-recycle waste. In this study, the amounts, moisture contents, heating values, and compositions of municipally collected solid waste produced in Canada are reported, a classification that is suitable for conversion purposes is proposed, and the potential for thermo-chemical conversion is determined. Much of the waste generated in Canada is suitable for being converted, and its potential for heat or electricity generation was determined to be 193 PJ/yr and 37 TWh/y, respectively. The GHG emissions that are saved through diversion from the landfill, while assuming the generated heat or electricity offsets natural gas combustion, gives a GHG reduction of 10.6 MMTCO2E/yr or 1.6% of Canada’s GHG emissions. The blending of waste in feedstocks can have varying effects on the amount of biogenic CO2 produced per unit energy in the feedstock, which is an important consideration for new projects. Other considerations include the heating values, moisture contents, and contaminant levels in the waste.
1. Introduction
Responsible waste management is a challenge in modern society as the availability of inexpensive materials and products has led to significant waste generation without corresponding technologies for sustainable disposal. As a result, our natural environment and ecosystems are under stress. While the ideal situation is a closed-loop circular economy, this scenario requires changes to upstream manufacturing and additional sorting during collection, which increase costs. Landfilling remains the least expensive option for dealing with waste. The material destined for landfill often has zero or negative value due to the disposal costs, but the organic fraction contains chemical energy that can be converted into value-added products such as fuel, heat, and electricity. The feasibility of this conversion depends on the properties of the waste—including the heating value, moisture content, contaminant concentration, and biogenic content—the availability of the waste, government incentives, and the conversion technology used. The potential opportunity for Canada to use its waste resources more effectively is explored in this study.
Several recent studies have reported waste management practices in other regions/countries including Europe [1,2], China [3], Spain [4], Brazil [5], Chile [6], Ghana [7], and Mexico [8]. Further studies have reviewed diversion practices for municipal solid waste including bio-conversion [9], incineration [10], gasification [11], and pyrolysis [12]. The rate of waste diversion varies significantly from region to region, from near zero in Ghana to 48% in European capital cities [2,7]. With a diversion rate of 27%, Canada is in the middle of this range. The common findings are that policies are needed to drive waste diversion and valorization as well as economic considerations are important. Furthermore, variability in waste handling across jurisdictions complicates the development of comprehensive regional strategies. Most of these studies investigate waste management practices and there are no Canadian studies that examine the waste produced from an energy production perspective. The only other study that examines waste streams from an energy conversion perspective is on the municipal level for the city of Madrid [4].
Solid waste can be diverted from landfilling through the recycling of inorganic materials and through the composting or conversion of organic materials. Conversion utilizes two main pathways: biological or thermo-chemical conversion. Biological conversion involves the use of microbial processes in an anaerobic environment to convert the waste to biogas (a mixture of methane (CH4) and carbon dioxide (CO2)) and is only suitable for solid waste with a high moisture (>50 wt% water) content and liquid wastes. In contrast, thermo-chemical conversion is suitable for a wider range of moisture contents and compositions (e.g., plastic, wood, and tires, which are not digestible by microbes), which are typical of a higher fraction of waste. Thermo-chemical conversion involves heating the waste to decompose the larger molecules into gaseous (CH4, CO, and H2), liquid (bio-oil), and solid (char and/or biochar) products. Conventional thermo-chemical conversion is carried out through incineration with heat recovery, but the products (CO2 and H2O) generally have no value. More advanced conversion technologies that offer lower emissions and more valuable products include gasification, pyrolysis, and hydrothermal conversion [4,13,14,15,16].
The waste management sector is quickly evolving as public demands for more responsible management and increasing resistance to landfill facilities are driving the need for waste diversion solutions. This study consolidates information on solid waste production in Canada, analyzes the potential for the different types of waste to be converted to energy, provides a critical snapshot of the current state of regulations, and highlights the need for better standardization and classification of waste that considers its conversion potential. Our study provides an objective analysis of what to do with municipal solid waste (MSW). In particular, the analysis of energy potential can be used by regulators to create policies for waste management to drive increased diversion and waste valorization processes.
2. Materials and Methods
2.1. Waste Classification and Data Sources
Waste is defined as a material that no longer has its original inherent value from the perspective of the person who used the material [17]. Waste contains a variety of components, which are classified differently according to the source, environmental impact, transportation restrictions (e.g., import–export regulations), health concerns, or sorting instructions. For example, the World Bank uses eight categories: food and green, glass, metal, paper and cardboard, plastic, rubber and leather, wood, and other [18]. In contrast, Environment and Climate Change Canada (ECCC) uses ten categories: 1. food, 2. diapers and pet waste, 3. paper, 4. wood, 5. yard and garden waste, 6. textiles with rubber and leather and other organics, 7. glass, 8. metals, 9. building materials, and 10. plastics [19].
This study summarizes the data reported on solid, post-consumer waste collected by municipal waste management facilities, with data primarily from ECCC reports [19]. Railway ties and biosolids (the solids remaining from wastewater treatment) are also included as they are more homogeneous waste products than MSW and, as such, are better candidates for thermo-chemical processing. In addition, railway ties and biosolids are both hazardous wastes, thus the cost of disposal is higher (i.e., regular landfilling is not an option). Hazardous wastes are defined as materials that are corrosive, flammable, infectious, reactive, and toxic, and that are harmful or have the potential to be harmful to humans and the environment [20].
Industrial waste that is collected by municipalities is included, but other industrial waste is not included as the amounts and composition of this waste are not publicly available. While there are estimates for the amounts of agricultural [21] and forest [22] residues in Canada, these residues are not currently collected and therefore, not included in this study. Furthermore, to be consistent with the waste definition used by the Canadian Council of Ministers of the Environment, other solid/semi-solid wastes, including contaminated soil, industrial sludge, gravel, rocks, nuclear wastes, oil field waste, portable toilet waste, landfill cover, and wastes that are associated with primary resource extraction or harvesting are excluded from this paper [17].
The quantities of waste produced in Canada were obtained from Government of Canada reports and websites [19,23,24,25,26,27,28]. The governmental data and reports are generated by compiling the results obtained from waste management surveys conducted in both government and business sectors [29,30]. It is assumed that 100% of all generated waste is collected, which is consistent with what the World Bank Group reported for high-income countries (96%) and for North America (100%) [18]. The properties of the organic components of solid waste were obtained from the Energy Research Center of the Netherlands (ECN) Phyllis database [31] by averaging the database entries in each category. The Phyllis database is a user-generated database containing over 3000 entries of physio-chemical properties for a wide variety of biomass materials including virgin, processed, and waste streams. Other references were used where data was not available in the Phyllis database.
2.2. Energy Potential Calculations
The energy potential of the categorized waste streams was determined using the quantity of landfill waste multiplied by the average heating value for the waste types (a sample calculation is given in the Supplementary Material). It was assumed that all the waste sent to landfills was available for energy production, which provides an upper limit to the energy potential of all landfill waste in Canada. A number of different conversion technologies were examined including primary conversion and upgrading or end-use conversion. Table 1 shows the different primary and secondary conversion technologies identified for solid waste materials, divided on the basis of moisture content. Wastes considered to have a high moisture were food waste, pet waste, yard and garden waste, and biosolids. Only the highest conversion efficiencies for high-moisture and dry feeds were used to calculate the energy potential to give the highest potential production of fuel or heat. In practice, a variety of conversion technologies will be selected, depending on local parameters such as the amount of waste available in the local area, quality of waste, and local or regional energy product demand.

Table 1.
Energy conversion efficiencies of several thermo-chemical conversion technologies.
Dry anaerobic digestion is outside of the scope of this study; however, it gives a higher overall efficiency of 59–68%, which would be among the higher conversion efficiencies for high-moisture wastes [32]. Rankine cycle conversion (steam turbine power plants) is only included for solid products from primary conversion as it can be a fuel replacement in coal-fired power plants. Rankine cycle liquid-fired power plants are less common, and gas-fired power plants are typically gas turbine or Integrated Gasification Combined Cycle (IGCC) facilities as these have a significantly higher efficiency. IGCC plants utilize a gas turbine for the primary power production, with a Rankine cycle steam turbine utilizing the waste heat for additional power production and increased efficiency.
2.3. GHG Emission Calculations
The GHG emissions from converting the energy in landfill waste to other forms were determined using the Environmental Protection Agency (EPA) Waste Reduction Model (WARM). This tool allows for the comparison of a baseline waste management scenario against an “alternative” scenario, which includes several different management practices including recycling, composting, incineration, or waste reduction. The baseline scenario included the quantities of waste that were landfilled and diverted for recycling. The WARM tool calculates the “high level estimates” of the potential GHG emissions from the landfilling of solid waste due to methane emissions from decomposition in landfills, in addition to GHG emissions associated with the transportation and application of the waste to landfills. Also, the WARM tool estimates the energy savings and economic impacts of the different scenarios, however, this is not relevant to the current discussion. The WARM tool has 60 different material type inputs, and each category offers different emission profiles depending on the moisture content and the methane produced through decomposition in anaerobic conditions. Despite this, the WARM tool categories did not exactly match the categories proposed here, and more suitable representative categories were used instead. The WARM tool utilizes the landfill emission factors developed by the EPA [51]. In the alternative scenario, the entirety of the waste destined for landfills is combusted. Although the thermo-chemical conversion methods described herein may produce fuel, this fuel will be combusted and ultimately release it’s carbon as CO2.
Substitutions were made for waste categories in the WARM model that did not match the waste categories proposed in this study. Specifically, the WARM wood flooring category was used for railway ties, and the WARM category “other biogenic organic” was used for pet waste, rubber and leather, mixed organics, diapers, textiles, biosolids, and household hazardous wastes, and is referred to as mixed organic in the GHG analysis. Recycling fractions were also included in the WARM tool to show the relative effect of current practices.
In addition to the WARM calculations, the GHG reduction potential of utilizing the heat of waste combustion to replace methane combustion was calculated. EPA emission factors for methane combustion used for this calculation were 53.06 kgCO2/mmBTU and 1 gCH4/mmBTU, and a methane global warming potential of 25 kgCH4/kgCO2E (CO2 equivalent) was used [52]. CO2 generated from biogenic sources was considered to be carbon neutral. A 50% biogenic fraction was given to mixed waste streams and a 0% biogenic fraction was given to plastics, indicating no GHG reduction benefits from its combustion as compared to natural gas.
3. Results
3.1. Context
Canada is a large (9 million km2) and sparsely populated (37 million people) country (population density of 4.2 people/km2) with significant vacant land. Not only does Canada have a high cost for waste sorting for recycling (USD 90–200 per tonne for collection and transfer [18]), but it also has a low number of incineration facilities—25 in 2020 [53]. As a result, Canada exports waste to the USA and overseas (approximately 770,000 tonnes to the USA in 1998 [54]). In comparison, Japan has one of the world’s highest population densities and a much smaller land mass [55]; therefore, out of necessity over 80% of Japan’s waste is incinerated [18]. This high rate of diversion was achieved through the investment in infrastructure and a regulatory environment that made landfilling the least economical waste management solution.
In Canada, there are several policies that govern solid waste management and energy recovery. The management of solid waste can be quite complex and involves responsibilities and policy considerations at various levels of government. At the federal level, responsibilities and governance include regulating the international and interprovincial movement of hazardous waste and recyclables, providing funding for waste diversion, and setting greenhouse gas (GHG) emission reduction targets. Municipal waste management accounts for approximately 28 MMTCO2E (million metric tonnes of CO2 equivalent) or 4% of Canada’s total GHG emissions [56]. Out of the 4% of total emissions from solid waste, 83% are from landfills [56]. The Government of Canada committed to GHG emission reduction targets for 2030 and 2050 in the Pan Canadian Framework on Clean Growth and Climate Change [57] and then released a strengthened climate plan in December 2020, which included actions to manage waste and resulting GHG emissions, resulting in funding for programs such as the Food Waste Reduction Challenge and the Plastic Waste Reduction Challenge [58]. The federal government is also responsible for international considerations with respect to waste management, such as the Basil Convention, which dictates that the trade of waste is not allowed, despite evidence that the shipping of waste is commonplace for many countries, including Canada [59,60].
At the provincial level, responsibilities include regulating waste management facilities and operation and establishing waste reduction policies and programs. For example, in Ontario, there are actions that are being proposed and/or are in various stages of implementation in the Made-in-Ontario Environment Plan to decrease waste production and increase the overall diversion rate, which includes various aspects of producer responsibility, reduction, recovery, and reuse. This plan is critical due to waste diversion rates in Ontario being stalled in recent years [61]. Prior to this slow-down, from 2002 to 2018, diversion rates were generally increasing in various provinces and territories, but were still relatively low [24]. The diversion standards encouraged composting practices for biomass waste and a landfill ban on recyclable waste. The impact of this policy is substantial in increasing the diversion of waste from landfills and reducing greenhouse gas emissions. Gregg [62] has shown that under a capped 450 ppm atmospheric CO2 concentration policy scenario, a full utilization of landfilled biogenic waste would produce more than 16 EJ/y globally from the year 2030 to 2065, which is equivalent to approximately a 4000 MMTCO2E/y emission reduction from avoided methane emissions, or approximately two-thirds of the gross USA greenhouse gas emissions in 2020 (~6000 MMTCO2E/y [63]).
At the municipal level, the responsibilities lie in the management, collection, and diversion of wastes from landfills and influence the management of waste from the industrial, commercial, and institutional sectors. The municipalities are responsible for the management of the diverted fractions, including recycling and composting. Local governments across Canada annually spend approximately CAD 2.9 billion on MSW handling, which equals approximately CAD 116 per tonne [64]. Most of this cost is for transportation and collection, with the balance for the operation of disposal and processing facilities, and tipping fees. Diversion rates range across Canada from 10% in Newfoundland to nearly 45% in Nova Scotia [24]. The reason for the lack of diversion is due to cost, as the average cost to divert MSW is CAD 364 per tonne, which is roughly three times the cost of landfilling [64]. In addition, tipping fees are often different between jurisdictions, which can result in municipalities exporting their waste to landfills elsewhere in Canada, or for incineration in the USA. Regulations are key for increasing diversion rates, but these mostly rely on mechanical recycling, composting, and reduction efforts, which are limited to only certain un-contaminated waste streams. Energy and chemical recovery are also important opportunities; however, they are often not viewed favourably in many jurisdictions for a variety of reasons including regulatory hurdles.
Landfills can be managed to reduce methane emissions through capture and control. The provinces of British Columbia, Alberta, Ontario, and Quebec in Canada have regulations that require landfills above a certain size to manage methane emissions [65]. The management of methane is completed through the requirement for landfill gas recovery systems, where the biogas can then be flared or ideally utilized for energy purposes either through direct biogas utilization for combined heat and power or through upgrading to renewable natural gas for pipeline injection. For example, Quebec and Ontario require landfills that have a waste capacity larger than 1.5 million cubic metres to install gas collection systems. British Columbia requires landfills with greater than 100,000 tonnes of waste or greater than 10,000 tonnes of disposed waste per year to evaluate their annual methane generation and install landfill gas systems if they exceed 1000 tonnes of methane per year.
Thermo-chemical conversion methods in which investments can be made include incineration, pyrolysis, gasification, and hydrothermal conversion with value-added products of heat, electricity, and/or solid, liquid, or gaseous fuels. The first three methods are commercial processes, while the last has only been used on a demonstration scale [66,67,68]. The most widely used method is incineration (combustion) of the waste and subsequent conversion of the heat produced to electricity using a Rankine cycle. This method is widely used by forestry mills to produce heat and power from wood-based milling waste [69]. Pyrolysis is the process of converting solid fuels at high temperatures in an inert environment to a solid, liquid, or gaseous fuel through carbonization, liquid pyrolysis, and gasification reactions, respectively. The temperature and residence time of the process determines the primary product with temperatures of approximately 300 °C, 500 °C, and 900 °C corresponding to the production of mainly solid, liquid, and gaseous products, respectively. Gasification is the next leading thermo-chemical conversion method for waste and can be accomplished using a wide variety of reactor designs and configurations. A thorough review of gasification can be found elsewhere [11]. Hydrothermal conversion is a process that uses a liquid feedstock (>80% water) with or without a catalyst. It is an advantage that the feed does not have to be dried, but commercialization is limited due to challenges with efficiency, process intensification, and cost [70]. There are currently 10 commercial and 10 demonstration hydrothermal liquefaction systems in operation and only one demonstration-scale hydrothermal gasification system in development [71,72].
3.2. Solid Waste Generation in Canada
Waste classification is not standardized in Canada and varies between the provinces and the municipalities within each province. For recyclable materials, there is some uniformity, with the primary classifications of plastics, metal, and glass. For non-recyclable waste, there is a wider variety of classifications used [73,74,75,76]. Our proposed classification system builds on those that are used elsewhere (Kaza et al., 2019, [19]) and divides solid wastes according to appropriate diversion strategies. The proposed taxonomy is presented in Figure 1. The descriptions for the categories used are given in Table S1 of the Supplementary Materials.
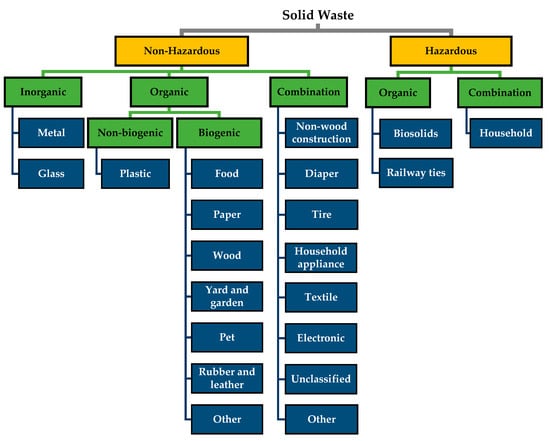
Figure 1.
Solid waste classification based on material types. The colours represent the level of classification as follows: primary (yellow), secondary (green), and tertiary (blue).
The types of waste generated in Canada are organized in Table 2. Nearly 35 million tonnes of solid waste were collected in Canada in 2018 from both residential and non-residential sources. Currently 29% (10 million tonnes) of waste is diverted to composting or recycling, while the remainder goes to landfills (68%) or is incinerated (3%) [17,19,24,77]. Using the data from Table 2 to compare with the data reported in World Bank, excluding the categories of other biogenic organic, other combination, non-wood construction, electronic, unclassified, and hazardous waste (categories that are not included by the World Bank), the calculated waste generation rate using the data in Table 2 is 1.98 kg per capita per day, which is very close to that reported by the World Bank—1.94 kg per capita per day—in 2016 [18]. The Canadian waste generation rate per capita (1.98 kg per capita per day) is roughly three times higher than the global average of 0.74 kg per capita per day and in the middle of the range of 0.11 to 4.54 kg per capita per day for all countries as reported by the World Bank [18]. However, if all the categories in Table 2 are included, the Canadian waste generation per capita increases to 2.58 kg per capita per day.
Table 2.
Solid waste production categorized by material types in Canada in 2016 and percent of waste disposed for landfill or incineration; bold and normal text indicates primary and secondary waste classifications respectively [19,27,28,78].
The largest component of waste is food (24 wt%), followed by paper (18 wt%) and plastic (10 wt%), as Table 2 shows. Waste that is a combination of organic and inorganic components comprises 20 wt% of the total waste generated. While the hazardous waste included is only 3 wt% of the total, the costs for disposal are expected to be much higher than other waste due to improper disposal. Meakin estimated that 85% of hazardous waste is dealt with improperly, and the extra cost involved to clean up contaminated landfill sites ranges from hundreds of thousands to millions of dollars [79].
There is legislation preventing the disposal of tires, electronics, and appliances in landfills, and so the disposal rate of these items is zero. Recycling programs accept food and paper, but consumer compliance is not complete, so the disposal rates are 69 wt% and 43 wt%, respectively. The Government of Canada does not track residential or industrial composting on site (i.e., in households or businesses); the 100 wt% disposal of yard and garden waste indicates that there is no separation of this waste once collected. Currently, there are no available data on how household hazardous waste is treated before disposal in landfills. The waste may be rendered non-hazardous through a physical (separation of the solid waste from the liquid waste using physical forces and mechanical means), chemical (neutralization, precipitation, oxidization, reduction, or any chemical alteration), biological (biodegradation of diluted organic wastes), or thermal (vaporization, oxidation, or other means to destroy waste) treatment [79]. The treated waste may then be landfilled or sent for water treatment according to its phase (solid or liquid, respectively) [79].
3.3. Waste Properties
For the fraction of the solid waste that can be thermo-chemically converted, the chemical properties—heating value, proximate analysis, moisture content, ash content, and ash composition—are given in Table 3. The sample sizes are highly variable depending on the waste type, ranging from none for tires to 43 for food. Waste is highly heterogeneous and varies over time and location. The composition of waste has even been shown to vary by income level in the region of disposal [18]. The main properties of waste that are of interest for thermo-chemical conversion are the heating value, moisture content, ash content, and chemical composition. Waste does not have a defined chemical structure, and so the averages of real-world samples from the Phyllis database were used [31]. Where the Phyllis database lacked datasets, other single-source references were used. Categories with minimal organic content such as “appliances” and where no reliable property data could be found were excluded from the analysis; these categories make up a limited fraction of the overall waste that is generated in Canada.
Table 3.
Properties of solid wastes that have the potential to be thermo-chemically converted to value-added products. Mean values are presented with standard deviations in brackets; HHV is higher heating value, daf is the dry and ash-free value, d is dry, and ar is as received. A dash (-) indicates that a value was not available or could not be calculated because of the small sample size; bold and normal text indicates primary and secondary waste classifications respectively.
In general, the heating value, on a dry basis, increases with the carbon and hydrogen contents and decreases with the oxygen and ash contents. For example, plastics are approximately 80% carbon and 10% hydrogen, with higher heating values (HHVs) of ~34 MJ/kg [31]. Tires also have a high carbon content (85%) and a similar heating value (36 MJ/kg). Other organic materials have lower carbon and hydrogen contents and, correspondingly, lower heating values, which are approximately half of those of plastic and tires. The HHVs reported in Table 3 are on an “as received” (ar) basis to reflect the effect of high ash and moisture contents on the energy generating potential.
The reported moisture contents of the waste categories have a wide range, likely because many factors influence the moisture content of solid waste including the specific material, storage condition, transfer method, landfill condition, and weather conditions. Food contains the highest moisture content at 43 wt% with a high standard deviation of 26 wt%, reflecting the variability in the composition of food. For example, the Phyllis database has multiple entries for “Dutch organic waste”, with moisture contents varying from 9.7% to 80% [31]. This significant variation, even among the same material category, leads to a wide variation in the energy potential of the material. For dry thermo-chemical conversion processes, the moisture content must be reduced to 15–20 wt% or less for efficient/steady-state conversion [34].
3.4. Contaminants
In the context of thermo-chemical processing, contaminants are defined as inorganic chemical species that cause damage to humans, the environment, and the process equipment. Since thermo-chemical conversion breaks down organic compounds, the contaminants of concern for these processes are inorganic and include sulphur, chlorine, and other halides, heavy metals, and alkali metals. These components can be present in higher concentrations in post-consumer waste than in raw feeds (e.g., biomass) due to the presence of additives and contamination in the waste stream. The major inorganic species vary between waste types. The contaminants with concentrations greater than 1000 ppm in the different waste streams are shown in Table S2 of the Supplementary Materials.
Sulphur in waste can lead to corrosion and harmful emissions that must be removed from the produced fuel or flue gas streams. In reducing conditions found in pyrolysis and gasification, sulphur can form hydrogen sulphide (H2S), which is highly corrosive and can damage process piping and equipment downstream of the conversion reactor [85]. In an oxidizing environment such as in incineration, sulphur forms sulphur dioxide, a harmful air pollutant responsible for acid rain, that must be removed prior to exhausting the flue gas. Both of these effects add cost to the conversion system. In hydrothermal processes, sulphur forms inorganic metal sulphates or elemental sulphur that remain in the solid phase [85].
Chlorine is highly corrosive and can damage metal process piping and equipment, particularly at high temperatures (>300 °C). In pyrolysis, chlorine that is present in the waste leads to the formation of HCl. In hydrothermal conversion, chlorine enters the liquid phase and can attack metal surfaces, causing corrosion, particularly under high temperatures (>300 °C). Chlorine also plays a role in the mobility of alkali metals such as potassium and magnesium and leads to the formation of deposits. Many alkali-chloride compounds are formed during the gasification process due to the presence of alkali metals such as K, Mg, and Na due to their volatile nature. These chloride compounds form deposits, enhancing the corrosion process, especially as the temperature increases. Chlorine originates from two main sources: packaging waste and plastic. Polyvinyl chloride contains 56 wt% Cl, the highest concentration for plastics [86,87].
Many of the components of waste contain heavy metals including As, Cd, Cr, Cu, Fe, Mn, Ni, Pb, and Zn. Table S2 of the Supplementary Materials lists the types of waste that contain more than 1000 ppm on a dry basis of inorganic components including heavy metals. The most abundant heavy metals are calcium and silicon in food, paper, wood, yard and garden waste, railway ties, and biosolids [31]. These contaminants arise from the fertilization and pest control of crops as well as from the processing of materials and are harmful to the ecosystem [88]. In unmanaged landfills, there is the possibility for these metals to enter the food chain through the water system and/or soil.
An advantage of thermo-chemically converting waste is the ability to capture heavy metals. The type of thermo-chemical conversion method, operating parameters, and properties of the heavy metals influence their distribution into the products, which include char, oil and gas for pyrolysis and hydrothermal treatments, solid residues and gases for gasification and incineration, and gases for dry anaerobic digestion. In general, higher operating temperatures result in increased heavy metal concentrations in the gas phase [88]. Some of the heavy metals, particularly Cu, Fe, and Ni [89], may catalyze gas phase reactions, but the metals also result in corrosion, abrasion, erosion, and/or fouling of the gasifier as well as downstream equipment. Heavy metals in the fly ash can be removed with cyclones. Increasing the equivalence ratio can decrease the amount of fly ash by promoting combustion, but the amount of hydrogen in the gas phase will also decrease. The fly ash can be acid washed to recover the heavy metals [90].
3.5. Energy Potential
An investigation of the total energy potential available in Canadian waste that is otherwise destined for landfills was performed using the amounts in Table 2, the HHVs in Table 3, and by applying appropriate conversion efficiencies for the different thermo-chemical conversion technologies split into high-moisture (>50 wt% moisture) and low-moisture (<50 wt% moisture) wastes, shown in Table 1. This approach provided an estimate of the total potential energy production potential per year, J/y for heat, liquid fuels, and gaseous fuels, and Wh/y for electricity (sample calculation shown below). The results for each waste stream and end-product are illustrated in Figure 2. If the product was entirely heat, which would give the highest conversion efficiency, the total possible energy conversion would be 193 PJ/y. This value compares to the 52 PJ/y consumed in cement kilns each year in Canada [91] and 79 PJ/yr of natural gas consumed in steel mills for heat in Canada [92], indicating that heat from waste can satisfy both of these demands. For electricity generation, the potential is 37 TWh/y or 5.8% of Canada’s total electricity production of 632 TWh/y [93]. The potential amounts of energy available if all waste is converted to one product fuel are 118 PJ/y and 45 PJ/y for liquid fuel and gaseous fuel, respectively. Canada’s crude oil and gas consumption values are 2234 PJ/y and 2850 PJ/yr, so there are potential offsets of 2.0% and 4.1%, respectively. Considering aviation fuel alone, the liquid fuel production potential of landfilled organic waste represents 41% of the total aviation fuel consumption in Canada; however, this number would be less after the upgrading required to produce high-quality aviation fuels.
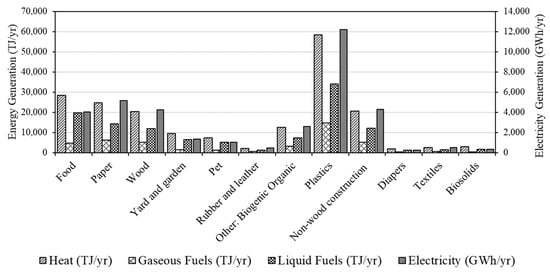
Figure 2.
Convertible energy in solid waste streams in Canada according to the potential product.
These energy production estimates are the same as those calculated for Madrid, where 800,000 tonnes of waste produced per year was found to have an energy potential of 7.5 PJ or 9.4 MJ/kg of waste [4]. In the current study, the heat and electricity generation potentials for all waste streams are 6.5 MJ/kg and 1.2 MWh/kg of waste, respectively.
The variability of the ash and moisture contents in the waste properties have a significant effect on the energy generating potential, particularly for food waste, where the as-received heating value varies between 2.4 MJ/kg for “low quality” waste with 80% moisture and 57% (dry) ash, and 26.4 MJ/kg for “high quality” waste with 3.0% moisture and 1.0% (dry) ash. The energy generating potential for the “high quality” food waste would be 76 PJ/yr and 7 PJ/yr for the “low quality” food waste. Thus, the energy potential would be highly dependent on regional waste properties.
The majority of energy conversion potential (78%) is in four categories: food, paper, wood, and plastics (Figure 2). These categories are often separated before disposal or post collection, and thus offer the easiest route for a significant conversion of energy from post-consumer waste. “Non-wood construction” and “Other: mixed plastics” account for 18% of the energy conversion potential, but these would be more challenging because of separation challenges from the waste stream.
Plastics have the highest potential for energy recovery because of the combination of their HHVs, low moisture, and significant quantities (Table 3). The largest waste stream by mass and nearly double that of “plastics” is “food”, which is high in moisture and has a low heating value by comparison, and therefore ranks second in energy content. Moreover, the process of converting high-moisture wastes to electricity has a much lower overall efficiency than low-moisture wastes, 26% and 45%, respectively, further reducing the electricity generation potential. Liquid fuel production shows a higher potential for energy recovery from high-moisture waste through hydrothermal liquefaction; however, there are limited hydrothermal liquefaction systems in operation at scale, and the overall efficiency of this process contains some uncertainty.
The energy conversion potential on a provincial basis, shown in Figure 3, generally follows provincial population and diversion rates and is important to understand the regional potential for converting waste as its feasibility is highly dependent on the location of the waste source and processing facility. Ontario has the highest energy generation potential as expected, with the energy generation potential from plastics alone greater than the potential of all but two other provinces (Alberta and Quebec). The greatest potential for the thermo-chemical conversion of waste is in the four largest provinces—Ontario, Quebec, Alberta, and British Columbia—accounting for 87% of the energy generating potential.
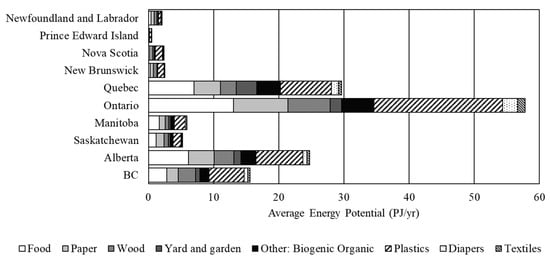
Figure 3.
Energy conversion potential on a provincial basis utilizing the average conversion efficiencies of the thermo-chemical processes from Table 3.
3.6. GHG Emissions
The GHG emissions for the current disposal scenario (baseline), the full diversion, and the energy conversion (alternative) scenarios are shown in Figure 4. These two scenarios were calculated using the EPA’s WARM tool by inputting the solid waste generation quantities. The overall change in the GHG emissions includes these values in addition to the potential GHG reduction from offsetting the combustion of natural gas with heat produced from the waste streams. The vertical axis represents the GHG emissions in each scenario, with negative values representing the emissions avoided. The baseline represents the current practices including recycling. The other three represent the change from the baseline considering the waste thermo-chemical conversion, the offset of natural gas combustion, and the combined total change in the CO2 emissions.
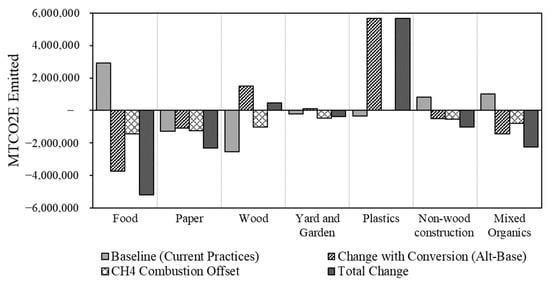
Figure 4.
GHG emissions from current (baseline) disposal scenario and waste conversion (alternative) scenarios for Canada’s produced waste, calculated using the EPA’s WARM tool.
In the case of “wood” and “yard and garden” waste, despite being biogenic, their relative resistance to decomposition means that landfilling has a positive GHG emission effect, as carbon would be sequestered in the landfill. “Yard and garden” waste had a GHG emission reduction when the energy offset for natural gas was considered; however, “wood” waste still had a slight increase in GHG emissions even with this consideration. If wood were used to offset more carbon-intensive fuels (e.g., coal) in cement and steel manufacture, the GHG emission reduction can be significant.
In the case of paper, existing diversion and recycling leads to a significant reduction in GHG emissions that overshadows the benefit from the waste conversion and natural gas offset. There is, however, still a significant positive benefit from the thermo-conversion of the remaining paper waste that is un-recyclable.
If all organic wastes were diverted from landfills and thermo-chemically converted to products that are ultimately combusted to release the molecular carbon as CO2, a GHG emission reduction of 5.0 MMTCO2E (million metric tonnes of CO2 equivalent) is possible. In contrast, the conversion of plastics resulted in a large increase in GHG emissions, as expected, since the landfilling of plastics is a means of sequestering the fossil carbon in the plastics. Carbon capture and storage or utilization would be possible in some of the conversion cases, for instance, solid carbon formation in gasification or CO2 capture in combustion; however, for simplicity, this is not included in the present analysis as it would require too many assumptions, and these capture technologies are not widely used. If plastics were not considered for thermo-chemical conversion, the GHG reductions from the remaining waste streams would be 10.6 MMTCO2E or 1.6% of Canada’s total GHG emissions [94].
3.7. Policy Incentives for Fuel Switching to Biogenic Wastes
As discussed previously, policies and regulations are instrumental to prompt the reduction in waste production and landfilling. Policies and regulations, especially carbon credits, are also keys to prompt the utilization of waste for the production of value-added products. The Greenhouse Gas Offset Credit System was launched in 2022 and aims to provide incentives for new projects that prevent and remove GHG emissions [95]. Carbon offset credits may apply to waste feedstocks through the biogenic (non-fossil) fraction of waste, which can be considered as carbon neutral, depending on the carbon intensity of the processes associated with its lifecycle [96]. The lifecycle carbon intensity allocated to the waste feedstock due to required pre-processing, e.g., drying, and the method of allocation (e.g., by weight, heating value, or volume of primary product) are important factors for overall GHG emission reduction. The contribution of these factors to the carbon intensity of different feedstocks will vary [96,97].
For energy conversion, waste feedstocks can be used directly and/or blended with petroleum feedstocks, according to the process fuel flexibility and reliability when operating on a particular waste stream. Feedstocks can also be blended to manage variability and heterogeneity. Standardization, grading, and pre-treatment of solid non-hazardous wastes also manages variability and increases the usable fraction. An increase in the blend of waste into feedstock may lead to a decreased carbon intensity and also may result in increased economic benefits by utilizing such incentives as carbon credit offsets. For example, the biogenic contents of various wastes [96] and heating values from Table 3 can be combined, as shown in Figure 5, to determine the biogenic emissions produced per unit energy for various blends with coal. Biogenic emissions do not increase linearly with the blend fraction, which is due to the heating value of the waste that varies according to the waste feedstock [98], but are lower than petroleum, particularly those that have higher biogenic fractions. Although an increased fraction of waste biomass will increase the biogenic emissions, as the blended fraction increases, more waste feedstock will be needed per unit energy, which is also an important consideration for the process modification and economics for new projects. The federal price of carbon in Canada is CAD 50 per MTCO2E (metric tonne CO2 equivalent) since April 2022 and is set to increase to CAD 170 in 2030 [98], so the avoided fossil emissions that are calculated in Figure 5 can improve the economic case for new projects depending on scale and, as mentioned previously, the lifecycle carbon intensity of the feedstock.
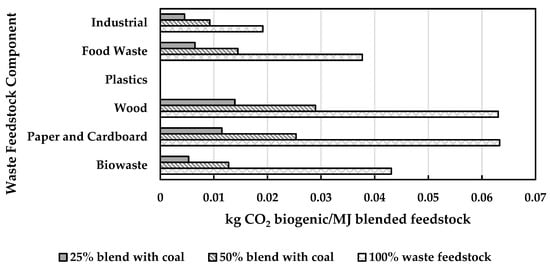
Figure 5.
Biogenic CO2 (kg) per MJ energy (wet basis) for various waste feedstocks and blended with coal in various fractions (25%, 50%, and 100% wt/wt).
In addition to using waste feedstocks for fuel switching, another avenue of reducing GHG emissions from landfills is via methane recovery and destruction. This practice is well established in Canada but is targeted for expansion through new incentives. The GHG Offset Credit System can be utilized with the methane recovery and destruction protocol to generate credits [99]. The protocol is intended to convert methane to biogenic CO2 via combustion in flares, boilers, turbines, and engines instead of allowing for methane to be emitted into the atmosphere. This protocol does not cover fuel switching with the methane, which may be eligible for additional offset credits depending on the project.
4. Discussion
The municipalities in Canada classify waste differently. For example, organic waste is defined by Statistics Canada as “materials that are or were once living, such as leaves, grass, yard trimmings, agricultural crop residues, wood waste, and paper and paperboard products or food scraps.” Nonetheless, almost all municipalities consider paper as a separate category outside of organic waste. Furthermore, diaper waste is generally classified as organic and considered degradable. Used diapers, however, consist of biodegradable cellulous (~37 wt%), non-biodegradable plastic materials (~22 wt%), adhesive tape (10%), and superabsorbent polymer materials (31 wt%) [83,100].
Some of the hurdles throughout Canada include the classification and standardization of wastes to ensure safety and environmental protection for waste handling and use in energy and material recovery processes. However, these barriers have been overcome in many other countries. For example, Solid Recovered Fuels (SRFs), which are non-hazardous materials taken from waste streams and repurposed as standardized fuel products, reductants, or chemical feedstocks, are produced for local use and trade in many countries such as South Korea, the United Kingdom, France, and Germany. There are SRF standards [101] in Europe for these fuels, which provide end-users with a predictability of the quality and supply, and provide producers with defined markets, enabling SRF to become a traded commodity. The export of SRFs from England and Wales went from zero in 2010 to around half a million tonnes per year in 2018 [102]. This growth was driven partially by changes in landfilling targets and the push to lower carbon emissions. There is currently work being conducted with the International Standards Organization (ISO), of which Canada is a member, to produce international standards for SRF (ISO TC 300). Canada, however, currently lacks the regulatory framework to fully adopt the production and use of SRFs, let alone trade them. These standards focus on the quality of the fuels as they relate to energy applications, but they are agnostic to the type of waste used to make the SRFs, and they include requirements for various classifications based on the heating value and composition, safe handling, bulk property measurement, and biogenic content. A standard measurement for the biogenic composition of SRFs is critical for accessing incentives, such as renewable energy credits, or specifically, carbon credit offsets in Canada.
This analysis attempts to highlight the large potential of post-consumer waste as an energy source to solve the dual problems of waste management and low GHG energy production. From a GHG reduction perspective, the best solution is to reduce waste generation. This is an ambitious goal, but highly unlikely in the near term, and responsible waste management will still be required for the foreseeable future. Thermo-chemical conversion is a promising way of reducing the mass of waste sent to landfills and preventing the export of waste internationally while obtaining value from the waste stream. From an environmental perspective, this analysis only considered GHG emission reductions and not factors such as land use and the contamination of air and water associated with landfilling. Other environmental and socio-economic factors can lead to increasing resistance to landfilling, particularly in the case of developing new landfill sites.
Recycling is another alternative to both landfilling and the conversion of waste for energy; however, despite significant efforts to increase recycling rates, the recycling rates for plastics remain low at 11% for Canada, as shown in Table 3. This low level is due to a number of factors including the contamination of recycling waste streams, the cost of separation of plastic types, and the low demand for recycled plastics that tend to be of lower quality than virgin plastics. Similar issues arise for paper recycling. Recycling is not a viable option for the other organic waste categories.
Another alternative disposal method to landfilling is the composting of organic waste. This method has challenges with the contamination of the compost with plastics and inorganics, and in some regions of Canada, particularly in Vancouver and Fraser Valley of British Columbia, there is an excess of nutrients, and much of the produced compost must be shipped to other regions at an additional cost and energy consumption.
The thermo-chemical conversion technology that offers the highest potential for energy recovery is combustion for the production of heat. For high-moisture waste streams, this would entail the production of a carbonized product from hydrothermal carbonization and subsequent combustion. For dry waste streams, this would be performed through incineration. Gasification followed by incineration for low-moisture waste streams has only a slightly reduced energy recovery potential and can offer other benefits such as reduced air pollutant formation (dioxins, sulphur dioxide, and nitrogen dioxide) through contaminant (Cl, HS, and NH3) removal prior to combustion. “Plastics” and “paper” contain relatively high concentrations of Cl and would benefit from a thermo-chemical conversion option where the Cl is removed prior to combustion such as gasification or pyrolysis. Hydrothermal conversion processes produce fuels in an aqueous environment where soluble contaminants are retained in the water, minimizing contaminants in the produced fuel.
Heat production can be used for applications such as cement and steel manufacture; however, contaminants and the heterogeneity of feedstock may necessitate the need for pre-treatment such as carbonization, pyrolysis, or gasification followed by combustion. Traditional incineration also has a negative connotation for many people, and there may be greater public acceptance for other conversion technologies such as gasification or pyrolysis.
The conversion technology chosen for a given waste stream is also dependant on the location of the waste and the energy needs of the local or regional area. The transportation of waste can significantly add to the cost and GHG footprint of the conversion processes; therefore, the geographic distribution of the waste is important. For example, waste that is generated close to an industrial facility with significant heat demand would be ideally suited for incineration or gasification or hydrothermal carbonization followed by combustion. Whereas waste that is generated far from energy demand should be converted to electricity or an easily transported fuel.
Economies of scale also impact the selection of conversion technology. Incineration, gasification, or electricity generation from waste is better suited to large-scale operations due to the complexity of the system and the required emission abatement equipment; therefore, a significant supply of waste would be needed, such as a large municipality or facility. For relatively small waste generation sites, a hub and spoke conversion model can be used, where several distributed small-scale conversion systems, such as pyrolysis units, would convert the waste into a more energy-dense, easily transportable fuel such as SRF or bio-oil for ultimate conversion at a centralized heat or electricity generation facility.
Considering that plastics are a non-biogenic waste stream and their conversion to other products would increase GHG emissions, a conversion technology where all or part of the carbon contained in the plastics can be captured should be selected. These can include combustion or electricity generation with integrated carbon capture and storage (CCS), gasification, or fast pyrolysis, where a portion of the carbon remains as un-converted char.
5. Conclusions
Canada produced nearly 35 million tonnes of solid waste per year in 2018. Of all the waste produced, 60% is organic and biogenic, and of this fraction, 42% ends up in landfills, meaning that 25% of Canada’s generated waste or 8.8 million tonnes can be relatively easily used for low-carbon energy production. In addition to this, more challenging waste streams that can be used for energy production, including non-biogenic organic (plastics), combination (non-wood construction, textiles, etc.), and hazardous (railway ties and biosolids) wastes make up an additional 7.4 million tonnes per year. There is no standardized waste classification system. Therefore, a new classification system was proposed in this paper to better classify the waste according to its potential for thermo-chemical conversion.
The most efficient waste conversion technologies are heat generation through hydrothermal carbonization followed by combustion for high-moisture wastes (50%), and incineration for low-moisture wastes (60%). The conversion of all available waste to heat as the energy end-use would yield 193 PJ/y. Alternatively, electricity can be produced from waste transfer or disposal sites at a rate of 37 TWh/y, which is 5.8% of Canada’s total electricity production. The energy production potential for the waste categories aligns with the quantity of each classification of waste produced, with 78% of energy recovery potential coming from four categories: food, paper, wood, and plastics. The greatest potential source is plastics at 37% or 12.2 TWh/y of electricity. A provincial examination of the energy potential confirmed that waste conversion should first be exploited in the most populated areas.
The variability of waste properties has a significant effect on the potential for energy production, particularly the ash and moisture contents of the waste stream. The averaged values were used for the waste properties, but for food waste, the variability in the ash and moisture contents were significant, between 1.0–57% (dry) and 3.0–80%, respectively, which would create a difference of more than 10-fold in the energy potential between high-ash and high-moisture food waste and low-ash and low-moisture food waste.
Assuming that the heat, fuel, and/or electricity produced also offsets natural gas combustion, the diversion of landfill-destined waste can decrease GHG emissions by 5.0 MMTCO2E, or by up to 10.6 MMTCO2E if non-biogenic plastics are excluded. The diversion of plastic, wood, and yard and garden wastes from landfills increases GHG emissions as these materials decompose more slowly, so their carbon is sequestered in the landfills. GHG emissions can be reduced if biogenic wastes (wood, and yard and garden wastes) are used to offset a more carbon-intensive fuel such as oil or coal.
Policies and regulations are the key drivers for the conversion of waste to heat, fuel, and electricity with landfill diversion. The economic incentives for waste conversion to energy can be promising due to carbon credit offsets. However, this work shows that the mitigated biogenic emissions, and thus, fossil CO2, is sensitive to both the waste feedstock type and the blend percentage with other non-biogenic feedstocks, which should be taken into account when determining the economic case for using wastes in new projects.
Supplementary Materials
The following supporting information can be downloaded at https://www.mdpi.com/article/10.3390/waste1030041/s1, Table S1. Solid waste definitions; Table S2. Major metal species that exceed 1000 ppm on a dry basis, and sulfur and chlorine content in wt% on a dry and ash-free basis for the solid waste studied; Table S3. Entry names and codes used from ECN Phyllis database for data generated in Table 3.
Author Contributions
Conceptualization, J.M.H.; methodology, J.M.H., Y.Y., J.W.B. and A.P.; validation, Y.Y.; visualization, J.M.H., Y.Y., C.R., J.W.B. and J.L.; formal analysis, Y.Y., J.W.B. and J.L.; investigation, Y.Y., C.R. and A.P.; resources, A.P.; data curation, Y.Y., C.R., A.P. and J.W.B.; writing—original draft preparation, J.M.H., Y.Y., J.W.B. and J.L.; writing—review and editing, J.M.H., Y.Y., J.W.B. and J.L.; supervision, J.M.H.; project administration, J.M.H.; funding acquisition, J.M.H., J.W.B. and J.L. All authors have read and agreed to the published version of the manuscript.
Funding
This research was funded by the Natural Sciences and Engineering Research Council (NSERC) of Canada, grant number RGPIN/03882-2020. NRC’s Advanced Clean Energy Program and NRCAN’s Program for Energy Research and Development provided funding support (NRC-19-123).
Institutional Review Board Statement
Not applicable.
Informed Consent Statement
Not applicable.
Data Availability Statement
The data presented in this study are available in the article or Supplementary Material.
Acknowledgments
The funding from the Natural Sciences and Engineering Research Council (NSERC) of Canada (grant no. RGPIN/03882-2020) for this work is gratefully acknowledged. In addition, Y.Y. received an NSERC PGS scholarship, and C.R. received a summer student scholarship from the Schulich School of Engineering, University of Calgary.
Conflicts of Interest
The authors declare no conflict of interest.
References
- Gharfalkar, M.; Court, R.; Campbell, C.; Ali, Z.; Hillier, G. Analysis of waste hierarchy in the European waste directive 2008/98/EC. Waste Manag. 2015, 39, 305–313. [Google Scholar] [CrossRef] [PubMed]
- Abeshev, K.; Koppenborg, F. More than just organics: Boosting separate collection of dry recyclables with door-to-door bio-waste collection in EU capitals. Waste Manag. 2023, 161, 156–165. [Google Scholar] [CrossRef] [PubMed]
- Guo, W.; Xi, B.; Huang, C.; Li, J.; Tang, Z.; Li, W.; Ma, C.; Wu, W. Solid waste management in China: Policy and driving factors in 2004–2019. Resour. Conserv. Recycl. 2021, 173, 105727. [Google Scholar] [CrossRef]
- Istrate, I.-R.; Medina-Martos, E.; Galvez-Martos, J.-L.; Dufour, J. Assessment of the energy recovery potential of municipal solid waste under future scenarios. Appl. Energy 2021, 293, 116915. [Google Scholar] [CrossRef]
- Giglio, E.; Pedro, F.; Cagica, L.; Xara, D. The governance of E-waste recycling networks: Insights from São Paulo City. Waste Manag. 2023, 161, 10–16. [Google Scholar] [CrossRef]
- Valenzuela-Levi, N. Poor performance in municipal recycling: The case of Chile. Waste Manag. 2021, 133, 49–58. [Google Scholar] [CrossRef]
- Miezah, K.; Obiri-Danso, K.; Kádár, Z.; Fei-Baffoe, B.; Mensah, M.Y. Municipal solid waste characterization and quantification as a measure towards effective waste management in Ghana. Waste Manag. 2015, 46, 15–27. [Google Scholar] [CrossRef]
- Juárez-Hernández, S. Energy, environmental, resource recovery, and economic dimensions of municipal solid waste management paths in Mexico city. Waste Manag. 2021, 136, 321–336. [Google Scholar] [CrossRef]
- Yaashikaa, P.R.; Kumar, P.S.; Saravanan, A.; Varjani, S.; Ramamurthy, R. Bioconversion of municipal solid waste into bio-based products: A review on valorisation and sustainable approach for circular bioeconomy. Sci. Total Environ. 2020, 748, 141312. [Google Scholar] [CrossRef]
- Leckner, B.; Lind, F. Combustion of municipal solid waste in fluidized bed or on grate—A comparison. Waste Manag. 2020, 109, 94–108. [Google Scholar] [CrossRef]
- Arena, U. Process and technological aspects of municipal solid waste gasification. A review. Waste Manag. 2012, 32, 625–639. [Google Scholar] [CrossRef]
- Chen, D.; Yin, L.; Wang, H.; He, P. Reprint of: Pyrolysis technologies for municipal solid waste: A review. Waste Manag. 2015, 37, 116–136. [Google Scholar] [CrossRef] [PubMed]
- Pagés-Díaz, J.; Pereda-Reyes, I.; Taherzadeh, M.J.; Sárvári-Horváth, I.; Lundin, M. Anaerobic co-digestion of solid slaughterhouse wastes with agro-residues: Synergistic and antagonistic interactions determined in batch digestion assays. Chem. Eng. J. 2014, 245, 89–98. [Google Scholar] [CrossRef]
- Dong, J.; Tang, Y.; Nzihou, A.; Chi, Y.; Weiss-Hortala, E.; Ni, M. Life cycle assessment of pyrolysis, gasification and incineration waste-to-energy technologies: Theoretical analysis and case study of commercial plants. Sci. Total Environ. 2018, 626, 744–753. [Google Scholar] [CrossRef] [PubMed]
- Møller, J.; Boldrin, A.; Christensen, T.H. Anaerobic digestion and digestate use: Accounting of greenhouse gases and global warming contribution. Waste Manag. Res. 2009, 27, 813–824. [Google Scholar] [CrossRef]
- Santos, S.M.; Assis, A.C.; Gomes, L.; Nobre, C.; Brito, P. Waste Gasification Technologies: A Brief Overview. Waste 2023, 1, 140–165. [Google Scholar] [CrossRef]
- Waste Management Industry Survey: Government Sector. Available online: https://www23.statcan.gc.ca/imdb/p3Instr.pl?Function=getInstrumentList&Item_Id=240306&UL=1V& (accessed on 15 November 2022).
- Kaza, S.; Yao, L.; Bhada-Tata, P.; Van Woerden, F.; Ionkova, K. What a Waste 2.0: A Global Snapshot of Solid Waste Management to 2050; Credo, E., Ed.; World Bank Group: Washington, DC, USA, 2019. [Google Scholar]
- Environment and Climate Change Canada. National Waste Characterization Report; 9780660341569; Environment and Climate Change Canada: Gatineau, QC, Canada, 2020; pp. 1–73.
- Environment and Climate Change Canada. Guide to Hazardous Waste and Hazardous Recyclable Material Classification. 2017. Available online: https://ec.gc.ca/gdd-mw/default.asp?lang=En&n=A8D9E099-0&offset=2&toc=show (accessed on 15 November 2022).
- Dymond, C.C.; Titus, B.D.; Stinson, G.; Kurz, W.A. Future quantities and spatial distribution of harvesting residue and dead wood from natural disturbances in Canada. For. Ecol. Manag. 2010, 260, 181–192. [Google Scholar] [CrossRef]
- Adetona, A.B.; Layzell, D.B. Anthropogenic energy and carbon flows through Canada’s agri-food system: Reframing climate change solutions. Anthropocene 2019, 27, 100213. [Google Scholar] [CrossRef]
- Government of Canada. Municipal Solid Waste Management in Canada. 2021. Available online: https://www.canada.ca/en/environment-climate-change/services/managing-reducing-waste/municipal-solid/environment.html (accessed on 15 November 2022).
- Environment and Climate Change Canada. Solid Waste Diversion and Disposal. 2022. Available online: https://www.canada.ca/en/environment-climate-change/services/environmental-indicators/solid-waste-diversion-disposal.html (accessed on 15 November 2022).
- Preliminary Resource Recovery Report Card and Gaps Assessment for Canada. Natural Resources Canada 2022. Available online: https://www.canada.ca/content/dam/eccc/food-loss-and-waste/Kelleher-NRCan%20CE%20Report%20Card.pdf (accessed on 15 November 2022).
- Statistics Canada. Human Activity and the Environment Waste management in Canada. 2012. Available online: https://www150.statcan.gc.ca/n1/pub/16-201-x/16-201-x2012000-eng.pdf (accessed on 15 November 2022).
- Government of Canada. Creosote-Impregnated Waste Materials; 0662204778; Government of Canada: Ottawa, ON, Canada, 1993.
- Canadian Council of Ministers of the Environment. Canada-Wide Approach for the Management of Wastewater Biosolids; Canadian Council of Ministers of the Environment: Winnepeg, MB, Canada, 2012.
- Statistics Canada. Waste Management Industry Survey: Government Sector. 2020. Available online: https://www23.statcan.gc.ca/imdb/p2SV.pl?Function=getSurvey&SDDS=1736 (accessed on 22 May 2023).
- Statistics Canada. Biennial Waste Management Survey. 2023. Available online: https://www23.statcan.gc.ca/imdb/p2SV.pl?Function=getSurvey&SDDS=2009 (accessed on 22 May 2023).
- ECN Phyllis Classification; TNO Biobased and Circular Technologies. Available online: https://phyllis.nl/Browse/Standard/ECN-Phyllis (accessed on 15 November 2022).
- Cao, Y.; Pawłowski, A. Sewage sludge-to-energy approaches based on anaerobic digestion and pyrolysis: Brief overview and energy efficiency assessment. Renew. Sustain. Energy Rev. 2012, 16, 1657–1665. [Google Scholar] [CrossRef]
- Furnaces Key Product Criteria. Available online: https://www.energystar.gov/products/heating_cooling/furnaces/key_product_criteria (accessed on 5 April 2023).
- Littlejohns, J.V.; Butler, J.; Luque, L.; Kannangara, M.; Totolo, S. Analysis of the performance of an integrated small-scale biomass gasification system in a Canadian context. Biomass Convers. Biorefin. 2020, 10, 311–323. [Google Scholar] [CrossRef]
- How Gas Turbine Power Plants Work. Available online: https://www.energy.gov/fe/how-gas-turbine-power-plants-work#:~:text=A%20simple%20cycle%20gas%20turbine,of%2060%20percent%20or%20more (accessed on 31 August 2022).
- Franco, A.; Casarosa, C. On some perspectives for increasing the efficiency of combined cycle power plants. Appl. Therm. Eng. 2002, 22, 1501–1518. [Google Scholar] [CrossRef]
- Toftegaard, M.B.; Brix, J.; Jensen, P.A.; Glarborg, P.; Jensen, A.D. Oxy-fuel combustion of solid fuels. Prog. Energy Combust. Sci. 2010, 36, 581–625. [Google Scholar] [CrossRef]
- Lucian, M.; Fiori, L. Hydrothermal Carbonization of Waste Biomass: Process Design, Modeling, Energy Efficiency and Cost Analysis. Energies 2017, 10, 211. [Google Scholar] [CrossRef]
- Dornburg, V.; Faaij, A.P.C. Efficiency and economy of wood-fired biomass energy systems in relation to scale regarding heat and power generation using combustion and gasification technologies. Biomass Bioenergy 2001, 21, 91–108. [Google Scholar] [CrossRef]
- Gollakota, A.R.K.; Kishore, N.; Gu, S. A review of hydrothermal liquefaction of biomass. Renew. Sustain. Energy Rev. 2018, 81, 1378–1392. [Google Scholar] [CrossRef]
- Watson, J.; Lu, J.; de Souza, R.; Si, B.; Zhang, Y.; Liu, Z. Effects of the extraction solvents in hydrothermal liquefaction processes: Biocrude oil quality and energy conversion efficiency. Energy 2019, 167, 189–197. [Google Scholar] [CrossRef]
- Butler, E.; Devlin, G.; Meier, D.; McDonnell, K. A review of recent laboratory research and commercial developments in fast pyrolysis and upgrading. Renew. Sustain. Energy Rev. 2011, 15, 4171–4186. [Google Scholar] [CrossRef]
- Qian, L.; Wang, S.; Xu, D.; Guo, Y.; Tang, X.; Wang, L. Treatment of municipal sewage sludge in supercritical water: A review. Water Res. 2016, 89, 118–131. [Google Scholar] [CrossRef]
- Littlejohns, J.V.; Butler, J.; Luque, L.; Austin, K. Experimental Investigation of Bioenergy Production from Small-Scale Gasification of Landfill-Diverted Wood Wastes. Waste Biomass Valorization 2020, 11, 6885–6901. [Google Scholar] [CrossRef]
- Ruiz, J.A.; Juárez, M.C.; Morales, M.P.; Muñoz, P.; Mendívil, M.A. Biomass gasification for electricity generation: Review of current technology barriers. Renew. Sustain. Energy Rev. 2013, 18, 174–183. [Google Scholar] [CrossRef]
- Tijmensen, M.J.A.; Faaij, A.P.C.; Hamelinck, C.N.; van Hardeveld, M.R.M. Exploration of fhe possibilities for production of Fischer Tropsch liquids and power via biomass gasification. Biomass Bioenergy 2002, 23, 129–152. [Google Scholar] [CrossRef]
- Makarichi, L.; Jutidamrongphan, W.; Techato, K. The evolution of waste-to-energy incineration: A review. Renew. Sustain. Energy Rev. 2018, 91, 812–821. [Google Scholar] [CrossRef]
- Incineration—The Heating Power of Refuse. Available online: https://www.planete-energies.com/en/medias/close/incineration-heating-power-refuse#:~:text=Heat%20production%3A%20This%20involves%20simply,energy%20per%20ton%20of%20refuse.&text=The%20energy%20efficiency%20of%20this,(300%20to%20400%20kWh) (accessed on 5 April 2023).
- Di Maria, F.; Contini, S.; Bidini, G.; Boncompagni, A.; Lasagni, M.; Sisani, F. Energetic Efficiency of an Existing Waste to Energy Power Plant. Energy Procedia 2016, 101, 1175–1182. [Google Scholar] [CrossRef]
- Abdulyekeen, K.A.; Umar, A.A.; Patah, M.F.A.; Daud, W.M.A.W. Torrefaction of biomass: Production of enhanced solid biofuel from municipal solid waste and other types of biomass. Renew. Sustain. Energy Rev. 2021, 150, 111436. [Google Scholar] [CrossRef]
- Unitied States Environmental Protection Agency. Compilation of Air Emissions Factors (AP-42), 5th ed.; Chapter 2: Solid Waste Disposal; Unitied States Environmental Protection Agency: Washington, DC, USA, 1998; Volume 1.
- Emission Factors for Greenhouse Gas Inventories. Available online: https://www.epa.gov/sites/default/files/2015-07/documents/emission-factors_2014.pdf (accessed on 5 April 2023).
- Inventory of Publicly Owned Solid Waste Assets, Infrastructure Canada. Available online: https://www150.statcan.gc.ca/t1/tbl1/en/tv.action?pid=3410023601 (accessed on 29 March 2023).
- Analysis of Exports/Imports of Non-Hazardous Wastes. Available online: https://www.canada.ca/en/environment-climate-change/services/canadian-environmental-protection-act-registry/historical/public-consultations/development-regulatory-options-export-import-prescribed-non-hazardous-wastes-destined-final-disposal/analysis.html (accessed on 29 March 2023).
- Japan; WorldData.Info. Available online: https://www.worlddata.info/asia/japan/index.php (accessed on 29 March 2023).
- Environment and Climate Change Canada. Canada’s 2030 Emissions Reduction Plan Canada’s Next Steps for Clean Air and a Strong Economy; Environment and Climate Change Canada: Gatineau, QC, Canada, 2022.
- Environment and Climate Change Canada. Pan-Canadian Framework on Clean Growth and Climate Change: Canada’s Plan to Address Climate Change and Grow the Economy; Environment and Climate Change Canada: Gatineau, QC, Canada, 2016.
- Government of Canada. Healthy Environment and a Healthy Economy: Canada’s Strengthened Climate Plan to Create Jobs and Support People, Communities and the Planet; Government of Canada: Ottawa, ON, Canada, 2020.
- Spittelau Energy-from-Waste Plant. Waste to Energy: Summary and Conclusions from the IEA Bioenergy ExCo71 Workshop; Vienna, Austria. 2014. Available online: https://www.ieabioenergy.com/blog/publications/exco71-waste-energy-summary-conclusions/ (accessed on 29 March 2023).
- Rabson, M. Malaysia returns 150 containers of garbage, including 11 to Canada. Natl. Post 2020. Available online: https://nationalpost.com/pmn/news-pmn/canada-news-pmn/malaysia-returns-150-containers-of-garbage-including-11-to-canada (accessed on 29 March 2023).
- Environmental Registry of Ontario. Discussion Paper on Reducing Litter and Waste in Our Communities. 2019. Available online: https://ero.ontario.ca/notice/013-4689 (accessed on 15 November 2022).
- Gregg, J.S. National and regional generation of municipal residue biomass and the future potential for waste-to-energy implementation. Biomass Bioenergy 2010, 34, 379–388. [Google Scholar] [CrossRef]
- Sources of Greenhouse Gas Emissions; U.S. Environmental Protection Agency. Available online: https://www.epa.gov/ghgemissions/sources-greenhouse-gas-emissions (accessed on 29 March 2023).
- Giroux, L. State of Waste Management in Canada; Canadian Council of Ministers of the Environment: Winnepeg, MB, Canada, 2014.
- Environment and Climate Change Canada. Reducing Methane Emissions from Canada’s Municipal Solid Wastze Landfills: Discussion Paper. 2022. Available online: https://www.canada.ca/en/environment-climate-change/services/canadian-environmental-protection-act-registry/reducing-methane-emissions-canada-municipal-solid-waste-landfills-discussion.html (accessed on 24 May 2023).
- Butler, J.; Procher, A.; Lotfi, S.; Littlejohns, J. Super Critical Water Gasification: A Review of Current Research Progress; Energy, Mining and Environment, Ed.; National Research Council of Canada: Ottawa, ON, Canada, 2020.
- Romano, P.; Stampone, N.; Di Giacomo, G. Evolution and Prospects of Hydrothermal Carbonization. Energies 2023, 16, 3125. [Google Scholar] [CrossRef]
- Harisankar, S.; Vinu, R. Comprehensive evaluation of municipal solid wastes and mixed feedstocks for commercial hydrothermal liquefaction in bio-refineries. Fuel 2023, 339, 127236. [Google Scholar] [CrossRef]
- Cotana, F.; Coccia, V.; Cavalaglio, G.; Barbanera, M.; Petrozzi, A. Chapter 5—Biomass-based systems. In Polygeneration Systems; Calise, F., Dentice D’Accadia, M., Vanoli, L., Vicidomini, M., Eds.; Academic Press: Cambridge, MA, USA, 2022; pp. 137–192. [Google Scholar]
- Kruse, A. Supercritical water gasification. Biofuels Bioprod. Biorefining 2008, 2, 415–437. [Google Scholar] [CrossRef]
- Jafri, Y.; Waldheim, L.; Lundgren, J. Emerging Gasification Technologies for Waste & Biomass; IEA Bioenergy Teachnology Collaboration Progamme: Vienna, Austria, 2020. [Google Scholar]
- Wijeyekoon, S.; Torr, K.; Corkran, H.; Bennett, P. Commercial Status of Direct Thermochemical Liquefaction Technologies; IEA Bioenergy Teachnology Collaboration Progamme: Vienna, Austria, 2020. [Google Scholar]
- Dillon Consulting. Metro Vancouver Full-Scale Waste Composition Study Report. 2022. Available online: http://www.metrovancouver.org/services/solid-waste/about/reports-resources/Pages/default.aspx (accessed on 15 November 2022).
- TRI Environmental Consulting Inc. Solid Waste Composition Study. 2013. Available online: https://www.rdno.ca/sites/default/files/2021-04/2021_Waste_comp_RPT.pdf (accessed on 15 November 2022).
- TRI Environmental Consulting Inc. Solid Waste Composition Study Fraser Valley Regional District. 2016. Available online: https://www.mission.ca/wp-content/uploads/FVRD-Final-Waste-Audit-Report-2015.pdf (accessed on 15 November 2022).
- Appendix 1a. Waste Material Types/Names and Definition (Manual Sort). 2018. City of Calgary. Available online: https://www.calgary.ca/categories/subcategory-garbageinfo-grid.html (accessed on 15 November 2022).
- Foden, J.P. The State of EFW in Canada: An Overview of Policy Options and Political Challenges. In Proceedings of the 5th Congress of the Confederation of European Waste-to-Energy Plants (CEWEP), Antwerp, Belgium, 1 July 2010. [Google Scholar]
- Environment and Climate Change Canada. Canadian Environmental Sustainability Indicators: Solid Waste Diversion and Disposal; Environment and Climate Change Canada: Gatineau, QC, Canada, 2022.
- Meakin, S. Hazardous Waste Management: Canadian Directions; Library of Parliament, Research Branch: Ottawa, ON, Canada, 1992. [Google Scholar]
- Monhol, F.A.F.; Martins, M.F. Cocurrent Combustion of Human Feces and Polyethylene Waste. Waste Biomass Valorization 2015, 6, 425–432. [Google Scholar] [CrossRef]
- Butler, J.; LeGros, R.; Austin, K.; Ma, W. Small Scale Gasification of Construction, Renovation and Demolition Waste. In Proceedings of the Canadian Chemical Engineering Conference (CCEC), Virtual, 26–30 October 2020. [Google Scholar]
- Takaya, C.A.; Cooper, I.; Berg, M.; Carpenter, J.; Muir, R.; Brittle, S.; Sarker, D.K. Offensive waste valorisation in the UK: Assessment of the potentials for absorbent hygiene product (AHP) recycling. Waste Manag. 2019, 88, 56–70. [Google Scholar] [CrossRef] [PubMed]
- Budyk, Y.; Fullana, A. Hydrothermal carbonization of disposable diapers. J. Environ. Chem. Eng. 2019, 7, 103341. [Google Scholar] [CrossRef]
- Zhou, H.; Meng, A.; Long, Y.; Li, Q.; Zhang, Y. An overview of characteristics of municipal solid waste fuel in China: Physical, chemical composition and heating value. Renew. Sustain. Energy Rev. 2014, 36, 107–122. [Google Scholar] [CrossRef]
- Huang, R.; Tang, Y.; Luo, L. Thermochemistry of sulfur during pyrolysis and hydrothermal carbonization of sewage sludges. Waste Manag. 2021, 121, 276–285. [Google Scholar] [CrossRef]
- Walsh, T. 34—The Plastic Piping Industry in North America. In Applied Plastics Engineering Handbook; Kutz, M., Ed.; William Andrew Publishing: Oxford, UK, 2011; pp. 585–602. [Google Scholar]
- Ma, W.; Rotter, S. Overview on the Chlorine Origin of MSW and Cl-Originated Corrosion During MSW & RDF Combustion Process. In Proceedings of the 2008 2nd International Conference on Bioinformatics and Biomedical Engineering, Shanghai, China, 16–18 May 2008; pp. 4255–4258. [Google Scholar]
- Raheem, A.; He, Q.; Mangi, F.H.; Areeprasert, C.; Ding, L.; Yu, G. Roles of Heavy Metals during Pyrolysis and Gasification of Metal-Contaminated Waste Biomass: A Review. Energy Fuels 2022, 36, 2351–2368. [Google Scholar] [CrossRef]
- Arnold, R.A.; Hill, J.M. Catalysts for gasification: A review. Sustain. Energy Fuels 2019, 3, 656–672. [Google Scholar] [CrossRef]
- Qin, J.; Zhang, Y.; Yi, Y. Water washing and acid washing of gasification fly ash from municipal solid waste: Heavy metal behavior and characterization of residues. Environ. Pollut. 2023, 320, 121043. [Google Scholar] [CrossRef]
- Natural Resources Canada. Canadian Cement Industry Energy Benchmarking Summary Report; Government of Canada, Natural Resources Canada: Ottawa, ON, Canada, 2009.
- Natural Resources Canada. Benchmarking Energy Intensity in the Canadian Steel Industry; Natural Resources Canada: Ottawa, ON, Canada, 2007.
- Provincial and Territorial Energy Profiles—Canada. Available online: https://www.cer-rec.gc.ca/en/data-analysis/energy-markets/provincial-territorial-energy-profiles/provincial-territorial-energy-profiles-canada.html (accessed on 5 April 2023).
- Greenhouse Gas Emissions. Available online: https://www.canada.ca/en/environment-climate-change/services/environmental-indicators/greenhouse-gas-emissions.html (accessed on 29 June 2023).
- Canada’s Greenhouse Gas Offset Credit System. Available online: https://www.canada.ca/en/environment-climate-change/services/climate-change/pricing-pollution-how-it-will-work/output-based-pricing-system/federal-greenhouse-gas-offset-system.html (accessed on 22 February 2023).
- Yi, S.; Jang, Y.-C. Life cycle assessment of solid refuse fuel production from MSW in Korea. J. Mater. Cycles Waste Manag. 2018, 20, 19–42. [Google Scholar] [CrossRef]
- Shadbahr, J.; Ebadian, M.; Gonzales-Calienes, G.; Kannangara, M.; Ahmadi, L.; Bensebaa, F. Impact of waste management and conversion technologies on cost and carbon footprint - Case studies in rural and urban cities. Renew. Sustain. Energy Rev. 2022, 168, 112872. [Google Scholar] [CrossRef]
- Larsen, A.W.; Fuglsang, K.; Pedersen, N.H.; Fellner, J.; Rechberger, H.; Astrup, T. Biogenic carbon in combustible waste: Waste composition, variability and measurement uncertainty. Waste Manag. Res. 2013, 31, 56–66. [Google Scholar] [CrossRef]
- Environment and Climate Change Canada. Federal Offset Protocol: Landfill Methane Recovery and Destruction; Environment and Climate Change Canada: Gatineau, QC, Canada, 2022.
- Lam, S.S.; Wan Mahari, W.A.; Ma, N.L.; Azwar, E.; Kwon, E.E.; Peng, W.; Chong, C.T.; Liu, Z.; Park, Y.-K. Microwave pyrolysis valorization of used baby diaper. Chemosphere 2019, 230, 294–302. [Google Scholar] [CrossRef] [PubMed]
- EN 15359; Solid Recovered Fuels—Specifications and Classes. European Committee for Standardization: 2011. Newark, Delaware, U.S. Available online: https://standards.iteh.ai/catalog/standards/cen/cb0123b1-6835-45e7-9257-12016bb1db42/en-15359-2011 (accessed on 29 June 2023).
- Parke, H.; RDF Industry Group. RDF and SRF Market Trends. 2019. Available online: https://www.rdfindustrygroup.org.uk/resources/letsrecycle-live-2019-presentation/ (accessed on 29 June 2023).
Disclaimer/Publisher’s Note: The statements, opinions and data contained in all publications are solely those of the individual author(s) and contributor(s) and not of MDPI and/or the editor(s). MDPI and/or the editor(s) disclaim responsibility for any injury to people or property resulting from any ideas, methods, instructions or products referred to in the content. |
© 2023 by the authors. Licensee MDPI, Basel, Switzerland. This article is an open access article distributed under the terms and conditions of the Creative Commons Attribution (CC BY) license (https://creativecommons.org/licenses/by/4.0/).