
Comparing Machine Learning Methods—SVR, XGBoost, LSTM, and MLP— For Forecasting the Moroccan Stock Market †


Abstract
:1. Introduction
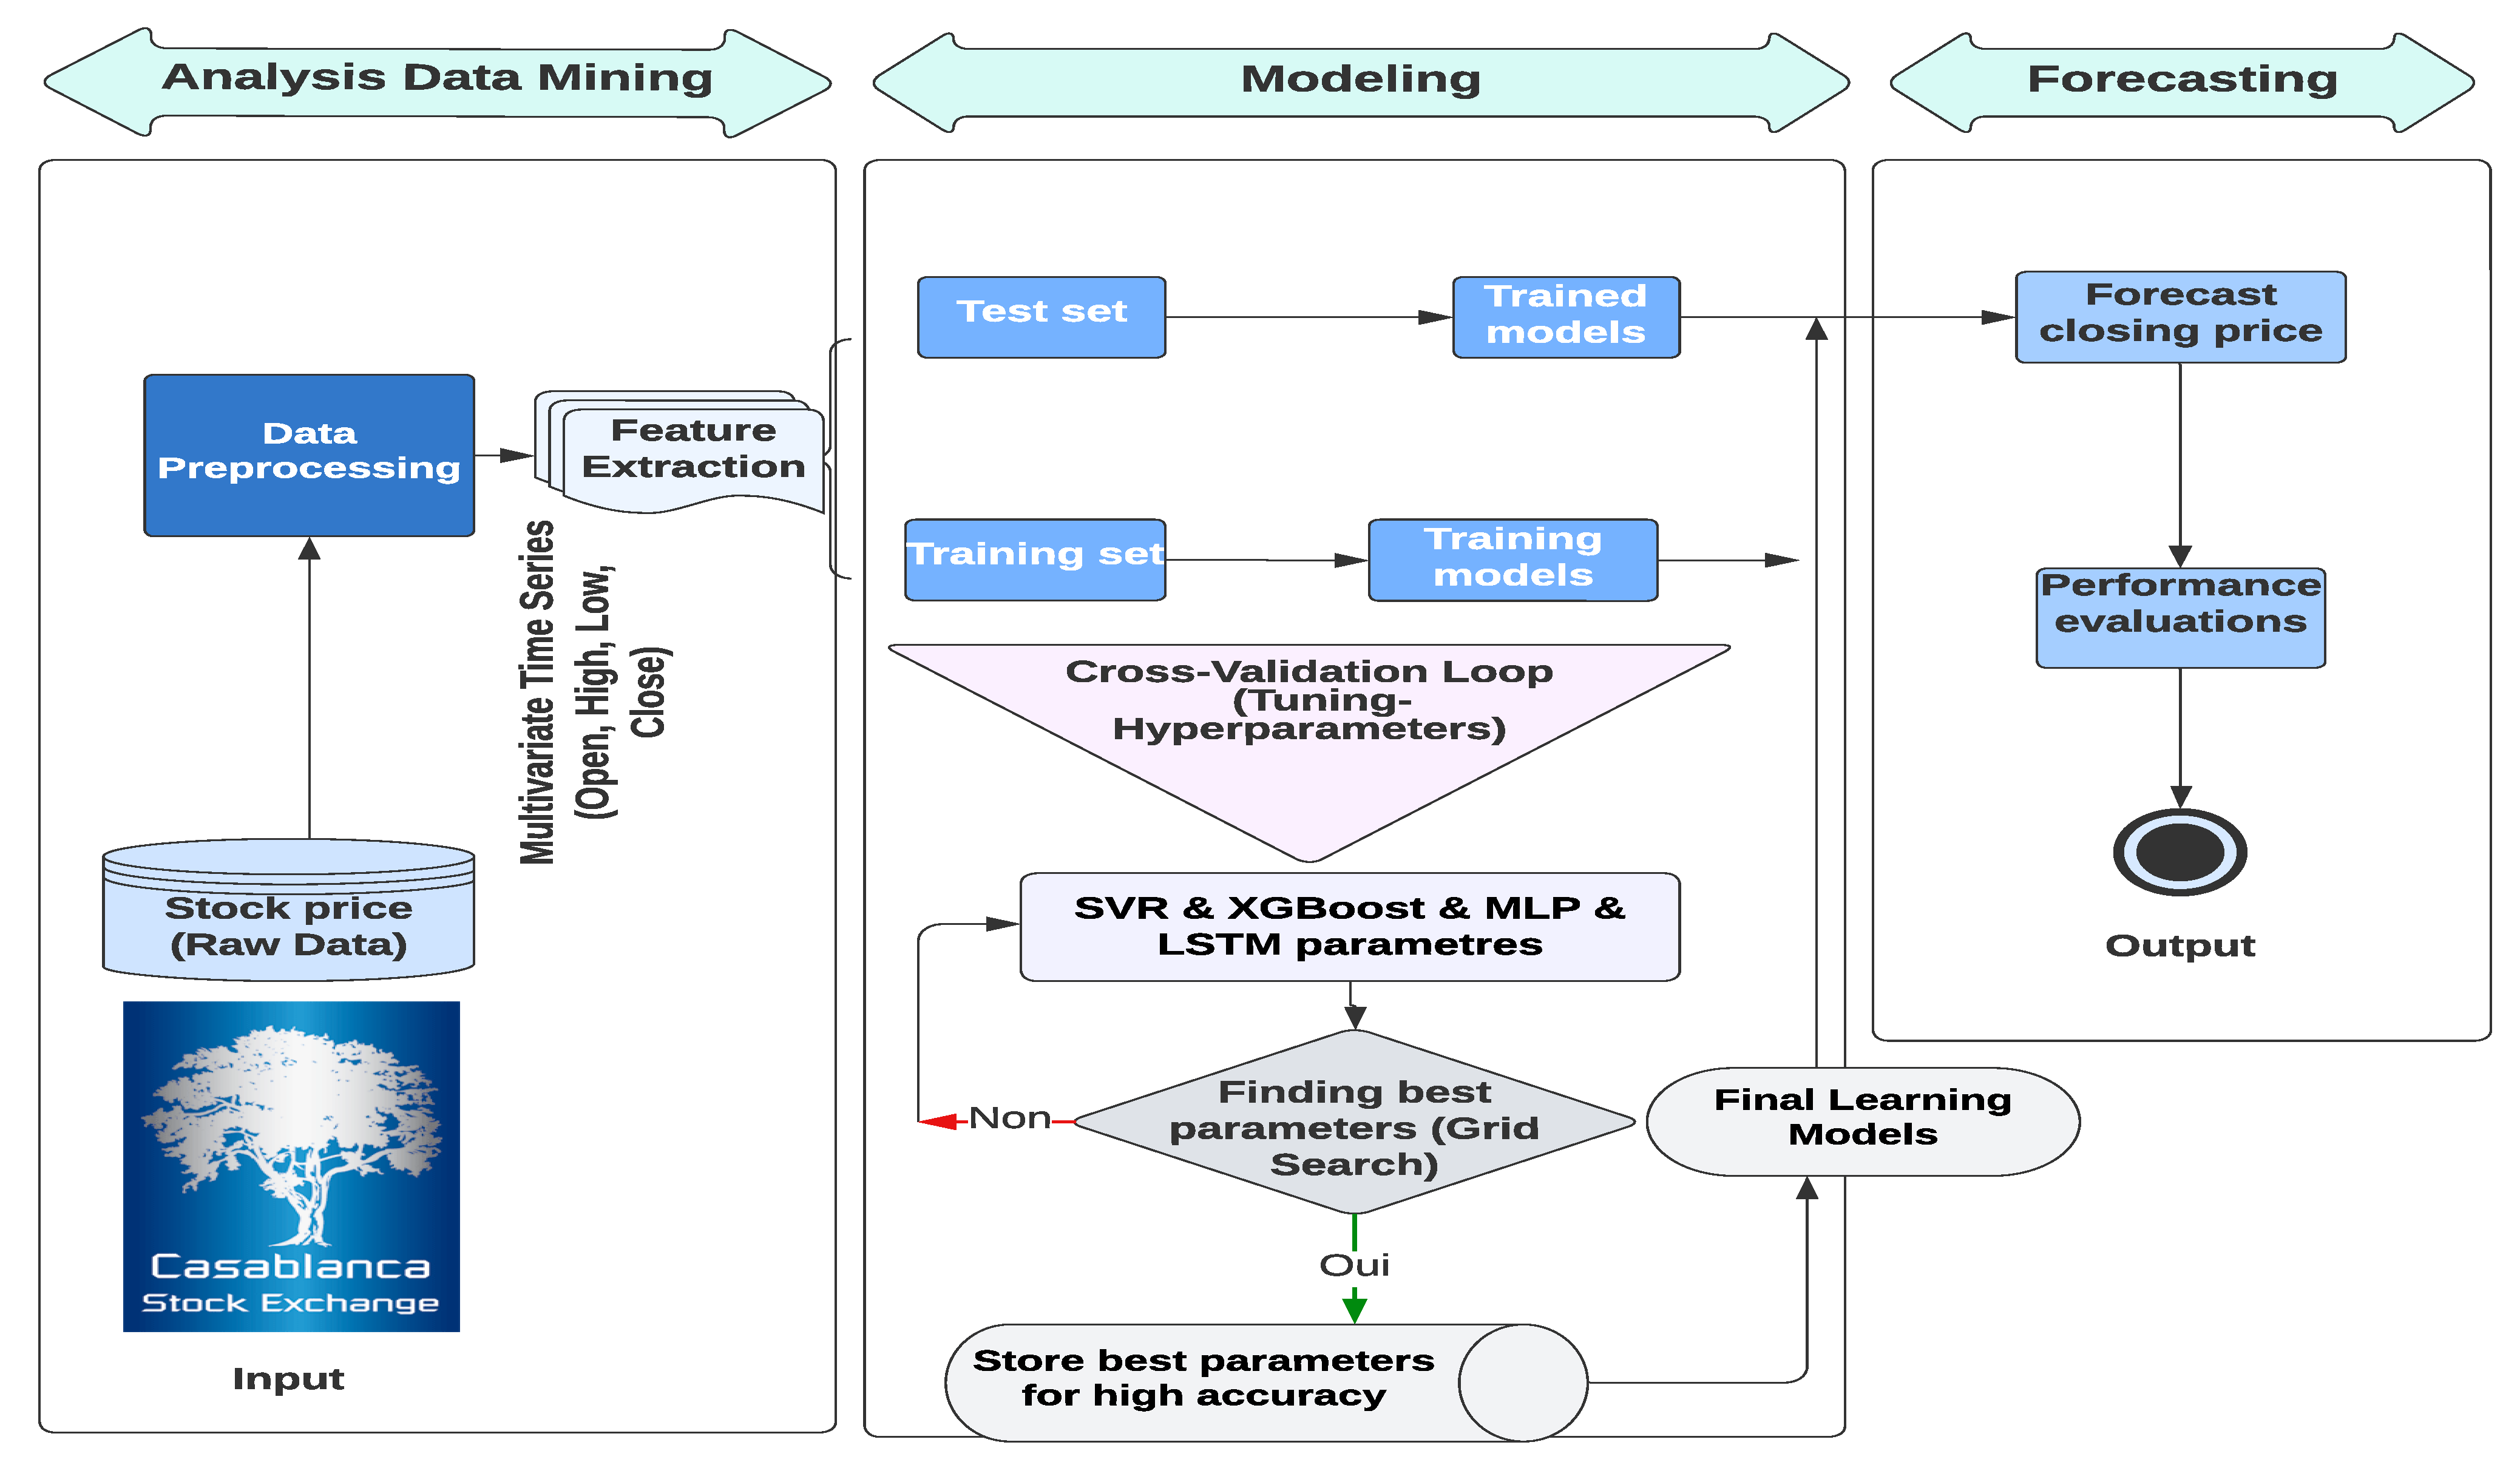
2. Materials and Methods
2.1. Data Collection
2.2. Preprocessing
2.3. SVR Model
2.4. XGBoost Model
2.5. MLP Model
2.6. LSTM Model
2.7. Grid Search
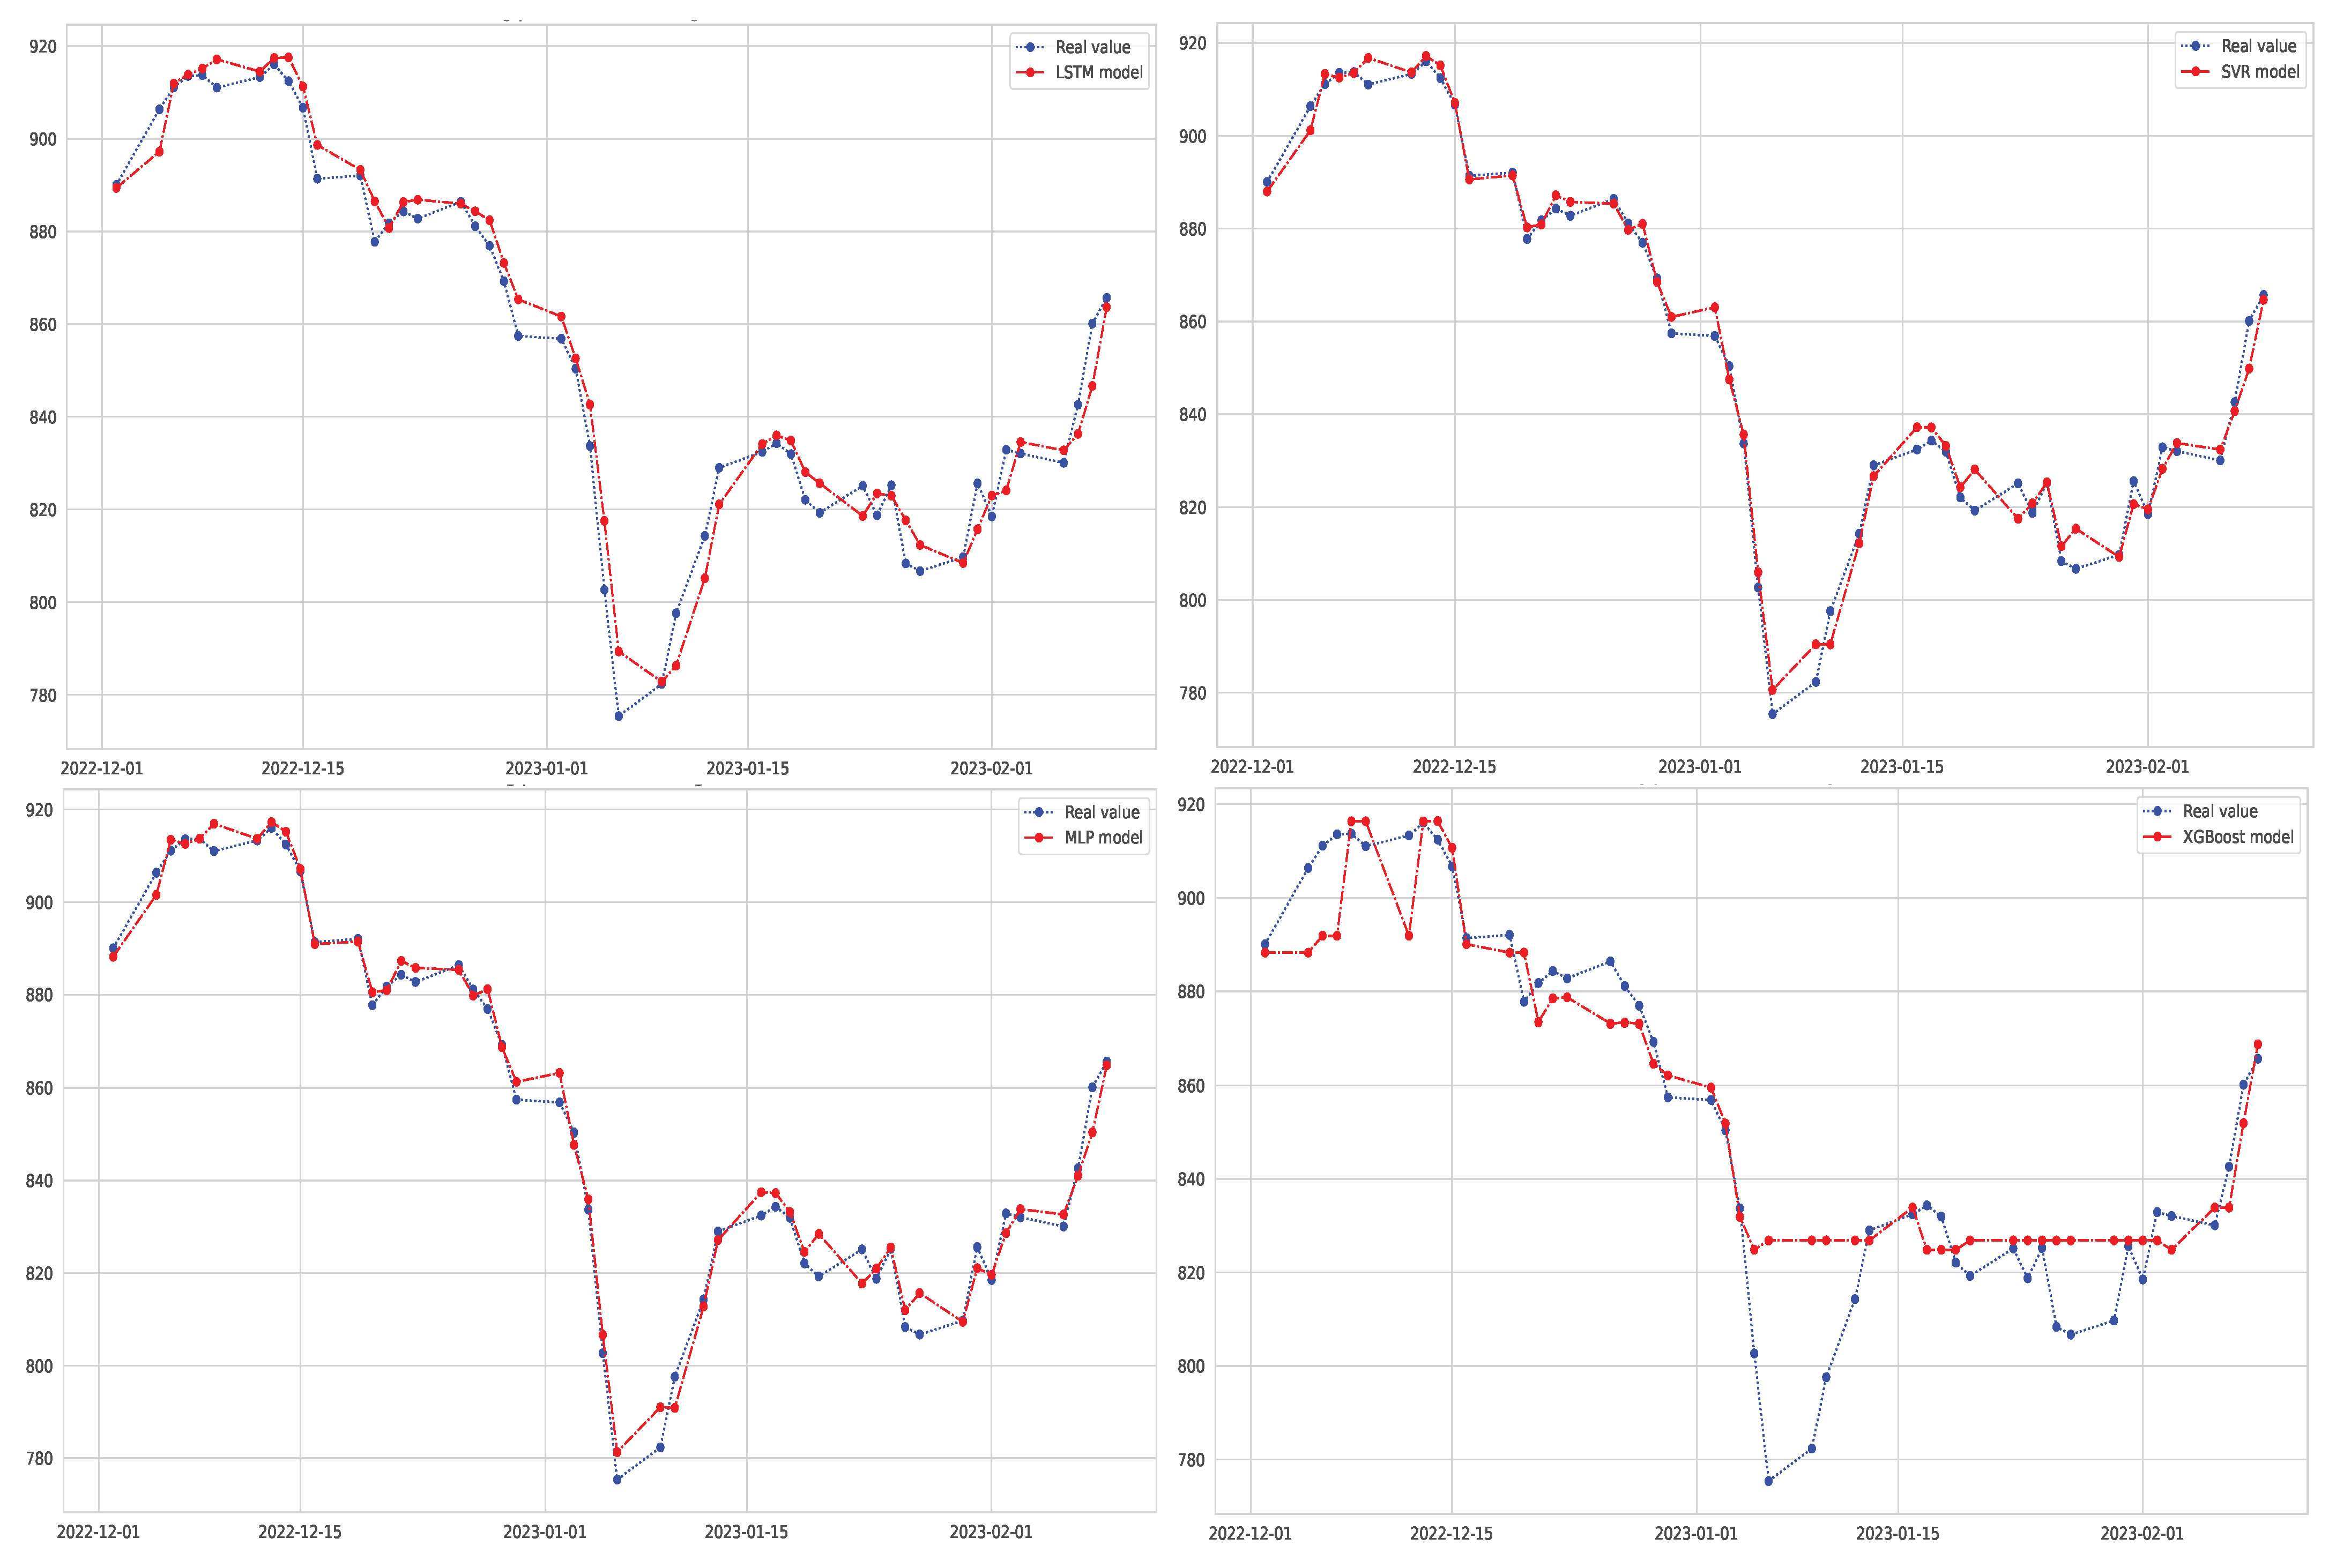
3. Results and Discussion
4. Conclusions and Future Work
Author Contributions
Funding
Informed Consent Statement
Data Availability Statement
Acknowledgments
Conflicts of Interest
References
- Mintarya, L.N.; Halim, J.N.; Angie, C.; Achmad, S.; Kurniawan, A. Machine learning approaches in stock market prediction: A systematic literature review. Procedia Comput. Sci. 2023, 216, 96–102. [Google Scholar] [CrossRef]
- Ozbayoglu, A.M.; Gudelek, M.U.; Sezer, O.B. Deep learning for financial applications: A survey. Appl. Soft Comput. 2020, 93, 106384. [Google Scholar] [CrossRef]
- Li, R.; Han, T.; Song, X. Stock price index forecasting using a multiscale modeling strategy based on frequency components analysis and intelligent optimization. Appl. Soft Comput. 2022, 124, 109089. [Google Scholar] [CrossRef]
- Kim, T.; Kim, H.Y. Forecasting stock prices with a feature fusion LSTM-CNN model using different representations of the same data. PLoS ONE 2019, 14, e0212320. [Google Scholar] [CrossRef] [PubMed]
- Xu, S.; Zou, S.; Huang, J.; Yang, W.; Zeng, F. Comparison of Different Approaches of Machine Learning Methods with Conventional Approaches on Container Throughput Forecasting. Appl. Sci. 2022, 12, 9730. [Google Scholar] [CrossRef]
- Yang, L.; Shami, A. On hyperparameter optimization of machine learning algorithms: Theory and practice. Neurocomputing 2020, 415, 295–316. [Google Scholar] [CrossRef]
- Rubio, L.; Alba, K. Forecasting Selected Colombian Shares Using a Hybrid ARIMA-SVR Model. Mathematics 2022, 10, 2181. [Google Scholar] [CrossRef]
- Xia, Y.; Liu, C.; Li, Y.; Liu, N. A boosted decision tree approach using Bayesian hyper-parameter optimization for credit scoring. Expert Syst. Appl. 2017, 78, 225–241. [Google Scholar] [CrossRef]
- Liwei, T.; Li, F.; Yu, S.; Yuankai, G. Forecast of LSTM-XGBoost in Stock Price Based on Bayesian Optimization. Intell. Autom. Soft Comput. 2021, 29, 855–868. [Google Scholar] [CrossRef]
- Al-Thanoon, N.A.; Algamal, Z.Y.; Qasim, O.S. Hyper parameters Optimization of Support Vector Regression based on a Chaotic Pigeon-Inspired Optimization Algorithm. Math. Stat. Eng. Appl. 2022, 71, 4997–5008. [Google Scholar]
- Lakshminarayanan, S.K.; McCrae, J.P. A Comparative Study of SVM and LSTM Deep Learning Algorithms for Stock Market Prediction. In Proceedings of the AICS, Wuhan, China, 12–13 July 2019; pp. 446–457. [Google Scholar]
- Al-Nefaie, A.H.; Aldhyani, T.H. Predicting Close Price in Emerging Saudi Stock Exchange: Time Series Models. Electronics 2022, 11, 3443. [Google Scholar] [CrossRef]
- Goverdhan, G.; Khare, S.; Manoov, R. Time Series Prediction: Comparative Study of ML Models in the Stock Market. Res. Sq. 2022. [Google Scholar] [CrossRef]
- Ettayyebi, H.; El Himdi, K. Artificial neural network for forecasting one day ahead of global solar irradiance. In Proceedings of the Smart Application and Data Analysis for Smart Cities (SADASC’18), Casablanca, Morocco, 27–28 February 2018. [Google Scholar]
- Kumari, P.; Toshniwal, D. Extreme gradient boosting and deep neural network based ensemble learning approach to forecasting hourly solar irradiance. J. Clean. Prod. 2021, 279, 123285. [Google Scholar] [CrossRef]
- Lu, W.; Li, J.; Li, Y.; Sun, A.; Wang, J. A CNN-LSTM-based model to forecast stock prices. Complexity 2020, 2020, 6622927. [Google Scholar] [CrossRef]
- Ranković, V.; Grujović, N.; Divac, D.; Milivojević, N. Development of support vector regression identification model for prediction of dam structural behavior. Struct. Saf. 2014, 48, 33–39. [Google Scholar] [CrossRef]
- Dezhkam, A.; Manzuri, M.T. Forecasting stock market for an efficient portfolio by combining XGBoost and Hilbert–Huang transform. Eng. Appl. Artif. Intell. 2023, 118, 105626. [Google Scholar] [CrossRef]
- Koukaras, P.; Nousi, C.; Tjortjis, C. Stock Market Prediction Using Microblogging Sentiment Analysis and Machine Learning. Telecom 2022, 3, 358–378. [Google Scholar] [CrossRef]
- Wu, J.M.T.; Li, Z.; Herencsar, N.; Vo, B.; Lin, C.W. A graph-based CNN-LSTM stock price prediction algorithm with leading indicators. Multimed. Syst. 2021, 29, 1751–1770. [Google Scholar] [CrossRef]

| Reference | Location | Year | Benchmark Model | MAPE (%) | RMSE | R |
|---|---|---|---|---|---|---|
| [11] | Irlande | 2019 | LSTM, SVR, MA | 1.03 | 347.46 | 0.83 |
| [16] | China | 2020 | MLP, CNN, RNN, LSTM, CNN-RNN | — | 39.688 | 0.965 |
| [13] | American | 2022 | ARIMA, XGBoost, LSTM | 3.8 | 6.101 | 0.961 |
| This study | Morocco | 2023 | SVR, XGBoost, MLP, LSTM | 0.368 | 3.993 | 0.989 |
| Trade Date | Open (MAD) | High (MAD) | Low (MAD) | Close (MAD) |
| 2020-12-18 | 946.25 | 950.56 | 943.85 | 944.58 |
| 2020-12-21 | 944.58 | 944.58 | 911.51 | 912.17 |
| 2020-12-22 | 912.17 | 928.51 | 906.77 | 927.79 |
| 2020-12-23 | 927.79 | 935.71 | 927.07 | 932.43 |
| 2020-12-24 | 932.43 | 932.81 | 926.58 | 927.16 |
| Statistics | Open | High | Low | Close |
| Count | 541 | 541 | 541 | 541 |
| Mean | 988.86 | 993.28 | 984.91 | 988.84 |
| Std | 78.01 | 77.05 | 78.35 | 78.15 |
| Min | 775.38 | 797.01 | 775.38 | 775.38 |
| Max | 1140.69 | 1142.56 | 1135.86 | 1140.69 |
| ML Models | Parameters | Type | Search Space |
|---|---|---|---|
| Epsilon in the SVR loss function (epsilon) | Continuous | [0.0001, 0.001, 0.01] | |
| Regularization parameter (C) | Discrete | [100, 1000, 1100] | |
| SVR | The kernel type (kernel) | Categorical | [’linear’, ’poly’, ’rbf’, ’sigmoid’] |
| Kernel coefficient (gamma) | Continuous | [1 × 10⁻⁵, 1 × 10⁻⁴, 1 × 10⁻³] | |
| Tolerance for stopping criterion (tol) | Continuous | default = 1 × 10⁻³ | |
| # of regression trees (n_estimators) | Discrete | [100, 200, 1000] | |
| Maximum regression tree depth (max_depth) | Discrete | [5,10, 15, 20] | |
| Boosting the rate of learning (learning_rate) | Continuous | [0.01, 0.06, 0.09] | |
| XGBoost | Minimum reduction of loss (gamma) | Continuous | [0.001, 0.01, 0.1] |
| Regularization term L1 on weights (reg_alpha) | Continuous | [ 0.001, 0.01, 0.1] | |
| Regularization term L2 on weights (reg_lambda) | Continuous | [ 0.001, 0.01, 0.1] | |
| Objective learning function (objective) | Categorical | [’reg:squarederror’,’reg:linear’] | |
| # of neurons in the ith hidden layer (hidden_layer_sizes) | Discrete | [(50,50,50), (50,100,50), (100,)] | |
| Activation function for hidden layer (activation) | Categorical | [’relu’,’tanh’,’logistic’,’identity’] | |
| MLP | The solver for weight optimization (solver) | Categorical | [’sgd’,’adam’,’lbfgs’] |
| Strength of the regularization term L2 (alpha) | Continuous | [0.001, 0.01, 0.1] | |
| Learning rate for weight update program (learning_rate) | Categorical | [’constant’,’invscaling’,’adaptive’] | |
| # of epochs to train the model (epochs) | Discrete | [20, 90, 100] | |
| # of hidden layer | Discrete | [1, 2, 3, 4] | |
| The function that tries to optimize (optimizer) | Categorical | [’adam’,’rmsprop’,’sgd’] | |
| LSTM | Learning rate (learning_rate) | Continuous | [0.1, 0.01, 0.001] |
| Activation functions (activation) | Categorical | [’tanh’,’sigmoid’,’relu’] | |
| # of hidden layer neurons (neurons_1, neurons_2) | Discrete | [150, 250, 350], [200, 200, 300], | |
| Loss functions to be minimized during model training (loss) | Categorical | [’mae’,’mse’,’mape’] |
| Metrics | ME | MAE | MSE | MPE (%) | MAPE (%) | RMSE | R (%) |
|---|---|---|---|---|---|---|---|
| Formulas |
| Models | SVR | XGBoost | MLP | LSTM | ||||
|---|---|---|---|---|---|---|---|---|
| Error Measure | Training | Test | Training | Test | Training | Test | Training | Test |
| ME | 0.0899 | 0.674 | 2.277 | 0.558 | 5.406 | 0.883 | 2.339 | 1.4 |
| MAE | 2.058 | 3.092 | 2.460 | 9.165 | 2.059 | 3.101 | 3.554 | 5.065 |
| RMSE | 2.646 | 3.993 | 3.141 | 13.515 | 2.642 | 4.018 | 4.496 | 6.322 |
| MPE (%) | 0.082 | 0.226 | 0.116 | 7.603 | 0.107 | 0.164 | 0.234 | |
| MAPE (%) | 0.207 | 0.368 | 0.244 | 1.095 | 0.207 | 0.370 | 0.357 | 0.603 |
| MSE | 7.003 | 15.941 | 9.864 | 182.651 | 6.978 | 16.286 | 20.215 | 39.97 |
| 0.998 | 0.989 | 0.997 | 0.882 | 0.998 | 0.989 | 0.995 | 0.974 | |
Disclaimer/Publisher’s Note: The statements, opinions and data contained in all publications are solely those of the individual author(s) and contributor(s) and not of MDPI and/or the editor(s). MDPI and/or the editor(s) disclaim responsibility for any injury to people or property resulting from any ideas, methods, instructions or products referred to in the content. |
© 2023 by the authors. Licensee MDPI, Basel, Switzerland. This article is an open access article distributed under the terms and conditions of the Creative Commons Attribution (CC BY) license (https://creativecommons.org/licenses/by/4.0/).
Share and Cite
Oukhouya, H.; El Himdi, K. Comparing Machine Learning Methods—SVR, XGBoost, LSTM, and MLP— For Forecasting the Moroccan Stock Market. Comput. Sci. Math. Forum 2023, 7, 39. https://doi.org/10.3390/IOCMA2023-14409
Oukhouya H, El Himdi K. Comparing Machine Learning Methods—SVR, XGBoost, LSTM, and MLP— For Forecasting the Moroccan Stock Market. Computer Sciences & Mathematics Forum. 2023; 7(1):39. https://doi.org/10.3390/IOCMA2023-14409
Chicago/Turabian StyleOukhouya, Hassan, and Khalid El Himdi. 2023. "Comparing Machine Learning Methods—SVR, XGBoost, LSTM, and MLP— For Forecasting the Moroccan Stock Market" Computer Sciences & Mathematics Forum 7, no. 1: 39. https://doi.org/10.3390/IOCMA2023-14409
APA StyleOukhouya, H., & El Himdi, K. (2023). Comparing Machine Learning Methods—SVR, XGBoost, LSTM, and MLP— For Forecasting the Moroccan Stock Market. Computer Sciences & Mathematics Forum, 7(1), 39. https://doi.org/10.3390/IOCMA2023-14409