
Univariate and Bivariate Log-Topp-Leone Distribution Using Censored and Uncensored Datasets †

 , ,
, ,  , ,
, ,
Abstract
:1. Introduction
2. Methods
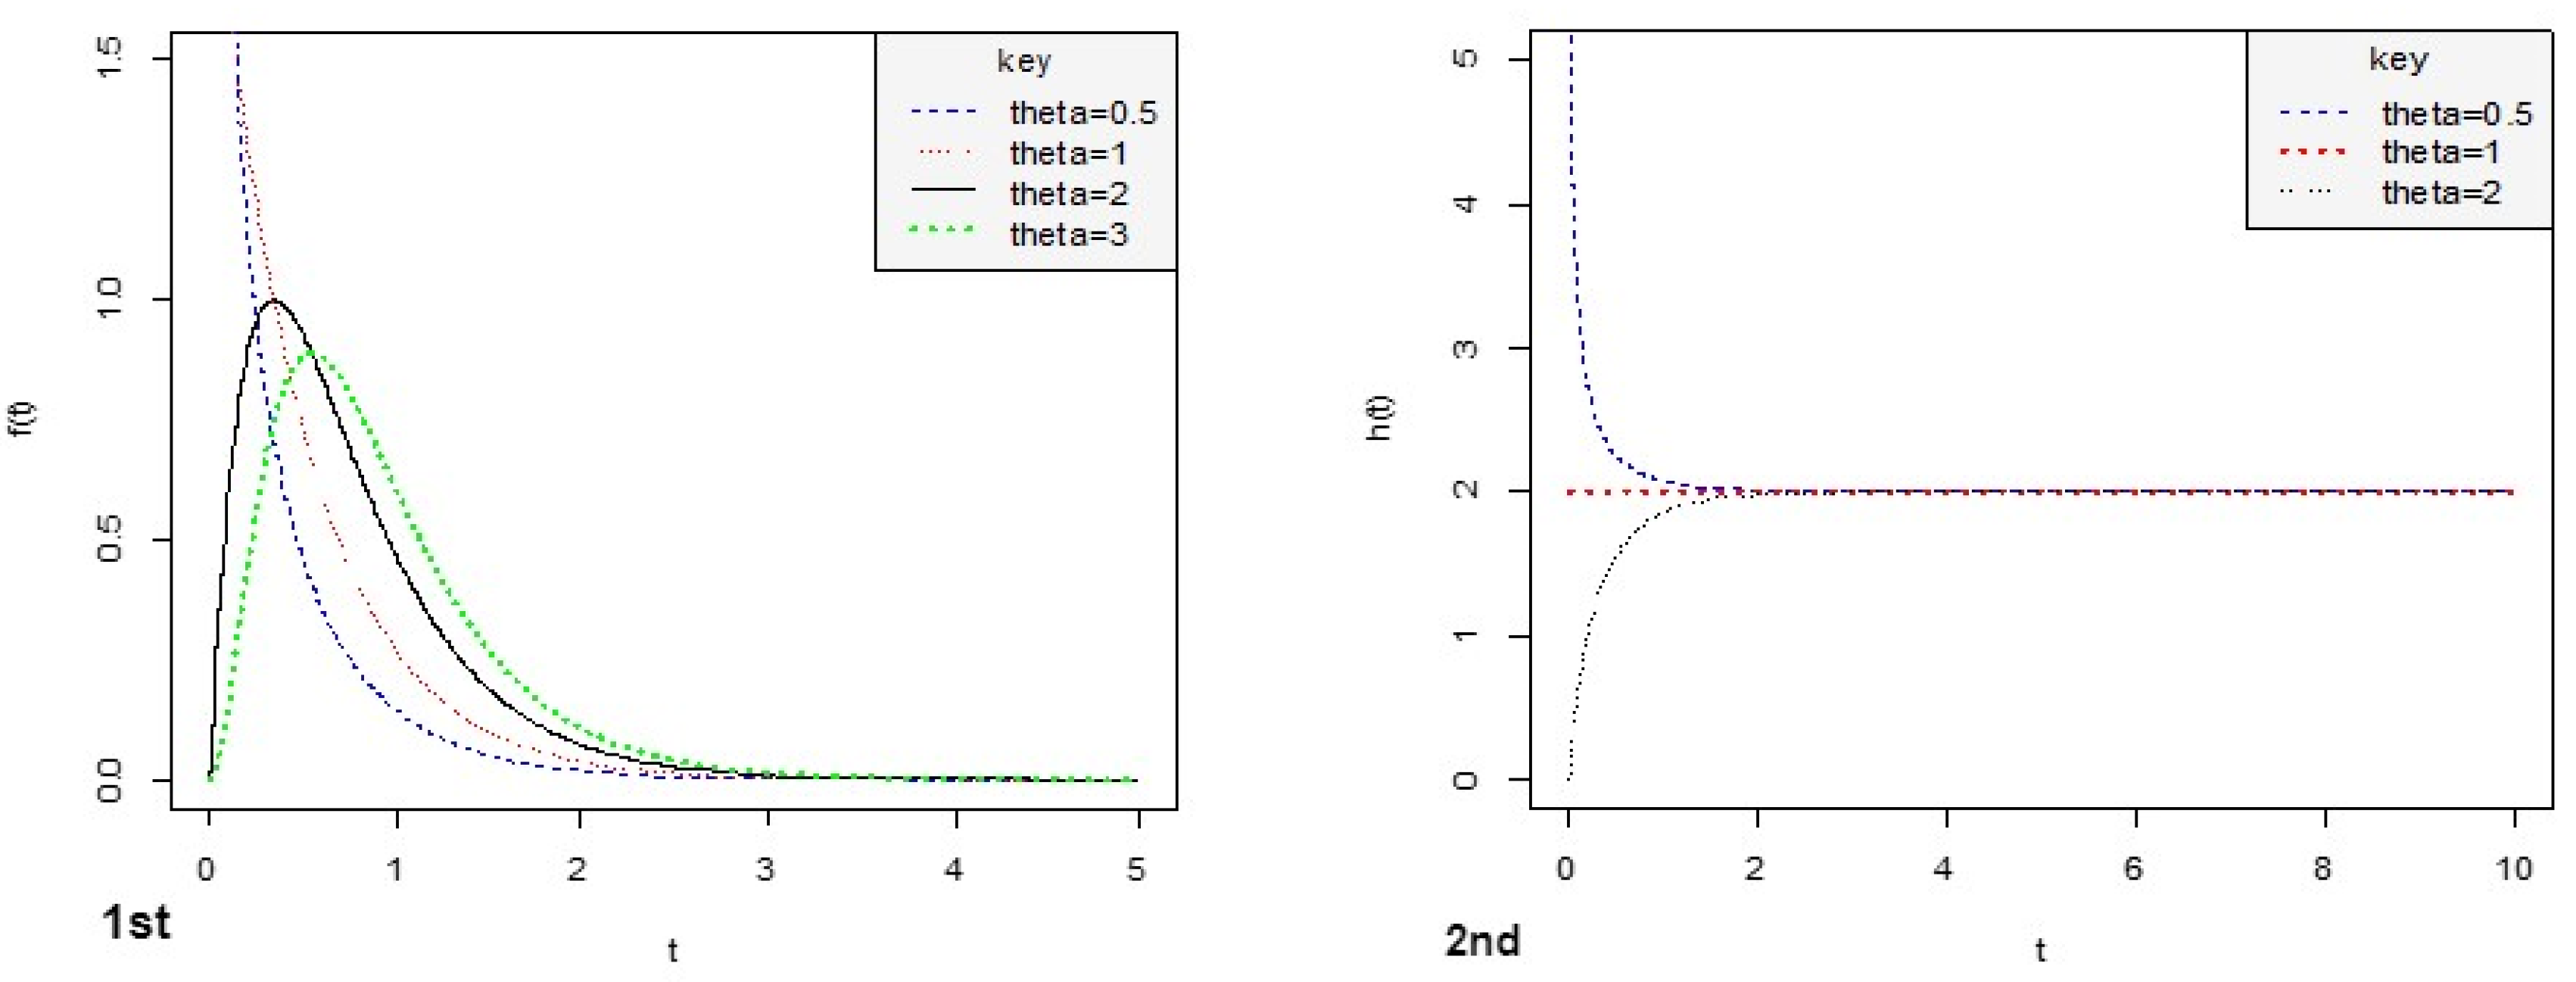
2.1. Log-Topp–Leone Distribution
2.2. Copula
2.2.1. Model Based on Farlie–Gumbel–Morgenstern Copula
2.2.2. Model Based on Clayton Copula
2.2.3. Model Based on Plackett Copula
2.3. Inference Methods
Bayesian Method of Estimation
- (a)
- When both and are censored observations.
- (b)
- When both and are uncensored or complete observations.
2.4. Deviance Information Criterion
3. Results and Discussion
4. Conclusions
Author Contributions
Funding
Institutional Review Board Statement
Informed Consent Statement
Data Availability Statement
Acknowledgments
Conflicts of Interest
References
- Pearson, K. Contributions to the mathematical theory of evolution. II. Skew variation in homogeneous material. Philos. Trans. R. Soc. Lond. A 1895, 186, 343–414. [Google Scholar] [CrossRef]
- Hastings, J.C.; Mosteller, F.; Tukey, J.W.; Windsor, C. Low moments for small samples: A comparativestudy of order statistics. Ann. Stat. 1947, 18, 413–426. [Google Scholar] [CrossRef]
- Gupta, R.D.; Kundu, D. Generalized exponential distributions. Aust. N. Z. J. Stat. 1998, 41, 173–188. [Google Scholar] [CrossRef]
- Usman, A.; Doguwa, S.I.S.; Alhaji, B.B.; Imam, A.T. A New Generalized Weibull Odd Frechet Family of Distributions: Statistical Properties and Applications. Asian J. Probab. Stat. 2020, 9, 25–43. [Google Scholar] [CrossRef]
- Eugene, N.; Lee, C.; Famoye, F. The beta-normal distribution and its applications. Commun. Stat. Theory Methods 2002, 31, 497–512. [Google Scholar] [CrossRef]
- Alzaatreh, A.; Famoye, F.; Lee, C. A new method for generating families of continuous distributions. Metron 2013, 71, 63–79. [Google Scholar] [CrossRef]
- Morgenstern, D. Einfache beispiele zweidimensionaler verteilungen. Mitteilings Bl. Math. Stat. 1956, 8, 234–235. [Google Scholar]
- Farlie, D.J. The performance of some correlation coe_cients for a general bivariate distribution. Biometrika 1960, 47, 307–323. [Google Scholar] [CrossRef]
- Gumbel, E.J. Bivariate exponential distributions. J. Am. Stat. Assoc. 1960, 55, 698–707. [Google Scholar] [CrossRef]
- Plackett, R.L. A class of bivariate distributions. J. Am. Stat. Assoc. 1965, 60, 516–522. [Google Scholar] [CrossRef]
- Clayton, D.G. A model for association in bivariate life tables and its application in epidemiological studies of familial tendency in chronic disease incidence. Biometrika 1978, 65, 141–151. [Google Scholar] [CrossRef]
- Topp, C.W.; Leone, F.C. A Family of J-Shaped Frequency Functions. J. Am. Stat. Assoc. 1955, 50, 209–219. [Google Scholar] [CrossRef]
- Sklar, A. Fonctions de répartition à n dimensions et leurs marges. Publ. Inst. Statist. Univ. Paris 1959, 8, 229–231. [Google Scholar]
- Spiegelhalter, D.; Best, N.; Carlin, B.; van der Linde, A. Bayesian measures of model complexity and fit. J. R. Stat. Soc. Ser. B 2002, 64, 583–639. [Google Scholar] [CrossRef]

| Copula | Methods | SE | p-Value | Dependence Parameter | AIC | BIC |
|---|---|---|---|---|---|---|
| FGM Copula | 0.0000 | 0.0000 | 37.0010 | 6177.690 | 6179.106 | |
| Plackett Copula | MLE | 2.0970 | 0.0000 | 41.1350 | 6168.544 | 6169.960 |
| FGM Copula | 2.0970 | 0.0000 | 28.8580 | 6200.704 | 6202.120 | |
| Plackett Copula | IFM | 2.9660 | 0.0000 | 29.9265 | 6196.408 | 6197.824 |
| Gibbs Samples for Parameters | FGM Copula | CLAYTON Copula | |||||
|---|---|---|---|---|---|---|---|
| Par. | Mean | MC Error | 95% CI | Mean | MC Error | 95% CI | |
| 1000 | 0.9738 | 0.0040 | (0.8889, 0.9998) | 0.8720 | 0.0204 | (0.6556, 0.9986) | |
| 61.000 | 5.9670 | (5.1140, 94.960) | 13.450 | 2.4130 | (1.5550, 36.860) | ||
| 8.7960 | 0.8389 | (0.9910, 14.340) | 17.850 | 3.3990 | (1.4890, 49.380) | ||
| DIC = 4409 | DIC = 2981 | ||||||
| 10,000 | 0.9734 | 0.0021 | (0.8894, 0.9994) | 0.7746 | 0.0052 | (0.6479, 0.9887) | |
| 45.180 | 1.1470 | (9.7790, 84.0200) | 25.700 | 0.5973 | (1.8310, 33.680) | ||
| 69.660 | 2.1100 | (1.5960, 92.9900) | 44.270 | 1.0790 | (1.7960, 57.560) | ||
| DIC = 3868 | DIC = 2502 | ||||||
| 100,000 | 0.9747 | 0.0004 | (0.9063, 0.9994) | 0.7624 | 0.0010 | (0.6425, 0.8983) | |
| 43.650 | 0.1995 | (34.740, 53.680) | 26.850 | 0.1072 | (20.940, 33.500) | ||
| 76.340 | 0.3931 | (60.640, 93.550) | 46.940 | 0.1988 | (36.750, 58.350) | ||
| Gibbs samples for parameters | DIC = 3786 | DIC = 2448 | |||||
| Gibbs Samples for Parameters | FGM Copula | CLAYTON Copula | |||||
|---|---|---|---|---|---|---|---|
| Par. | Mean | MC Error | 95% CI | Mean | MC Error | 95% CI | |
| 1000 | 0.9224 | 0.0154 | (0.6035, 0.9993) | 0.7164 | 0.0113 | (0.5797, 0.8807) | |
| 15.750 | 1.2350 | (5.1590, 29.210) | 8.3210 | 0.4135 | (0.9622, 11.610) | ||
| 22.100 | 2.9410 | (0.9919, 44.240) | 22.370 | 0.9948 | (4.8590, 31.990) | ||
| DIC = 4489 | DIC = 2679 | ||||||
| 10,000 | 0.9665 | 0.0030 | (0.8747, 0.9992) | 0.7255 | 0.0022 | (0.6162, 0.8484) | |
| 14.540 | 0.2097 | (11.080, 21.480) | 9.8050 | 0.0897 | (7.0100, 12.130) | ||
| 36.100 | 0.7086 | (5.9070, 45.080) | 21.360 | 0.1585 | (16.650, 27.690) | ||
| DIC = 4188 | DIC = 2631 | ||||||
| 100,000 | 0.9681 | 0.0006 | (0.8864, 0.9991) | 0.7267 | 0.0006 | (0.6159, 0.8497) | |
| 14.400 | 0.0223 | (11.640, 17.500) | 9.9510 | 0.0173 | (7.8550, 12.230) | ||
| 37.610 | 0.1258 | (30.400, 45.410) | 21.240 | 0.0238 | (16.730, 26.390) | ||
| DIC = 4156 | DIC = 2631 | ||||||
Disclaimer/Publisher’s Note: The statements, opinions and data contained in all publications are solely those of the individual author(s) and contributor(s) and not of MDPI and/or the editor(s). MDPI and/or the editor(s) disclaim responsibility for any injury to people or property resulting from any ideas, methods, instructions or products referred to in the content. |
© 2023 by the authors. Licensee MDPI, Basel, Switzerland. This article is an open access article distributed under the terms and conditions of the Creative Commons Attribution (CC BY) license (https://creativecommons.org/licenses/by/4.0/).
Share and Cite
Usman, A.; Ishaq, A.I.; Suleiman, A.A.; Othman, M.; Daud, H.; Aliyu, Y. Univariate and Bivariate Log-Topp-Leone Distribution Using Censored and Uncensored Datasets. Comput. Sci. Math. Forum 2023, 7, 32. https://doi.org/10.3390/IOCMA2023-14421
Usman A, Ishaq AI, Suleiman AA, Othman M, Daud H, Aliyu Y. Univariate and Bivariate Log-Topp-Leone Distribution Using Censored and Uncensored Datasets. Computer Sciences & Mathematics Forum. 2023; 7(1):32. https://doi.org/10.3390/IOCMA2023-14421
Chicago/Turabian StyleUsman, Abubakar, Aliyu Ismail Ishaq, Ahmad Abubakar Suleiman, Mahmod Othman, Hanita Daud, and Yakubu Aliyu. 2023. "Univariate and Bivariate Log-Topp-Leone Distribution Using Censored and Uncensored Datasets" Computer Sciences & Mathematics Forum 7, no. 1: 32. https://doi.org/10.3390/IOCMA2023-14421
APA StyleUsman, A., Ishaq, A. I., Suleiman, A. A., Othman, M., Daud, H., & Aliyu, Y. (2023). Univariate and Bivariate Log-Topp-Leone Distribution Using Censored and Uncensored Datasets. Computer Sciences & Mathematics Forum, 7(1), 32. https://doi.org/10.3390/IOCMA2023-14421