Abstract
Since the 19th century, the development of metallurgical technology has been influenced by various factors, such as materials, casting technology, political policies, and the economic development of different countries. This paper aims to analyze the time-series evolution trend in medal issues in different countries and explore their historical and commemorative significance. Taking the characteristics of medal production places, types, compositions, diameters, weights, shapes, compositions, and thicknesses between 1850 and 2025 as indicators, data analysis methods such as time series, hierarchical cluster analysis (HCA), logistic regression, and random forests are used to study the process of medal development and influencing factors in the past 175 years. The results show that compared with the pre-World War II period, the weight and diameter of all medals of major countries changed significantly in different periods. Moreover, before and after World War II, there was a shift from traditional materials to cost-effective and convenient alternatives.
1. Introduction
Medals have played an important role in the development of human society and civilization. In the history of cultural development, they have been used to mark historical events and represent the outstanding achievements and honors of nations and individuals. Medals from different periods differ greatly in materials, casting techniques, and the impact of national political events and economic development.
Over time, the way medals were made and used changed because industrial technology improved and social systems became more standardized. It is well known that early medals were mostly made of precious metals such as gold, silver, and copper. Different metals have different meanings and values. However, under the impact of war and the availability of natural resources, especially during world wars and economic recessions, alternative materials such as aluminum and other alloy polymers became common. These materials cost less than pure metals but still meant almost the same thing. The number of medals a country owns also indirectly shows its economic growth and cultural history [1].
Taking the Olympic Games as an example, studies have shown that the number of medals won by a country is directly related to the economic resources and utilization rate of the country’s development [2]. The different countries in the Olympic Games over the years show that while developed countries such as the United States have won more than 100 medals, developing countries, such as China and India, have won relatively less [3]. Shen and Xu found that there is a strong correlation between national GDP and the number of Olympic medals and Olympic gold medals by studying the data on the distribution of the number of Olympic medals during the period of 1986–2016, and that the countries with higher GDP rankings have more medals [4].
Analyzing the historical trends in the basic structure, composition, and distribution of medals in different periods can help people understand the evolution of medal design and material use and track the progress of metallurgical technology. This provides insight into how other regions and industries adapted to historical events such as wars, industrial revolutions, and economic crises. In this paper, the metal composition, diameter, weight, shape, and thickness of medals in different periods between 1850 and 2025 are used as indicators, and time series, hierarchical clustering analysis, logistic regression, and random forest data analysis methods are used to study the development process and influencing factors of medals in the last 175 years.
2. Dataset Analysis
The dataset used in this article is from Numista (https://en.numista.com/catalogue/index.php) (accessed on 30 July 2025).
Numista is an online catalog focused on coin, medal, and banknote collecting that provides detailed information, historical background, and market trading features for all types of coins from around the world over time. The dataset contains 852 rows and 38 columns, including country, location, period, type, year, composition, weight, diameter, shape, technique, orientation, thickness, issuer entity, currency, value, and dedication (e.g., king, emperor, regent, grand duke, etc.). It covers medals from around the world from 1800 to 2025. Due to the relatively long period covered by the data and their different sources, there are problems with inconsistent formats, missing values, and non-standardized data. Therefore, it is important to clean and preprocess the data to ensure the consistency and completeness of the variables before further analysis. The cleaning process used mainly includes numerical formatting, missing value treatment, categorical variable standardization, and outlier detection to eliminate irregular formatting and potential errors in the data and make it suitable for subsequent analysis and modeling.
First, for the field’s weight, diameter, and thickness, regular expressions (Regex) were used to extract the numeric portion of the formatted data in the fields and convert them to standard floating-point numbers (floats) to remove non-numeric characters and standardize their units. Second, there are many null values in thickness, composition, and year. These may be due to missing values, including incomplete history, different measurement methods, or missing data entry. In this regard, the removal of missing values and the rejection of outliers were used to reduce statistical bias. In the case of the thickness variable with a large number of missing values, the use of mean padding or regression prediction was also considered to supplement the data. But because of the low correlation and to ensure the accuracy of the data, the best way was to simply delete the missing data. In addition, the variable formats of the variables country and shape were standardized. Finally, extreme values in the data are identified by calculating the mean and standard deviation of weight, diameter, and thickness and eliminating outliers that deviate from the mean. The outliers are then eliminated using the three-sigma rule.
The cleaned dataset ensures standardization, consistency, and completeness of the numerical variables, providing a reliable database for studying international medal comparison, form–function relationships, material evolution, and historical trends.
3. Medal Characteristics Study
Changes in medal production are influenced by many factors, and time-series modeling of medal characteristics and analysis of their historical trends can help in understanding the evolution of socioeconomic factors. For example, the number of medals won by a country participating in a particular sporting event may be influenced by socioeconomic variables [5], population, unemployment rate [6], and education level [7]. Medals have evolved culturally to commemorate major historical events and represent notable achievements and national honors. Over time, medals from different historical periods have shown significant changes under the influence of materials, casting techniques, and the political policies and economic development of different countries.
3.1. Location and Type
To explore historical trends in global medal distribution, medal-related location data from Numista was analyzed and divided into 25-year periods. The graph below shows the percentage change in medal distribution for different countries from 1850 to 2025.
As observed in Figure 1, the proportion of medals issued by each location has changed over time. In 1850–1874, Algeria accounted for the largest proportion (44%), while the Austrian Empire had a smaller proportion (16%). By 1900–1924, the Austrian Empire had become the leading location, issuing 48% of all medals. Austria continued this trend, reaching its peak in 1950–1974, which accounted for 50% of all medals issued and was the top-ranking location during that period. Argentina ranked among the top five countries across all periods. It was the leading location in 1925–1949, accounting for 40.6%, but the proportion decreased afterward, accounting for 16.7%, 21.6%, and 17% in 1950–1974, 1975–1999, and 2000–2025, respectively. Australia reached its peak during 1925–1949, with 28.1% of medals issued. While its proportion decreased afterward, it remained among the top five, with 14.4% in 1975–1999 and 13.8% in 2000–2025.
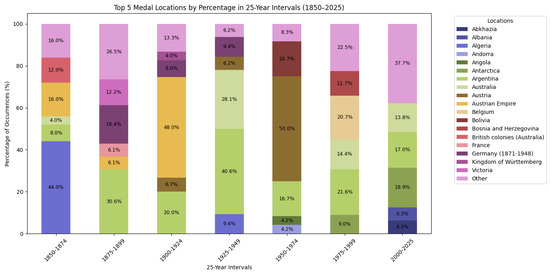
Figure 1.
Top 5 medal locations in 25-year periods (1850 to 2025).
In summary, during 1850–1874, Algeria was under French colonial rule, and its medals were issued primarily by the French Empire. This reflected that Algeria was significant in administrative and military activity within the French Empire [8]. The Austrian Empire issued many medals during 1900–1924, which were linked to World War I and its imperial history [9]. From 1950 to 1974, the increase in medals showed Austria’s efforts to rebuild its national identity and recognize contributions after World War II [10]. Argentina issued the most medals from 1925 to 1949. This was a time of economic growth and international participation in commemorative events. In subsequent decades, medal production decreased due to political instability and economic problems [11]. Finally, Australia’s peak in 1925–1949 was driven by World War II military honors under the British Imperial system. After 1950, production shifted to diverse-purpose medals, such as military, award, and achievement medals [12].
Next, the focus is on the types of medal-related data across 25-year periods. The graph below shows the percentage change in medal distribution for different types from 1850 to 2025.
From Figure 2, in 1850–1874, most medals were used in souvenir medals and commemorative medals, each representing 24%, followed by award medals at 20%. In 1875–1899, event tokens and award medals were the most produced, both at 37%. Confinement tokens led to medal usage in 1900–1924, followed by event tokens at 20%. In 1925–1949, commemorative medals became dominant again, accounting for 34%. During 1975–1999, this period saw the greatest variety of medal types. After 2000, most medals were used on fantasy items and paper exonumia.
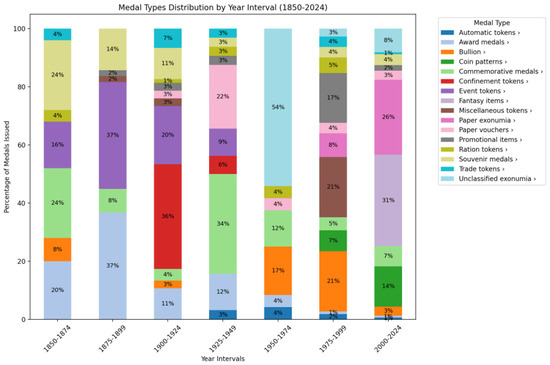
Figure 2.
Different types of medals in 25-year periods (1850 to 2025).
From this percentage change, it can be seen that medal production was mainly focused on commemorative and event tokens before 1950. People used medals to mark historical events, cultural milestones, and military achievements during this time. After 1950, medal production shifted to focus on trade bullion, miscellaneous tokens, promotional items, and fantasy items (increasing percentages). The rise in miscellaneous and fantasy tokens also increased due to the use of medals in advertising and marketing. Medal production is closely related to social needs and values during different periods [13,14].
3.2. Composition and Diameter
Composition and diameter are additional characteristics of medals. First, the discussion focuses on composition. The graph below shows the normalized percentage of medal compositions across different periods, displaying only the top five medal compositions by percentage.
From the graph in Figure 3, during 1850–1874, brass and silver were the leading compositions, both at 20.8%, followed by gold, copper, and bronze at 16.7%. In 1875–1899, silver, copper, and bronze accounted for more than 80% of medal production, with silver at 29.8%. Medals had more varied compositions in 1900–1924. Silver remained the leading composition at 23.9% during this time. From 1925 to 1949, bronze became the leading composition at 32.3%. Silver and paper each accounted for 22.6%. During 1950–1974, aluminum increased to almost 50%, followed by gold at 17.4%. From 1975 to 1999, gold increased to 21.8%, and copper–nickel became 18.8%. After 2000, medals contained the most diverse compositions, with paper and polymer both at 14.6%.
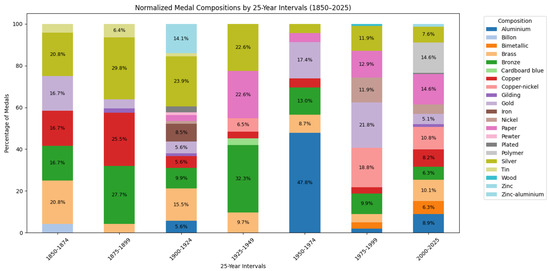
Figure 3.
Normalized medal compositions in 25-year periods (1850 to 2025).
Between 1850 and 1874, brass and silver were the main materials used for medals. The Industrial Revolution influenced this in terms of access to colonial resources [15]. From 1875 to 1899, silver, copper, and bronze became more common. This meant that people chose to use more practical and durable materials because of economic challenges during the economic depression. During 1900 and 1924, silver was still the most widely used material, despite a growing variety of options. This was due to resource disruptions during World War I and the importance of international competitions. From 1925 to 1949, bronze became the most popular material, and paper was increasingly used because of continued economic depression and World War II [16]. From 1950 to 1999, aluminum became the main material for medals due to its lightweight properties and low cost. New compositions like copper–nickel appeared, and gold became more commonly used again. After 2000, medals began to be made from a wider range of materials, including polymers and paper. The combination of traditional and durable compositions reflected global economic growth and technological advancements. The production of medals depended not only on the availability of metals in the production area but also on economic and technological changes [14].
Moreover, diameter is another characteristic of medals. The average diameters for four common compositions were analyzed over the years in 25-year periods, and the graph below was obtained.
From Figure 4, bronze had the largest average diameter among the four compositions before 1975. It peaked at 57 millimeters (mm) during 1875–1899, then decreased to 40 mm in 1900–1924. After 1924, bronze’s average diameter increased again, reaching 55 mm during 1950–1974. However, it declined after 1975, dropping to 29 mm by 2000–2025, making it the third-largest composition. Before 1975, brass had the smallest average diameter, staying between 20 and 25 mm with a slight increase. During 1975–1999, it grew to 48 mm, becoming the largest composition. After 2000, brass decreased again to 27 mm, making it the smallest composition. Silver’s average diameter remained stable, between 35 and 40 mm, except for a dip to 32 mm during 1950–1974. Its stability made it the leading composition during 2000–2025, with an average diameter of 37 mm. Copper stayed mostly between 25 and 35 mm but peaked at 39 mm during 1875–1899 and at 35 mm in 1975–1999. Its diameter decreased after 1924, then increased again in 1975–1999, before falling to 29.5 mm in 2000–2025.
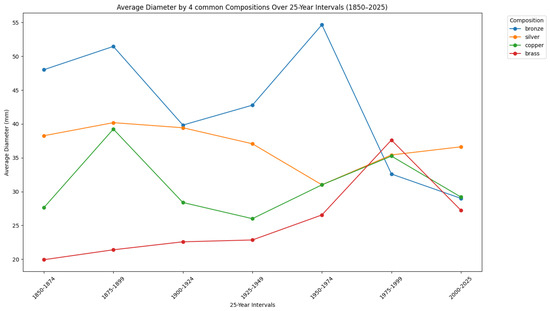
Figure 4.
Average diameter by 4 common compositions in 25-year periods (1850 to 2025).
After 1975, bronze declined because of rising material costs and substitutes. Brass, a cheaper alternative, grew in diameter during 1975–1999 but declined after 2000 as other materials replaced it. Silver’s stability made it dominant during 2000–2025. Copper peaked during industrial growth in 1875–1899 and 1975–1999 but declined after 2000 due to substitutes. This further proved that medal production reflected economic trends and the availability of resources because materials were chosen based on cost, stability, and industrial advancements [17].
3.3. Weight
For the weight variable, the data were grouped according to the year variable, and the mean weight and standard deviation of all medals in each year were calculated to measure the central tendency of the weights of the medals in different years and their fluctuation ranges. The mean medal weights were plotted to visualize the data, and a shaded area for variance was used to visually display the degree of fluctuation in the medal weights from year to year.
Then, the mean, median, and standard deviation were calculated for the weight variable. The mean was chosen to be used for further analysis. This is because the mean is a better indicator of overall trends and changes in medal weights over time than the median. While the median is stable, the mean is more sensitive to changes (including outliers) and more useful in understanding changes in design and production patterns. The results of this analysis in Figure 5 show that the average weight of medals was relatively low before the mid-19th century. This reflects the simpler designs and lighter materials of medals produced at that time due to poorer industrial production techniques. However, from the end of the nineteenth century to the beginning of the twentieth century, the weight of medals increased significantly. This may be related to the Industrial Revolution, the growth of openness to the outside world, and the expansion of colonies. Fluctuations in medal weights increased in the middle of the twentieth century. This may be attributed to resource shortages and economic restructuring caused by the two world wars, which led to large variations in medal weights from year to year during this period. Since the 1980s, the trend in medal weights has leveled off, and the standard deviation has decreased significantly. This indicates a gradual shift in the production of medals towards modern industrialized production methods and a greater degree of uniformity in specifications.
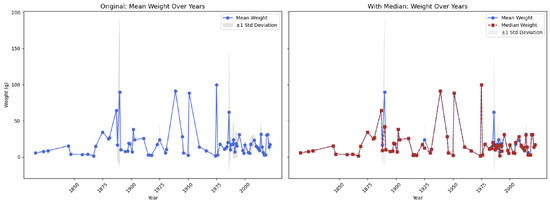
Figure 5.
Mean, median, and standard deviation weight of all medals over the years.
When identifying the top two countries by number of medals, it was found that Argentina and Australia had the highest number of medals in different periods. The average weight of all medals and their standard deviations at different times for these two countries were compared to assess the volatility of medal weight over time.
Figure 6 shows that Argentina’s medal weights fluctuated considerably in the late 19th and early 20th centuries, while Australia’s medal weights fluctuated considerably in the mid-to-late 20th century, especially between 1975 and 2000. This may be related to adjustments in medal manufacturing standards or changes in the materials used in Australian medals at that time.
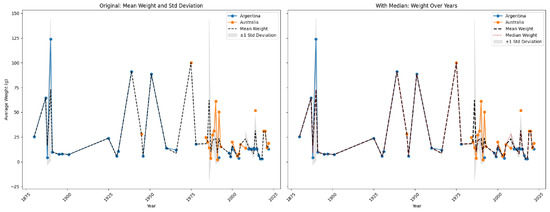
Figure 6.
Weight of medals in Argentina and Australia over years.
Hierarchical clustering analysis (HCA) was then performed on the weight of medals from Argentina and Australia. HCA is a statistical analysis method that can organize the medal features of Argentina and Australia into a multi-level hierarchy and group similar objects together for comparative analysis [18]. It can calculate Euclidean distance using Ward’s method to minimize intra-cluster variance. Figure 7 illustrates the dendrogram generated after hierarchical clustering using Ward’s method based on the physical characteristics of the Argentine and Australian medals. The x-axis represents the sample indices, and the y-axis represents the Euclidean distances at which the clusters were merged. The dendrogram reveals how individual medals are progressively grouped into larger clusters based on feature similarity. During the analysis, a horizontal cut at a distance of 10 determined the final number of clusters, resulting in two distinct groups, which are further analyzed in Figure 8.
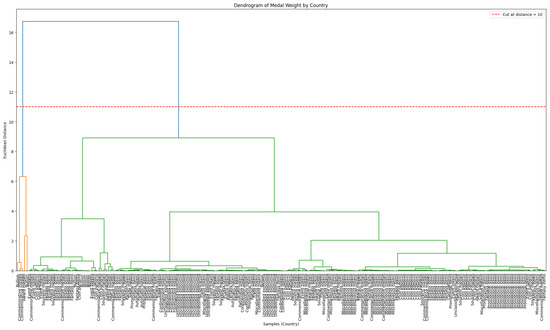
Figure 7.
Dendrogram of Argentina and Australia.
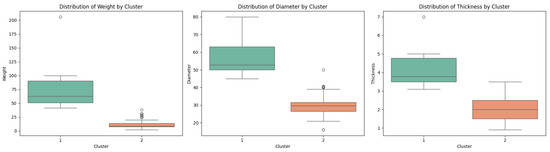
Figure 8.
Box plot of Argentina and Australia.
The dendrogram in Figure 7 indicates a clear grouping pattern of medals from Argentina and Australia. The clustering results are clearly divided into two main groups at a distance of about 10. The left side of the sample has a concentrated weight distribution and is presumed to be the Argentine medal (cluster 1), which shows a higher degree of consistency. This suggests that Argentine medals are more standardized and uniform in design and manufacture. The right sample, which has a wide range of weights and is presumed to be an Australian medal (cluster 2), shows more diversity. This reflects a greater variety of medal sources or production styles in Australia.
The box plot shown in Figure 8 further demonstrates the statistical distribution of the different clusters, revealing that Argentinian medals tend to be made of precious metals, while Australian medals are more lightweight and standardized, which may be related to the historical period, the demands of the events, and the development of manufacturing technology.
Figure 8 illustrates a box plot of the weight, diameter, and thickness distribution of the Argentine and Australian medals, grouped according to the hierarchical clustering results. The clustering is based on standardized physical characteristics of the medals, which we mentioned in Figure 7. Cluster 1 represented Argentina while cluster 2 represented Australia, which is the same as before.
In the weight distribution plot, cluster 1 medals are significantly heavier, with a median of about 65 grams and outliers of over 200 grams, while cluster 2 medals are much lighter, with a tight distribution below 20 grams. The diameter profiles show a similar pattern, with cluster 1 medals having a wider range of sizes and a higher median diameter (55 mm), while cluster 2 medals are more compact and clustered around 30 mm. These differences are further reinforced by the thickness profile: cluster 1 medals are generally thicker, while cluster 2 medals are thinner. These differences suggest that Argentina favors larger and heavier medal designs, while Australia tends to produce lighter, smaller, and thinner medals.
This session was analyzed with Argentina and Australia as representatives. However, these countries are not historically known for the mass production of medals. Major producing countries like the United Kingdom, France, Germany, China, Russia, and the United States have played an important role in medal production, but these countries were not included in the analysis because of limitations in the dataset. Data availability issues or gaps in the historical archive likely resulted in incomplete or sparse entries for these countries in the selected dataset. In contrast, Argentina and Australia had more consistent and complete records across years, making them suitable for longitudinal analysis. While this limits the global generalizability of findings, it ensures the analytical reliability of the available data.
4. Medal Analysis and Prediction: Pre- vs. Post-World War II (WWII)
4.1. Medal Composition Analysis
The analysis begins with medal composition. The common compositions for pre-WWII (before 1939) and post-WWII (after 1945) were analyzed, and the graph in Figure 9 below was obtained.
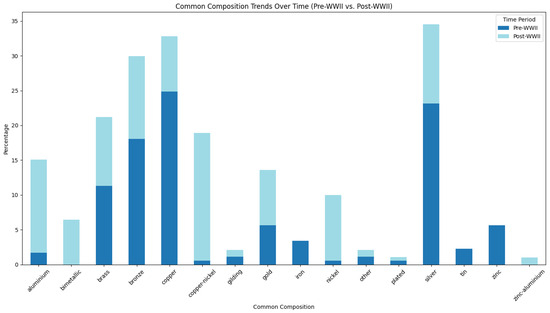
Figure 9.
Common composition trend in pre-WWII and post-WWII.
In general, copper and silver were the most common compositions used to produce medals in pre-WWII. Bronze, brass, and gold were widely used at that time. This means that people relied more on precious compositions due to traditional industries. In post-WWII, copper and silver were still the dominant compositions, with bronze increasing rapidly. Brass, copper–nickel, aluminum, gold, and nickel became more widely used. Aluminum, zinc–aluminum, copper–nickel, nickel, and bimetallic compositions showed significant growth compared to pre-WWII. People started considering using cost-effective compositions due to global economic challenges to substitute traditional ones in medals. Also, from a convenience perspective, these compositions allowed medals to be lighter and smaller.
In particular, a case study was selected for an in-depth analysis, and Argentina was chosen. Below is a graph in Figure 10 showing the composition trend in Argentina in pre-WWII and post-WWII:
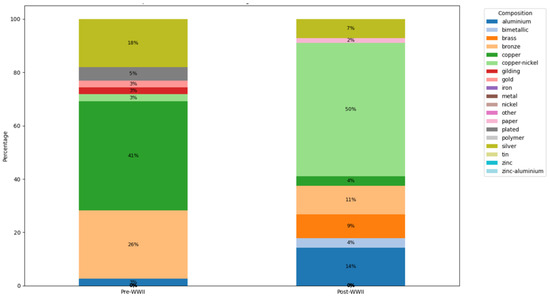
Figure 10.
Composition trend for Argentina in pre-WWII and post-WWII.
Copper and bronze were the leading compositions in pre-WWII, with 41% and 26%, respectively. Traditional compositions like silver were also widely used. However, in post-WWII, copper experienced a significant drop to only 4%, bronze dropped by 15%, and silver dropped by 11% compared to pre-WWII. Copper–nickel increased by 47%, becoming the dominant composition during this time. Aluminum also showed growth, increasing by 11%.
This case study further confirmed that medal composition in pre-WWII and post-WWII shifted from traditional materials to cost-effective and convenient alternatives, although traditional compositions remained important in medal production in both periods. The composition was influenced by global economic, industrial, and technological developments [17].
4.2. Machine Learning Models for Medal Classification
Now, the investigation focuses on how machine learning can be effectively applied to predicting medals. This idea involved predicting whether the medals belonged to pre-WWII or post-WWII. Logistic regression and random forest were chosen as classification models, using the column ‘Year’ to label pre-WWII and post-WWII. The whole dataset is used for both classification models, with an 80/20 split between training and testing subsets (80% for training and 20% for testing). To avoid biased folds where one class might dominate, stratified five-fold cross-validation is applied for model evaluation and to analyze different feature combinations. Three characteristics were selected as features: location, composition, and diameter. The following confusion matrices were obtained from the models using these three features—these are illustrated in Figure 11.
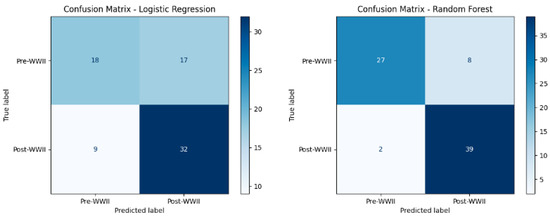
Figure 11.
Comparison of logistic regression and random forest confusion matrices.
For logistic regression, an accuracy of 66% was achieved for this prediction model, which performed moderately. Additionally, the accuracy for only pre-WWII was 51%, and for only post-WWII, it was 78%. On the other hand, for random forest, the accuracy for this model was 87%, which performed strongly. Also, the accuracy for only pre-WWII was 77%, and for only post-WWII, it was 95%. This means that both prediction models perform better in identifying post-WWII medals.
Next, an attempt was made to determine which feature was the least important for the models. This was tested using only two features simultaneously, resulting in three combinations. The results are summarized in Table 1.

Table 1.
Accuracy of logistic regression and random forest.
From these results, composition is the least important feature, and the best combination is location and diameter for both prediction models. Moreover, random forest is the preferred model for predicting whether medals are pre-WWII or post-WWII using these three features.
5. Discussion and Concluding Remarks
This paper seeks to explore the evolution of medal production from 1850 to 2025, focusing on the characteristics of medal production location, type, composition, diameter, and weight. The mean is mainly used in this research to analyze the overall trends in medal characteristics since no significant outliers would affect the results. Moreover, 25-year intervals were chosen to better observe and analyze the trends.
From the time-series analysis of location, the dominance of medal production has changed over time. The political and economic backgrounds are the main factors affecting different locations. This change also reflects the shift in cultural influence and national identity since medal production is based on countries’ histories or politics. From the analysis of medal types, medals have changed from mainly commemorative and event purposes to having multiple purposes. This shift reflected the transition from historical commemorative items to economic consumer goods, which was caused by industrial development, advertising promotion, and social needs. It also indicates a shift from collective, country recognition to more diverse and personal forms of achievement and reward. Similarly, medal weight has also changed over time. During the early Industrial Revolution, heavy medals were commonly used. However, by the 1980s, medal weights became stable due to modern industrial production improvements. This trend demonstrates that medal production is more focused on efficiency, accessibility, and appeal. From the analysis of medal composition and diameter, before 1950, traditional compositions dominated because medal production relied on traditional industries and precious metals. After the war, due to industrial development and economic challenges, the demand for cost-effective alternatives in medal production increased. This reflects a societal move toward more practical and affordable production, influenced by post-war recovery and modernization.
Machine learning models such as random forest and logistic regression were used to analyze medals before and after World War II in terms of three features: location, composition, and diameter. The results showed that the random forest model performed better than the logistic regression model. Both models were better for predicting medals after World War II. Among them, location and diameter features were more important in the feature combination for the prediction model. This shows that by extracting the characteristics of cultural relics, it is possible to predict the production period of cultural relics through machine learning.
However, this study also has limitations. The medal data only comes from Numista under the medal category. Some medals are also categorized under the coin category in Numista, but we did not include them in this research, resulting in the exclusion of many key countries like the United States and the United Kingdom. This study may therefore be limited in scope, and it may not represent global medal production. In addition, the sample size was not large enough, and features such as design patterns and production technology were not analyzed, which may be biased. Despite the limitations, the current dataset still covers a diverse range of medals across periods and locations, providing valuable insights into medal production. Future research will expand the data source, including the medals from the coin category and more medals such as awards and military medals, to improve the data’s generalizability. By using different machine learning models in the future, more characteristics of medals can be used to improve accuracy in predicting the production period of medals.
To summarize, from the production of medals, these research results help to gain a better understanding of how culture, economics, and technology have changed in the past 175 years. Medals’ characteristics through machine learning models provide insight into the evolution of material culture, demonstrating that medals are important evidence for understanding global change over time and for exploring artifact history. Beyond their physical features, medals also reflect social values such as what societies choose to commemorate and reward. It shifts from honoring collective achievements and historical events to recognizing individual accomplishments and public contributions. This paper also provides a direction for studying the characteristics of historical artifacts.
Author Contributions
M.L., Y.G. and E.P. contributed equal effort. All authors have read and agreed to the published version of the manuscript.
Funding
This research was conducted without any external funding. All aspects of the study, including design, data collection, analysis, and interpretation, were carried out using the resources available within the authors’ institution.
Institutional Review Board Statement
Not applicable.
Informed Consent Statement
Not applicable.
Data Availability Statement
All relevant data, Python codes for analysis, and detailed annual tables and graphs are available at https://drive.google.com/drive/folders/1FIMUc3emqHJ9ATzOWV-8DAUV4ga8Aq6A?usp=sharing (access on 30 July 2025).
Acknowledgments
The authors would like to thank the Metropolitan College of Boston University for their support.
Conflicts of Interest
The authors declare no conflicts of interest.
References
- Aygün, M.; Savaş, Y. Analysing Winter Olympic Medals Through Economic Variables: A Comprehensive Examination. Res. Sport Educ. Sci. (Online) 2024, 26, 197–209. [Google Scholar] [CrossRef]
- Andreff, W. Economic development as major determinant of Olympic medal wins: Predicting performances of Russian and Chinese teams at Sochi Games. Int. J. Econ. Policy Emerg. Econ. 2013, 6, 314–340. [Google Scholar] [CrossRef]
- Forrest, D.; McHale, I.G.; Sanz, I.; Tena, J.D. An analysis of country medal shares in individual sports at the Olympics. Eur. Sport Manag. Q. 2017, 17, 117–131. [Google Scholar] [CrossRef]
- Shen, X.; Xu, C. Visual analysis of the distribution characteristics and influencing factors of Olympic medals. In Proceedings of the 2022 IEEE 5th Advanced Information Management, Communicates, Electronic and Automation Control Conference (IMCEC), Chongqing, China, 16–18 December 2022; Volume 5, pp. 1633–1637. [Google Scholar] [CrossRef]
- Johnson, D.K.N.; Ali, A. A Tale of Two Seasons: Participation and Medal Counts at the Summer and Winter Olympic Games. Soc. Sci. Q. 2004, 85, 974–993. [Google Scholar] [CrossRef]
- Vagenas, G.; Vlachokyriakou, E. Olympic medals and demo-economic factors: Novel predictors, the ex-host effect, the exact role of team size, and the “population-GDP” model revisited. Sport Manag. Rev. 2012, 15, 211–217. [Google Scholar] [CrossRef]
- Noland, M.; Stahler, K. What Goes into a Medal: Women’s Inclusion and Success at the Olympic Games. Soc. Sci. Q. 2016, 97, 177–196. [Google Scholar] [CrossRef]
- Evans, M. Algeria: France’s Undeclared War; Making of the Modern World; Oxford University Press: Oxford, UK, 2012; pp. 7–147. [Google Scholar]
- Judson, P.M. The Habsburg Empire: A New History; Harvard University Press: Cambridge, MA, USA; London, UK, 2016; pp. 333–441. [Google Scholar] [CrossRef]
- Steininger, R.; Bischof, G.; Gehler, M. (Eds.) Austria in the Twentieth Century; Studies in Austrian and Central European History and Culture; Transaction Publishers: Piscataway, NJ, USA, 2002. [Google Scholar]
- Romero, L.A.; Brennan, J.P. A History of Argentina in the Twentieth Century; The Pennsylvania State University Press: University Park, PA, USA, 2013; pp. 28–386. [Google Scholar]
- Macintyre, S. A Concise History of Australia, 5th ed.; Cambridge Concise Histories; Cambridge University Press: Cambridge, UK, 2020. [Google Scholar]
- Alpert, S.P.; Elman, L.E. Tokens and Medals: A Guide to the Identification and Values of United States Exonumia, 1st ed.; Stephen P. Alpert: Los Angeles, CA, USA, 1992. [Google Scholar]
- Appadurai, A. (Ed.) The Social Life of Things: Commodities in Cultural Perspective; Cambridge University Press: Cambridge, UK, 1988. [Google Scholar]
- Stearns, P.N. The Industrial Revolution in World History, 3rd ed.; Westview Press: Boulder, CO, USA, 2007; pp. 21–91. [Google Scholar]
- Sommerville, D.; Westwell, I. The Complete Illustrated History of the First & Second World Wars: With More Than 1000 Evocative Photographs, Maps and Battle Plans; Lorenz Books: London, UK, 2017. [Google Scholar]
- Arndt, N.T.; Ganino, C. Metals and Society: An Introduction to Economic Geology, 1st ed.; Springer: Berlin/Heidelberg, Germany, 2012. [Google Scholar] [CrossRef]
- Holmes, D.E.; Jain, L.C. Data Mining: Foundations and Intelligent Paradigms Volume 1: Clustering, Association and Classification, 1st ed.; Intelligent Systems Reference Library, 23; Springer: Berlin/Heidelberg, Germany, 2012. [Google Scholar]
Disclaimer/Publisher’s Note: The statements, opinions and data contained in all publications are solely those of the individual author(s) and contributor(s) and not of MDPI and/or the editor(s). MDPI and/or the editor(s) disclaim responsibility for any injury to people or property resulting from any ideas, methods, instructions or products referred to in the content. |
© 2025 by the authors. Licensee MDPI, Basel, Switzerland. This article is an open access article distributed under the terms and conditions of the Creative Commons Attribution (CC BY) license (https://creativecommons.org/licenses/by/4.0/).