Abstract
Video games, especially competitive ones such as Dota 2, have gained great relevance both as entertainment and in e-sports, where predicting the outcome of games can offer significant strategic advantages. In this context, machine learning (ML) is presented as a useful tool for analysing and predicting performance in these games based on data collected before the start of the games, such as character selection information. Thus, in this work, we have developed and tested ML models, including Random Forest and Gradient Boosting, to predict the outcome of Dota 2 matches. This study is innovative in that it incorporates explainability techniques using Shapley Additive Explanations (SHAP) graphs, allowing us to understand which specific factors influence model predictions. Data extracted from the OpenDota API were preprocessed and used to train the models, evaluating them using metrics such as accuracy, precision, recall, F1-score, and cross-validated accuracy. The results indicate that predictive models, particularly Random Forest, can accurately predict game outcomes based only on pregame information, also suggesting that the explainability of machine learning techniques can be effective for analysing strategic factors in competitive video games.
1. Introduction
Over the last decade, Multiplayer Online Battle Arena (MOBA) video games have emerged as a dominant force in the digital entertainment industry, capturing the attention of millions of gamers around the world. Among these, Dota 2, developed by Valve Corporation, has established itself as one of the most iconic and competitive titles of the genre. MOBA games, characterized by matches in which teams of players control heroes with unique abilities, facing each other in arenas with the goal of destroying the enemy’s base, have revolutionized the way video games are conceived and enjoyed.
The popularity of Dota 2 is reflected not only in its vast player base, but also in its economic and cultural impact. As of 2023, Dota 2 has maintained a monthly active player base of approximately 7.6 million and has recorded a peak concurrent player base of around 1.3 million [1].
Score prediction in MOBA video games such as Dota 2 and League of Legends is not only a technical challenge, but also an opportunity to leverage advances in AI to improve the gaming experience, strategy development, and competitiveness in e-sports.
In Dota 2 (see Figure 1), two teams of five players each compete to destroy the opponent’s base. One of the most critical phases of the game is character (hero) selection. Players can choose from 138 available characters, and each hero has four unique abilities that can influence the dynamics of the game. Thus, the strategic selection of heroes is fundamental to establish a competitive advantage, even before the game starts. Moreover, the effective selection of heroes can be complemented by analysing the performance of the team in the early, mid-, and late-game stages. Given the big amount of possible heroes, their abilities and progression trees, and the huge number of possible combinations, the prediction of combat results based on the selection of these characters would be quite complex but very relevant for Dota 2 players. Considering other in-game metrics for carrying out such forecasting (such as the number of frags/kills, own team deaths, collected gold, or reached experience) would be more variable and, thus, less robust. This fact would make it less useful to adapt combat strategies than a prior-to-game outcome like the one proposed here.
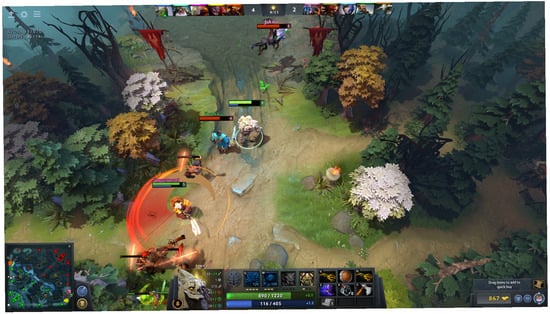
Figure 1.
Dota 2 game screenshot.
The goal of this study is not only to discuss how machine learning models can be used to predict game outcomes in this scope, but also to introduce explainable AI (XAI) techniques [2] as an innovative element. While many predictive models in the field of video games focus exclusively on improving the accuracy of predictions, this paper puts special emphasis on the interpretability of the models, allowing us to understand what factors or variables have a higher influence on the predictions. Incorporating explainability not only helps to identify the reasons behind a win or loss, but also allows players, developers, and game designers to gain valuable insight into the behaviour of the model, facilitating a deeper understanding of game dynamics and fostering confidence in the predictions generated.
The rest of the paper is structured as follows: after the state of the art is described in Section 2, the methodology used is described in Section 3, followed by a presentation of the experiments and a discussion of the results obtained in Section 4. Finally, conclusions and future work are presented in the last section.
2. State of the Art
The use of machine learning (ML) for game prediction in video games is an active and expanding area of research, especially relevant in e-sports and competitive online games. The state of the art in this field focuses on models capable of predicting the outcome of matches [3], anticipating player behaviour and improving the game experience through real-time recommendations [4].
In team games, such as League of Legends (LoL), Dota 2, and Counter-Strike, the use of supervised models, such as Neural Networks [5] and decision trees, has been investigated to predict the outcome of a game based on variables such as individual player performance [6], team composition, and game context [7]. Tools such as Gradient Boosting and Random Forest models have shown accuracy in analysing these multiple variables. These models are often trained on large historical data sets and allow predictions to be obtained before the end of the game. Deep Learning models, such as Convolutional Neural Networks (CNNs) and Recurrent Neural Networks (RNNs), are also used to analyse player behaviour patterns and visual game features. In games such as StarCraft II, these models process large volumes of spatial and temporal data to identify common and predictive strategies to anticipate moves and outcomes [8].
On the other hand, real-time prediction of the outcome of a game as it unfolds uses time series methods and Recurrent Neural Networks (RNNs) or LSTM (Long Short-Term Memory) [9]. These models capture the temporal evolution of events in the game, such as kills, objectives taken, and changes in gold and experience perks.
In the context of video games, reinforcement learning (RL) has been a powerful tool not only for predicting outcomes, but also for optimizing strategies. RL algorithms, such as Deep Q-Learning and Actor–Critic models, have enabled agents to learn optimal behaviours in complex games, which can then be applied to predict human performance or improve game design [10,11,12]. OpenAI and DeepMind have made advances in predicting and optimizing gameplay in complex games such as Dota 2 and StarCraft II [13,14].
Finally, to better understand player behaviour and foretell their performance, prediction models are applied based on individual game characteristics, win/loss history, and skill level [15]. In multiplayer online games, it is common to use clustering and segmentation models to group players according to behavioural patterns to predict their performance and preference [16]. This is useful for early detection of unusual behaviour that may indicate cheating or abandonment [17].
Current models face significant challenges, such as a lack of explainability, which limits our ability to understand how they make decisions and what factors influence their predictions. This lack is critical, as many machine learning models operate as “black boxes,” where their results are accurate but incomprehensible to users [18]. The lack of explainability makes it difficult to identify potential biases, validate results, and gain user confidence in automated decisions, especially in high-impact areas such as medicine, justice, and economics [19]. In the context of video games, the absence of explainability prevents understanding how a model predicts the outcome of a game, limiting learning and strategy optimization by players and developers [20].
As stated, most of the existing works have focused on the prediction of combat outcomes considering both historical results and in-game metrics, computed mainly in the early game stage. The present study focuses on prediction based on information that can be extracted from the selection stage (prior to the game), which we argue could yield more robust predictions. Moreover, our novel approach relies heavily on the application of XAI techniques to justify the prediction, adding more information for expert players.
3. Methodology
The approach used in this work is based on analysing Dota 2 game data, collected from real matches. These data will be used to train machine learning models that can predict the outcome of a game just based on hero selection.
The key steps followed are shown below:
- Data extraction and preprocessing: Use of the OpenDota API to extract game data, analysing hero selections, and labelling games as wins or losses.
- Model training: Use of logistic Regression models, Random Forest, and Gradient Boosting models and evaluation of models using cross-validation techniques and performance metrics such as precision, recall, and F1-score.
- Comparison of parameter configurations: Automatic training and evaluation of models with different parameter configurations to identify the optimal configuration.
- Visualization of Results: Generation of graphs to compare the performance of different models and configurations and use of SHAP graphs to better understand how the model works and which variables are more relevant for the prediction.
3.1. Dataset Composition
As aforementioned, the OpenDota API (https://www.opendota.com/ (accessed on 1 November 2024)) was used to collect the dataset used in this study. This open source platform provides access to detailed OpenDota 2 game data. The available data included information from a variety of line items, such as
- Identifiers of the players;
- Selected heroes;
- Game statistics (kills, assists, gold, etc.);
- Game results (victory or defeat).
The OpenDota API allows queries to be performed via HTTP requests. For example GET/api/matches/{match_id} will obtain the full details of a specific match. Once the list of matches is known, one could select those that are interesting for the study.
After data collection and curation, the final dataset contains 4500 rows, each one composed of 11 columns: 5 with the IDs of radiant heroes (those belonging to player 1), 5 with the IDs of dire heroes (those belonging to player 2), and a column indicating 0 for radiant victory or 1 for dire victory. The IDs are categorical values.
3.2. Predictive Models Considered
Several machine learning models were implemented (by means of the Scikit-learn library) for the prediction of game outcomes in Dota 2. The models used include the following:
- Logistic Regression: A linear model that is commonly used for binary classification problems [21].
- Random Forest: A set of decision trees that improves accuracy by combining multiple trees [22].
- Gradient Boosting: A boosting method that creates robust prediction models by combining several weak models [23].
The parameters used in the models are as follows: The maximum number of iterations of the Logistic Regression has been set to 1000. In Random Forest, the number of estimators has been set to 100, and no maximum depth has been used. In the case of Gradient Boosting, the learning rate has been set to 0.1 and the number of estimators to 100.
Finally, as far as the evaluation is concerned, the Train/Test split (80% and 20%, respectively) and cross-validation methods were used.
3.3. Evaluation and Explainability of the Models
Model evaluation was performed using standard classification metrics, namely
- Accuracy: Proportion of correctly predicted instances out of the total instances;
- Precision: Proportion of correctly predicted positive instances out of all predicted positives;
- Recall: Proportion of correctly predicted positive instances out of all actual positives;
- F1-score: Harmonic average between precision and recall.
These metrics allow for a comprehensive evaluation of model performance in predicting game outcomes. In all the cases, the higher value, the better the model performance.
We have also computed the area under the curve (AUC), which refers to the area under the ROC curve. It measures a classification model’s ability to distinguish between positive and negative classes. Here, the models should decide between victories from one team or the other. Values close to 1 mean good classification rates, while those close to 0.5 mean random decisions.
In machine learning, model explainability is an essential feature that allows us to understand how and why a model makes certain decisions. This ability is important, not only to gain the trust of end users, but also to detect possible biases, improve model performance and comply with legal regulations. The next section details the tools used in this work to increase the models’ explainability and understandability.
For complex models such as Random Forest or Gradient Boosting, the predictions are not trivial to interpret due to their black box nature. Therefore, interpretability tools such as SHAP are used.
SHAP (SHapley Additive exPlanations) is a powerful method that helps interpret machine learning models by providing local and global explanations of model predictions. SHAP is based on the Shapley values of game theory, assigning each feature a specific importance or contribution to the prediction made by the model. This method allows one to decompose the prediction into parts attributable to each of the features, facilitating the understanding of the model’s behaviour [24].
3.4. Interpretation of SHAP Values
SHAP values represent the contribution of each feature to a specific prediction. In practical terms, a positive SHAP value indicates that a feature has contributed positively to the outcome of the prediction (increasing the probability of the outcome), while a negative value indicates a negative contribution (reducing the probability of the outcome).
According to [24], in order to correctly interpret a graph of SHAP values, the following aspects should be considered:
- Feature importance: SHAP values allow one to identify which features are more important for the model. A larger range of SHAP values for a specific feature implies a greater influence of this feature on the predictions.
- Positive or negative contribution: The colours and position in the chart indicate whether a feature contributes positively or negatively to a prediction. For example, in a SHAP summary chart, dots in red indicate features with a high value (in this case, this would indicate cases where a certain hero has been selected), while dots in blue indicate features with a low value, i.e., a certain hero has not been selected. The position on the horizontal axis shows whether this contribution is positive or negative to the outcome.
- Distribution of effects: The dispersion of the points on the horizontal axis indicates the variability in the importance of the feature for different predictions. A larger dispersion suggests that the feature has varying impact in different cases.
The use of SHAP in this work provides a clear picture of which selected or unselected heroes have the most influence on which team wins. The information obtained can allow players and coaches to understand the reasons behind the model’s decisions, making it easier to use and understand the strategies obtained.
4. Results
In this section, we describe the dataset and show and explain the results of the three machine learning methods compared, also presenting an analysis of the explainability.
4.1. Dataset Analysis
In this section, the dataset features are analysed in order to provide a clear landscape of their nature and perhaps better explain the results obtained regarding the predictions.
First of all, the distribution of victories in the dataset is 60% for radiant teams and 40% for dire teams.
As can be seen in Figure 2a,b, there are heroes that coincide as the most used in both the dire and radiant teams. Specifically, the hero with ID 14 is the most used. This makes sense, since this hero is Pudge, one of the most iconic characters in the game and the hero with the most games played.
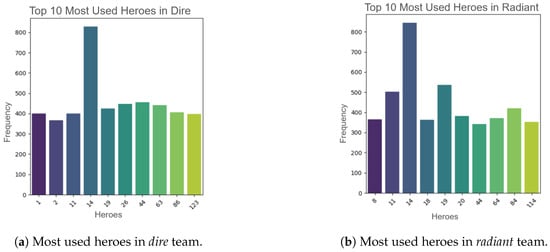
Figure 2.
Comparison of most used heroes in dire and radiant teams.
At the same time, as Figure 3a,b show, there are also coincidences in the least played heroes: in both cases the heroes with IDs 65, 131, and 135 are among the least played in each team. This means that, regardless of the team, there are heroes that tend to be less played, and this may be due to several factors, such as the fact that, in the current version and metagame [25], these heroes are not the most suitable to win the game, and due to the difficulty of controlling these heroes and how risky it is to play as them in the correct way, players tend to choose them less frequently.
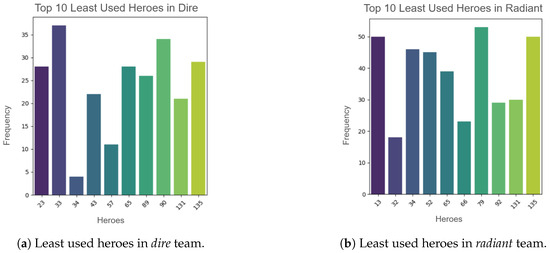
Figure 3.
Comparison of least used heroes in dire and radiant teams.
4.2. Results of the Machine Learning Algorithms
A summary of the results obtained in the experiments with the Random Forest, Gradient Boosting and Logistic Regression machine learning models is presented in Table 1.

Table 1.
Summary of results for the ML algorithms.
The Random Forest model shows exceptional performance in predicting wins. The accuracy obtained in both the Train/Test split and the cross-validation is over 98%, indicating that the model is able to generalize the results very well. This is also reflected in Figure 4a, where an area under the curve (AUC) of 1.00 is obtained, meaning that the model is able to correctly predict, in all cases, which team will win.
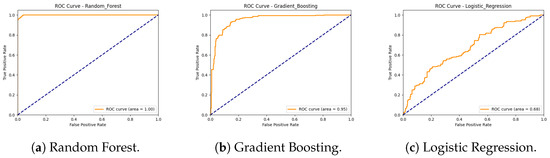
Figure 4.
ROC curves.
As shown in Table 1, the Gradient Boosting model, while not reaching the accuracy of Random Forest, offers a solid performance, with an accuracy of approximately 89%. We can also see that the cross-validated Accuracy of 0.8653 indicates that the model performance is stable and does not suffer from overfitting.
In Figure 4b, we can see that it has an AUC of 0.95; this shows that it is a very capable model in predicting which team will win, although not as accurately as the Random Forest model.
Finally, as can be seen in Table 1, the Logistic Regression model shows inferior performance, with an accuracy of around 65%, indicating that this model is less effective overall in predicting wins compared to the other methods. This can be seen in Figure 4c, where it is shown that the model is able to correctly predict around 68% of the cases.
However, these results should be taken with a grain of salt. Dota 2 is very difficult to master, and hundreds of events occur during the game that can make one team or the other win, so it is very difficult to predict at this level of accuracy just from the heroes selected. We believe that the dataset available on the web may be biased in some way, for example, from the games of skilled players, specific gameplay strategies, or even due to wins generated by using bots.
Moreover, 4500 samples may not generalize across all skill levels or meta contexts (e.g., bots, smurfs, patches, etc.), and future works should consider team synergies, hero counters, and/or role alignment.
It is important to note that the focus of this article is not mainly the results of these methods, but rather the analysis of explainability, as described in the next section.
4.3. Analysis of the SHAP Results
As previously stated, SHAP (SHapley Additive exPlanations) plots provide a visual representation of the features that have most influenced the predictive models tested. In this study, SHAP charts have been used to analyse the importance of the features in the Logistic Regression, Random Forest, and Gradient Boosting models, showing the five most influential features in each case, in order to see which were the five heroes that most influenced the model in predicting a win for the team.
The results of the SHAP graph analysis reveal the heroes that have the most influence in predicting the outcome of a game of Dota 2. These features represent the heroes chosen during the selection phase, and the magnitude of their influence is determined by the impact they have on the model’s prediction of victory or defeat.
For the Random Forest model, as can be seen in Figure 5, heroes 9 (Mirana), 4 (Bloodseeker), 6 (Drow Ranger), 5 (Crystal Maiden), and 8 (Juggernaut) are the most significant determinants of the predictions. This model, which combines multiple decision trees, shows a greater ability to capture non-linear interactions between heroes. In particular, for team radiant (0) selecting hero 4 helps the team win, while the contrary happens with hero 5, that is, not selecting Cristal Maiden is better if we want to win.
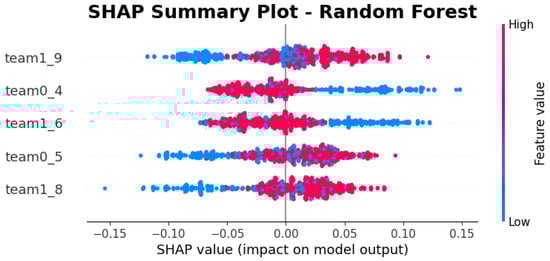
Figure 5.
SHAP values of the 5 heroes with the greatest impact on the Random Forest model.
The SHAP analysis for the Logistic Regression model, shown in Figure 6, reveals that the selected heroes 4 (Bloodseeker), 6 (Drow Ranger), 9 (Mirana), 11 (Shadow Fiend), and 7 (Earthshaker) have the greatest influence on the prediction of the outcome of the game. For example, for the radiant (0) team, not selecting heroes 4 and 11 will make their team lose, and vice versa. For team dire (1), choosing 6 will make them lose, while the contrary happens if they pick 9. This graph shows the samples forming a vertical line because of the linear nature of the model: each feature’s contribution is perfectly proportional to its deviation from the mean, leading to a consistent vertical spread in the SHAP summary plot.
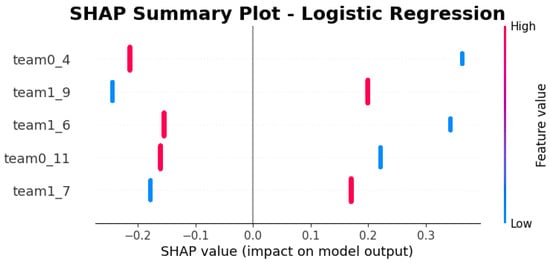
Figure 6.
SHAP values of the 5 heroes with the greatest impact on the Logistic Regression model.
Finally, in the case of the Gradient Boosting model, we can see that Figure 7 points out that heroes 4 (Bloodseeker), 11 (Shadow Fiend), 8 (Juggernaut), and 7 (Earthshaker) are the most influential, according to the SHAP graphs. Gradient Boosting, which builds sequential decision trees to optimize performance, identifies heroes 4, 11, 8, and 7 as a good pick for team radiant (0). Hero 7 is also a good option for team dire (1).
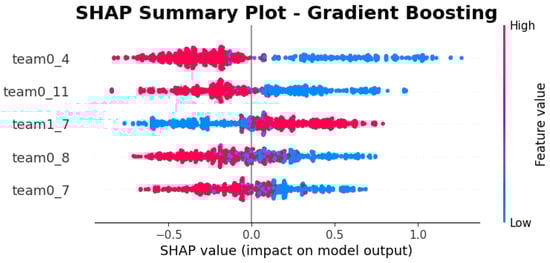
Figure 7.
SHAP values of the 5 heroes with the greatest impact on the Gradient Boosting model.
Comparing the SHAP chart results between the three models, some key insights in the importance attributed to the selected heroes can be identified. For example, the five more relevant features in the three methods are limited to only 7 heroes from a rooster of more than 100, even if some of these heroes are not in the most used group in both teams. In general, selecting or not selecting a relevant hero always has an impact (that is, no samples are grouped around the 0.0 value in the graphs but distributed from negative to positive impact). All methods agree that team 0 choosing hero 4 is one of the features that most contributes to predicting a win, while some other features present in one model do not have the same impact in others. It is worth mentioning that no contradictions where found either.
Another comparison we can make relates to the dispersion of SHAP values in each model. The Logistic Regression SHAP plots show less dispersion in values due to the linear nature of the model, where each characteristic has a constant weight that assigns a fixed influence, independent of other characteristics. In contrast, the Gradient Boosting and Random Forest models show greater dispersion in SHAP values. The dispersion reflects how the influence of each feature on the prediction can vary between instances, depending on complex interactions and non-linear relationships.
It is important to note that in linear models without interactions, as in the case of the Linear Regression model, SHAP plots only show the effects of variables with two possible values. On the contrary, when there are more interactions between the characteristics of the model, these graphs can show more complex effects. This complexity appears as a vertical scatter in the graphs, which may indicate that the impact of a variable does not depend only on the value it has, but on the value of other variables, showing non-linear relationships between the variables [26].
The greater dispersion of SHAP values for the Gradient Boosting and Random Forest models provides a more detailed understanding of when and how each feature is important, allowing for the detection of non-linear interactions and capturing complex patterns in the data. This interpretive complexity comes with greater model flexibility and often better predictive performance compared to Logistic Regression, which offers simpler interpretations but may not capture complex patterns.
5. Conclusions
In this paper, we have explored the possibility of predicting the outcome of Dota 2 games based solely on character selection prior to the start of the game. We used three machine learning algorithms, namely Logistic Regression, Random Forest, and Gradient Boosting, and trained them on historical data obtained through the OpenDota API from real matches on the game.
The results of the trained models indicate that character selection has a significant impact on the outcome of games, validating the hypothesis that the selection phase is a critical factor in determining success in Dota 2.
Regarding the performance of the compared models, Random Forest demonstrated superior performance in terms of accuracy, recall, and F1-Score, followed by Gradient Boosting and then Logistic Regression. This finding suggests that more complex and non-linear models are more effective in capturing the relationship between hero selection and game outcome.
However, despite the positive results, this study has some limitations. One of the main ones is that the model is based only on hero selection, without considering other dynamic variables that occur during the game, such as real-time strategic decisions, individual player skill, and in-game events. These variables will be addressed in future work.
The results of this study lead us to think that similar methodologies could be applied in the future to other video games and e-sports, integrating additional contextual variables to improve prediction accuracy and optimize pre-game strategic decision making.
Author Contributions
Conceptualization, P.G.-S. and A.M.; methodology, J.L.-R. and P.A.C.; software, J.L.-R.; validation, J.L.-R. and P.A.C.; writing—review and editing, P.G.-S., A.M., and P.A.C.; supervision, P.G.-S.; project administration, P.G.-S. and P.A.C.; funding acquisition, P.G.-S. All authors have read and agreed to the published version of the manuscript.
Funding
This research was funded by the Ministerio Español de Ciencia e Innovación under project numbers PID2023-147409NB-C21 funded by MICIU/AEI/10.13039/501100011033.
Institutional Review Board Statement
Not applicable.
Informed Consent Statement
Not applicable.
Data Availability Statement
The original contributions presented in this study are included in the article. Further inquiries can be directed to the corresponding author.
Conflicts of Interest
The authors declare no conflicts of interest.
References
- Bursztein, E. I am a legend hacking hearthstone using statistical learning methods. In Proceedings of the Computational Intelligence and Games Conference, Santorini, Greece, 20–23 September 2016; IEEE: New York, NJ, USA, 2016. [Google Scholar]
- Arrieta, A.B.; Rodríguez, N.D.; Ser, J.D.; Bennetot, A.; Tabik, S.; Barbado, A.; García, S.; Gil-Lopez, S.; Molina, D.; Benjamins, R.; et al. Explainable Artificial Intelligence (XAI): Concepts, taxonomies, opportunities and challenges toward responsible AI. Inf. Fusion 2020, 58, 82–115. [Google Scholar] [CrossRef]
- Gutiérrez, J.A.G.; Ordoñez, C.R.H.; Flores, M.A.V.; Zenteno, M.A.Z. Predicción de victoria en videojuego competitivo con Deep Learning. Res. Comput. Sci. 2022, 151, 47–57. [Google Scholar]
- Ontañón, S.; Synnaeve, G.; Uriarte, A.; Richoux, F.; Churchill, D.; Preuss, M. A Survey of Real-Time Strategy Game AI Research and Competition in StarCraft. IEEE Trans. Comput. Intell. AI Games 2013, 5, 293–311. [Google Scholar] [CrossRef]
- Silva, A.L.C.; Pappa, G.L.; Chaimowicz, L. Continuous Outcome Prediction of League of Legends Competitive Matches Using Recurrent Neural Networks. In Proceedings of the XVII SBGames, Foz do Iguacu, PR, Brazil, 29 October–1 November 2018. [Google Scholar]
- Do, T.D.; Wang, S.I.; Yu, D.S.; McMillian, M.G.; McMahan, R.P. Using Machine Learning to Predict Game Outcomes Based on Player-Champion Experience in League of Legends. In Proceedings of the FDG’21: The 16th International Conference on the Foundations of Digital Games 2021, Montreal, QC, Canada, 3–6 August 2021; Fowler, A., Pirker, J., Canossa, A., Arya, A., Harteveld, C., Eds.; ACM: New York, NY, USA, 2021; pp. 47:1–47:5. [Google Scholar] [CrossRef]
- Santos, J.M. Counter Strike Matches Result Prediction. 2020. Available online: https://github.com/jefersonmsantos/counter_strike/blob/master/machine_learning_model/Machine%20Learning%20prediction%20model.ipynb (accessed on 28 February 2025).
- Baek, I.; Kim, S.B. 3-Dimensional convolutional neural networks for predicting StarCraft results and extracting key game situations. PLoS ONE 2022, 17, e0264550. [Google Scholar] [CrossRef] [PubMed]
- Junior, J.B.S.; Campelo, C.E.C. League of Legends: Real-Time Result Prediction. arXiv 2023, arXiv:2309.02449. [Google Scholar] [CrossRef]
- Mnih, V.; Kavukcuoglu, K.; Silver, D.; Rusu, A.A.; Veness, J.; Bellemare, M.G.; Graves, A.; Riedmiller, M.A.; Fidjeland, A.; Ostrovski, G.; et al. Human-level control through deep reinforcement learning. Nature 2015, 518, 529–533. [Google Scholar] [CrossRef] [PubMed]
- Schulman, J.; Wolski, F.; Dhariwal, P.; Radford, A.; Klimov, O. Proximal Policy Optimization Algorithms. arXiv 2017, arXiv:1707.06347. [Google Scholar] [CrossRef]
- Silver, D.; Hubert, T.; Schrittwieser, J.; Antonoglou, I.; Lai, M.; Guez, A.; Lanctot, M.; Sifre, L.; Kumaran, D.; Graepel, T.; et al. A general reinforcement learning algorithm that masters chess, shogi, and Go through self-play. Science 2018, 362, 1140–1144. [Google Scholar] [CrossRef] [PubMed]
- OpenAI. OpenAI Five: Defeating the World Champions in Dota 2 with Self-Play Reinforcement Learning. 2019. Available online: https://openai.com/index/openai-five/ (accessed on 14 November 2024).
- Vinyals, O.; Babuschkin, I.; Czarnecki, W.M.; Mathieu, M.; Dudzik, A.; Chung, J.; Choi, D.H.; Powell, R.; Ewalds, T.; Georgiev, P.; et al. Grandmaster level in StarCraft II using multi-agent reinforcement learning. Nature 2019, 575, 350–354. [Google Scholar] [CrossRef] [PubMed]
- Tao, J.; Xiong, Y.; Zhao, S.; Wu, R.; Shen, X.; Lyu, T.; Fan, C.; Hu, Z.; Zhao, S.; Pan, G. Explainable AI for Cheating Detection and Churn Prediction in Online Games. IEEE Trans. Games 2023, 15, 242–251. [Google Scholar] [CrossRef]
- Drachen, A.; Sifa, R.; Bauckhage, C.; Thurau, C. Guns, swords and data: Clustering of player behavior in computer games in the wild. In Proceedings of the 2012 IEEE Conference on Computational Intelligence and Games (CIG), Granada, Spain, 4–7 September 2012; pp. 163–170. [Google Scholar] [CrossRef]
- Rothmeier, K.; Pflanzl, N.; Hüllmann, J.A.; Preuss, M. Prediction of Player Churn and Disengagement Based on User Activity Data of a Freemium Online Strategy Game. IEEE Trans. Games 2021, 13, 78–88. [Google Scholar] [CrossRef]
- Lipton, Z.C. The mythos of model interpretability. Commun. ACM 2018, 61, 36–43. [Google Scholar] [CrossRef]
- Rudin, C. Stop explaining black box machine learning models for high stakes decisions and use interpretable models instead. Nat. Mach. Intell. 2019, 1, 206–215. [Google Scholar] [CrossRef] [PubMed]
- Grandien, N.; Delfosse, Q.; Kersting, K. Interpretable end-to-end Neurosymbolic Reinforcement Learning agents. arXiv 2024, arXiv:2410.14371. [Google Scholar]
- Hosmer, D.W.; Lemeshow, S. Applied Logistic Regression, 2nd ed.; Wiley: Hoboken, NJ, USA, 2000. [Google Scholar] [CrossRef]
- Breiman, L. Random Forests. Mach. Learn. 2001, 45, 5–32. [Google Scholar] [CrossRef]
- Friedman, J.H. Greedy Function Approximation: A Gradient Boosting Machine. Ann. Stat. 2001, 29, 1189–1232. [Google Scholar] [CrossRef]
- Mage. How to Interpret Machine Learning Models with SHAP Values. 2023. Available online: https://dev.to/mage_ai/how-to-interpret-machine-learning-models-with-shap-values-54jf (accessed on 28 February 2025).
- García-Sánchez, P.; Tonda, A.P.; Leiva, A.J.F.; Cotta, C. Optimizing Hearthstone agents using an evolutionary algorithm. Knowl. Based Syst. 2020, 188, 105032. [Google Scholar] [CrossRef]
- Developers, S. Basic SHAP Interaction Value Example in XGBoost. 2024. Available online: https://shap.readthedocs.io/en/latest/example_notebooks/tabular_examples/tree_based_models/Basic%20SHAP%20Interaction%20Value%20Example%20in%20XGBoost.html (accessed on 28 February 2025).
Disclaimer/Publisher’s Note: The statements, opinions and data contained in all publications are solely those of the individual author(s) and contributor(s) and not of MDPI and/or the editor(s). MDPI and/or the editor(s) disclaim responsibility for any injury to people or property resulting from any ideas, methods, instructions or products referred to in the content. |
© 2025 by the authors. Licensee MDPI, Basel, Switzerland. This article is an open access article distributed under the terms and conditions of the Creative Commons Attribution (CC BY) license (https://creativecommons.org/licenses/by/4.0/).