Optimizing Machine Learning for Healthcare Applications: A Case Study on Cardiovascular Disease Prediction Through Feature Selection, Regularization, and Overfitting Reduction †
Abstract
1. Introduction
- Perform feature selection using correlation analysis, Recursive Feature Elimination (RFE), and mutual information classifiers.
- Apply L1/L2 regularization to address multicollinearity and enhance model interpretability.
- Mitigate overfitting through the use of Random Forest and Gradient Boosting models.
- Implement cross-validation and data augmentation to ensure robust and generalizable predictions.
2. Related Work
3. Methodology
3.1. Dataset Description
- Handling Missing Values and Categorical Variables: No missing values or categorical variables were present, avoiding the need for imputation or encoding.
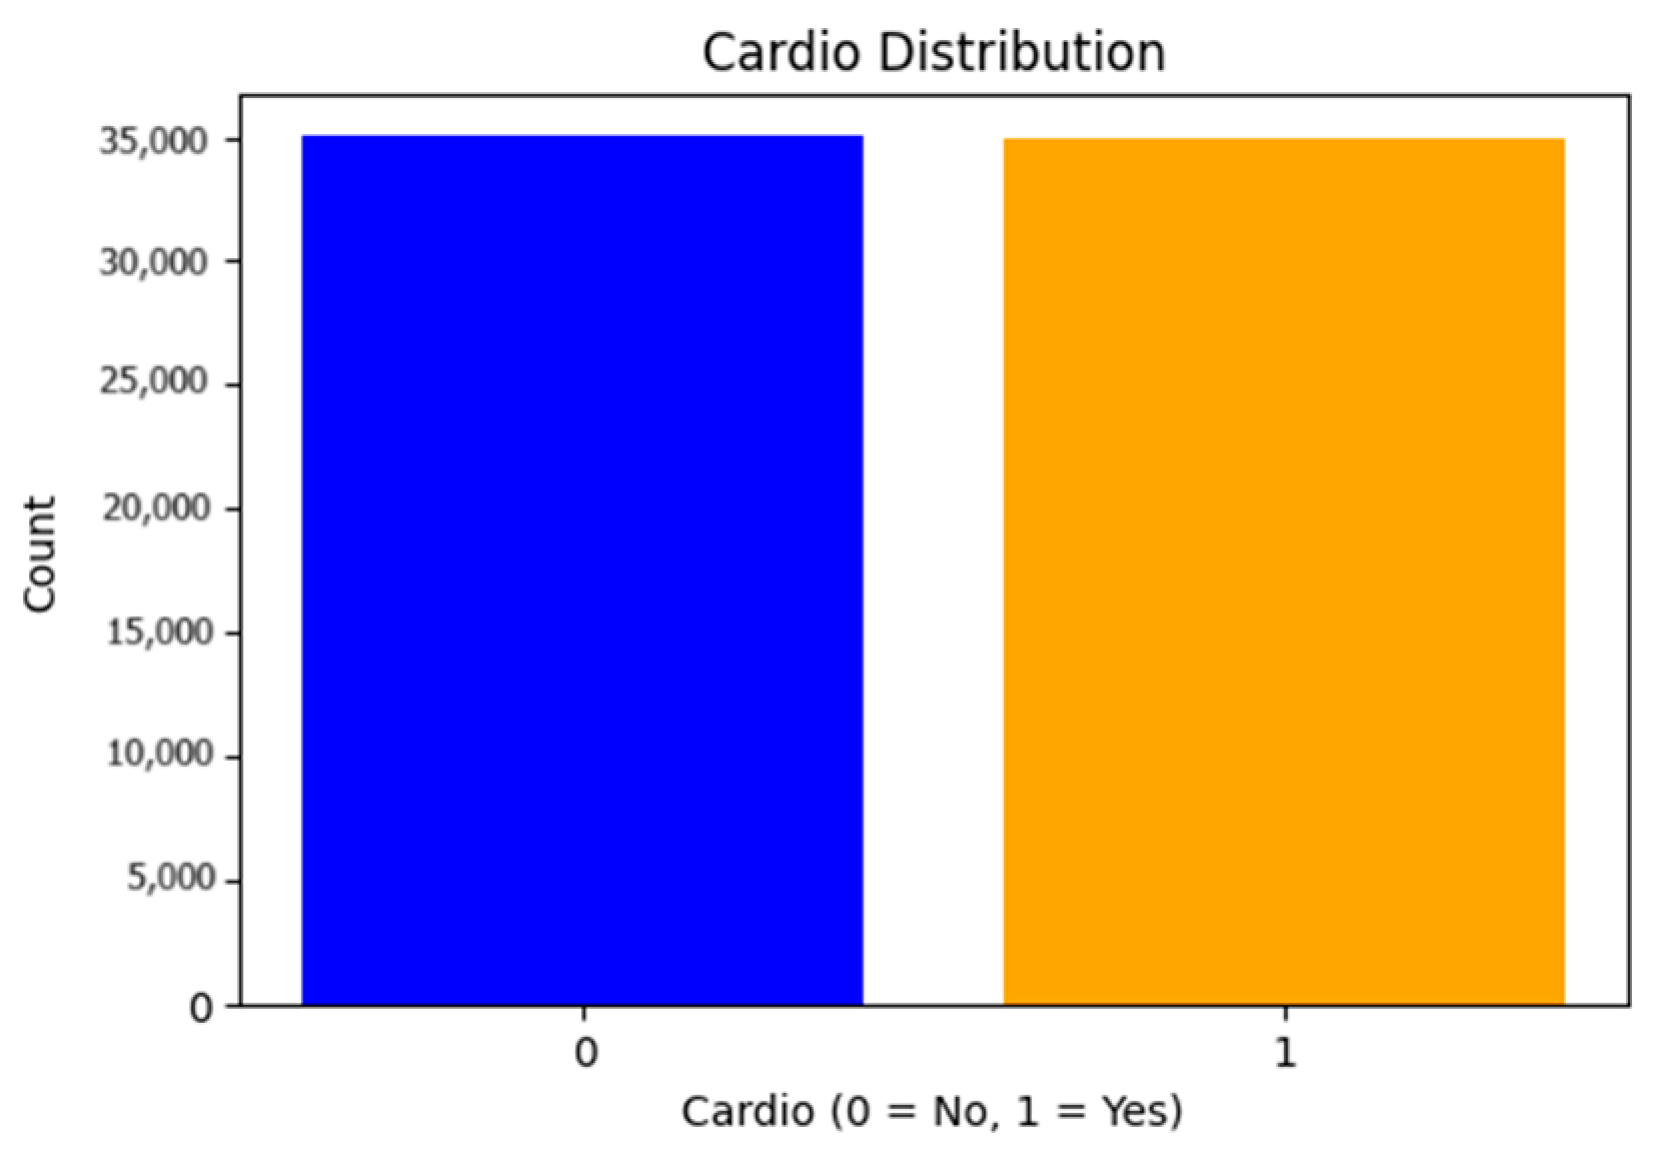
- Class Imbalance Verification: After verifying the class distribution, we found that the dataset was balanced, meaning no additional techniques (e.g., SMOTE) were required to address class imbalance (Figure 2).
3.2. Feature Selection
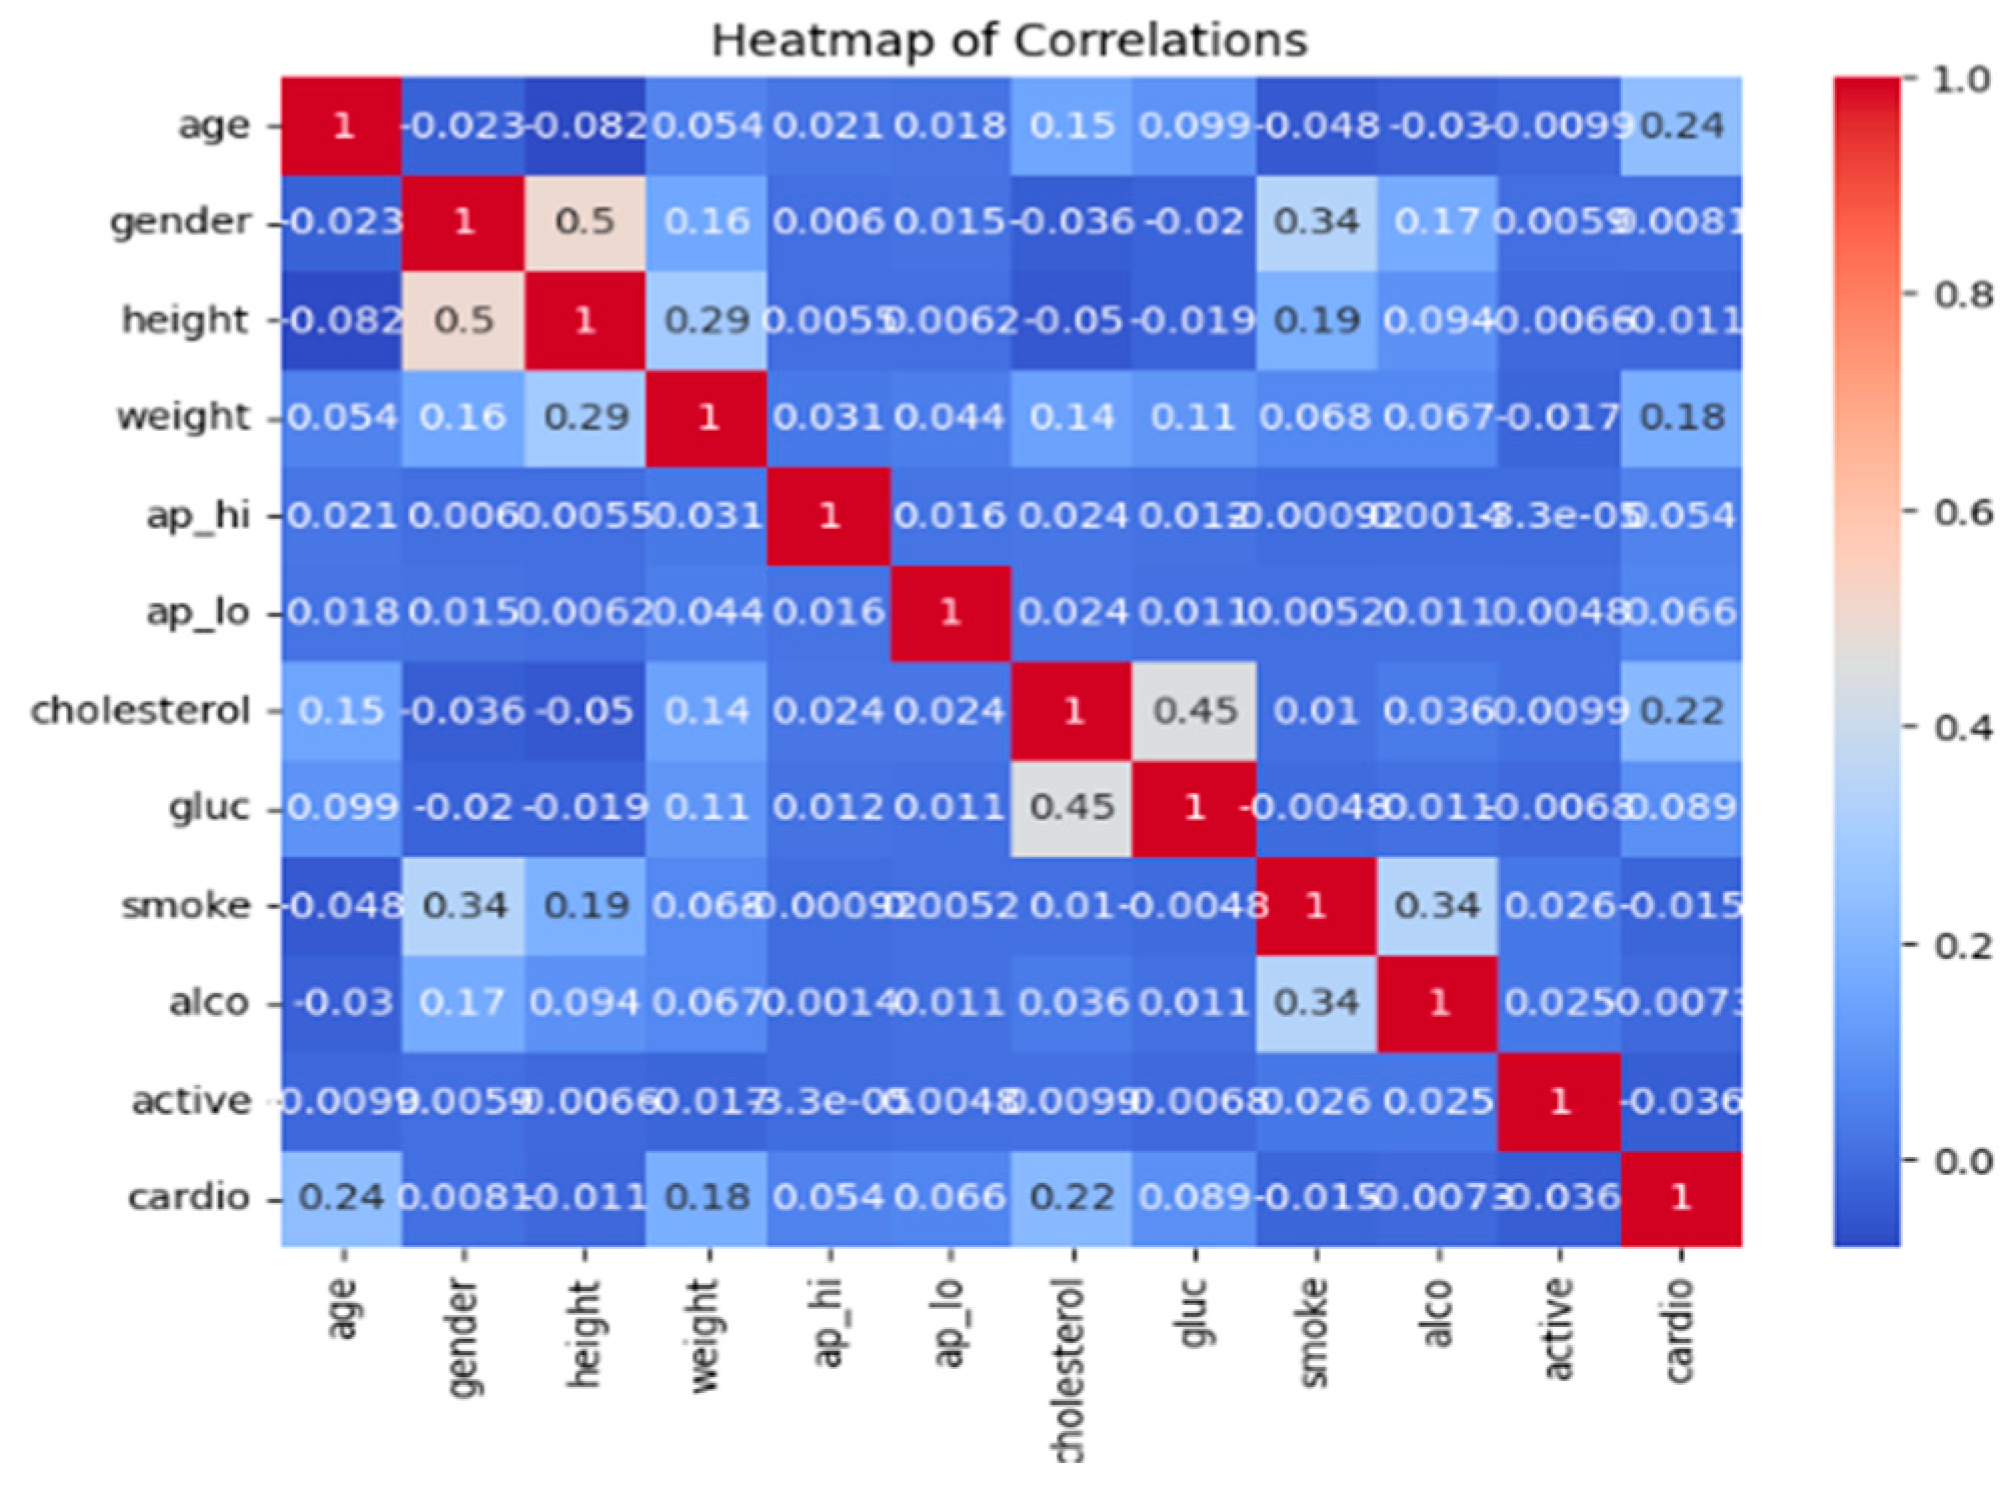
- Correlation Analysis: Pearson correlation coefficients [14,15,16] were calculated to measure the linear relationship between each feature and the target variable.Features with correlation coefficients below a threshold of 0.2 were considered less relevant and removed. This threshold was chosen to strike a balance between retaining features with meaningful relationships to the target variable and eliminating those with negligible contributions, thereby reducing dimensionality while preserving predictive power. The Pearson correlation coefficient for two variables X and Y is given by the following expression:where cov(X,Y) is the covariance between X and Y, and σx,σy are the standard deviations of X and Y, respectively.r_xy = (cov(X,Y))/(σx σy)
3.3. Regularization
- L1 Regularization (Lasso): Lasso adds a penalty equal to the absolute value of the magnitude of coefficients to the loss function;
- L2 Regularization (Ridge): Ridge adds a penalty equal to the square of the magnitude of coefficients; this technique reduces the impact of multicollinearity by discouraging large coefficients, leading to more stable and generalizable models.
3.4. Model Optimization
- Hyperparameter Tuning: Grid Search optimized hyperparameters for each algorithm [18].
- Validation Strategy: Stratified k-Fold cross-validation (k = 10 or k = 5) preserved class distribution, reducing bias [19].
- Dataset Splitting: The dataset was split into 70% training, 20% testing, and 10% validation to ensure generalizability [20].
3.5. Machine Learning Algorithms Tested
- Classification: Logistic Regression, Random Forest, SVM, Gradient Boosting (XGBoost, LightGBM, CatBoost), k-NN.
- Regression: Linear Regression, Random Forest Regressor, SVR, Gradient Boosting Regressor (XGBoost, LightGBM, CatBoost), k-NN.
3.6. Performance Evaluation
4. Results and Discussion
4.1. Classification Results
- Best Performing Models: XGBoost and LightGBM achieved the highest AUC-ROC scores (0.800 and 0.798, respectively), excelling in capturing complex data relationships.
- Moderate Performers: Random Forest and CatBoost delivered competitive AUC-ROC scores (~0.797), showing robustness and reduced overfitting.
- Lower Performers: Logistic Regression and SVM performed moderately, with AUC-ROC scores of 0.782 and 0.784, respectively, but were outperformed by ensemble methods.
- Weakest Performer: k-NN underperformed (AUC-ROC: 0.759), likely due to sensitivity to data scaling and inability to capture complex patterns.
4.2. Regression Results
- Best Performing Models: CatBoost and LightGBM achieved the highest R2 values (0.282 and 0.280, respectively), excelling in modeling complex relationships and minimizing errors.
- Moderate Performers: XGBoost and Random Forest Regressor performed well, with R2 values around 0.279 and 0.280, respectively, proving robust for regression tasks.
- Lower Performers: SVR and k-NN Regressor delivered moderate results (R2: 0.233 and 0.267, respectively), limited by their inability to handle non-linear relationships effectively.
- Weakest Performer: Linear Regression performed poorly (R2: 0.120), as expected due to its simplicity and inability to capture non-linear patterns.
4.3. General Discussion
- Superiority of Ensemble Methods: Ensemble methods (XGBoost, LightGBM, CatBoost, Random Forest) outperformed traditional algorithms (Logistic Regression, Linear Regression, k-NN) due to their ability to capture complex, non-linear relationships.
- Importance of Hyperparameter Tuning: Grid Search significantly improved performance, as seen with XGBoost, LightGBM, and CatBoost.
- Robustness of Gradient Boosting: XGBoost and LightGBM excelled in handling high-dimensional data and minimizing overfitting.
- Limitations of Traditional Algorithms: Linear Regression and k-NN underperformed due to simplicity and sensitivity to data scaling, respectively.
- Balanced Dataset: The dataset was balanced, ensuring stable and reliable results.
4.4. Recommendations
- Adopt Ensemble Methods: Prioritize XGBoost, LightGBM, and CatBoost for CVD prediction due to their superior performance.
- Invest in Hyperparameter Optimization: Use Grid Search or Bayesian Optimization to maximize model performance.
- Explore Advanced Techniques: Investigate deep learning or hybrid models for further accuracy improvements.
- Focus on Interpretability: Use SHAP to explain predictions and build trust among healthcare professionals.
- Validate on External Datasets: Ensure generalizability by testing on external datasets.
5. Conclusions and Future Work
Author Contributions
Funding
Institutional Review Board Statement
Informed Consent Statement
Data Availability Statement
Conflicts of Interest
References
- Di Cesare, M.; Perel, P.; Taylor, S.; Kabudula, C.; Bixby, H.; Gaziano, T.A.; McGhie, D.V.; Mwangi, J.; Pervan, B.; Narula, J.; et al. The Heart of the World. Glob. Heart 2024, 19, 11. [Google Scholar] [CrossRef] [PubMed]
- Soham, B.; Ananya, S.; Monalisa, S.; Debasis, S. Novel framework of significant risk factor identification and cardiovascular disease prediction. Expert Syst. Appl. 2025, 263, 125678. [Google Scholar] [CrossRef]
- Singh, M.; Kumar, A.; Khanna, N.N.; Laird, J.R.; Nicolaides, A.; Faa, G.; Johri, A.M.; Mantella, L.E.; Fernandes, J.F.E.; Teji, J.S.; et al. Artificial intelligence for cardiovascular disease risk assessment in personalised framework: A scoping review. EClinicalMedicine 2024, 73, 102660. [Google Scholar] [CrossRef] [PubMed]
- Svetlana, U. Cardiovascular Disease Dataset. 2019. Available online: https://www.kaggle.com/datasets/sulianova/cardiovascular-disease-dataset (accessed on 19 January 2023).
- Badawy, M.; Ramadan, N.; Hefny, H.A. Healthcare predictive analytics using machine learning and deep learning techniques: A survey. J. Electr. Syst. Inf. Technol. 2023, 10, 40. [Google Scholar] [CrossRef]
- Hossain, S.; Hasan, M.K.; Faruk, M.O.; Aktar, N.; Hossain, R.; Hossain, K. Machine learning approach for predicting cardiovascular disease in Bangladesh: Evidence from a cross-sectional study in 2023. BMC Cardiovasc. Disord. 2024, 24, 214. [Google Scholar] [CrossRef] [PubMed]
- Ansyari, M.R.; Mazdadi, M.I.; Indriani, F.; Kartini, D.; Saragih, T.H. Implementation of Random Forest and Extreme Gradient Boosting in the Classification of Heart Disease using Particle Swarm Optimization Feature Selection. J. Electron. Electromed. Eng. Med. Inform. 2023, 5, 250–260. [Google Scholar] [CrossRef]
- Dhafer, G.H.; Laszlo, S. A one-dimensional convolutional neural network-based deep learning approach for predicting cardiovascular diseases. Inform. Med. Unlocked 2024, 49, 101535. [Google Scholar] [CrossRef]
- Arif, M.P.; Triyanna, W. A systematic literature review: Recursive feature elimination algorithms. J. Ilmu Pengetah. Dan Teknol. Komputer 2024, 9, 2. [Google Scholar] [CrossRef]
- Demir-Kavuk, O.; Kamada, M.; Akutsu, T.; Knapp, E.W. Prediction using step-wise L1, L2 regularization and feature selection for small data sets with large number of features. BMC Bioinform. 2011, 12, 412. [Google Scholar] [CrossRef] [PubMed]
- Gracia Moisés, A.; Vitoria Pascual, I.; Imas González, J.J.; Ruiz Zamarreño, C. Data Augmentation Techniques for Machine Learning Applied to Optical Spectroscopy Datasets in Agrifood Applications: A Comprehensive Review. Sensors 2023, 23, 8562. [Google Scholar] [CrossRef] [PubMed]
- Lamiae, E.; Fatiha, E.; Hicham, G.T.; Mohammed, B. Smart home and machine learning for medical surveillance: Classification algorithms survey. J. Theor. Appl. Inf. Technol. 2021, 99, 12. [Google Scholar]
- Ahsan, M.M.; Mahmud, M.A.P.; Saha, P.K.; Gupta, K.D.; Siddique, Z. Effect of Data Scaling Methods on Machine Learning Algorithms and Model Performance. Technologies 2021, 9, 52. [Google Scholar] [CrossRef]
- Kirch, W. (Ed.) Pearson’s Correlation Coefficient. In Encyclopedia of Public Health; Springer: Dordrecht, The Netherlands, 2008. [Google Scholar] [CrossRef]
- Awad, M.; Fraihat, S. Recursive Feature Elimination with Cross-Validation with Decision Tree: Feature Selection Method for Machine Learning-Based Intrusion Detection Systems. J. Sens. Actuator Netw. 2023, 12, 67. [Google Scholar] [CrossRef]
- Dhindsa, A.; Bhatia, S.; Agrawal, S.; Sohi, B.S. An Improvised Machine Learning Model Based on Mutual Information Feature Selection Approach for Microbes Classification. Entropy 2021, 23, 257. [Google Scholar] [CrossRef]
- Mei, Y.; Ming, K.L.; Yingchi, Q.; Xingzhi, L.; Du, N. Deep neural networks with L1 and L2 regularization for high dimensional corporate credit risk prediction. Expert Syst. Appl. 2023, 213, 118873. [Google Scholar] [CrossRef]
- Radzi, S.F.M.; Karim, M.K.A.; Saripan, M.I.; Rahman, M.A.A.; Isa, I.N.C.; Ibahim, M.J. Hyperparameter Tuning and Pipeline Optimization via Grid Search Method and Tree-Based AutoML in Breast Cancer Prediction. J. Pers. Med. 2021, 11, 978. [Google Scholar] [CrossRef] [PubMed]
- Omar, C.; José, A.; Denisse, B.; Anthony, G.; Olga, M.; Manuel, Q.; Grégorio, T.; Raul, S. K-Fold Cross-Validation through Identification of the Opinion Classification Algorithm for the Satisfaction of University Students. Int. J. Online Biomed. Eng. (iJOE) 2023, 19, 11. [Google Scholar] [CrossRef]
- Xu, Y.; Goodacre, R. On Splitting Training and Validation Set: A Comparative Study of Cross-Validation, Bootstrap and Systematic Sampling for Estimating the Generalization Performance of Supervised Learning. J. Anal. Test. 2018, 2, 249–262. [Google Scholar] [CrossRef] [PubMed]
- Rainio, O.; Teuho, J.; Klén, R. Evaluation metrics and statistical tests for machine learning. Sci. Rep. 2024, 14, 6086. [Google Scholar] [CrossRef] [PubMed]
- Alexei, B. Performance Metrics (Error Measures) in Machine Learning Regression, Forecasting and Prognostics: Properties and Typology. arXiv 2018, arXiv:1809.03006. [Google Scholar] [CrossRef]


| Algorithm | Accuracy | Precision | Recall | F1-Score | AUC-ROC |
|---|---|---|---|---|---|
| Logistic Regression | 0.712 | 0.714 | 0.712 | 0.712 | 0.775 |
| Random Forest | 0.729 | 0.731 | 0.729 | 0.728 | 0.792 |
| XGBoost | 0.733 | 0.734 | 0.733 | 0.732 | 0.795 |
| LightGBM | 0.731 | 0.733 | 0.731 | 0.730 | 0.793 |
| CatBoost | 0.729 | 0.731 | 0.729 | 0.729 | 0.793 |
| k-NN | 0.706 | 0.706 | 0.706 | 0.706 | 0.753 |
| SVM | 0.720 | 0.722 | 0.720 | 0.719 | 0.777 |
| Algorithm | Accuracy | Precision | Recall | F1-Score | AUC-ROC |
|---|---|---|---|---|---|
| Logistic Regression | 0.716 | 0.718 | 0.716 | 0.715 | 0.782 |
| Random Forest | 0.731 | 0.733 | 0.731 | 0.730 | 0.797 |
| XGBoost | 0.735 | 0.737 | 0.735 | 0.735 | 0.800 |
| LightGBM | 0.732 | 0.733 | 0.732 | 0.731 | 0.798 |
| CatBoost | 0.730 | 0.731 | 0.730 | 0.730 | 0.797 |
| k-NN | 0.703 | 0.703 | 0.703 | 0.703 | 0.759 |
| SVM | 0.721 | 0.723 | 0.721 | 0.720 | 0.784 |
| Algorithm | MSE | MAE | R2 |
|---|---|---|---|
| Linear Regression | 0.219 | 0.441 | 0.123 |
| Random Forest Regressor | 0.182 | 0.366 | 0.274 |
| SVR | 0.193 | 0.398 | 0.229 |
| XGBoost Regressor | 0.181 | 0.368 | 0.274 |
| LightGBM Regressor | 0.181 | 0.366 | 0.275 |
| CatBoost Regressor | 0.181 | 0.364 | 0.276 |
| k-NN Regressor | 0.185 | 0.364 | 0.258 |
| Algorithm | MSE | MAE | R2 |
|---|---|---|---|
| Linear Regression | 0.220 | 0.442 | 0.120 |
| Random Forest Regressor | 0.180 | 0.365 | 0.280 |
| SVR | 0.192 | 0.396 | 0.233 |
| XGBoost Regressor | 0.180 | 0.368 | 0.279 |
| LightGBM Regressor | 0.180 | 0.365 | 0.280 |
| CatBoost Regressor | 0.180 | 0.363 | 0.282 |
| k-NN Regressor | 0.183 | 0.362 | 0.267 |
Disclaimer/Publisher’s Note: The statements, opinions and data contained in all publications are solely those of the individual author(s) and contributor(s) and not of MDPI and/or the editor(s). MDPI and/or the editor(s) disclaim responsibility for any injury to people or property resulting from any ideas, methods, instructions or products referred to in the content. |
© 2025 by the authors. Licensee MDPI, Basel, Switzerland. This article is an open access article distributed under the terms and conditions of the Creative Commons Attribution (CC BY) license (https://creativecommons.org/licenses/by/4.0/).
Share and Cite
Eloutouate, L.; Tani, H.G.; Elaachak, L.; Elouaai, F.; Bouhorma, M. Optimizing Machine Learning for Healthcare Applications: A Case Study on Cardiovascular Disease Prediction Through Feature Selection, Regularization, and Overfitting Reduction. Comput. Sci. Math. Forum 2025, 10, 13. https://doi.org/10.3390/cmsf2025010013
Eloutouate L, Tani HG, Elaachak L, Elouaai F, Bouhorma M. Optimizing Machine Learning for Healthcare Applications: A Case Study on Cardiovascular Disease Prediction Through Feature Selection, Regularization, and Overfitting Reduction. Computer Sciences & Mathematics Forum. 2025; 10(1):13. https://doi.org/10.3390/cmsf2025010013
Chicago/Turabian StyleEloutouate, Lamiae, Hicham Gibet Tani, Lotfi Elaachak, Fatiha Elouaai, and Mohammed Bouhorma. 2025. "Optimizing Machine Learning for Healthcare Applications: A Case Study on Cardiovascular Disease Prediction Through Feature Selection, Regularization, and Overfitting Reduction" Computer Sciences & Mathematics Forum 10, no. 1: 13. https://doi.org/10.3390/cmsf2025010013
APA StyleEloutouate, L., Tani, H. G., Elaachak, L., Elouaai, F., & Bouhorma, M. (2025). Optimizing Machine Learning for Healthcare Applications: A Case Study on Cardiovascular Disease Prediction Through Feature Selection, Regularization, and Overfitting Reduction. Computer Sciences & Mathematics Forum, 10(1), 13. https://doi.org/10.3390/cmsf2025010013


