Systematic Review

Potential Risks Associated with the Growth of Nitrifying Bacteria in Drinking Water Distribution Lines and Storage Tanks: A Systematic Literature Review

by
Amandhi N. Ekanayake
1,
Wasana Gunawardana
2,* and
Rohan Weerasooriya
3
1
Department of Fisheries and Marine Science, Faculty of Fisheries and Ocean Sciences, Ocean University of Sri Lanka, Mahawela Road, Tangalle 82200, Sri Lanka
2
China-Sri Lanka Joint Research and Demonstration Centre (JRDC) for Water Technology, Ministry of Urban Development, Construction and Housing, E.O.E Pereira Mawatha, Peradeniya 20400, Sri Lanka
3
National Institute of Fundamental Studies (NIFS), Hantana Road, Kandy 20000, Sri Lanka
*
Author to whom correspondence should be addressed.
Bacteria 2025, 4(3), 33; https://doi.org/10.3390/bacteria4030033
Submission received: 26 March 2025 / Revised: 9 July 2025 / Accepted: 9 July 2025 / Published: 12 July 2025
(This article belongs to the Collection Feature Papers in Bacteria)

Abstract

Nitrifying bacteria, including ammonia-oxidizing bacteria (AOB) and nitrite-oxidizing bacteria (NOB), are players in the nitrogen cycle but pose serious health risks when colonizing drinking water distribution networks (DWDNs). While the global impact of these bacteria is increasingly recognized, a significant research gap remains concerning their effects in tropical regions, particularly in developing countries. This study aims to bridge that gap by systematically reviewing the existing literature on nitrifying bacteria in DWDNs, their behavior in biofilms, and associated public health risks, particularly in systems reliant on surface water sources in tropical climates. Using the PRISMA guidelines for systematic reviews, 51 relevant studies were selected based on content validity and relevance to the research objective. The findings highlight the critical role of nitrifying bacteria in the formation of nitrogenous disinfection by-products (N-DBPs) and highlight specific challenges faced by developing countries, including insufficient monitoring and low public awareness regarding safe water storage practices. Additionally, this review identifies key surrogate indicators, such as ammonia, nitrite, and nitrate concentrations, that influence the formation of DBPs. Although health risks from nitrifying bacteria are reported in comparable studies, there is a lack of epidemiological data from tropical regions. This underscores the urgent need for localized research, systematic monitoring, and targeted interventions to mitigate the risks associated with nitrifying bacteria in DWDNs. Addressing these challenges is essential for enhancing water safety and supporting sustainable water management in tropical developing countries.

1. Introduction

Drinking water distribution systems are susceptible to a range of chemical, microbiological, and technical challenges due to microbial nitrification [1,2,3,4], which can compromise the biological and chemical stability of water. For instance, the pH drop associated with nitrification can accelerate corrosion within the distribution networks [4,5,6]. Additionally, nitrifying bacteria facilitate the development of heterotrophic biofilms that not only impair taste and odor but are also difficult to remove [7,8,9]. To maintain microbiological safety of water, disinfection processes typically use chlorine and chloramines as disinfectants [2,3,9,10,11]. However, in DWDNs, disinfectant decay occurs through various mechanisms, including both chemical and microbiological processes. Among the biological pathways, nitrification plays a crucial role, primarily driven by ammonia-oxidizing bacteria and nitrite-oxidizing bacteria [4,5,6,9,12,13].
Nitrification in drinking water distribution systems can depend on both natural and anthropogenic sources of nitrogen in source water. Excess or degraded chloramine can release free ammonia into the system [3,9,11]. Chloramines exist in three chemical forms: monochloramine (NH2Cl), dichloramine (NHCl2), and trichloramine, also known as nitrogen trichloride (NCl3) [5]. However, chloramine residuals decline with the length of the distribution system [14]. During growth and decay, these nitrifying bacteria release soluble microbial products (SMPs) and extracellular polymeric substances (EPS). These SMPs can accelerate the degradation of chloramine, resulting in a more rapid loss of chloramine residuals [4,5,10]. In developing countries, agricultural runoff and wastewater discharge can also increase the levels of nitrogen compounds in surface water [1,15,16,17,18].
Nitrification is a two-step biological process in which ammonia-oxidizing bacteria first convert ammonia into nitrite, followed by nitrite-oxidizing bacteria converting the nitrite into nitrate [3,4,6,8]. Additionally, anammox bacteria can oxidize ammonia by using nitrite as the electron acceptor, producing gaseous nitrogen directly through the anaerobic ammonium oxidation process (anammox process) [9,12]. The chemical reactions involved in the nitrification and denitrification processes are discussed in Table 1 [1,5]. Two groups of autotrophic nitrifying bacteria are primarily responsible for the nitrification process, and these bacteria use energy from inorganic sources, such as ammonia or nitrite, to synthesize organic molecules [2,3,19]. Although Nitrosococcus and Nitrosospira are linked to converting ammonia into nitrite [1,3], Nitrosomonas is the most commonly recognized genus. Nitrosolobus and Nitrovibrio [8] are two subgenera capable of autotrophically oxidizing ammonia. Nitrospina, Nitrococcus, and Nitrospira convert nitrite into nitrate, with Nitrobacter being the most common species associated with the conversion of nitrite into nitrate [1,3,4,5].
Numerous studies worldwide have highlighted the public health risks associated with the colonization of nitrifying bacteria in drinking water systems [11,13,15,16,18,20,21,22,23,24,25,26,27,28,29,30,31,32,33,34,35,36,37]. A high level of nitrification can significantly disrupt the stability of water and increase bacterial activity within the pipeline, compromising the infrastructure integrity of the water supply [5]. The effects of nitrite and nitrate on the formation of nitrogenous disinfection by-products (N-DBPs) within distribution systems have been studied [20,35,38,39,40].
Surface water [14], such as rivers, lakes [9], and reservoirs [2], is the main source of drinking water in most developing countries, where water sources are typically treated through conventional drinking water purification methods before distribution to ensure water safety and quality standards. Within drinking water distribution networks, nitrification is a frequent operational issue for many utilities that utilize chloramines for secondary disinfection [10,11,38]. However, research is scarce on the focused, localized studies of the diversity and behavior of nitrifying bacteria and biofilm formation within DWDNs, household storage tanks, and storage tanks within the DWDNs in tropical countries with temperate climates, which provide the preferred conditions for thriving nitrifying bacteria [2]. However, heterotrophic bacteria can also consume organic carbon and oxygen for respiration, which can reduce oxygen availability and slow down nitrifiers. In biofilms, heterotrophs coexist with nitrifiers, and the EPS they produce help build the biofilm structure that supports nitrifier communities. Although nitrifying bacteria and the associated disinfection by-products (DBPs) are known to pose health risks [20,38,39,40], no epidemiological data exist on the direct health outcomes caused by nitrifying bacteria in the tropical context. The lack of data creates a gap in understanding the local diversity of nitrifying bacteria and their behaviors under tropical climatic conditions [41]. Also, most developing countries in the tropical region face typical infrastructure challenges such as poor source water quality [6] due to agricultural runoff, septic leaks, and wastewater discharges; outdated pipelines in water distribution systems; limited funding for upgrades; and poor water storage practices [24,26], which may accelerate biofilm formation and the proliferation of nitrifying bacteria in the tropical climatic conditions [19,41].
Consequently, this systematic review aims to assess the impacts of nitrifying bacteria growth and biofilm formation in DWDNs and storage tanks on water quality and public health, with a specific focus on tropical regions. The primary objectives include assessing the occurrence and proliferation of nitrifying bacteria in DWDNs and storage tanks, identifying the factors that promote or inhibit their growth and contribute to biofilm formation across different parts of the DWDNs, and evaluating the risks they pose to water quality and infrastructure integrity. This review also explores the influence of nitrification on the formation of nitrogenous disinfection by-products (DBPs) and associated health concerns, examines current monitoring, detection, and control strategies for managing nitrification, and highlights knowledge gaps regarding the diversity and behavior of nitrifying bacteria under tropical climatic conditions. The relevant literature was sourced from online databases, including ScienceDirect, PubMed, Google Scholar, and Scopus. Following the PRISMA guidelines for systematic reviews, 51 studies were selected based on the established inclusion and exclusion criteria.

2. Research Methodology

Although no formal protocol was registered for this systematic review, it was conducted by following the PRISMA (Preferred Reporting Items for Systematic Reviews and Meta-Analyses) guidelines to ensure the systematic identification of the most relevant articles and data sources related to nitrifying bacteria in DWDNs and storage tanks, their impacts, and the knowledge gaps.

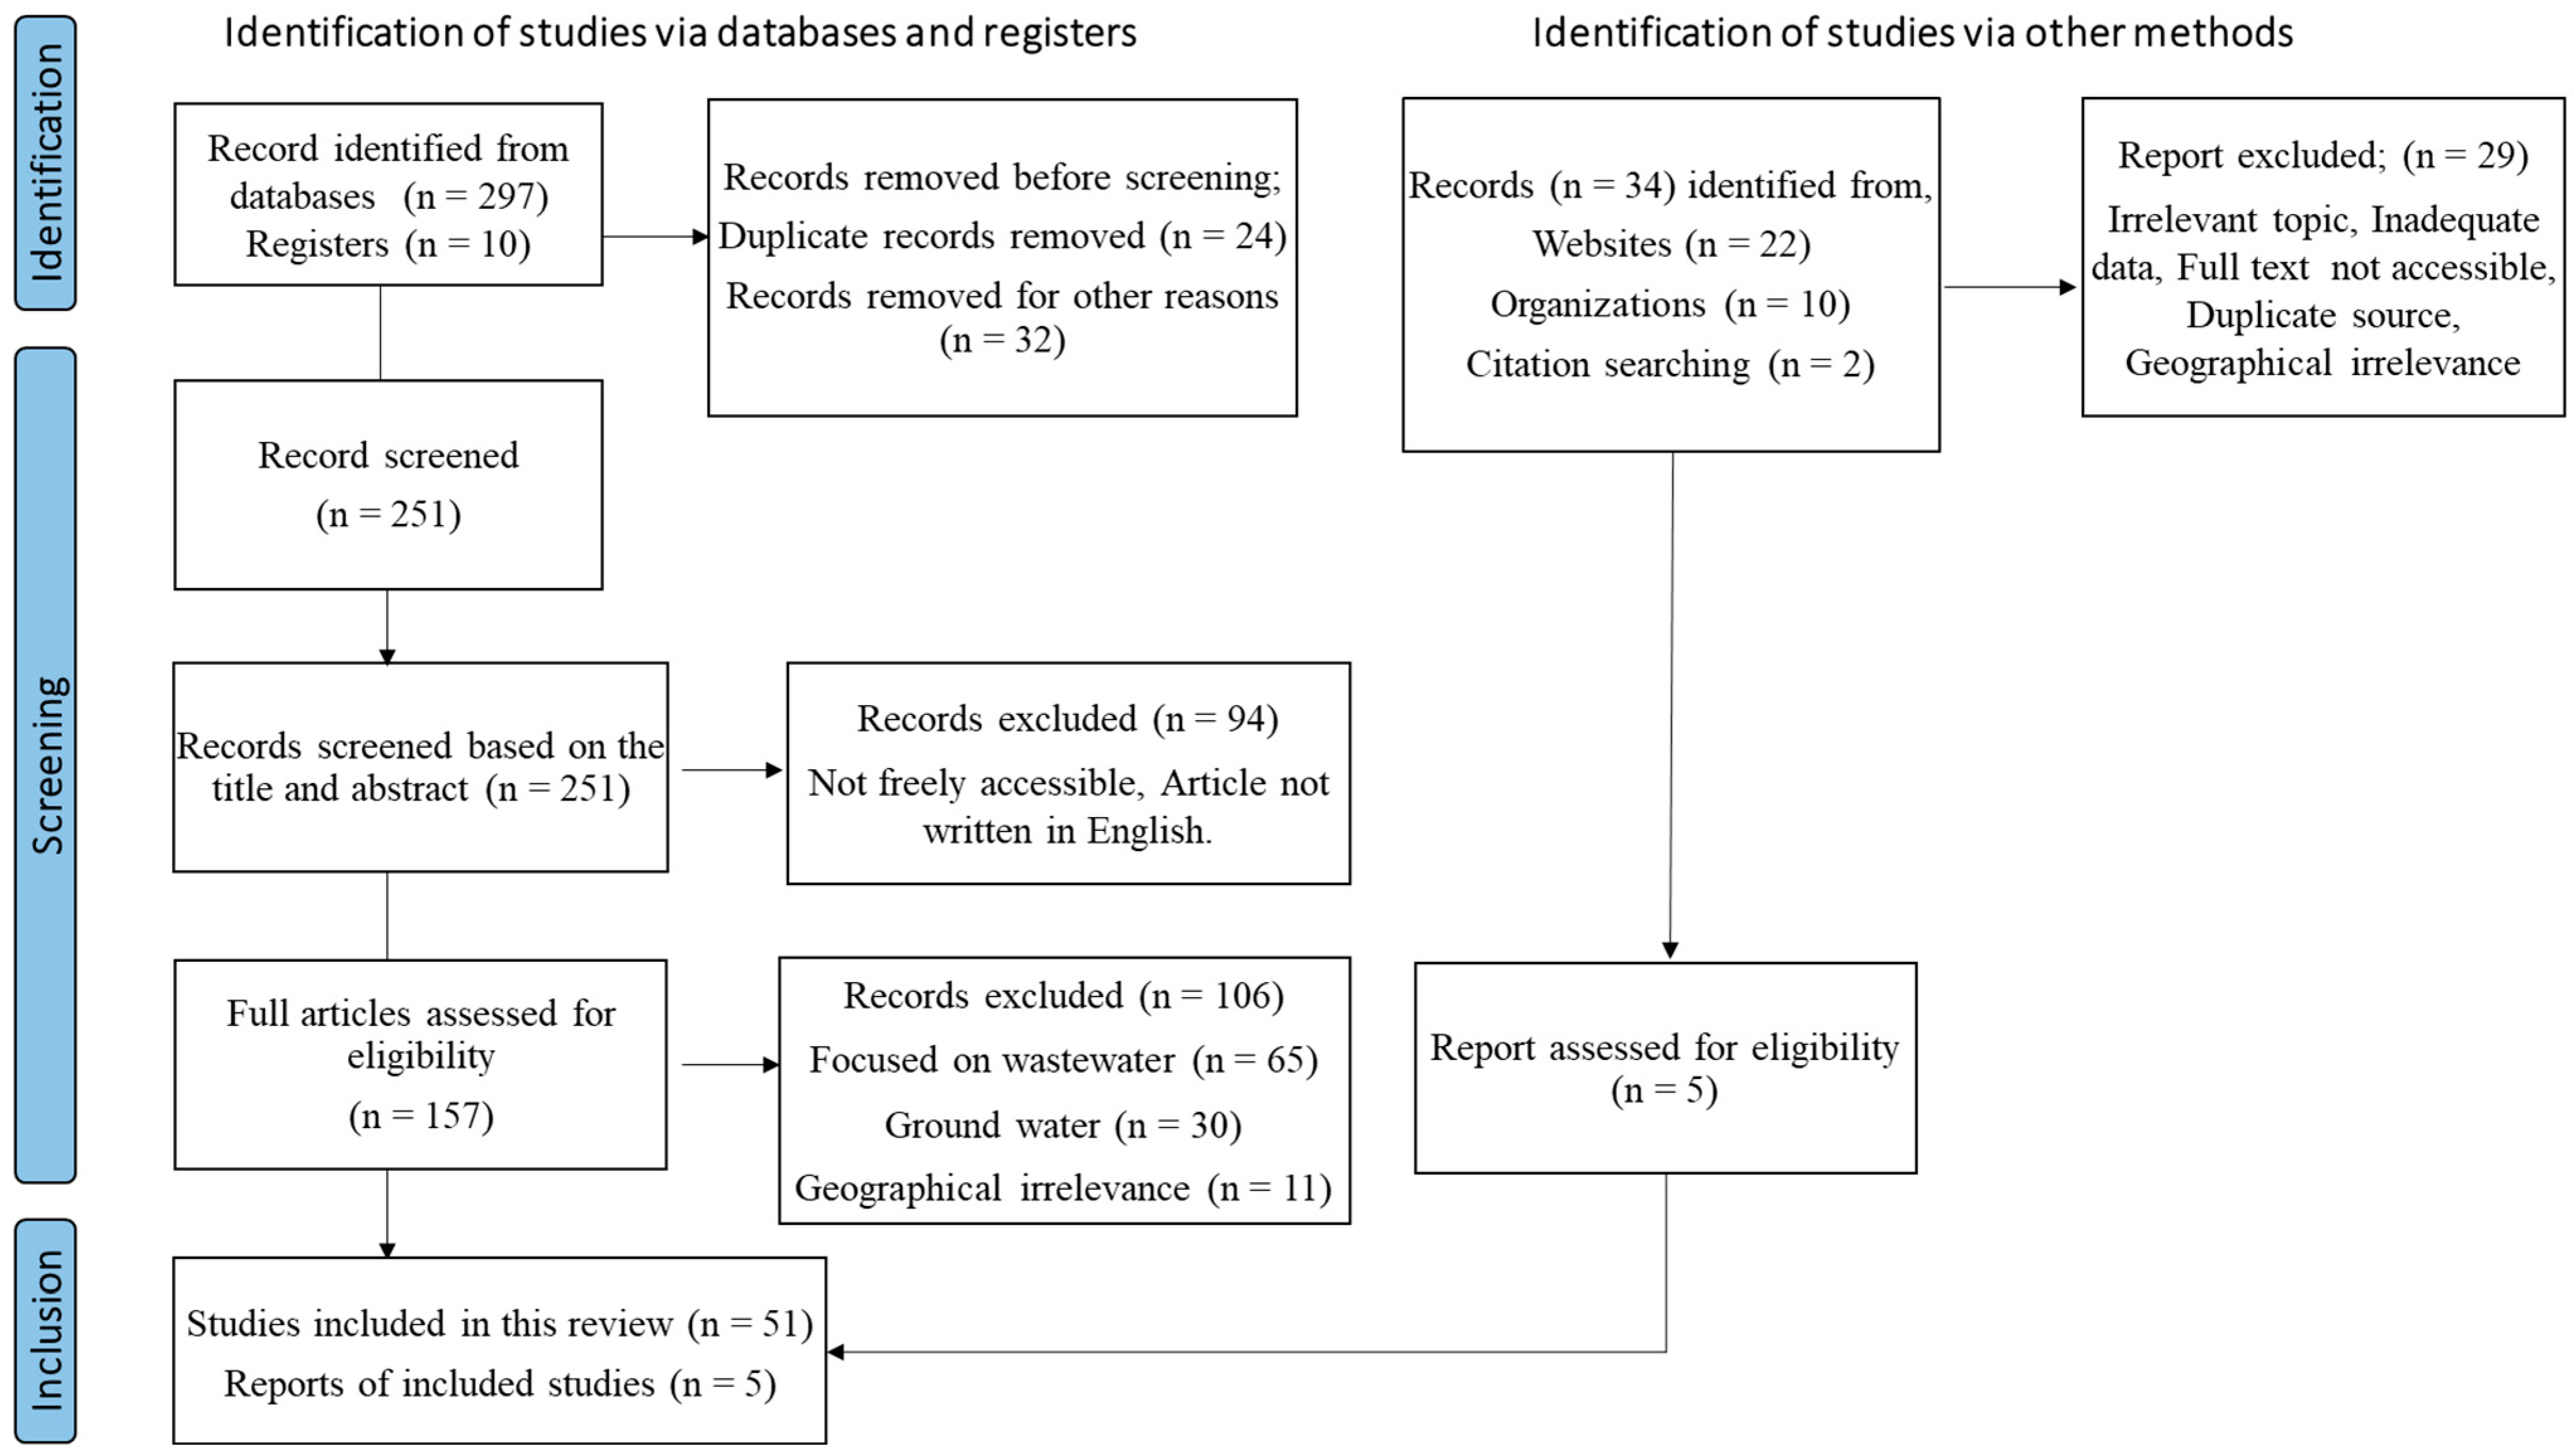
2.1. Literature Search Strategy

Keyword-based searches were conducted in databases such as Google Scholar, ScienceDirect, PubMed, and Web of Science. The key search terms included nitrification, nitrifying bacteria, drinking water distribution networks, biofilm formation, nitrogenous disinfection by-product formation, water quality, household storage tanks, and public health risks with Boolean operators. Backward and forward citation tracking were used, with the reference lists reviewed and key article titles searched in Google Scholar. All relevant data from studies were manually extracted using a structured format.

2.2. Literature Selection Criteria

Both peer-reviewed articles and the grey literature were included based on specific inclusion criteria: studies focusing on nitrifying bacteria in DWDNs or household storage and drinking water quality; freely accessible; studies published in English; discuss the health impacts, operational, or regulatory impacts of nitrification; and focus only on surface water. Only studies applicable to tropical climates were considered. Studies not meeting the above criteria were excluded. In total, 297 records, including 196 peer-reviewed journal articles and 101 grey literature sources, were retrieved. After removing 24 duplicates, 251 records were screened.
The search results were screened in two stages, including title and abstract screening to remove irrelevant studies and a full-text review to assess final eligibility based on the inclusion/exclusion criteria. During this stage, several studies were excluded for the following reasons: studies focused on groundwater systems instead of the surface drinking water supply and its storage, studies with geographical or contextual irrelevance to our focus on the conditions of developing countries, such as those dealing with highly industrialized urban systems or temperate regions, and a lack of methodological detail, insufficient data, or a lack of focus on nitrifying bacteria and biofilm behavior in distribution systems.
After this selection process, only 51 articles met all criteria and were included in this study. These articles were directly relevant to our review’s scope, particularly highlighting regional challenges such as high temperatures and the impacts of nitrifying bacteria and biofilm formation in DWDNs and household storage tanks, their potential influences on nitrogenous DBP formation, and public health risks. The details of the article selection process for the current systematic review are given in Figure 1.

2.3. Data Extraction

Data extraction focused on nitrifying bacteria diversity, growth conditions, and their impacts on DWDNs and public health risks. Key areas included biofilm formation, factors influencing nitrification, chloramine decay, and control measures. The role of storage tanks in bacterial growth and water quality deterioration was also examined. The data on N-DBPs and related health risks, such as methemoglobinemia, cancer (breast, colorectal, and bladder cancer), and reproductive issues, were collected. The extracted data were categorized to align with the study objectives for a comprehensive analysis. A manual sensitivity analysis was performed to synthesize the findings.

3. Diversity of Nitrifying Bacteria and Their Growth Conditions

3.1. Growth of Nitrifiers and Their Diversity

Nitrifier growth is influenced by factors such as pH, temperature, dissolved oxygen, and substrate availability. Research indicates that optimal temperatures for nitrifier activity range from 15 °C to 30 °C, with a pH between 6.5 and 10 [4,42]. Even under ideal conditions, both AOB and NOB exhibit slow growth, with generation times spanning from 8 h to several days. Ammonia-oxidizing bacteria that oxidize ammonia to nitrite include Nitrosococcus, Nitrosolobus, and Nitrosovibrio. Nitrite-oxidizing bacteria that oxidize nitrite to nitrate include Nitrobacter, Nitrospina, Nitrococcus, and Nitrospira [3,4,8,12]. Complete nitrification leads to the consumption of alkalinity (HCO3), the formation of carbonic acid (H2CO3), increased biomass (C5H7O2N), and a rise in the nitrate concentration, as shown in reaction (1).
NH+4 + 3.3 O2 + 6.708 HCO3 → 0.129 C5H7O2N + 3.373 NO3 + 1.041 H2O + 6.463 H2CO3
However, if nitrification is incomplete, nitrite can accumulate in the system, where it reacts with monochloramine and accelerates its decomposition [19,43], particularly in the presence of bromide [1,3,4,12]. As monochloramine travels through the water distribution network, it undergoes decay due to bacterial activity, auto-decomposition, and chemical reactions with natural organic matter and other compounds, which leads to the release of free ammonia into DWDNs [5]; this release of free ammonia further promotes microbial growth, which enhances nitrite production and, in turn, accelerates the degradation of monochloramine. Table 2 presents the diversity of nitrifying bacteria in drinking water distribution lines and storage tanks.
Table 2. Diversity of nitrifying bacteria in drinking water distribution lines and storage tanks.
Types of Bacteria FoundSources Where Bacteria Are FoundCharacteristicsReferences
AOB (ammonia-oxidizing bacteria)Nitrosomonas oligotropha
Nitrosomonas europaea
Nitrosomonas ureae
Drinking water distribution systemThe genus Nitrosomonas dominates in chloraminated systems, thrives in oxygen-limited, low ammonia environments, and is monochloramine (MCA)-tolerant.[2,8]
Nitrosococcus mobilis
Nitrosococcus oceani
Nitrosococcus halophilus
[8]
Nitrosomonas NitrosospiraChloraminated drinking distribution systemNitrosospira is dominant in chloraminated systems.[8,9]
Nitrosomonas oligotrophaEfficient ammonia oxidizer in low-substrate environments; associated with biofilms
NOB (nitrite-oxidizing bacteria)Nitrospira spp.Distribution systems and storage tanksHigh affinity for ammonia[2]
Nitrobacter spp.Full-scale chloraminated drinking water systemsLess abundant compared to Nitrospira[12]
Nitrospira spp.Thrives in low-ammonia environments. [12]
Nitrobacter spp., Nitrospira spp.Distribution systemNitrobacter is less dominant than Nitrospira.[9]

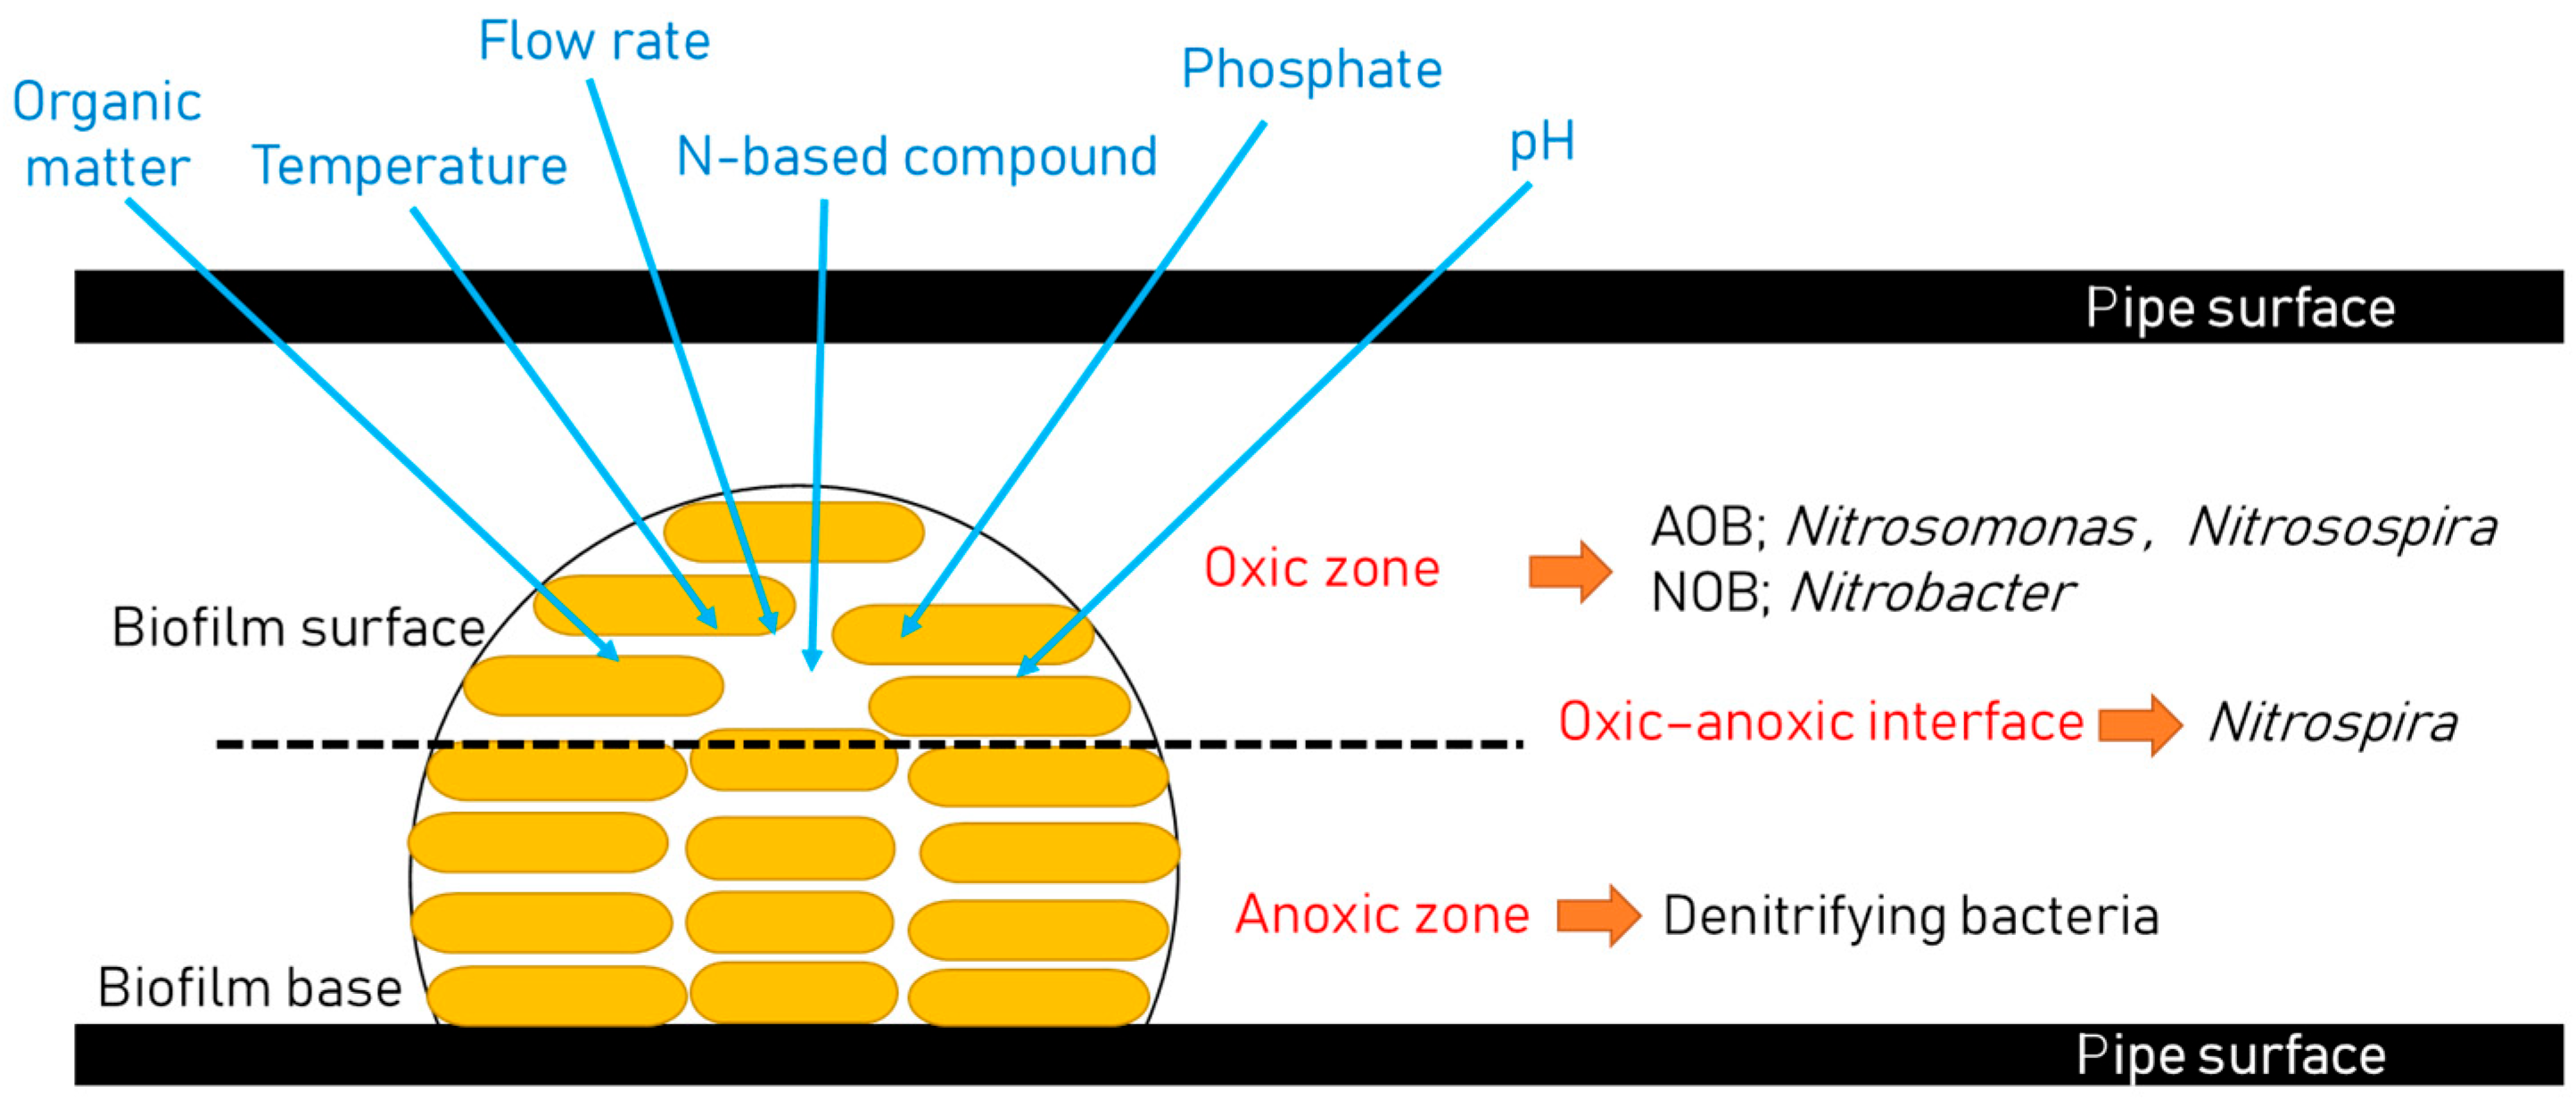
3.2. Biofilm Formation

Nitrogen is a key element for biofilm development, and high nitrogen-to-carbon ratios promote the growth of autotrophic bacteria like nitrifiers, while low nitrogen ratios favor heterotrophic bacteria. Biofilm is an assemblage of surface-associated microbes enclosed in an extracellular polymeric substance matrix [2,7,8]. Previous studies reported that over 95% of the biomass in DWDNs exists as biofilms [2,4,7], with only 5% detectable in planktonic form [4,8]. Sediment and biofilms in pipelines appear to protect AOB from chloramine disinfection. In addition, sediments likely contribute additional nutrients and provide a refuge for bacteria, supporting their survival and growth even in disinfected environments [4,8,19]. A schematic illustration of biofilms within the distribution pipeline is shown in Figure 2.
The formation of a biofilm in the drinking water distribution system and storage tank can cause adverse water quality issues, such as discoloration, changes in taste and odor, and health problems [2,4,7]. It depends on the pipes and storage tank materials, the concentration of nutrients, disinfectant levels, water temperature, and pH [7]. Nitrosomonas (Nitrosococcus mobilis) and Nitrosospira (Nitrosovibrio and Nitrosolobus) are affiliated with the beta-subclass of Proteobacteria. The gamma-subclass of Proteobacteria includes the species Nitrosococcus oceani and Nitrosococcus halophilus, and these bacteria have the potential to cause serious problems with drinking water quality. According to Lipponen et al., 2004 [4], Nitrosomonas was the most ubiquitous AOB genus in developing drinking water biofilms.
Cruz et al., 2020 [2], reported that two distinct nitrifying biofilm niches within drinking water distribution networks (DWDNs) were based on microbial diversity. Low-diversity (LD) clusters were predominantly composed of ammonia-oxidizing bacteria (AOB), particularly Nitrosomonas, while high-diversity (HD) clusters were dominated by nitrite-oxidizing bacteria (NOB), mainly Nitrospira, enabling complete nitrification. The study also found that nitrate, total phosphorus, and total trihalomethane (TTHM) levels were positively correlated with HD clusters. Additionally, aged pipes were more likely to support HD communities with greater microbial diversity, whereas younger pipes (less than 35 years old) tended to harbor LD clusters with lower diversity. Smaller-diameter pipes were also associated with HD clusters, likely due to their higher surface-area-to-volume ratio, which favors biofilm development.
As a biofilm matures, it develops a heterogeneous structure characterized by nutrient and oxygen gradients [8]. These gradients lead to the stratification of microbial populations in various layers of the biofilm with different bacterial species [7,8]. For example, Nitrosomonas often thrives in the well-oxygenated outer layers, whereas Nitrospira and Nitrobacter may dominate in the deeper, more anoxic regions of the biofilm [11,19]. The biofilm grows thicker over time, reaching a stable state where interactions between different microbial species become more complex. Biofilm maturation is influenced by several key factors, including both natural organic matter and inorganics (phosphorus, nitrogen, and trace metals). During the final stage, mature biofilms can undergo dispersal, where cells leave the biofilm structure to colonize new areas [2,7,8].
In oxic zones, AOB, such as Nitrosomonas, oxidize ammonia to nitrite [19], while NOB, such as Nitrospira, convert nitrite to nitrate [9]. Anoxic zones have little or no dissolved oxygen, leading to anaerobic metabolic processes. The oxic areas of the biofilm, which are subjected to high ammonia and nitrite concentrations, are dominated by Nitrosomonas europaea-like ammonia oxidizers and by members of the genus Nitrobacter. Nitrospira species are dominant in the oxic–anoxic interface. In the anoxic part of the biofilm, the cell numbers of all nitrifiers are relatively low. Hossain et al., 2022 [5], reported that Nitrospira species are capable of complete ammonia oxidation (comammox process), bypassing the two-step nitrification by AOB and NOB. Comammox bacteria can oxidize ammonia directly to nitrate without a nitrite intermediate. Comammox bacteria are slow-growing but have a high yield. Though comammox bacteria have been found in natural and terrestrial ecosystems, definitive evidence of their presence in DWDNs is still lacking [5].

4. Factors Influencing Nitrification in Distribution Systems

Several interrelated and complex factors, such as water temperature, system-specific factors (pipe material, water age, design, and tank material), pH, dissolved oxygen, chlorine-to-ammonia ratio, chloramine disinfectant level, natural organic matter, the presence of biofilms, nitrifying bacteria, treatment plant process, and dissolved oxygen, affect nitrification in DWDNs [5,44]. The presence of biofilms and sediment within the distribution line can also accelerate the nitrification process [4,19,42].

4.1. Temperature Effect

Tropical regions, characterized by consistently high temperatures throughout the year, create optimal conditions for the proliferation of nitrifying bacteria [2], and drinking water utilities are increasingly challenged by disinfectant control in drinking water distribution systems due to rising temperatures linked to climate change [43]. When water flow is minimal, the oxygen concentration becomes limited and the temperature increases in above-ground or sun-exposed sections of DWDNs, where both AOB and NOB may be active [14,41]. Higher temperatures accelerate disinfectant decay [14,44], elevating the risk of waterborne pathogens. To ensure microbial safety, utilities often use free chlorine as a primary disinfectant. However, in warmer climates, chlorine use leads to greater concentrations of disinfection by-products (DBPs) and can cause issues with taste and odor in drinking water [4]. Therefore, chloramine is used as a secondary disinfectant [10,43], since chloramination has been shown to produce the least DBPs [14].
According to Wolfe et al., 1990 [19], AOB was detected only when water temperatures exceeded 16–18 °C. Favorable conditions for AOB included mild alkalinity (pH 7.5–8.5), warm temperatures (25–28 °C), darkness, and the presence of free ammonia. Some case studies proved the impact of temperature. A 0.8–1.4 °C rise in median water temperature (2001–2016) correlated with a loss of chloramine residuals and heightened activity of AOB in a DWDN in Pasadena, California [41]. Moreover, the retention time in a water distribution line and the storage tank was shown to influence the growth of AOB. When water remains in the distribution system for an extended period, conditions become favorable for the gradual proliferation of AOB.

4.2. Effect of Disinfectant Residual Levels

According to Bal Krishna & Sathasivan, 2012 [10], and Sarker et al., 2018 [43], nitrification is more likely to occur when chloramine residuals are low [10]. While chloramine concentrations of 1.0 to 2.0 mg/L are generally sufficient to suppress nitrifying bacteria in DWDNs, controlling nitrification becomes difficult once it has started, even when residuals are increased to 8.0 mg/L [5]. Studies have shown that nitrifiers can survive at chloramine levels as high as 5.0 to 6.0 mg/L. Bal Krishna & Sathasivan, 2012 [10], Wolfe et al., 1990 [19], Odell et al., 1996 [42], and Hossain et al., 2022 [5] reported that maintaining a minimum chloramine residual level of 2 to 3 mg Cl2/L can help minimize rapid chloramine decay and nitrification. However, sustaining this level consistently across the distribution system remains a challenge. This is primarily because a significant portion of the chloramine is consumed in reactions with nitrification by-products, reducing its availability to inactivate nitrifying bacteria and other substances, such as soluble microbial products (SMPs) [6].

4.3. Effect of the Chlorine-to-Ammonia Ratio

It was found that a relatively high chlorine-to-ammonia ratio ensured a reduced amount of free ammonia available to promote nitrification. The free ammonia level was significantly reduced at a chlorine-to-ammonia ratio of 5:1. Some studies reported that chloramine was more stable at a chlorine-to-ammonia ratio of 4:1. Hossain et al., 2022 [5], reported that nitrification could be prevented when the biocide (chlorine) to food (ammonia) mass ratio was eight or above. Also, Hossain et al., 2022 [5], reported that nitrification was prevented when the total chlorine concentration was maintained at 2.2 mg/L or higher (as Cl2).

4.4. pH Effect

The nitrification process was affected by pH in several ways [5,17]. Both AOB and NOB bacteria thrive within a pH range that is typically from 7.0 to 8.5 [17,25]. At high pH levels (above 8.5), chloramine decomposes more slowly, reducing free ammonia and slowing down nitrification [5]. On the other hand, a decrease in pH can speed up chloramine decay. However, Harrington et al., 2002 [17], noted that increased pH caused a decrease in the effectiveness of chloramines in inactivating AOB. Extremely low and high pH levels have inhibited the growth of nitrifying bacteria. Ammonia oxidation stops at a pH of 5, and nitrite oxidation slows significantly at pH 8.5.

4.5. Effect of Water Storage Tanks

Household water storage tanks are widely used in developing countries and are typically installed on rooftops. These tanks often experience extended water retention times, particularly in regions with an intermittent or limited water supply. This extended retention time [42] allows residual disinfectants (like chloramine) to decay, leading to ammonia buildup within the tanks [40,42,44]. Ammonia then serves as a substrate for nitrifying bacteria, which can proliferate in stagnant warm water. Distribution pipelines situated in flat areas with low-flow conditions are susceptible to stagnation and high retention times [26,45]. Various tank materials, such as plastic, steel, and concrete, interact differently with the water chemistry, impacting bacterial growth rates and nitrification [44]. The material of storage tanks significantly impacts the temperature inside the storage tank [42]. Steel tanks have a higher thermal conductivity than plastic or fiberglass tanks [44], and these tanks can transfer heat more effectively [45]. During the daytime, steel storage tanks absorb and dissipate heat quickly, and so the drinking water inside a steel tank will cool down faster when the ambient temperature drops. This makes steel tanks more responsive to temperature fluctuations, maintaining a more stable water temperature than less conductive materials. As a result of temperature fluctuations within the storage tank, nitrification occurs [42]. However, the steel tank also cools faster, which may moderate microbial growth during colder periods. In contrast, plastic tanks, particularly those made of black polyethylene, have a dark exterior that increases heat absorption and retains heat longer, which can elevate the water temperature. Fiberglass and fiber cement tanks, having different material properties, tend to absorb less heat [45]. In addition, tanks with higher temperatures are more likely to develop thicker biofilms, which serve as a substrate for nitrifying bacteria [42,45].
Longer storage times increase nitrification because stagnant water provides a stable environment for nitrifying bacteria to grow, especially when chloramine begins to break down into ammonia. The presence of ammonia then acts as a nutrient for nitrifying bacteria like Nitrosomonas and Nitrobacter [42,45]. The size of a storage tank interacts with household water usage to determine the effective residence time. A large tank used by a small household with low per capita water use extends the residence time, allowing more time for microbial growth and contamination. The size, material, and age of tanks can significantly impact water quality [44].

5. Potential Health Impacts of Nitrifying Bacteria

5.1. Effect of the Formation of DBPs

The use of disinfectants in public drinking water sources has proven essential in stopping the development of waterborne illnesses. However, when these disinfectants react with naturally existing organic and inorganic components in water, DBPs are created [20,38,40]. Biofilms release precursors for the formation of DBPs. Research has delved into the effects of nitrite and nitrate on the formation of trichloronitromethane and N-DBPs within distribution systems and storage tanks [20,24,38]. Experiments showed that spiking non-nitrifying waters with biofilm samples from nitrifying facilities led to an increase in DBP formation, demonstrating the role of biofilms in DBP production [40]. In recent years, research into the formation of nitrogenous disinfection by-products such as NDMA, HANs, haloacetamides (HAcAms), cyanogen halides (CNX), and halonitromethanes (HNMs) in drinking water has significantly expanded [20,26,38,39].
Liew et al., 2016 [38], investigated that the formation and occurrence of twenty-eight N-DBPs, including eight halogenated nitriles (dibromoacetonitrile (DBAN), dichloroacetonitrile (DCAN), chloroacetonitrile (MCAN), trichloroacetonitrile (TCAN), bromoacetonitrile (MBAN), bromochloroacetonitrile (BCAN), 2,2-dichloropropanenitrile, and 2,2-dibromobutanenitrile), seven HNMs (trichloronitromethane (chloropicrin), tribromonitromethane (bromopicrin), dichloronitromethane (DCNM), dibromonitromethane (DBNM), bromochloronitromethane (BCNM), bromodichloronitromethane (BDCNM), and dibromochloronitromethane (DBCNM)), five HAAms (chloroacetamide (CAAm), bromoacetamide (BAAm), dichloroacetamide (DCAAm), dibromoacetamide (DBAAm), and trichloroacetamide (TCAAm)), and eight N-nitrosamines (N-nitrosodimethylamine (NDMA), N-nitrosoethylmethylamine (NEMA), N-nitrosodiethylamine (NDEA), N-nitrosodi-n-propylamine (NDPA), N-nitrosodi-n-butylamine (NDBA), N-nitrosopiperidine (NPIP), N-nitrosopyrrolidine (NPYR), and N-nitrosomorpholine (NMOR)).
It shows that, in comparison to chlorine, chloramines produce fewer HANs. Amino acids (such as aspartic acid and tryptophan), nucleic acids (DNA and RNA), and proteinaceous materials in water are key precursors of HANs [20,39]. These compounds contain nitrogen, which reacts with chlorine during water treatment to form the HANs. When chlorine reacts with amino acids, it can produce compounds, such as nitriles (like DCAN) and aldehydes. Both of these compounds can also act as precursors to N-DBPs [38,39]. This route depends on factors like the chlorine-to-nitrogen ratio and the pH of the water. At a higher pH of around eight, the reaction tends to produce aldehydes rather than nitriles. These aldehydes can then undergo further reactions, leading to the creation of other by-products, such as DHANs. The types of N-DBPs found in water distribution lines and their precursors are presented in Table 3 [20,26,38,39,40].
Table 3. Types of nitrogenous disinfection by-products (N-DBPs) found in water distribution lines and their precursors.
Disinfection by Product GroupImportant PrecursorsDisinfectantTypes of N-DBPReferences
Haloacetonitriles (HANs) R3CCNAspartic Acid, Tryptophan, Kynurenic Acid, Algal Organic Matter (AOM)Chlorine, ChloramineDichloroacetonitrile (DCAN), Bromochloroacetonitrile (BCAN), Dibromoacetonitrile (DBAN), Trichloroacetonitrile (TCAN), Chloroacetonitrile (MCAN), Bromobutanenitrile (MBAN)[20,38]
Haloacetamides (HAcAms) R3CCONH2Aspartic Acid, TyrosineChlorine, ChloramineChloroacetamide (CAAm), Bromoacetamide (BAAm), Dichloroacetamide (DCAcAm), Dibromoacetamide (DBAcAm), Trichloroacetamide (TCAcAm)[20,38]
Halonitromethanes (HNMs) R3CHNitromethane, Nitrophenols, Glycine, LysineChlorine, Ozone-ChlorinationTrichloromethane (Chloroform), Tribromomethane (Bromoform), Bromodichloromethane, Dibromochloromethane, Dichloronitromethane (DCNM), Dibromonitromethane (DBNM), Bromochloronitromethane (BCNM), Bromodichloronitromethane (BDCNM), Dibromochloronitromethane (DBCNM)[20,38,40]
NitrosaminesDimethylamine (DMA), Trimethylamine (TMA), Ranitidine, Nizatidine N-Nitrosodimethylamine (NDMA), N-Nitrosopyrrolidine (NPYR), N-Nitrosomorpholine (NMOR), N-Nitrosodiethylamine (NDEA), N-Nitrosoethylmethylamine (NEMA), N-Nitrosodi-n-propylamine (NDPA), N-Nitrosodi-n-butylamine (NDBA), N-Nitrosopiperidine (NPIP)[20,38,40]
Cyanogen Halides (CNXs)Glycine, Formaldehyde, Amino Acids (Serine, Threonine)Chloramine, ChlorinationCyanogen Chloride (CNCl), Cyanogen Bromide (CNBr)[20]
While current research has identified many precursors, there are still unidentified sources that contribute to HAN formation, and the health risks of some by-products (like organic chloramines) remain poorly understood [20]. Dihaloacetamides are produced from the hydrolysis of dihaloacetonitriles (DHANs) when an alkaline pH is present. These DHANs can subsequently be hydrolyzed to produce dihaloacetic acids (DHAAs). This means that once DHANs are present in water, they can undergo a chemical process (hydrolysis) that converts them into HAcAms and eventually they are hydrolyzed into DHAAs: the related reactions of this process are given in chemical reactions (2)–(5) (R = alkyl group, X = halogen) [38,39].
R-CX2 CN + H2O→R-CX2 CONH2
R-CX2 CN + H2O + OH→R-CX2 COO + NH3
Cl2 CHCN + H2O + OH→Cl2CHCONH2
R-CX2 CONH2 + H2O + OH→R-CX2 COO + NH3
Previous studies described different mechanisms for the formation of DCAcAm [20,40]. The hydrolysis of DCAN is one of the primary routes for forming DCAcAm, and the rate of this hydrolysis increases with alkaline water. Another pathway for DCAcAm production involves cyanoacetic acid, which undergoes hydrolysis and then reacts with chlorine to produce DCAcAm.
The hydrolysis and subsequent chlorination of cyanoacetic acid (NCCH2COOH) in water produces glycolic acid (HOCH2COOH) and ammonia. The hydrolyzed product is chlorinated to form dichloroacetic acid (DCAA). Dichloroacetic acid reacts with ammonia to form dichloroacetamide (DCAcAm). Another potential pathway for the formation of dichloroacetamide (DCAcAm) is through the direct halogenation of amides. During this process, amides react with chlorine to form DCAcAm [40]. The related chemical reactions are shown in reactions (6)–(8).
NCCH2 COOH + 2H2O→ HOOCCH2COOH + NH3
HOCH2COOH + 2Cl2 + H2O→Cl2 CHCOOH +2HCl
Cl2 CHCOOH + NH3 →Cl2 CHCONH2 + H2O
According to the US surveys conducted in 2000–2002 and 2006–2007, chloropicrin was identified as the most frequently reported halonitromethane (HNM) [39]. Disinfection protocols impact the formation of HNMs, with ozonation followed by chlorination producing the highest levels. Chloropicrin is likely formed through the chlorination of a nitromethane moiety within larger molecules. Nitrophenols also serve as precursors for chloropicrin synthesis, with 3-nitrophenol showing a higher conversion rate compared to 2-nitrophenol. NOM substances, including amino acids, amino sugars, primary amines (monomethylamines), and nucleic acids, generate a low yield of chloropicrin in water [39]. N-Nitrosodimethylamine, a concerning disinfection by-product, is strongly associated with chloramination rather than chlorination in water treatment systems [40]. Nitrosamines, such as N-nitrosopyrrolidine (NPYR), N-nitrosomorpholine (NMOR), N-nitroso diethylamine (NDEA), N-nitrosodiphenylamine (NDPhA), and N-nitrosodibutylamine, have occasionally been reported in both raw and finished drinking water. Previous studies described three main mechanisms for nitrosamine formation during water treatment. An amine reacts with monochloramine (NH2Cl) to form a hydrazine intermediate, which is then oxidized into a nitrosamine (e.g., NDMA). For example, dimethylamine (DMA) can react to form unsymmetrical 1,1-dimethylhydrazine (UDMH), which is later converted to NDMA. An amine reacts with dichloramine (NHCl2) to form chlorinated hydrazine, which is then converted to the corresponding nitrosamine. Finally, an amine reacts with a reactive nitrosating agent (e.g., NO+, HNO2, or N2O4) to form the corresponding nitrosamine (reactions (9) and (10)). Factors like pH, nitrite, and ammonia influence nitrosamine formation during disinfection processes [39].
(CH3)2NH + NH2Cl→(CH3)2NNH2 + HCl
(CH3)2NNH2 + HNO2 →(CH3)2NNO + H2O
Formaldehyde is produced during processes like the chlorination and ozonation of organic matter in water treatment systems, and formaldehyde reacts rapidly with monochloramine (NH2Cl), yielding cyanogen chloride (CNCl). Cyanogen chloride undergoes hydrolysis to produce hydrogen cyanide (HCN) and hydrochloric acid (HCl), as shown in Equations (12) and (13). For example, the chlorination of glycine produces formaldehyde, monochloramine (NH2Cl), and carbon dioxide. Then, formaldehyde (CH2O) and monochloramine react together to form cyanogen chloride (CNCl); the related chemical reactions are shown in Equations (11)–(14) [39].
CH2O + NH2Cl→CNCl + 2H2O
CNCl + H2O→CO + HCN + HCl
NH2CH2COOH + Cl2 + H2O→CH2O + NH2Cl + CO2 + Cl
CH2O + NH2Cl→CNCl + 2H2O
Previous studies found high concentrations of N-nitrosodimethylamine (NDMA), haloacetonitriles (HANs), and haloacetamides (HAcAms) in nitrifying waters, particularly in storage facilities where nitrification was ongoing [40]. The NDMA concentrations increased further when chloramination was applied, suggesting that nitrifying biofilms released precursors that promoted N-nitrosamine formation.

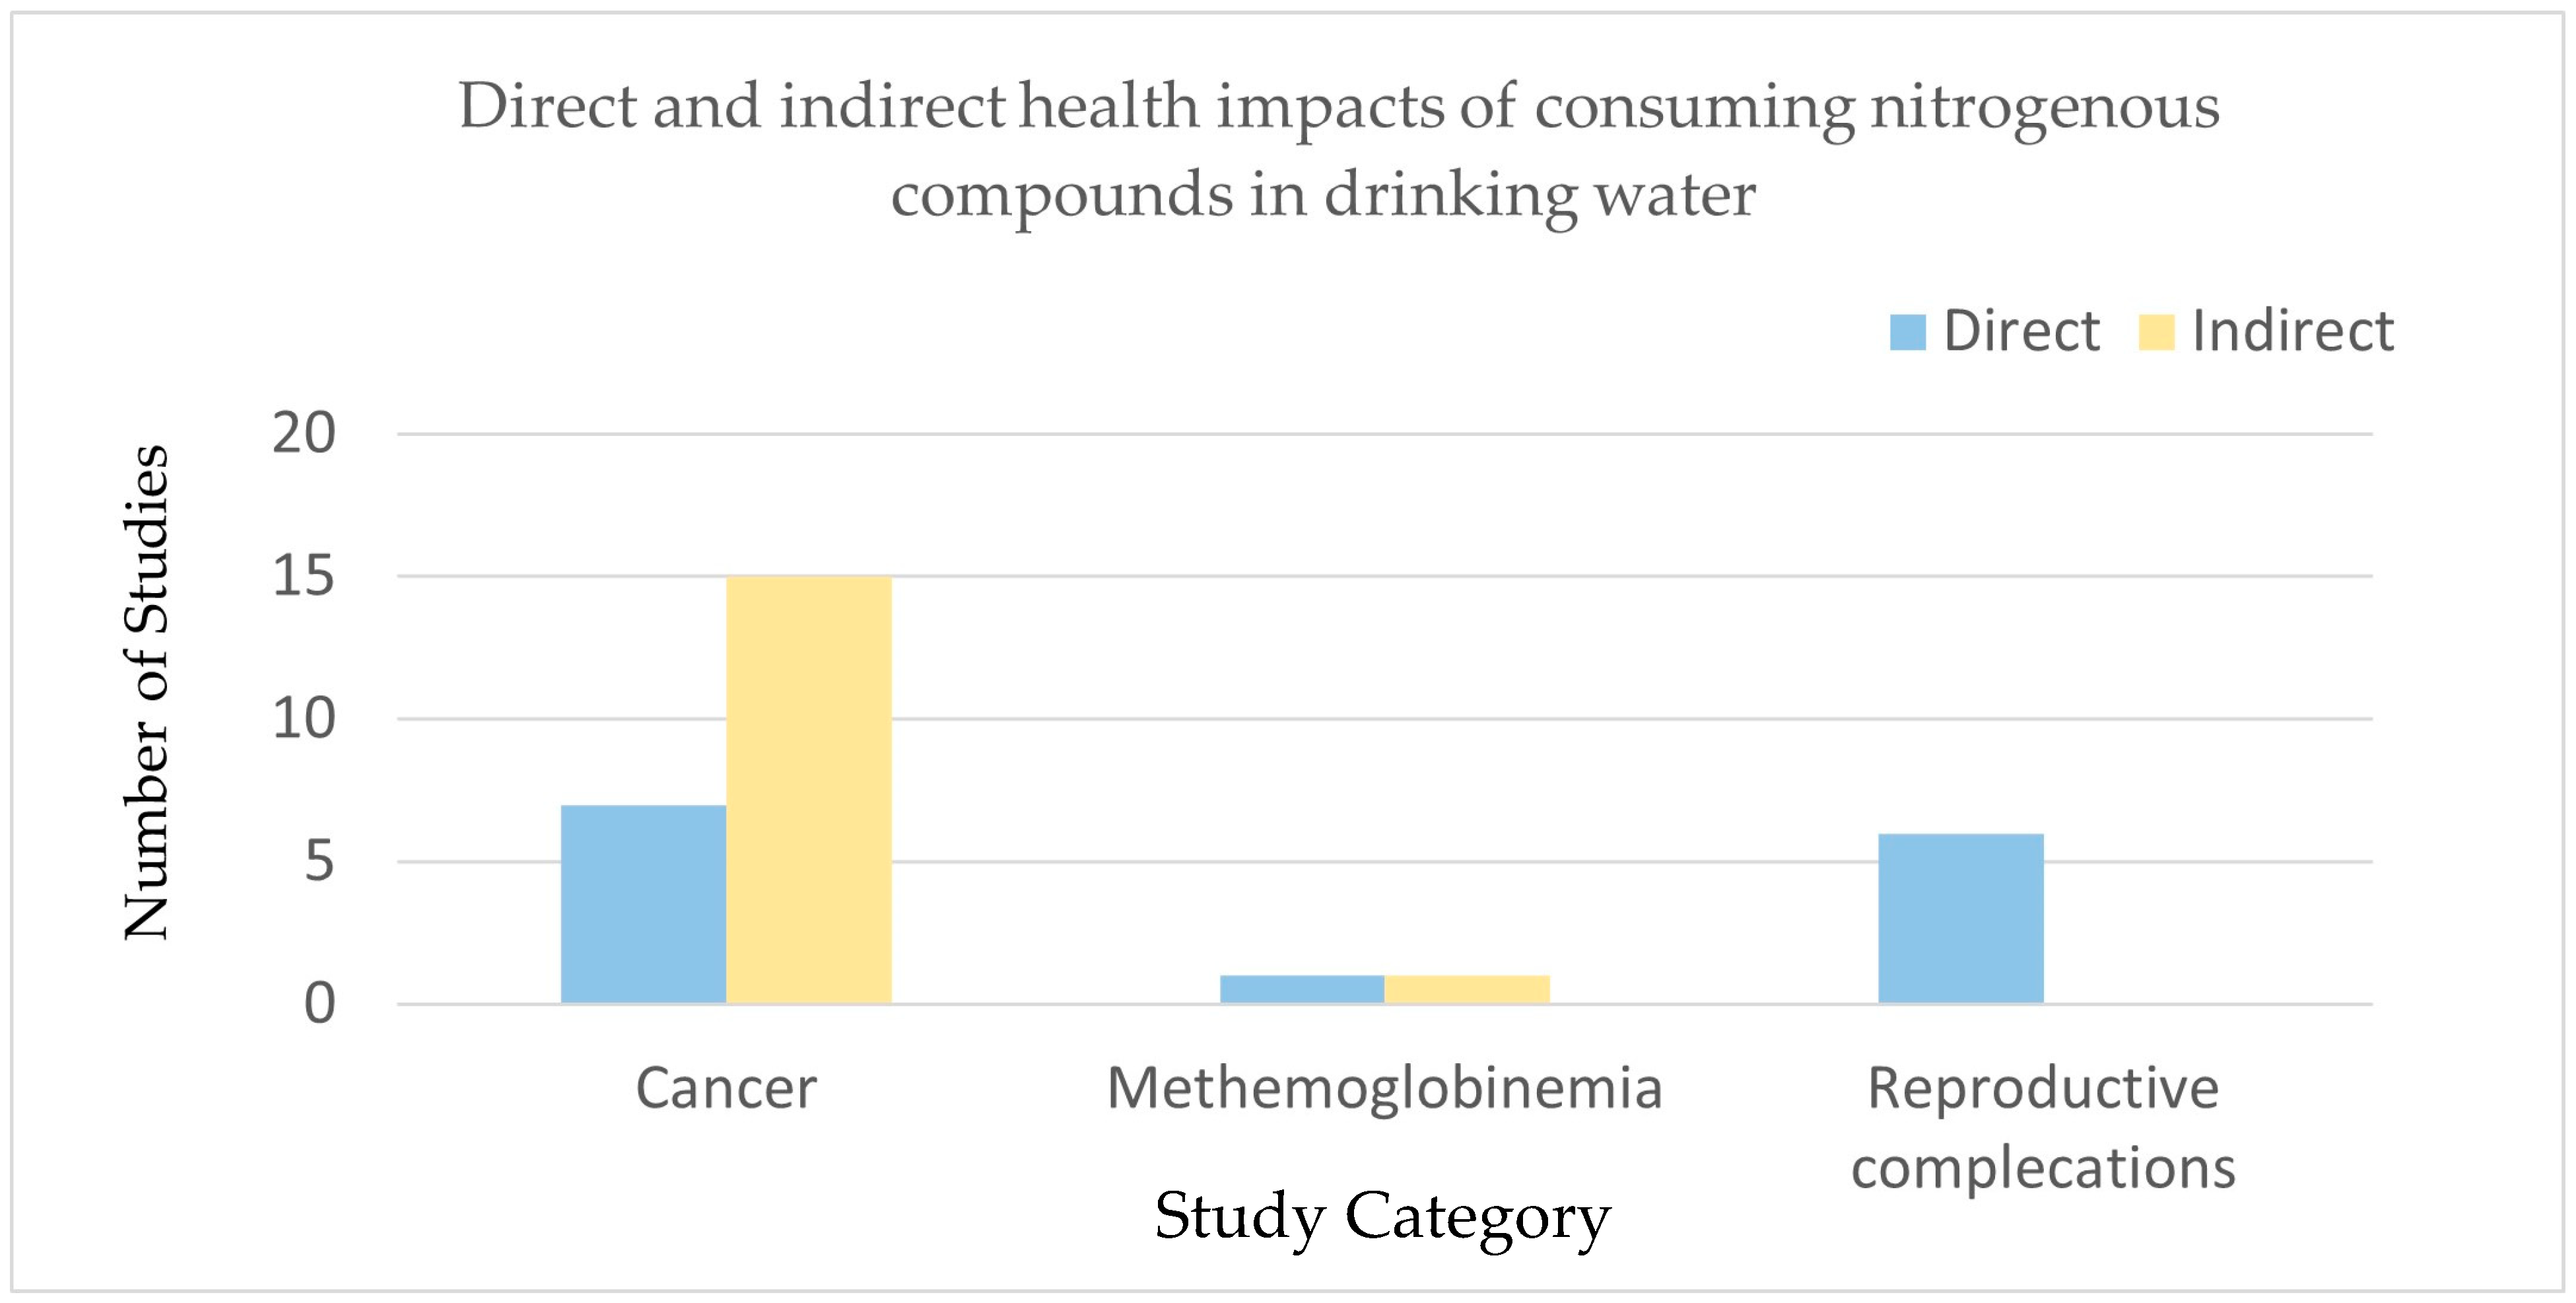
5.2. Health Effects of Nitrogenous Substances Produced by Nitrifying Bacteria

Nitrate and nitrite in drinking water can be harmful to human health and aquatic life. Based on the clinical evidence, nitrate levels in public drinking water standards are set to protect against methemoglobinemia. According to the National Library of Medicine (NIH), methemoglobinemia is a potentially life-threatening condition characterized by a reduced oxygen-carrying capacity of hemoglobin. According to an analysis of data from the Centers for Disease Control and Prevention (CDC), only 18 cases of methemoglobinemia (MetHb) were recorded between 1985 and 1990 (CDC, unpublished data, 1997).
Ingested nitrate is converted to nitrite by bacteria present in the mouth and stomach. Since the infant’s stomach is less acidic than that of adults, this environment facilitates the bacterial reduction of nitrate to nitrite, increasing the risk of methemoglobinemia. Infants under six months are more susceptible to MetHb. Risk factors for infant methemoglobinemia include the use of infant formula made with nitrate-contaminated water, the consumption of foods and medications containing high nitrate levels, and the presence of enteric infections (intestinal infections) [15].
However, other health effects, including cancer and adverse reproductive outcomes, were not considered. According to the guidelines of the World Health Organization, the maximum contaminant level (MCL) for nitrate and nitrate–nitrogen (NO3-N) is 50 mg/L and 11.3 mg/L, respectively. In endogenous nitrosation, nitrate acts as a precursor of the formation of N-nitroso compounds (NOC) [24], and exposure to NOC may result in cancer, birth defects, adverse reproductive outcomes, and other adverse health effects.
Nitrate from the drinking water is absorbed in the upper gastrointestinal tract and distributed throughout the human body. In the oral cavity, about 6–7% of nitrate is reduced to nitrite, mainly by nitrate-reducing bacteria. This nitrate and the nitrite produced in the mouth are swallowed and re-enter the gastrointestinal tract. In the stomach’s acidic environment, nitrite can be converted to nitrous acid (HNO2), which then forms dinitrogen trioxide (N2O3), nitric oxide (NO), and nitrogen dioxide (NO2); the related reactions are given in Equations (15)–(17).
NO2 + H+ ⇌ HNO2
2HNO2 → N2O3 + H2O
N2O3 → NO + NO2
However, some nitrate and nitrite metabolites, like nitrous acid, act as potent nitrosating agents, which can lead to the formation of N-nitroso compounds (NOCs) [7,15,16]. N-Nitroso compounds (NOCs) are a group of chemical compounds that include N-nitrosamines and N-nitrosamides. This process can be inhibited by dietary compounds like vitamins C and E, which can reduce nitrous acid (HNO2) to nitric oxide (NO). Animal studies indicated that N-nitroso compounds (NOC), potentially formed from nitrate, are potent carcinogens in multiple organs, including the bladder, colon, lymphatic system, and hematopoietic system, and likely also affect humans.
A case–control study in Nebraska found a twofold increase in the risk of non-Hodgkin lymphoma (NHL) among individuals exposed to nitrate levels in the highest quartile (4.0 mg/L nitrate-N) over 40 years [34]. However, evidence regarding the association between nitrate exposure and the non-Hodgkin lymphoma (NHL) risk remains inconclusive. For instance, a subsequent study in Iowa, conducted at similar exposure levels, reported no significant association [31]. These conflicting findings underscore the need for further research to better understand the potential role of long-term nitrate exposure in NHL development.
Ingested nitrate, often found in drinking water, inhibits the thyroid gland’s ability to take up iodide by binding to the sodium–iodide symporter (NIS) on thyroid follicle cells, which reduces the production of the essential thyroid hormones triiodothyronine (T3) and thyroxine (T4). Ward et al., 2018 [15], reported that women exposed to nitrate concentrations exceeding 5 mg/L NO3-N in public water supplies (PWSs) for more than ten years had a 2.6-fold increased risk of thyroid cancer compared to those with consistently lower exposure. Additionally, the risk of ovarian cancer remained elevated among women in the highest nitrate exposure quartile and among private well users relative to those with the lowest nitrate levels. According to Inoue-Choi et al., 2012 [18], no overall association was found between nitrate levels and the breast cancer risk. However, women with folate intake ≥400 µg/day showed an increased risk in the highest nitrate quintile and among private well users. According to Jones et al., 2017 [24], there was an increased risk of kidney cancer among women in the 95th percentile of nitrate exposure (>5.0 mg/L NO3-N), with a hazard ratio (HR) of 2.3. Ward et al., 2018 [15], reported that no association was found between water nitrate levels and the pancreatic cancer risk in both public water supply and private well users [46].
Total trihalomethanes (THMs) and haloacetic acids (HAA5), both regulated disinfection by-products, were not independently associated with the kidney cancer risk in the studied cohort [26]. However, Jones et al., 2017 [24], reported that elevated nitrate levels in public water supplies were linked to a higher risk of kidney cancer among postmenopausal women in Iowa. Specifically, women exposed to nitrate–nitrogen (NO3-N) concentrations exceeding half of the maximum contaminant level (MCL) had a 2.3 times increased risk of developing kidney cancer compared to those with lower exposure. Some studies investigated the relationship between nitrate in water and the outcomes of spontaneous abortions, stillbirths, premature birth [15], preterm delivery [28], and self-reported hypothyroidism or hyperthyroidism among post-menopausal women [33]. Table 4 presents the exposure and health consequences of nitrogenous compounds in drinking water.
Table 4. Exposure and health consequences of nitrogenous compounds in drinking water.
Diseases ReportedExposure DetailsYear of ReportingStudy AreaSummary of the FindingsReferences
CancerColorectal cancerNitrate exposure through drinking water and diet2008–2013Nine locations from Spain and two from ItalyA significant association between nitrate exposure (below 50 mg/L of nitrate) and the colorectal cancer risk.[47]
CancerBladder cancerNitrate exposure through drinking water and diet1986–2010Iowa, USAThe study identified 258 bladder cancer cases and found a significant association for women exposed to drinking water with >5 mg/L NO3N for ≥4 years.[26,32]
CancerBreast cancerWaterborne ingested nitrate and dietary ingested nitrate2008–2013Eight Spanish regionsNo overall association with waterborne ingested nitrate and breast cancer.[16]
CancerBreast cancerNitrate intake from drinking water and folate intake1986Iowa, USAThe results indicated that neither dietary nor water nitrate intake was significantly associated with the breast cancer risk when considering all participants. Among women with a high folate intake (≥400 µg/day), those exposed to elevated nitrate levels in public water had an increased risk of breast cancer (hazard ratio [HR] = 1.40), as did users of private well water (HR = 1.38).[18]
CancerKidney cancerNitrate intake from drinking water and DBPs1986–2010Iowa, USAThe study examined the association of nitrate and DBP exposure with the kidney cancer risk among older women. Women in the highest 95th percentile of average nitrate–nitrogen exposure had a significantly increased risk of kidney cancer. The study did not find any independent associations between total trihalomethanes (THMs), individual THMs (like chloroform and bromodichloromethane), or haloacetic acids (HAAs) and the kidney cancer risk.[24]
CancerThyroid cancer,
hyperthyroidism, and hypothyroidism
Nitrate in public water and dietary nitrate intake1986–2004Iowa, USAHigher nitrate levels in public water (>5 mg/L nitrate–nitrogen for ≤5 years) are associated with an increased thyroid cancer risk (RR = 2.6; 95% confidence interval (CI: 1.1–6.2).
Higher dietary nitrate intake (highest vs. lowest quartile) is also linked to an increased thyroid cancer risk (RR = 2.9; 95% CI: 1.0–8.1; P-trend = 0.046).
[13]
Increased dietary nitrate intake is associated with a higher prevalence of hypothyroidism (OR = 1.2; 95% CI: 1.1–1.4).
No significant association was found between nitrate exposure through public water or dietary intake and the prevalence of hyperthyroidism and hypothyroidism.
CancerBladder cancerLong-term nitrate exposure in public water supplies1986–1989Iowa, USANo significant association between bladder cancer and increasing nitrate levels in drinking water at the levels studied (up to 5.5 mg/L nitrate–nitrogen) (highest quartile OR: 0.8 for women, 0.5 for men).[32]
CancerColon CancerNitrate in public drinking water (Avg. >5 mg/L for >10 years)1986–1989Lowa, USANo significant association in the general population (odds ratio (OR) = 1.2 (95%), confidence interval [CI] = 0.9–1.6).
An increased risk was associated with low vitamin C intake (OR = 2.0, CI: 1.2–3.3) and high meat intake (OR = 2.2, CI: 1.4–3.6).
[48]
Rectal cancerNitrate in public drinking water (Avg. >5 mg/L for >10 years) No increased risk of rectal cancer with elevated nitrate exposure (OR = 1.1, CI: 0.7–1.5).
CancerNon-Hodgkin lymphoma (NHL)Nitrate exposure in drinking water (public supplies)1980–1984Minnesota, USAThe study did not find a statistically significant association between nitrate levels in drinking water and the risk of NHL (median of highest exposure category = 2.4 mg nitrate/L (range = 0.1–7.2 mg/L))[22]
CancerNon-Hodgkin lymphoma (NHL)Nitrate levels in drinking water (public supplies)1983–1986NebraskaAn increase in the risk of non-Hodgkin lymphoma among individuals exposed to nitrate levels in the highest quartile (4.0 mg/L nitrate-N) over 40 years.[34]
CancerGastric cancerNitrate and nitrite intake from food and water1986–1992The NetherlandsNo significant association was found between dietary nitrate intake and the gastric cancer risk (rate ratio (RR) highest/lowest quintile = 0.80, 95% CI 0.47–1.37).
The study did not find a risk of gastric cancer among people with a higher nitrate intake from drinking water (RR highest/lowest quintile = 0.88, 95% Cl 0.59–1.32, trend-P = 0.39) or a higher intake of nitrite
(RR highest/lowest quintile = 1.44, 95% Cl 0.95–2.18, trend-P = 0.24).
[30]
CancerBrain tumorsNitrate levels in drinking water (public supplies)1987–1988GermanyThe study found no statistically significant association between nitrate levels in drinking water and the risk of primary brain tumors.[29]
CancerBrain cancer 1988–1993USA
66 counties in eastern Nebraska
No association between long-term average nitrate levels in public water supplies (PWSs) and adult brain cancer[31]
CancerOvarian cancer There were positive associations with ovarian cancer (RR = 1, 1.52, 1.81, and 1.84)[36]
Uterine cancerNitrate in drinking water1986–1998USAThere were inverse associations with uterine cancer (RR = 1, 0.86, 0.86
and 0.55).
Rectal cancerThere were inverse associations with rectal cancer (RR = 1, 0.72, 0.95, and 0.471).
Non-Hodgkin lymphoma, leukemia, melanoma, colon cancer, breast cancer, lung cancer, rectal cancer, pancreatic cancer, kidney cancerThere were no associations with
increasing nitrate levels in drinking water.
CancerBladder cancerNitrate exposure from food, drinking water, and total estimated nitrate exposureAfter 9 years of follow-up from 1986The NetherlandsNo significant association between nitrate intake and the bladder cancer risk. Multivariate RRs for the highest vs. lowest quintiles were 1.06 (95% CI, 0.81–1.31) for food, 1.06 (95% CI, 0.82–1.37) for drinking water, and 1.09 (95% CI, 0.84–1.42) for total nitrate exposure.[37]
CancerChildhood brain tumors (CBTs)Household water source (well water vs. public water) and nitrate/nitrite levels in residential water 836 CBT cases and 1485 controls from five countries.The CBT risk did not increase with increasing nitrate levels.
The astrocytoma risk was associated with higher nitrite levels (odds ratio [OR] = 4.3, 95% CI: 1.4, 12.6 for nitrite levels of 1–<5 mg/L nitrite ion; OR = 5.7, 95% CI: 1.2, 27.2 for nitrite > or =5 mg/L).
[27]
CancerRenal cell carcinomaNitrate in public water supplies (levels of 5 mg/L and 10 mg/L or higher) and dietary nitrate and nitrite intake1986–1989Iowa, USANo overall association with renal cell carcinoma for average nitrate levels or years of exposure to public water supplies >5 and >10 mg/L nitrate–nitrogen (10+ years >5 mg/L odds ratio (OR) = 1.03, 95% confidence interval (CI) 0.66, 1.60).[35]
MethemoglobinemiaOxygen transport impairmentNitrate/nitrite in drinking water (>10 mg/L NO3-N)Since 1941 High nitrate intake (>10 mg/L NO3-N) can cause methemoglobinemia (blue baby syndrome) in infants, impairing oxygen transport. Infants under 6 months are most vulnerable due to immature enzyme systems.[21]
Reproductive toxicityFetal
growth restriction, lower birth weights
Nitrate/nitrite exposure in drinking waterAnimal studies indicate potential reproductive toxicity, with nitrate/nitrite linked to fetal malformations and reduced fertility. However, human data are limited and inconclusive.
The evidence from animal models suggests developmental toxicity, including birth defects and growth retardation, at high doses. Human epidemiological studies show inconsistent results.
Pregnancy related issuesPreterm delivery and low birth weightNitrate and atrazine exposure through drinking water2004–200846 counties in four Midwestern states (Ohio, Indiana, Iowa, and Missouri)Neither atrazine nor nitrate exposure was associated with an increased risk of term low birth weight (LBW).
Nitrate exposure was significantly associated with increased rates of VPTD (very preterm delivery)
(RR1ppm = 1.08, 95% CI: 1.02, 1.15) and very low birth weight (VLBW)
(RR1ppm = 1.17, 95% CI: 1.08, 1.25).
[28]
Pregnancy complicationsNeural tube defects (NTDs)Prenatal nitrate exposure through drinking water1997–2005Iowa and TexasA significant association was found between high prenatal nitrate intake and neural tube defects.[49]
Spina bifidaPrenatal nitrate intake (≥5.42 mg/day from drinking water)Mothers of babies with spina bifida were 2.0 times more likely (95% CI: 1.3–3.2) to consume ≥5 mg nitrate daily compared to <0.91 mg.
Limb deficiencyMothers were 1.8 times more likely (95% CI: 1.1–3.1) to consume ≥5.42 mg nitrate daily during the critical period (1 month preconception to the first trimester) compared to <1.0 mg.
Cleft palateThe risk of cleft palate was 1.9 times higher (95% CI: 1.2–3.1) for mothers consuming ≥5.42 mg nitrate daily compared to <1.0 mg.
Cleft lipMothers were 1.8 times more likely (95% CI: 1.1–3.1) to consume ≥5.42 mg nitrate daily compared to <1.0 mg.
MethemoglobinemiaInfant methemoglobinemiaBreastfeeding mothers ingesting water with a nitrate content up to 100 ppmNot specifiedUnited StatesNo significant increase in the nitrate concentration in breast milk, even with a high maternal intake of nitrate.
Breastfeeding infants are not at risk of methemoglobinemia.
[23]
Figure 3 summarizes studies examining the direct and indirect health effects of consuming nitrogenous compounds such as nitrates, nitrites, and nitrogenous disinfection by-products (N-DBPs) in drinking water. The findings indicate that exposure to these substances can lead to both direct and indirect impacts on health, including cancer, methemoglobinemia, and reproductive complications. Among the health outcomes assessed, cancer and reproductive issues exhibited the highest risk of direct effects from these compounds.

6. Control Measures

Monitoring water quality parameters can aid in the early detection of nitrification [5,17,42,50,51]. However, no single parameter change definitively indicates the onset of nitrification. Instead, multiple parameters must be evaluated collectively to determine the presence and extent of nitrification accurately.

6.1. Breakpoint Chlorination

Many papers highlighted that breakpoint chlorination can be effectively employed as a control measure to manage nitrification in water systems [5,40,42]. The breakpoint chlorination curve is shown in Figure 4. Breakpoint chlorination offers the advantage of producing free chlorine, which readily combines with free ammonia, thereby limiting nitrification by-products [42] and maintaining an adequate disinfectant residual throughout the distribution system. Periodic breakpoint chlorination (BPC) treatments, which involve switching from chloramine to free chlorine, temporarily reduce nitrification and precursor levels for NDMA and other N-DBPs. However, while BPC controls nitrification, it encourages the formation of halogenated DBPs like trihalomethanes (THMs) and haloacetic acids (HAAs), indicating a trade-off in controlling different DBP types [40]. Hossain et al., 2022 [5], reported that to minimize the formation of N-DBPs, breakpoint chlorination must be applied after removing the DBP precursors. Also, prolonged use of breakpoint chlorination may lead to a higher heterotrophic plate count (HPC) [42] and coliform growth due to chlorine’s limited effectiveness in disinfecting particle-associated bacteria and penetrating biofilms [2,7].

6.2. Nitrification Monitoring and Control Plan

A robust Nitrification Monitoring and Control Plan (NMCP), which includes identifying critical sampling locations, monitoring key parameters such as monochloramine, total chlorine, free ammonia, pH, nitrite, and nitrate levels, and establishing specific action levels for corrective measures, is important. First, sampling locations within the treatment and distribution systems must be identified to monitor chloramine residuals and detect nitrification. Second, it should specify the parameters to be monitored, such as total chlorine, monochloramine, free ammonia, nitrite, and pH, along with their respective sampling frequencies. Third, the plan should establish the goals, trigger levels, and action levels for these parameters to guide operational responses [50]. If any parameter exceeds its designated trigger or action level, the NMCP must outline corrective actions to be taken, which may include adjusting chemical dosages or flushing affected areas [50]. Additionally, a communication plan is vital for notifying customers and relevant authorities about any nitrification-related issues [5,17].

6.3. American Water Works Association (AWWA) Manual M56

The American Water Works Association (AWWA) Manual M56, Nitrification Prevention and Control in Drinking Water, describes practical approaches to nitrification prevention and response to monitoring and control criteria for chlorinated drinking water distribution systems [1]. It includes significant monitoring criteria such as chlorine residuals, ammonia, nitrite, nitrate, pH, temperature, and HPC with a highest-level total chlorine residual disinfectant level (MRDL) of 4.0 mg/L. The Monitoring and Control Plan on Nitrification (NMCP) includes key sampling points, frequencies according to special requirements, and assigned levels for correcting potential problems. Some studies have shown that developing and implementing a Nitrification Action Plan or Nitrification Control Plan is essential for public water systems using chloramines as a disinfectant. Periodic system flushing and pipeline cleaning also minimize risks. Regular cleaning and repairs can mitigate the age-related impact on microbial growth [5,17,51].
Poorly designed tanks may not allow for complete emptying, leading to stagnant water or sediment accumulation at the bottom. This creates an environment conducive to microbial growth and biofilm formation [27,42,44]. As such, proper tank design is crucial not only for efficient maintenance but also for preserving water quality. Underground or shaded tanks tend to maintain more stable temperatures, which can help slow down the nitrification process [40,45,50]. However, user behavior also significantly influences nitrification within household water storage systems [27]. Infrequent cleaning can lead to biofilm buildup on tank walls and internal surfaces, providing an ideal habitat for nitrifying bacteria [42,45]. Preventative measures, such as keeping tanks covered to block debris, ensuring adequate ventilation to limit oxygen levels, and maintaining water circulation, can help reduce conditions favorable to nitrification. Sediment, often composed of organic matter, rust, and debris, can trap ammonia and other nutrients, creating a nutrient-rich microenvironment that supports microbial and biofilm growth. These sediments also impede water flow at the tank’s bottom, leading to low-oxygen or anaerobic zones, which further influence microbial activity and water chemistry [45].

7. Conclusions

This systematic review examines the critical roles that nitrifying bacteria and biofilm formation play in compromising the quality and safety of drinking water within distribution networks and storage tanks. The occurrence and proliferation of these microorganisms are influenced by a complex interplay of environmental, operational, and microbial factors, which can vary significantly across different segments of DWDNs.
In developing regions with tropical climates, elevated temperatures, aging infrastructure, and inadequate maintenance practices promote microbial growth and biofilm development in NWDNs and storage tanks, further intensifying the risks associated with nitrification. Furthermore, the limited understanding of microbial diversity and behavior in these environments represents a significant knowledge gap.
This review highlights how unchecked nitrification not only accelerates infrastructure degradation but also contributes to the formation of nitrogenous disinfection by-products (N-DBPs), posing potential threats to public health. Although the global evidence links nitrifying bacteria to water quality deterioration and health risks, there is a notable lack of epidemiological data from tropical regions. Despite advances in monitoring and control strategies, the current approaches remain inadequate in fully addressing the challenges posed by nitrifying bacteria, especially under tropical conditions.
To safeguard water quality and public health, there is an urgent need for region-specific research that deepens our understanding of nitrifying microbial ecology in tropical systems. This includes developing robust, proactive management strategies, protecting surface water bodies, promoting proper disinfection practices, integrating advanced detection technologies, and fostering cross-disciplinary collaboration. Public health education and awareness campaigns are also essential for supporting these efforts. Ultimately, addressing these challenges will be key to enhancing the resilience and sustainability of drinking water infrastructure in tropical and other vulnerable regions.

Author Contributions

Conceptualization and assisting with writing and editing, W.G.; literature search and initial manuscript writing, A.N.E.; supervision during manuscript preparation and revising, R.W. All authors have read and agreed to the published version of the manuscript.

Funding

This research received no funding.

Data Availability Statement

No new data were created or analyzed in this study.

Acknowledgments

The authors are grateful to all the researchers of the previous studies cited in this review for their invaluable contributions to providing an improved understanding of nitrifying bacterial growth in drinking water distribution systems and related public health risks.

Conflicts of Interest

The authors declare that there are no conflicts of interest.

Abbreviations

The following abbreviations are used in this manuscript:
AOBAmmonia-oxidizing bacteria
NOBNitrite-oxidizing bacteria
DWDNDrinking water distribution networks
NDBPsNitrogenous disinfection by-products
DBPDisinfection by-products
PRISMAPreferred Reporting Items for Systematic Reviews and Meta-Analyses
TTHMsTotal trihalomethanes
TPTotal phosphorus
NMCPNitrification Monitoring and Control Plan
AWWAAmerican Water Works Association
NMCPMonitoring and Control Plan on Nitrification
TRCTotal residual chlorine
NDMAN-nitrosodimethylamine
HANsHaloacetonitriles
HAcAmsHaloacetamides
CNXCyanogen halides
HNMsHalonitromethanes
WHOWorld Health Organization
BPCPeriodic breakpoint chlorination

References

  1. AWWA. Nitrification; U.S. Environmental Protection Agency (EPA). 2002. Available online: https://www.epa.gov/sites/default/files/2015-09/documents/nitrification_1.pdf (accessed on 15 August 2002).
  2. Cruz, M.C.; Woo, Y.; Flemming, H.C.; Wuertz, S. Nitrifying Niche Differentiation in Biofilms from Full-Scale Chloraminated Drinking Water Distribution System. Water Res. 2020, 176, 115738. [Google Scholar] [CrossRef] [PubMed]
  3. Cunliffe, D.A. Bacterial Nitrification in Chloraminated Water Supplies. Appl. Environ. Microbiol. 1991, 57, 3399–3402. [Google Scholar] [CrossRef] [PubMed] [PubMed Central]
  4. Lipponen, M.T.; Suutari, M.H.; Martikainen, P.J. Occurrence of Nitrifying Bacteria and Nitrification in Finnish Drinking Water Distribution Systems. Water Res. 2002, 36, 4319–4329. [Google Scholar] [CrossRef]
  5. Hossain, S.; Chow, C.W.; Hewa, G.A. Review of Nitrification Monitoring and Control Strategies in Drinking Water System. Int. J. Environ. Res. Public Health 2022, 19, 4003. [Google Scholar] [CrossRef]
  6. Scott, D.B.; Van Dyke, M.I.; Anderson, W.B.; Huck, P.M. Influence of Water Quality on Nitrifier Regrowth in Two Full-Scale Drinking Water Distribution Systems. Can. J. Microbiol. 2015, 61, 965–976. [Google Scholar] [CrossRef]
  7. Erdei-Tombor, P.; Kiskó, G.; Taczman-Brückner, A. Biofilm Formation in Water Distribution Systems. Processes 2024, 12, 280. [Google Scholar] [CrossRef]
  8. Lipponen, M.T.; Martikainen, P.J.; Vasara, R.E.; Servomaa, K.; Zacheus, O.; Kontro, M.H. Occurrence of Nitrifiers and Diversity of Ammonia-Oxidizing Bacteria in Developing Drinking Water Biofilms. Water Res. 2004, 38, 4424–4434. [Google Scholar] [CrossRef]
  9. Regan, J.M.; Harrington, G.W.; Noguera, D.R. Ammonia- and Nitrite-Oxidizing Bacterial Communities in a Pilot-Scale Chloraminated Drinking Water Distribution System. Appl. Environ. Microbiol. 2002, 68, 73–81. [Google Scholar] [CrossRef]
  10. Bal Krishna, K.C.; Sathasivan, A. Effect of Silver in Severely Nitrified Chloraminated Bulk Waters. Water Sci. Technol. Water Supply 2012, 12, 415–421. [Google Scholar] [CrossRef]
  11. Liu, X.; Liu, H.; Ding, N. Chloramine Disinfection-Induced Nitrification Activities and Their Potential Public Health Risk Indications within Deposits of a Drinking Water Supply System. Int. J. Environ. Res. Public Health 2020, 17, 772. [Google Scholar] [CrossRef]
  12. Regan, J.M.; Harrington, G.W.; Noguera, D.R. Diversity of Nitrifying Bacteria in Full-Scale Chloraminated Distribution Systems. Water Res. 2003, 37, 197–205. [Google Scholar] [CrossRef] [PubMed]
  13. Ward, M.H.; Kilfoy, B.A.; Weyer, P.J.; Anderson, K.E.; Folsom, A.R.; Cerhan, J.R. Nitrate Intake and the Risk of Thyroid Cancer and Thyroid Disease. Epidemiology 2010, 21, 389–395. [Google Scholar] [CrossRef] [PubMed]
  14. Rungvetvuthivitaya, M.; Song, R.; Campbell, M.; Ray, C. A Kinetic Study of Nitrification Inhibition in Water Distribution Systems Using Low Levels of Chlorite. J. Water Supply Res. Technol. AQUA 2014, 63, 497–506. [Google Scholar] [CrossRef]
  15. Ward, M.H.; Jones, R.R.; van Breda, S.G. Drinking Water Nitrate and Human Health: An Updated Review. Int. J. Environ. Res. Public Health 2018, 15, 1557. [Google Scholar] [CrossRef]
  16. Espejo-Herrera, N.; Gracia-Lavedan, E.; Pollan, M.; Aragonés, N.; Boldo, E.; Perez-Gomez, B.; Altzibar, J.M.; Amiano, P.; Zabala, A.J.; Ardanaz, E.; et al. Ingested Nitrate and Breast Cancer in the Spanish Multicase-Control Study on Cancer (MCC-Spain). Environ. Health Perspect. 2016, 124, 1042–1049. [Google Scholar] [CrossRef]
  17. Harrington, G.W.; Noguera, D.R.; Vanhoven, D.J. Pilot-Scale Evaluation of Nitrification Control Strategies. J. Am. Water Works Assoc. 2002, 94, 78–89. [Google Scholar] [CrossRef]
  18. Inoue-Choi, M.; Ward, M.H.; Robien, K. Interaction of Nitrate and Folate on the Risk of Breast Cancer among Postmenopausal Women. Nutr. Cancer 2012, 64, 685–694. [Google Scholar] [CrossRef]
  19. Wolfe, R.L.; Lieu, N.I.; Means, E.G. Ammonia-Oxidizing Bacteria in a Chloraminated Distribution System: Seasonal Occurrence, Distribution, and Disinfection Resistance. Appl. Environ. Microbiol. 1990, 56, 451–462. [Google Scholar] [CrossRef]
  20. Bond, T.; Templeton, M.R.; Graham, N. Precursors of Nitrogenous Disinfection By-Products in Drinking Water—A Critical Review and Analysis. J. Hazard. Mater. 2012, 235–236, 1–16. [Google Scholar] [CrossRef] [PubMed]
  21. Fan, A.M.; Steinberg, V.E. Health Implications of Nitrate and Nitrite in Drinking Water: An Update on Methemoglobinemia Occurrence and Reproductive and Developmental Toxicity. Regul. Toxicol. Pharmacol. 1996, 23, 35–43. [Google Scholar] [CrossRef]
  22. Freedman, D.M.; Cantor, K.P.; Helzlsouer, K.J. A Case-Control Study of Nitrate in Drinking Water and Non-Hodgkin’s Lymphoma in Minnesota. Arch. Environ. Health 2000, 55, 326–329. [Google Scholar] [CrossRef] [PubMed]
  23. Greer, F.R.; Shannon, M. Infant Methemoglobinemia: The Role of Dietary Nitrate in Food and Water. Pediatrics 2005, 116, 784–786. [Google Scholar] [CrossRef] [PubMed]
  24. Jones, R.R.; Weyer, P.J.; Ward, M.H. Ingested Nitrate, Disinfection By-Products, and Kidney Cancer Risk in Older Women. Epidemiology 2017, 28, 703–711. [Google Scholar] [CrossRef]
  25. Jones, R.R.; Weyer, P.J.; Ward, M.H. Nitrate from Drinking Water and Diet and Bladder Cancer among Postmenopausal Women in Iowa. Environ. Health Perspect. 2016, 124, 1751–1758. [Google Scholar] [CrossRef]
  26. Krasner, S.W. The Formation and Control of Emerging Disinfection By-Products of Health Concern. Philos. Trans. R. Soc. A 2009, 367, 4077–4095. [Google Scholar] [CrossRef]
  27. Mueller, B.A.; Nielsen, S.S.; Preston-Martin, S.; Holly, E.A.; Cordier, S.; Filippini, G.; Peris-Bonet, R.; Choi, N.W. Household Water Source and the Risk of Childhood Brain Tumours: Results of the SEARCH International Brain Tumor Study. Int. J. Epidemiol. 2004, 33, 1209–1216. [Google Scholar] [CrossRef]
  28. Stayner, L.T.; Almberg, K.; Turyk, M. Atrazine and Nitrate in Drinking Water and the Risk of Preterm Delivery and Low Birth Weight in Four Midwestern States. Environ. Res. 2017, 152, 294–303. [Google Scholar] [CrossRef]
  29. Steindorf, K.; Schlehofer, B.; Wahrendorf, J. Nitrate in Drinking Water: A Case-Control Study on Primary Brain Tumors with an Embedded Drinking Water Survey in Germany. Int. J. Epidemiol. 1994, 23, 451–457. [Google Scholar] [CrossRef]
  30. Van Loon, A.J.M.; Botterweck, A.A.M.; Goldbohm, R.A.; Brants, H.A.M.; Van Klaveren, J.D.; Van den Brandt, P.A. Intake of Nitrate and Nitrite and the Risk of Gastric Cancer: A Prospective Cohort Study. Br. J. Cancer 1998, 78, 129–135. [Google Scholar] [CrossRef]
  31. Ward, M.H.; Cantor, K.P.; Cerhan, J.; Lynch, C.F.; Hartge, P. Nitrate in Public Water Supplies and Risk of Cancer: Results from Recent Studies in the Midwestern United States. Epidemiology 2004, 15, S214. [Google Scholar] [CrossRef]
  32. Ward, M.H.; Cantor, K.P.; Riley, D.; Merkle, S.; Lynch, C.F. Nitrate in Public Water Supplies and Risk of Bladder Cancer. Epidemiology 2003, 14, 183–190. [Google Scholar] [CrossRef] [PubMed]
  33. Ward, M.H.; deKok, T.M.; VanDerslice, J. Workgroup Report: Drinking-Water Nitrate and Health—Recent Findings and Research Needs. Environ. Health Perspect. 2005, 113, 1607–1614. [Google Scholar] [CrossRef] [PubMed]
  34. Ward, M.H.; Mark, S.D.; Cantor, K.P.; Weisenburger, D.D.; Correa-Villasenor, A.; Zahm, S.H. Drinking Water Nitrate and the Risk of Non-Hodgkin’s Lymphoma. Epidemiology 1996, 7, 465–471. Available online: https://pubmed.ncbi.nlm.nih.gov/8862975/ (accessed on 1 September 1996). [CrossRef] [PubMed]
  35. Ward, M.H.; Rusiecki, J.A.; Lynch, C.F.; Cantor, K.P. Nitrate in Public Water Supplies and the Risk of Renal Cell Carcinoma. Cancer Causes Control 2007, 18, 1141–1151. [Google Scholar] [CrossRef]
  36. Weyer, P.J.; Cerhan, J.R.; Kross, B.C.; Hallberg, G.R.; Kantamneni, J.; Breuer, G.; Jones, M.P.; Zheng, W.; Lynch, C.F. Municipal Drinking Water Nitrate Level and Cancer Risk in Older Women: The Iowa Women’s Health Study. Epidemiology 2001, 12, 327–338. [Google Scholar] [CrossRef]
  37. Zeegers, M.P.; Selen, R.F.; van den Brandt, P.A. Nitrate Intake Does Not Influence Bladder Cancer Risk: The Netherlands Cohort Study. Environ. Health Perspect. 2006, 114, 1527–1531. [Google Scholar] [CrossRef]
  38. Liew, D.; Linge, K.L.; Joll, C.A. Formation of Nitrogenous Disinfection By-Products in 10 Chlorinated and Chloraminated Drinking Water Supply Systems. Environ. Monit. Assess. 2016, 188, 518. [Google Scholar] [CrossRef]
  39. Shen, Y. Formation of Nitrogenous Disinfection By-Products (N-DBPs) in Drinking Water: Emerging Concerns and Current Issues. IOP Conf. Ser. Earth Environ. Sci. 2021, 801, 012015. [Google Scholar] [CrossRef]
  40. Zeng, T.; Mitch, W.A. Impact of Nitrification on the Formation of N-Nitrosamines and Halogenated Disinfection Byproducts within Distribution System Storage Facilities. Environ. Sci. Technol. 2016, 50, 2964–2973. [Google Scholar] [CrossRef]
  41. Kimbrough, D.E. Impact of Local Climate Change on Drinking Water Quality in a Distribution System. Water Qual. Res. J. 2019, 54, 179–192. [Google Scholar] [CrossRef]
  42. Odell, L.H.; Kirmeyer, G.J.; Wilczak, A.; Jacangelo, J.G.; Marcinko, J.P.; Wolfe, R.L. Controlling Nitrification in Chloraminated Systems. J. Am. Water Works Assoc. 1996, 88, 86–98. [Google Scholar] [CrossRef]
  43. Sarker, D.C.; Patel, C.M.; Anwar, A.H. Evaluation of Zinc and Copper for Co-Inhibition of Nitrification in Mild Nitrified Drinking Water. J. Environ. Chem. Eng. 2018, 6, 2939–2943. [Google Scholar] [CrossRef]
  44. OSD, H.B.; Prasad, G.V.K.S.V.; Al-Fatlawy, R. Effect of Water Storage Tank Material on Quality of Water with Storage Period. In E3S Web of Conferences; EDP Sciences: Paris, France, 2024; Volume 529, p. 03010. [Google Scholar] [CrossRef]
  45. Manga, M.; Ngobi, T.G.; Okeny, L.; Acheng, P.; Namakula, H.; Kyaterekera, E.; Nansubuga, I.; Kibwami, N. The Effect of Household Storage Tanks/Vessels and User Practices on the Quality of Water: A Systematic Review of Literature. Environ. Syst. Res. 2021, 10, 18. [Google Scholar] [CrossRef]
  46. Coss, A.; Cantor, K.P.; Ward, M.H. Pancreatic Cancer and Drinking Water and Dietary Sources of Nitrate and Nitrite. Am. J. Epidemiol. 2004, 159, 693–701. [Google Scholar] [CrossRef]
  47. Espejo-Herrera, N.; Gràcia-Lavedan, E.; Villanueva, C.M. Colorectal Cancer Risk and Nitrate Exposure through Drinking Water and Diet. Int. J. Cancer 2016, 139, 334–346. [Google Scholar] [CrossRef]
  48. De Roos, A.J.; Ward, M.H.; Lynch, C.F.; Cantor, K.P. Nitrate in Public Water Supplies and the Risk of Colon and Rectum Cancers. Epidemiology 2003, 14, 640–649. [Google Scholar] [CrossRef] [PubMed]
  49. Brender, J.D.; Weyer, P.J.; Canfield, M.A. Prenatal Nitrate Intake from Drinking Water and Selected Birth Defects in Offspring of Participants in the National Birth Defects Prevention Study. Environ. Health Perspect. 2013, 121, 1083–1089. [Google Scholar] [CrossRef]
  50. New Hampshire Department of Environmental Services (NHDES) of Drinking Water and Groundwater Bureau (DWGB). Controlling Nitrification in Chloraminated Drinking Water Supplies: Guidance Document and Nitrification Monitoring and Control Plan Template; Drinking Water and Groundwater Bureau (DWGB): Concord, New Hampshire, USA, 2021. Available online: https://www.des.nh.gov/sites/g/files/ehbemt341/files/documents/wd-21-02.pdf (accessed on 21 January 2021).
  51. Fleming, K.; Harrington, G.W.; Noguera, D.R. Nitrification Potential Curves: A New Strategy for Nitrification Prevention. J. Am. Water Works Assoc. 2005, 97, 6. [Google Scholar] [CrossRef]
Figure 1. Article selection process for the current systematic review.
Bacteria 04 00033 g001
Figure 2. A schematic illustration of biofilms within the distribution pipeline (source: illustrated by the authors).
Bacteria 04 00033 g002
Figure 3. Summary of the relevant studies on the direct and indirect health impacts of consuming nitrogenous compounds in drinking water. The relevant publications span from 1990 to 2024 (source: illustrated by the authors).
Bacteria 04 00033 g003
Figure 4. Breakpoint chlorination curve [5].
Bacteria 04 00033 g004
Table 1. Biochemical reactions and microorganisms involved in the nitrification and denitrification process.
Reactions InvolvedResponsible BacteriaReaction Description
NH3 + O2 → NO2 + 3H+ + 2eAOBAmmonia oxidation process (the first step of nitrification that converts ammonia into nitrite)
NO2 + H2O → NO3 + 2H+ +2eNOBNitrite oxidation process (second step of nitrification)
NH4+ + NO2 → N2 + 2H2OAnammox bacteriaAnaerobic ammonium oxidation (anammox process)
Disclaimer/Publisher’s Note: The statements, opinions and data contained in all publications are solely those of the individual author(s) and contributor(s) and not of MDPI and/or the editor(s). MDPI and/or the editor(s) disclaim responsibility for any injury to people or property resulting from any ideas, methods, instructions or products referred to in the content.

