1. Introduction
The placenta is a truly unique and remarkable organ. It performs a multitude of functions to not only support the growth needs of the developing fetus but also simultaneously grows and matures itself across the course of pregnancy. This entails a complex interplay of cellular development, endocrine activity, immune function, and many other factors that influence early establishment of the feto-placental unit [
1]. As a waste product of pregnancy, the delivered placenta has been studied for decades, and many fundamental aspects of pregnancy biology have been revealed from post-delivery assessments. Conventional methods such as gross review, histology, immunohistochemistry, and stereology provide insights into the structural component of placental development. Molecular analyses of preserved tissue are informative of gene and protein function, and culture methods can add to the experimental assessment of placental function. These methods include short- and longer-term explant culture [
2], primary cell isolations grown in two-dimensional culture [
3], and technologies such as organ-on-a-chip and microfluidics [
4]. However, recognition of the importance of early gestation developmental events in pregnancy outcome and offspring health in later life has focused recent attention towards understanding the functional roles of the placenta during the first trimester.
It is well known that appropriate placentation and early establishment of a strong foundation are essential for pregnancy success. The numerous maternal and fetal cell types that comprise the uteroplacental interface make understanding the phenotypic properties and the intricacies between the diverse cell populations uniquely challenging. In early placental development, trophoblast cells, a specialized placental stem cell, differentiate into several subtypes with different anatomical and functional features [
5]. There are two primary types: extravillous trophoblast cells (EVTs) invade the maternal spiral arteries, anchor the placenta in the decidua, and are critical for forming a strong vascular foundation for a fully functioning placenta. The syncytiotrophoblast (SYN) is a multinucleated epithelium that serves as the maternal–fetal exchange interface, and importantly, it is the immune barrier for fetal protection [
5]. Trophoblast cell differentiation events predominantly take place during the first trimester; therefore, this is a critical period of vulnerability to adverse stimuli for the developing placenta and subsequent impacts on the fetus. However, despite the importance of the first trimester period, understanding the regulation of trophoblast cell lineage specification and differentiation has been partially hindered by the lack of appropriate cellular model systems and access to placental tissue from early gestation. Hence, there is growing interest in new methodologies and models to assess early placental function [
6,
7].
Several approaches can be taken: The use of in vivo imaging permits longitudinal assessments [
8,
9] but not direct tissue sampling. Biomarker studies, such as blood, urine, or extracellular vesicle analysis, have utility in identifying pathological pregnancies, which are likely attributed to placental dysfunction but are typically not mechanistic in nature. In vitro alternatives exist but can face challenges with respect to tissue accessibility and sampling. Specifically, there has been significant interest in the generation of first-trimester placental trophoblast organoid (TO) model systems. Organoids are self-organizing and propagating three-dimensional culture models that are derived from stem cells. Using growth factors to provide developmental cues, these stem cells can be directed to grow ex vivo into mini structures that recapitulate the structural organization and functionality of the host organ from which they originated [
10,
11,
12], albeit without a vascular supply. Human trophoblast organoids generated from first-trimester tissue were first published in 2018 [
10,
12], yet the use of human pregnancy tissue for research, which can be obtained following induced abortion, is restricted based on specific funding constraints. There has been a shift towards generating organoids from stem cell sources, which may increase the feasibility of human investigations [
13]. However, the use of a translational animal model remains favorable for mechanistic studies that allow in vitro to in vivo data correlation.
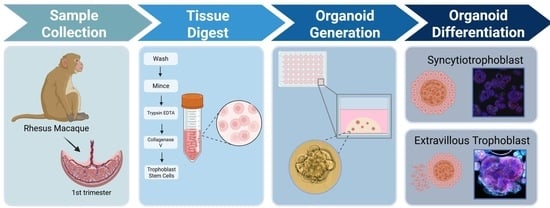
The nonhuman primate (NHP) is an excellent surrogate for studying human placentation due to anatomic and physiological similarities, which include length of gestation, placental type, and fetal developmental ontogeny [
14,
15]. Our group has used the pregnant rhesus macaque for many years for in vivo assessments of placental function using a multimodal noninvasive imaging approach [
16,
17,
18,
19]. In addition, we have performed a comprehensive transcriptomic analysis of rhesus macaque versus human placenta to demonstrate the translational suitability of the pregnant NHP model, with recognition of some species-specific limitations [
20]. During the first trimester, extensive fetal and placental growth occurs [
21], making this a critical period for understanding the dynamic regulation of placental development and function.
Figure 1 illustrates the significant growth that occurs between gestational days (G) 30 and 50 in the rhesus macaque (full term is 165 days), which roughly equates to the 7-to-12-week window of human gestation. This is similarly supported by King’s ultrastructure study of rhesus macaque pregnancy, spanning gestational days 19 to 60 [
21]. During the window of 19 to 35 days, no major structural villi changes were observed, and Hofbauer cells (fetal macrophages) were undetectable. However, between 35 and 60 days, there was a demonstration of dramatic proliferation and placental expansion [
21]. Therefore, our rationale for developing an NHP trophoblast organoid model system is twofold: (1) the existence of a substantial amount of in vivo animal model data that can now be supported by complementary in vitro mechanistic studies and (2) a translational animal model that overcomes the sampling restrictions of first-trimester human pregnancy.
There has been comprehensive development and publication of appropriate protocol conditions to optimize isolation and maintenance of human first-trimester tissue-derived trophoblast organoids in culture [
10,
12,
22]. We have used this as a basis to develop an NHP protocol, with modifications as needed, which are described in the Materials and Methods. Establishment of a trophoblast organoid model system from whole placenta samples obtained in the first trimester from pregnant rhesus macaques, which can be propagated, passaged, and used for multiple experimental applications from one initial source, not only expands our ability to study early placental development and function but also supports the implementation of new approach methods to reduce the number of research animals required to achieve scientific significance.
2. Materials and Methods
2.1. Pregnant Dams
Female rhesus macaques used in this study were assigned to the Time-Mated Breeding (TMB) program and had a proven reproductive history with prior live birth offspring. All dams were healthy, typical-weight animals fed a standard chow diet (Purina Mills™, St. Paul, USA). Reproductive hormone levels were tracked through daily blood sampling to accurately time breeding attempts and to assess early mating success. Within the TMB program, animals are pair-housed in continuous full contact, apart from the time (3–5 days) that females are transferred and co-housed with a male for breeding. All early pregnancies were identified through daily monitoring of estrogen and progesterone levels and confirmed by ultrasound. Based on extensive hormonal assessment studies conducted at the Oregon National Primate Research Center (ONPRC) [
23,
24], the gestational age is calculated by considering the first day of conception as two days after the estrogen peak for reliable and reproducible dating. Pregnancies were delivered by cesarean surgery performed by trained staff in the Surgical Services Unit between gestational days G30 to G50 (where full-term gestation is G165 [
25]) to allow for placental tissue collection.
2.2. Organoid Isolation
The isolation method described here closely followed the published methodology describing trophoblast organoid generation from human pregnancy [
12]. Where protocol deviations were needed for successful application to the rhesus macaque, these are noted below. Whole placenta tissue was obtained from rhesus macaques (
n = 25) for the generation of Rhesus Trophoblast Organoids (RTOs). Immediately following delivery, tissue was promptly placed in pre-warmed wash buffer #1 (see
Table 1 for a complete list of all buffer compositions) for no longer than one hour (
deviation: addition of a red blood cell (RBC) lysis step in tissue preparation, which is not reported in human organoid isolation methods). Whole tissue was washed for 10 min at 37 °C with gentle shaking on an agitating platform with wash buffer #2 before being placed in 30 mLs of RBC lysis buffer (BioLegend 420301, Tokyo, Japan) for 5 min at 37 °C with gentle shaking. Tissue was rinsed in wash buffer #2 following the RBC lysis step, which was found to be necessary as organoid cultures failed to survive in the presence of significant RBC contamination. The placenta cell homogenate was harvested via the scraping of villi with a scalpel and pooled into the digest buffer. The homogenate was digested for 5 min at 37 °C with shaking before being strained and quenched with the digest stop buffer. Undigested material in the strainer was transferred into a collagenase V solution (1 mg/mL) and digested for an additional 5 min to maximize yield. All digest homogenates were quenched with the digest stop buffer before being centrifuged at 600×
g for 6 min to pellet cells. The cell pellet was washed once in 1:1 DMEM:F12 (DMEM/F12), centrifuged again, and transferred into a microfuge tube for a second RBC lysis step (
deviation). If few/no RBCs were present, this step was omitted. If present, the cell suspension was placed in a warm RBC lysis buffer for 5 min before being quenched with DMEM/F12. Cells were then centrifuged, and debris was removed with 3 washes in DMEM/F12. Cells were suspended in Geltrex (Gibco, A1413202, ThermoFisher, Waltham, USA), and 25 µL droplets were seeded into a 48-well plate. The Geltrex domes were given 15 min to polymerize at 37 °C before being overlaid with 250 µL of fresh Trophoblast Organoid Media (TOM, low Y-2,
Table 2).
2.3. Routine Maintenance and Passage
Media replenishment was performed at 48-to-72 h intervals, with 250 µL of fresh, pre-warmed TOM added to each well. After approximately 7 days in culture, organoids were passaged. Passage was performed by harvesting organoids from their wells into microfuge tubes. Organoids were then washed with DMEM/F12 before manual dissociation of Geltrex. Dissociation was performed using an electronic pipettor for 400 total cycles per microfuge tube. The organoids were then pelleted, and the remaining Geltrex was drawn off. Organoid bodies were enzymatically digested by the addition of 500 µL of TrypLE Express (Gibco, 12604013) (
deviation: for human TO passage, Stempro Accutase (Gibco, A1110501) was used [
22], but this was found to be less effective with RTO passage). Resuspension of the organoid pellet into the solution was critical for appropriate dissociation. Digestion occurred for 5 min at 37 °C with gentle shaking in an incubator. TrypLE was quenched by the addition of 1 mL of DMEM/F12, followed by centrifugation. All centrifugation of organoid cultures was performed at 600×
g for 6 min at room temperature unless otherwise noted. The organoids were then manually dissociated for 80 cycles using an electronic pipette. Organoids were washed by resuspension in 1 mL of DMEM/F12 and centrifuged. The media were completely drawn off for resuspension in Geltrex. According to pellet size, approximately 10X the volume of Geltrex was used per tube. The Organoid/Geltrex mixture was seeded as 25 µL droplets into 48-well plates for continuing propagation at 37 °C in TOM.
2.4. Cryopreservation and Re-Establishment in Culture
Organoids were frozen at a ratio of 4 wells per cryovial, with each cryovial containing 1 mL of the final volume. Organoids were harvested from wells and centrifuged. The cell pellet was washed with DMEM/F12 prior to Geltrex dissociation. Dissociation was achieved using an electronic pipette set to 80–160 cycles. Organoids were centrifuged after dissociation, and the remaining Geltrex was removed as described for passage above. The pellet was washed with DMEM/F12 and centrifuged. DMEM/F12 was removed to the maximum extent without disturbing the pellet. Then, 500 µL of freeze media #1 (
Table 1) was added, and the pellet was resuspended. In addition, 500 µL of freeze media #2 (
Table 1) was slowly added and mixed thoroughly; the entire mixture was then moved into a labelled cryovial. Organoids were frozen in a controlled-rate freezing apparatus at −80 °C and then moved into a liquid nitrogen dewar for long-term storage.
Re-establishment of organoid cultures from frozen stocks consisted of thawing rapidly in a water bath at 37 °C, followed by transfer to a microfuge tube. After transfer, the organoids were centrifuged, and the freezing media mixture was drawn off. In total, 1 mL of DMEM/F12 was added to resuspend the organoids, and they were centrifuged again. Excess media were removed, and the organoids were resuspended in Geltrex at approximately 10X the volume of the pellet. Organoids were seeded as before. Light microscopy was used to check the organoids for appropriate morphology and growth following re-establishment. The organoids were typically passaged 7–14 days post-thawing.
2.5. Differentiation of Trophoblast Organoids
Following the passage, 100 µL droplets of Geltrex/organoid mixture were seeded into pre-warmed 12-well plates. Geltrex droplets were allowed to cure for 15–20 min before being overlaid with 1 mL of TOM. Media were replenished with TOM every 48–72 h, and media were collected from one designated well per cohort for five days following passage before being switched to EVT media #1 (
Table 3) for seven to ten days (depending on observed growth) when outgrowths became evident. EVT media #2 (
Table 3) was then applied for another 5 to 7 days. After 18 to 21 days, organoids were harvested by overlaying droplets with 750 µL of Cell Recovery Solution (CRS, Corning, 354253, Santa Barbara, USA) and allowing them to incubate at 4 °C for 30 min. Organoids were manually scraped and harvested from the wells into 1.5 mL Eppendorf tubes and centrifuged. The resulting pellets were rinsed 2X with PBS to ensure full Geltrex removal. Organoids were then lysed with TRIzol and stored at –80 °C for RNA collection (see RNA isolation) or lysed with a Cell Lysis Buffer (ThermoFisher, FNN0011) and processed in accordance with a protein isolation protocol (below).
2.6. Media Harvesting and Storage
Media harvested from organoids were pooled in 4-well increments prior to being centrifuged at 600× g for 6 min to remove any debris/organoids. Centrifuged media samples were aliquoted into clean, labeled tubes and stored at −20 °C until further analysis.
2.7. Histology
Paraffin-embedded organoids were produced using Histogel® (Epredia, HG4000012, ThermoFisher). As described above, CRS was used to remove as much Geltrex as possible prior to harvesting with cold PBS. Organoids were pooled into microcentrifuge tubes and centrifuged. The resulting pellet was washed 3X with 1 mL of PBS, along with mechanical disruption, to remove any residual Geltrex, which would interfere with the Histogel’s solidity. After washing, Histogel was prepared by heating until liquified. Then, 500 µL of warm Histogel was overlaid onto the pellet, followed by a brief centrifuge pulse to ensure that the pellet was positioned at the bottom of the gel. The pellet/gel assembly was solidified at 4 °C for an hour before removal from the microcentrifuge tube. The Histogel plug was removed, and excess gel was trimmed to fit into a standard histology cassette, with biopsy foam to prevent loss due to the small size. The samples were then fixed for 24 h in 10% neutral-buffered formalin before being processed and embedded in paraffin.
2.8. Immunostaining of Organoids
Organoids were seeded on either glass chamber slides (Ibidi, 80807) or in 96-well optical film bottom plates (Corning, 4680). For chamber slides, 25 µL droplets of Geltrex and 250 µL of media were overlaid; for 96-well plates, 10 µL droplets of Geltrex were overlaid with 150 µL of media. Organoids were treated with CRS to remove as much Geltrex as possible prior to fixing in 4% paraformaldehyde for 30 min at room temperature. Organoids were then rinsed with PBS before the permeabilization buffer (
Table A1) was added for 30 min at 4 °C. The permeabilization buffer was drawn off, and a blocking buffer was added for an hour at room temperature. Primary antibodies (
Table 4) were prepared in the blocking buffer and used as per the listed dilutions. Primary antibodies were added to submerge the organoids and incubated overnight at 4 °C. The primary antibodies were then drawn off, followed by three washes with PBS to remove unbound antibodies. Secondary antibodies were prepared in a blocking buffer as per the dilutions listed in
Table 4, and incubation occurred for one hour at room temperature. Phalloidin, if used, was also added during the secondary antibody incubation step at 1X concentration from 10,000X stock, and incubation occurred for one hour (ThermoFisher, R415). Secondary antibodies were then drawn off, and DAPI staining was performed using 1 µg/mL of DAPI solution; the samples were then incubated for five minutes at room temperature. Organoids were rinsed 3X with PBS to remove any unbound DAPI/secondary antibodies. Cover slipping for chamber slide organoids was performed using the Prolong Gold Antifade (Invitrogen, P36930, ThermoFisher) mounting reagent, and the slides were allowed to cure overnight at room temperature before imaging. Then, 96-well plate organoids were covered with 100 µL of PBS and imaged within 72 h of staining.
2.9. Immunostaining Formalin-Fixed Paraffin-Embedded (FFPE) Tissue
Histological sections were cut from paraffin-embedded blocks at a thickness of 5 µm. Slides were heated to 60 °C for 1 h prior to being dewaxed in xylene, followed by 5 min ethanol gradient washes of 95% × 2, 90% × 2, 85% × 1, and 80% × 1, which was succeeded by the use of deionized water to rehydrate the tissue. After rehydration, tissues were permeabilized for 30 min at room temperature in a permeabilization buffer (
Table A1). Heat-induced epitope retrieval was performed using either a pH 6 citrate buffer or a pH 9 Tris buffer (
Table A1) in a pressure cooker set to 100 °C for 10 min. Sections were stained with the conditions described above for organoid samples.
2.10. Confocal Microscopy
Confocal microscopy images were acquired using a Leica Stellaris DMi8 (Leica, Wetzlar, Germany, housed at the OHSU ONPRC Integrated Pathology core. All organoid images shown were acquired using the 20X dry objective (NA 0.75) with the pinhole set to 1 Airy unit.
2.11. RNA Isolation
RNA isolations were performed via phenol/chloroform separation using TRIzol (Invitrogen, 15596026) reagent. Organoid samples were incubated in CRS for 30 min before harvesting, followed by two PBS washes before TRIzol addition. In total, 1 mL of TRIzol was added to an organoid pellet containing organoids harvested from 4 to 6 wells. Samples were then stored at –80 °C until extraction. Immediately after thawing, 800 µL of lysate was transferred into a clean labelled tube with approximately 50 µL of DuPont Molykote vacuum grease at the bottom (ThermoFisher Scientific, 044224.KT). Then, 200 µL of chloroform was overlaid, and the mixture was inverted 20x before being allowed to stand for 5 min at room temperature. The samples were then spun at 21,300×
g for 5 min at 4 °C. The aqueous layer was drawn off and transferred into 400 µL of isopropanol with 1 µL of a linear acrylamide carrier (AM9520) and inverted 20X for mixing, followed by 15 min incubation at room temperature. Samples were then spun at 21,300×
g for 15 min at 4 °C and subsequently washed twice in 80% ethanol, spinning at 21,300×
g for 5 min at 4 °C. Excess ethanol was then removed, and the pellets were dried for approximately 10 min at room temperature and then eluted in 40 µL of nuclease-free water (ThermoFisher Scientific, J71786.AP). RNA concentrations and purity were measured via the Nanodrop instrument. If 260/280 and 260/240 ratios were not satisfactory (>1.8 for each), the samples were cleaned as follows: Water was added as needed to bring volumes to 100 µL. Then, 50 µL of 7.5 M NH
4Ac and 200 µL of isopropanol were added to each sample for precipitation and incubation for 10 min at room temperature. Samples were spun at 21,300× g for 10 min, and the supernatant was drawn off. A wash with 80% ethanol followed. The supernatant was removed, and the pellet was air-dried for 10 min at room temperature. The pellets were dissolved in 40 µL of nuclease-free water, and a Nanodrop Spectrophotometer was used to confirm purity. RNA integrity was assessed via an RNA bleach gel before proceeding to RT-qPCR [
26].
2.12. RT-qPCR
For all samples used in RT-qPCR, 1 µg of RNA was converted into cDNA using the Superscript III RT kit (ThermoFisher, 18080044). RNA was treated with DNase I (Promega, M6101, Madison, USA) according to manufacturer recommendations prior to cDNA synthesis to remove genomic DNA (gDNA). Negative controls (no reverse transcriptase added) were also performed and analyzed via gel electrophoresis to confirm that no gDNA was present. cDNA was stored at 4 °C and –20 °C for short-term and long-term storage. Random hexamers (ThermoFisher, N8080127) were used to prime RNA samples for whole-RNA conversion. Primers were either sourced from the published literature or designed using the NCBI Primer BLAST tool, as noted in
Table A2. All qPCR assays were performed on the Applied Biosystems Quant Studio 3 machine in the 96-well plate format with the annealing temperature set to 55 °C. Primers were validated by both gel electrophoresis to confirm specificity and melting point analysis following qPCR. Sybr Green-based chemistry was used to assay gene abundance, using PowerTrack master mix (ThermoFisher Scientific, A46109). A modified version of the Pfaffl method [
27] was used to perform relative quantification for genes of interest. Primer efficiencies were obtained using five-point standard curves, with purified PCR products diluted to a copy number of 2 × 10⁶ and serially diluted at 1:5 thereafter before experimental samples were run. Gel extractions were performed using the Monarch Spin DNA gel extraction kit according to the manufacturer’s protocol (New England Biosciences, T1120S, Ipswich, USA). In the event of an unclean template, PCR product cleanup was performed using the Wizard SV Gel and DNA Clean-up System (Promega A9281). Experimental cDNA samples were diluted to 1:100 before being used in qPCR reactions. All RT-qPCR samples and standard curves were run in triplicate with non-template controls using molecular-grade water.
2.13. Agarose Gel Electrophoresis
To confirm the specificity of primers used in RT-qPCR and that the RNA samples used had no gDNA contamination, gel electrophoresis was performed. Agarose gels were created at 2% w/v agarose in a Tris-acetate-EDTA buffer (TAE) to analyze PCR amplicons. Gels were run in a diluted 1X TAE buffer (ThermoFisher Scientific, B49) at 120 V for 45 min and subsequently stained with SYBR Safe stain (Invitrogen, S33102) at 1X concentration for 15 min prior to imaging. Images were acquired on an Invitrogen iBright CL1500 using UV light. The ThermoFisher GeneRuler 100 bp ladder was used to confirm that the size of PCR amplicons was within expected parameters.
2.14. Protein Isolation
Media was removed from the wells, and organoids were washed in 250 µL of ice-cold CRS. Geltrex domes were dislodged via scraping with a pipette tip and pooled into microfuge tubes. The pooled samples were incubated in CRS on ice for 30 min to fully remove Geltrex. Organoids were centrifuged to form a pellet, and the remaining Geltrex was removed. Organoids were washed 3X with ice-cold PBS to ensure full removal. Following the washing steps, 150–250 µL of the cell lysis buffer (ThermoFisher Scientific, FNN0011) with added protease inhibitors—0.1 M PMSF and Halt Protease Inhibitor Cocktail (ThermoFisher Scientific, 78440)—was added, with its volume dependent on the volume of the pellet. Lysis occurred for 30 min on ice, with pipetting and gentle vortexing applied every 10 min. The lysate was then centrifuged at 13,500× g for 10 min to remove cellular debris and aliquoted prior to storage at −80 °C (long term). Protein concentrations were quantified via the Bradford Protein Assay (ThermoFisher Scientific, A55866) according to the manufacturer’s protocol. Protein yields ranged from 0.620 ng/µL to 1.584 ng/µL.
2.15. LDH Assay
Lactate dehydrogenase (LDH) colorimetric assays were performed according to manufacturer instructions using diluted supernatant samples (MyBioSource, MBS822351, San Diego, USA). To ensure accurate measurement of LDH, assays were performed within 6 months of supernatant collection (stored at –20 °C). Due to the presence of phenol red from the TOM component in supernatant samples, dilutions of 1:4 were used to minimize interference. Samples were assayed in triplicate, and averages are reported.
2.16. GDF-15 ELISA
GDF-15 ELISA kits were performed according to manufacturer instructions using diluted supernatant samples (Thermo-Fisher, EP7RB). All samples were diluted to 1:50. Samples were assayed in duplicate, and averages are reported.
2.17. Organoid Polarity Manipulation
To alter physiological polarity, modifications were made to the passage protocol to omit Geltrex, and Corning 7007 ultra-low adhesion U-bottom plates were used. After the final spin in the passage protocol, organoids were resuspended in TOM. Several dilutions were prepared and plated in a test plate to achieve 2–3 organoids per 10 µL drop, as observed under a microscope. Once satisfied with the concentration of organoids, the U-bottom plates were seeded. Continuous mixing of the organoid suspension was critical to achieving consistent plating. After the plates were seeded, each well was overlaid with 190 µL of TOM. Media were refreshed every 72 h by removing 75 µL of media and replacing it with 75 µL of fresh media. Careful feeding is required to ensure that the organoids are not disturbed at the bottom of each well. Growth rates are slower for organoids seeded in this way. To characterize the polarity of the organoids, samples were taken from 7, 14, and 21 days post-plating. These were then stained as described above for SDC1 and CDH1, which localize to SYN and CTB cells, respectively.
2.18. Image Processing
Image processing was performed in Fiji, an open-source platform that is part of ImageJ (Version 1.54) [
28]. Processing of brightfield images included scaling using a known reference slide, cropping, and inserting a scalebar. Processing of fluorescent and confocal images consisted of cropping and separating fluorescent channels. The sample images shown were created from slices of stacks in representative images. All raw images are available in the
Supplementary Materials.
4. Discussion
First-trimester placental development comprises some of the most critical and yet largely understudied cellular events that determine subsequent fetal outcomes. Improper placentation is the underlying cause of many pregnancy pathologies that impact fetal development and later life health. Thus, a paradigm for studying early placental development is necessary, and this has been spurred on by the pursuit of new in vitro model systems that recapitulate specific aspects of placentation for further study. One of the most complex and translationally valid models to arise is organoids, three-dimensional structures comprising multiple differentiated cell types that originate from a common progenitor population [
12,
22]. Trophoblasts are the progenitor cells that serve as the proliferative base for the differentiation and maintenance of the placenta. One challenge for human pregnancy studies is the availability of first-trimester tissue. The NHP is an excellent surrogate for studying human placentation due to anatomic and physiological similarities, which include gestational length and developmental ontogeny [
15]. We have previously performed a comprehensive transcriptomic analysis of rhesus macaque versus the human placenta to demonstrate the suitability of this NHP model, with recognition of some species-specific limitations [
20].
In this study, we leveraged the rhesus macaque to derive trophoblast organoids that behave similarly to human trophoblast organoids (HTOs). Importantly, RTOs demonstrate similar sizes and spatial organizations to their human counterparts. The expression of cytotrophoblast markers CDH1 and KRT7 at both the RNA and protein levels helps confirm their identity as trophoblasts (
Figure 2 and
Figure 3). No changes were required from the human formulation for TOM, which suggests that the trophoblast stem cell niche in the primate is similar in nature to humans [
12,
22]. Of note, growth rates are slightly faster, with the average time to passage RTOs being 7 days compared to 10 days for HTOs [
12]. We report that a more aggressive dissociation reagent is preferable in RTOs, utilizing TrpLE Express as opposed to Stem Pro Accutase. We have successfully propagated RTO lines up to 20 passages with no visual signs of decline, marking a significant improvement over primary trophoblast cells in two-dimensional culture. The overlap between rhesus and human models for basic trophoblast stem cell (TSC)/cytotrophoblast functions and SYN differentiation makes leveraging in vivo data in the rhesus more intriguing. Furthermore, primary tissue-derived RTOs from early gestational timepoints alleviate constraints around the study of early gestational events in human subjects.
Organoids in standard TOM typically undergo spontaneous SYN differentiation, similarly to villous cytotrophoblasts in two-dimensional culture [
32]. Significant divergence in the characterization of macaque EVT cells has been reported [
20,
33] and replicated herein. We have demonstrated partial success in differentiating RTOs into EVT cells, but we note multiple points of divergence from the success observed in humans with respect to this process. Namely, the key markers of EVT cells are completely different. Recent reports have converged on ITGA5, MMP2, and NCAM1 as markers for EVT cells in the rhesus, differing from HLA-G as the most reliable marker in humans [
34,
35]. We have found that, in response to Wnt withdrawal and increased TGF-β inhibition by A83-01, RTOs not only increase their expression of EVT markers and morphologically become more invasive and spindlier but also develop cystic structures that are less invasive in nature (
Figure 3B). It is known that macaque EVTs do not invade as deeply into the uterine wall as human EVTs [
15]. Indeed, it could be that the macaque EVT invasion program is not as aggressive as that in humans, but whether this is because of differences in gene expression or immune regulation on the maternal side has not been explored. Further disentangling the factors governing EVT differentiation in both species may allow for the direct investigation of gene functions in the context of the developing placenta.
Stable expression of trophoblast markers KRT7, GATA3, and CDH1 suggests that the identities of RTO lines are indeed trophoblasts. We also note that organoids grown in TOM maintain a very proliferative state, with robust nuclear Ki67 expression through multiple passages (
Figure 2). In TOM, after an establishment period of 10–21 days following the initial isolation, RTOs are quite stable, with routine passages every 7 days. The LDH levels detected in supernatants confirm this, with undetectable LDH from RTOs maintained in TOM until approximately 14 days post-passage (
Figure 3).
In analyzing the gene expression of key EVT markers, we noted a sharp upregulation of GCM1 in macaque EVTs. The transcription factor GCM1 is typically considered a marker for SYN, but not for EVTs [
36]. GCM1 is necessary for proper SYN development in mice and humans, with knockout mice being embryonic lethal, and it is highly expressed through pregnancy in the placenta [
36,
37]. However, GCM1 also plays a role in EVT differentiation, specifically by influencing the expression of NOTUM, a Wnt antagonist [
38]. Our data suggest that this role may be conserved in the rhesus placenta, as we observed the consistent upregulation of GCM1 transcription in the EVT media condition. However, it cannot be assumed that the upregulation of GCM1 in this context is strictly related to EVT differentiation. Given the dual role of GCM1 in the placenta of humans, we also assayed the levels of GDF-15, a growth factor secreted by mature SYN, in the supernatant of EVT or TOM organoids (
Figure 3). GDF-15 expression was consistently lower in EVT-treated supernatants than in TOM-treated supernatants. This, in combination with elevated GCM1 expression, suggests that the upregulation observed was indeed a response to EVT-stimulating conditions. It is also worth noting that a peak in GDF-15 expression was observed in the organoids from days 10 to 17, which is longer than they would typically be grown before passage. Studying the SYN function specifically may benefit from using slightly older organoids that have more active SYN cells. Further analysis into how, when, and where GCM1 expression occurs in the rhesus placenta may provide insights into the mechanism of EVT differentiation in the macaque. Consequently, species-specific features may also betray the nature of human EVT differentiation.
Other genes that were observed to be upregulated in the EVT cohort were ITGA5 and MMP2 (
Figure 3). Both of these genes are known markers of human EVTs and are important to the remodeling and migratory functions that EVTs must fulfill during a healthy pregnancy [
35,
39]. The switching from ITGA2 to ITGA5 in EVT differentiation is a notable feature in humans, and RNA-seq data from macaques suggest that this transition may be conserved in primate pregnancy [
33]. Further evidence for EVT differentiation in this model comes from the downregulation of CDH1, a marker for cytotrophoblast in the villous compartment. As is expected in a model of EVT differentiation, further cell divisions give rise to EVT cells and a diminishing cytotrophoblast compartment. The EVT differentiation process needs further optimization in our hands to improve the utility of RTOs as an in vitro model system. LDH levels spike sharply after the introduction of EVT #1 to the organoids before leveling out and falling back to undetectable levels later in differentiation (
Figure 3). Morphologically, the organoids take on a dark appearance, which further suggests that they are not in optimum health. Whether this is a feature inherent to EVTs or an unintended result of the changes implemented in medium compositions is unknown at present.
We also aimed to address the issue of organoid polarity. Achieving proper polarity increases the translational relevance of both HTO and RTO models. To date, several studies have provided solutions to the inverse polarity configuration of HTOs grown in 3D matrices [
29,
30,
40]. Perhaps the simplest solution involves utilizing ultra-low adhesion plates, and upon removing organoids from their matrix at passage, they are replaced in a matrix-free environment. We have performed this experiment to investigate whether RTOs are capable of growing in a matrix-free environment and, if so, whether they are able to regain the physiological polarity observed in vivo. To this end, we leveraged Corning 7007 plates and seeded groups of 1–3 organoids in each well post-passage. The organoids grown in these conditions initially grow slower than their matrix-seeded counterparts, but with sufficient time, they achieve sizes in excess of 400 µm in diameter (
Figure 4). Along with the increased size, these organoids tend to grow more cystic outgrowths and appear ‘smoother’ than Geltrex-embedded organoids. Histological analyses showed that these organoids are starting to revert their polarity to a physiological orientation, with staining for the SYN marker SDC1 observed partially on the outer layers of these organoids. No such staining was observed during standard culture conditions (
Figure 4D). This suggests that RTOs are capable of growing in the physiological orientation with proper culture conditions. The methodology will be expanded to improve throughput and the overall success of SYN maturation. This methodology may allow for a simple way to more effectively assay SYN development and function in early gestational timeframes. In addition, as a result of our endeavors towards polarity manipulation, we trialed Cultrex reduced growth-factor BME type R1 based on recent publications recommending the reagent [
41]. All data presented herein are from organoids maintained in Geltrex, but we have found Cultrex to be more effective for establishing and propagating organoids. Cultrex will be the extracellular matrix reagent used in our future RTO work.
The work presented here is somewhat limited in scope and is intended to establish a protocol for deriving RTO lines from early gestational samples. More detailed analyses of protein expression and RNA-seq work would strongly benefit the utility of both RTOs and the macaque as translational models for early placental development studies. Furthermore, in humans, TSC-based approaches to deriving organoids have dramatically expanded accessibility to organoid systems and opened avenues for molecular investigation, such as transforming knockout cell lines into organoids. Recent work has detailed the derivation and establishment of macaque TSCs [
33,
42], but to our knowledge, no organoids have yet been derived or characterized from these cells. It has been established in human work that, while very similar, trophoblast organoids derived from TSCs are not identical to primary organoids [
22,
43]. The lack of conserved EVT markers between macaques and humans also obfuscates the translational utility of the model, as many pregnancy diseases are suspected to arise from defective EVT development. Going one step further from TSCs are organoids that are derived from induced pluripotent stem cells. Expanding the available modes of derivation for RTOs will greatly improve their potential as a translational model.


 ,
, 


