Article

Automatic Detection of Foraging Hens in a Cage-Free Environment with Computer Vision Technology

Department of Poultry Science, College of Agricultural and Environmental Sciences, University of Georgia, Athens, GA 30602, USA
*
Author to whom correspondence should be addressed.
Poultry 2025, 4(3), 34; https://doi.org/10.3390/poultry4030034
Submission received: 26 May 2025 / Revised: 22 July 2025 / Accepted: 23 July 2025 / Published: 30 July 2025

Abstract

Foraging behavior in hens is an important indicator of animal welfare. It involves both the search for food and exploration of the environment, which provides necessary enrichment. In addition, it has been inversely linked to damaging behaviors such as severe feather pecking. Conventional studies rely on manual observation to investigate foraging location, duration, timing, and frequency. However, this approach is labor-intensive, time-consuming, and subject to human bias. Our study developed computer vision-based methods to automatically detect foraging hens in a cage-free research environment and compared their performance. A cage-free room was divided into four pens, two larger pens measuring 2.9 m × 2.3 m with 30 hens each and two smaller pens measuring 2.3 m × 1.8 m with 18 hens each. Cameras were positioned vertically, 2.75 m above the floor, recording the videos at 15 frames per second. Out of 4886 images, 70% were used for model training, 20% for validation, and 10% for testing. We trained multiple You Only Look Once (YOLO) object detection models from YOLOv9, YOLOv10, and YOLO11 series for 100 epochs each. All the models achieved precision, recall, and mean average precision at 0.5 intersection over union (mAP@0.5) above 75%. YOLOv9c achieved the highest precision (83.9%), YOLO11x achieved the highest recall (86.7%), and YOLO11m achieved the highest mAP@0.5 (89.5%). These results demonstrate the use of computer vision to automatically detect complex poultry behavior, such as foraging, making it more efficient.

1. Introduction

Eggs offer accessible and affordable sources of high-quality protein along with important micronutrients [1]. With the growing population, demand for table eggs continues to rise [2]. Meanwhile, consumers are demanding improved animal welfare, with a notable shift in table egg production from caged to cage-free (CF) systems [2,3]. Considering the welfare issues in conventional cages (CC), CF housing systems are gaining momentum globally [4,5]. As part of this trend, large U.S. retailers like Kroger and Walmart have pledged to go entirely CF [6,7,8].
A positive welfare state is achieved when hens can perform their innate behaviors for which they are naturally motivated [9]. Compared to CC systems, hens in CF systems are more likely to show normal behavioral patterns, as they have more space to move [10]. In contrast, hens cannot perform their natural behaviors such as foraging, perching, and dustbathing in CC housing because of a lack of space and substrates, which can contribute to stress. CF systems provide hens with enough space to explore their environment and engage in behaviors such as foraging.
Foraging is considered one of the most important natural behaviors in hens, as they spend a significant portion of their time doing it. A study observed that semi-wild jungle fowl spent approximately 60% of their time ground pecking and around 34% ground scratching [11]. Although commercial high-performing layers display reduced foraging-related behaviors, foraging remains a behavioral need [12]. Several studies have underlined the significance of foraging behavior in hens, associating it with some abnormal behaviors such as severe feather pecking and cannibalism. Some researchers have considered feather pecking as a redirected foraging behavior [13,14,15]. In contrast, recent studies claim them to be uncorrelated [16,17]. These studies were based on in-person observations, which can often be labor-intensive and subject to human errors. The presence of a person inside the pen or house can alter the natural behavior of hens, potentially leading to inaccurate observations. For instance, Wechsler and Huber-Eicher (1998) mentioned that it was not possible to count the exact number of total feather pecks [15]. Rudkin (2022) pointed out the need to avoid sudden movements or sounds during observation to minimize disturbance [17]. Such challenges are common in conventional behavioral studies based on direct observations. To overcome those challenges, cameras are installed in poultry facilities to monitor poultry behaviors without disturbing the birds. However, manual observation or analysis of such video data would be time-consuming, laborious, and probably inconsistent due to observer fatigue. Therefore, an automatic detection method is needed.
With the advancement in technology, many of the limitations of conventional behavioral observations can be overcome. Computer vision-based systems provide an objective, consistent, and effective alternative to conventional methods, which are often tedious, labor-intensive, and subjective [18,19]. Computer vision integrates mathematics, computer science, and software programming to automate analysis through an image-based system [19]. These tools have the potential to be used in automatic monitoring of nuanced behavioral patterns in large-scale, dynamic environments such as CF housing systems. Computer vision is rapidly gaining popularity in poultry behavior and welfare research [20]. It has been applied across numerous poultry studies to perform tasks such as monitoring bird activities and behavior and detecting diseases [21,22,23]. These studies, using various computer vision algorithms, have demonstrated excellent performance for their respective monitoring and detection tasks.
You Only Look Once (YOLO) is one of the most popular computer vision algorithms and has been used to detect behaviors of CF hens such as dustbathing and perching with excellent performance [24,25]. In contrast to traditional object detection models, YOLO is significantly faster because of its unique one-shot detection approach [26]. Unlike two-stage object detection algorithms such as R-CNN, Fast R-CNN, Faster R-CNN, and Mask R-CNN, one-stage detectors like YOLO are faster and more suitable for real-time object detection [19]. Following its introduction, the YOLO series has evolved significantly, with each version bringing key improvements to enhance performance and efficiency [27]. In a recent study evaluating various YOLO versions, YOLO11 was the most consistent performer, YOLOv10 excelled in speed and efficiency, YOLOv9 was particularly effective for smaller datasets, while YOLOv12 was comparatively underwhelming [28]. These findings underline the importance of selecting the appropriate YOLO version based on the task and dataset features.
Subedi et al. (2025) employed YOLOv5 and YOLOv7 models to detect multiple behaviors, including foraging in a CF system [29]. However, the models performed poorly in detecting foraging behavior, highlighting the complexity and challenges of the task. The objectives of this study are to develop a machine vision method for monitoring hens’ foraging behavior automatically and evaluate the performance of different computer vision models such as YOLOv9, YOLOv10, and YOLO11 series to automatically detect foraging instances in a CF research environment.

2. Materials and Methods

2.1. Experimental Setup

This study was conducted at the University of Georgia (UGA) Poultry Research Facility in a CF room. All chickens were obtained from Hy-Line North America (Mansfield, GA, USA) as day old chicks. Lohmann LSL-Lite hens (n = 96) were raised in four pens: two measured 2.3 m × 1.8 m with 18 hens each, while the other two measured 2.9 m × 2.3 m with 30 hens each (Figure 1). All pens were enclosed using mesh wire. The hens were raised from day-old age, and the data collection for this study was performed from 50 to 70 weeks of age. Pine shavings were used as litter to a depth of 5 cm. Environmental conditions were maintained according to Lohmann LSL-lite management guide standards with air temperature between 18 and 20 °C, light intensity of 15 lux, and a photo period of 14 h light and 10 h dark (14L:10D). Each pen was provided with feeders, drinkers, and a perch. The feed was manufactured at the UGA feed mill and offered ad libitum. Animal Care and Use Committee (IACUC) at the UGA approved all the animal use and management procedures of this study (AUP #: A2023 02-024).

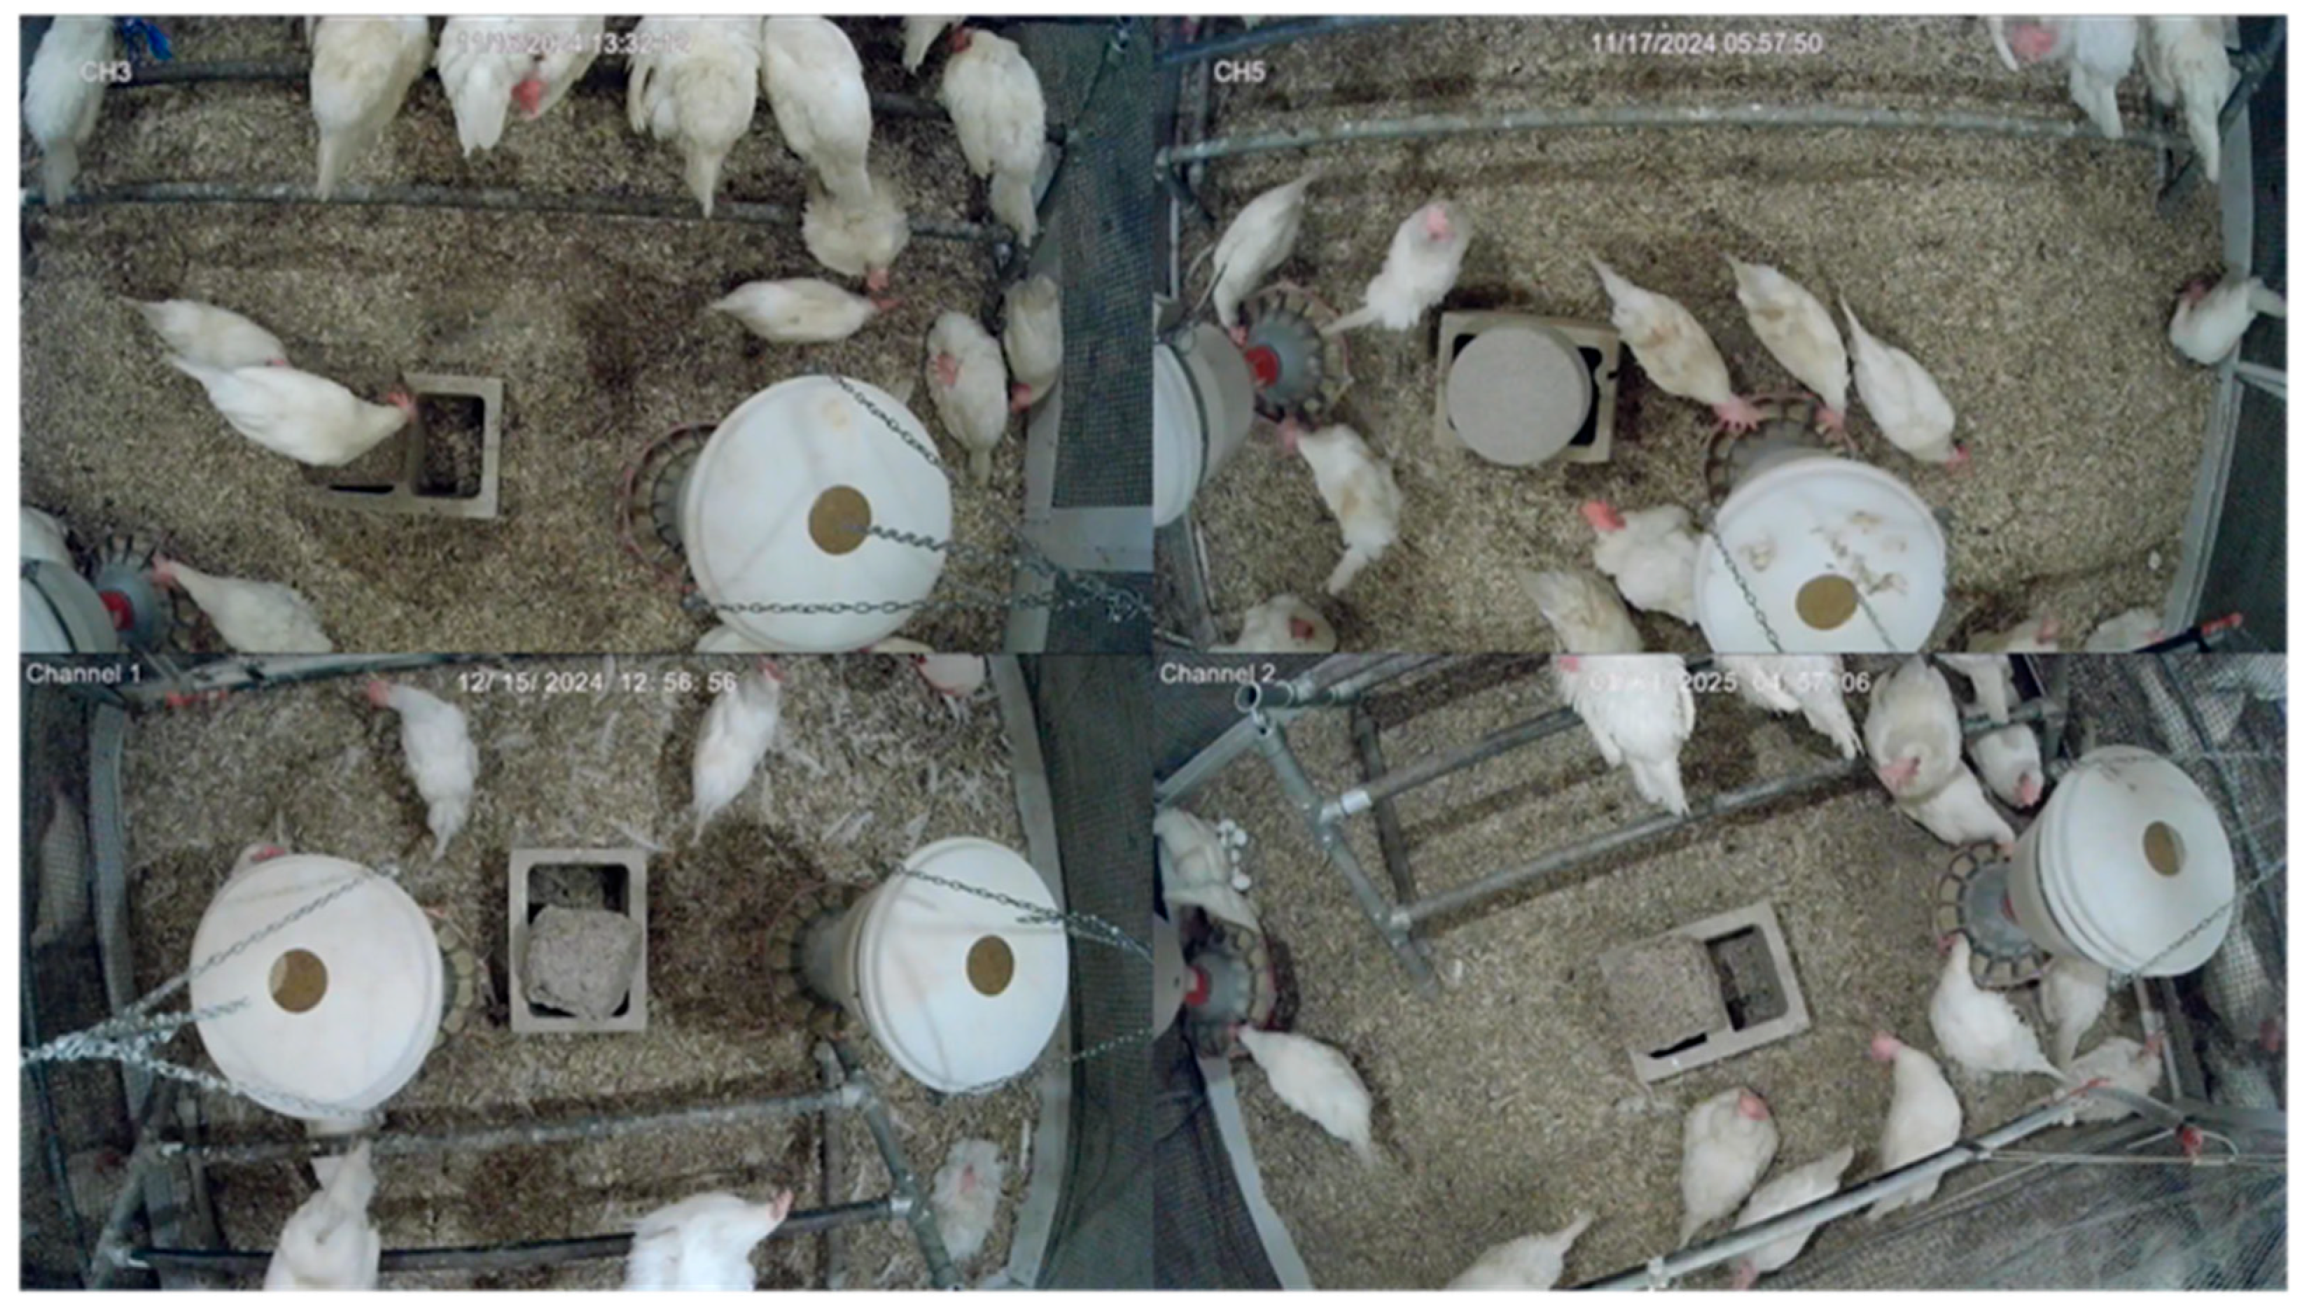
2.2. Image Acquisition

Four night-vision network cameras (PRO-1080MSB, Swann Communications USA Inc., Santa Fe Springs, CA, USA) were mounted directly above each pen, 2.75 m from the floor, capturing the top–down view. The recorded RGB videos were saved in .avi format with a resolution of 1920 × 1080 pixels at 15 frames per second. The recordings were stored using a digital video recorder (DVR-4580, Swann 126 Communications USA Inc., Santa Fe Springs, CA, USA) and then converted into images in .jpeg format for further analysis.

2.3. Image Pre-Processing and Annotation

A total of 5000 images were selected randomly but stratified to ensure good distribution of the instances using Python 3.13. These images were then manually reviewed, discarding blurred and low-quality images. Then, we obtained 4886 clean images, which were split into 70% for training, 20% for validation, and 10% for testing purposes. The training and validation datasets were manually annotated using an open-source tool ‘CVAT.ai’ by drawing bounding boxes around the hens showing foraging behavior. To ensure consistency, annotations were performed by the same trained individual. A random subset (10%) of the annotations was reviewed by second individual, with agreement above 95%. A hen was labeled as foraging when it was pecking at the floor or standing/moving with its head lower than the rump [14]. Feeding at the feeder was not considered as foraging, which lacks exploratory element associated with foraging.

2.4. Model Training

Pretrained YOLOv9, YOLOv10, and YOLO11 object detection models, sourced from Ultralytics GitHub repository [30], were trained on the annotated images for 100 epochs, with a batch size of 16 and a constant learning rate of 0.01. Python 3.13 was used for all the training and analysis process.

2.5. Testing

The developed model was tested on a test dataset with confidence thresholds set at 0.25, meaning only the foraging prediction bounding boxes with confidence score above 0.25 were shown as output. Computational resources used in model training and testing are given in Table 1.

2.6. Performance Metrics

Performance of the models trained in this study was evaluated using standard object detection metrics: precision, recall, and mean average precision at 50% intersection over union (mAP@0.5).

2.6.1. Precision

Precision is the percentage of correct positive predictions out of all positive predictions made by the model. It is calculated as the ratio of true positive predictions (TP) to the sum of TP and false positive predictions (FP). In the context of this study, precision is the percentage of correct foraging predictions out of all the foraging predictions made by the model.
P r e c i s i o n   ( P ) = T P T P + F P × 100 % = T o t a l   t r u e   f o r a g i n g   d e t e c t i o n T o t a l   f o r a g i n g   d e t e c t i o n × 100 %

2.6.2. Recall

Recall is the percentage of correct positive predictions made by the model out of all the actual positive instances. It is calculated as the ratio of TP to the sum of TP and false negative predictions (FN). In the context of this study, recall is the percentage of correct foraging predictions made by the model out of all the actual foraging instances.
R e c a l l   ( R ) = T P T P + F N × 100 % = T o t a l   t r u e   f o r a g i n g   d e t e c t i o n T o t a l   f o r a g i n g   i n s t a n c e s × 100 %

2.6.3. mAP@0.5

mAP@0.5 measures the average precision across all recall levels for an intersection over a union threshold of 0.5. It is equivalent to average precision for a single class model such as the one used in this study. It considers both false positives and false negatives, making it a more comprehensive metric.
A v e r a g e   p r e c i s i o n A P = 0 1 P R d R
M e a n   a v e r a g e   p r e c i s i o n m A P = 1 n i = 1 n A P i
Here, n = number of classes, which is 1 for this study.

3. Results

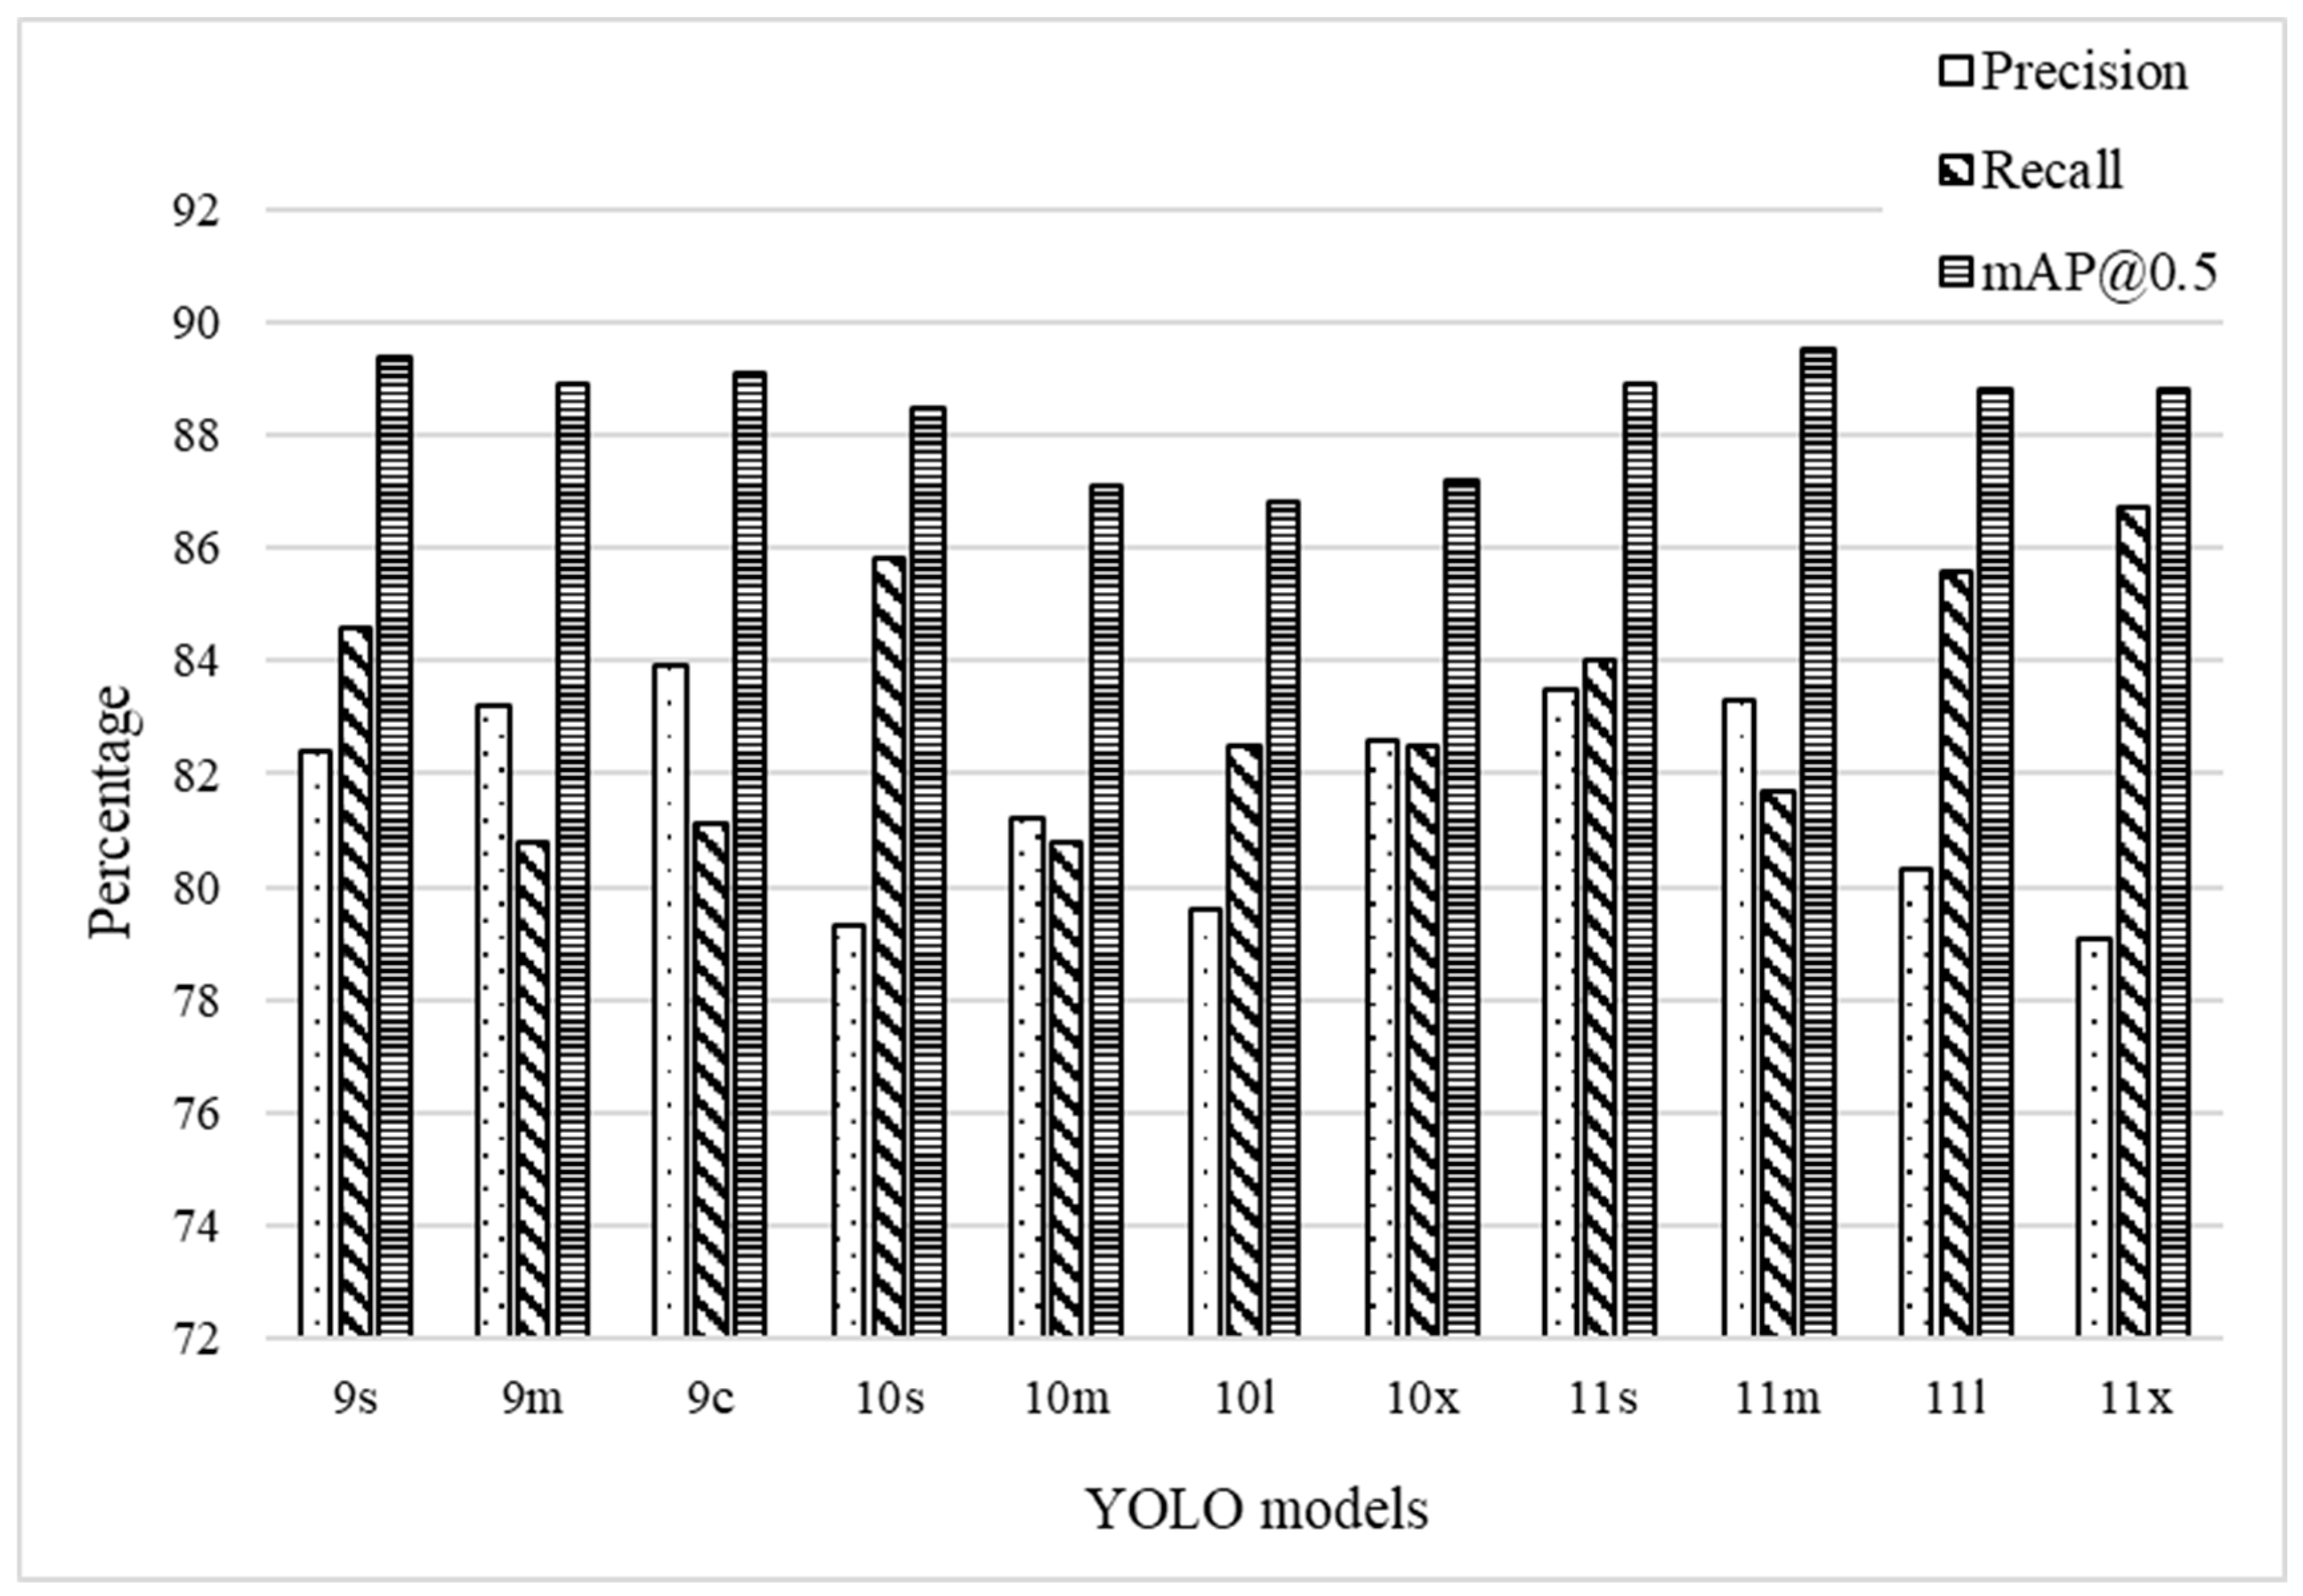
3.1. Performance Metrics

The trained foraging detection models exhibited varying levels of performance, measured by the precision, recall, and mAP@0.5 values for the validation dataset. Figure 2 presents a clustered bar graph comparing the performance metrics across the models.

3.1.1. Precision

The YOLOv9 series achieved high precision, with YOLOv9s, YOLOv9m, and YOLOv9c achieving a precision of 82.4%, 83.2%, and 83.9%, respectively. The YOLOv10 series comparatively showed a wider range. YOLOv10s and YOLOv10l achieved a lower precision of 79.3% and 79.6%, respectively. However, YOLOv10m and YOLOv10x performed better, achieving 81.2% and 82.6%, respectively. The YOLO11 series also achieved similar mixed precision, as YOLO11s and YOLO11m obtained 83.5% and 83.3%, while YOLO11l and YOLO11x obtained 80.3% and 79.1%, respectively. Overall, YOLOv9c achieved the highest precision, while YOLO11x achieved the lowest.

3.1.2. Recall

All the models achieved a recall higher than 80%. YOLOv9s, YOLOv9m, and YOLOv9c achieved a recall of 84.6%, 80.8%, and 81.1%, respectively. The YOLOv10 series performed better, with YOLOv10s, YOLOv10m, YOLOv10l, and YOLOv10x achieving a recall of 85.8%, 80.8%, 82.5%, and 82.5%, respectively. The YOLO11 series had the best recall, with YOLO11s, YOLO11m, YOLO11l and YOLO11x achieving 84%, 81.7%, 85.6%, and 86.7%, respectively. Overall, YOLO11x achieved the highest recall, while YOLOv9m and YOLOv10m had the lowest.

3.1.3. mAP@0.5

All models achieved an mAP@0.5 greater than 85%. In the YOLOv9 series, YOLOv9s, YOLOv9m, and YOLOv9c achieved 89.4%, 88.9%, and 89.1%, respectively. The YOLOv10 series saw a slight decline, where YOLOv10s, YOLOv10m, YOLOv10l, and YOLO10x achieved 88.5%, 87.1%, 86.8%, and 87.2%, respectively. The YOLO11 series performed well, as YOLO11s, YOLO11m, YOLO11l, and YOLO11x achieved 88.9%, 89.5%, 88.8%, and 88.8%, respectively. YOLO11m achieved the highest mAP@0.5, while YOLOv10l had the lowest.

3.2. Confusion Matrix

The confusion matrix gives a visualization of the classification performance of the models, showing their ability to correctly distinguish foraging instances. Figure 3 presents the combination of normalized confusion matrix values for all the models.
All the models showed strong performance in identifying true foraging instances with a true positive rate (TPR) higher than 0.80 across all the models. In the YOLOv9 series, YOLOv9s and YOLOv9c had a TPR of 0.83, while YOLOv9m had a TPR of 0.82. In the YOLOv10 series, YOLOv10s had a TPR of 0.82, while YOLOv10m and YOLOv10l both had a TPR of 0.81. YOLOv10x performed the worst with a TPR of 0.80. For the YOLO11 series, YOLO11s and YOLO11l both had a TPR of 0.82, YOLO11m had a TPR of 0.83, and YOLO11x had the highest TPR of 0.84.

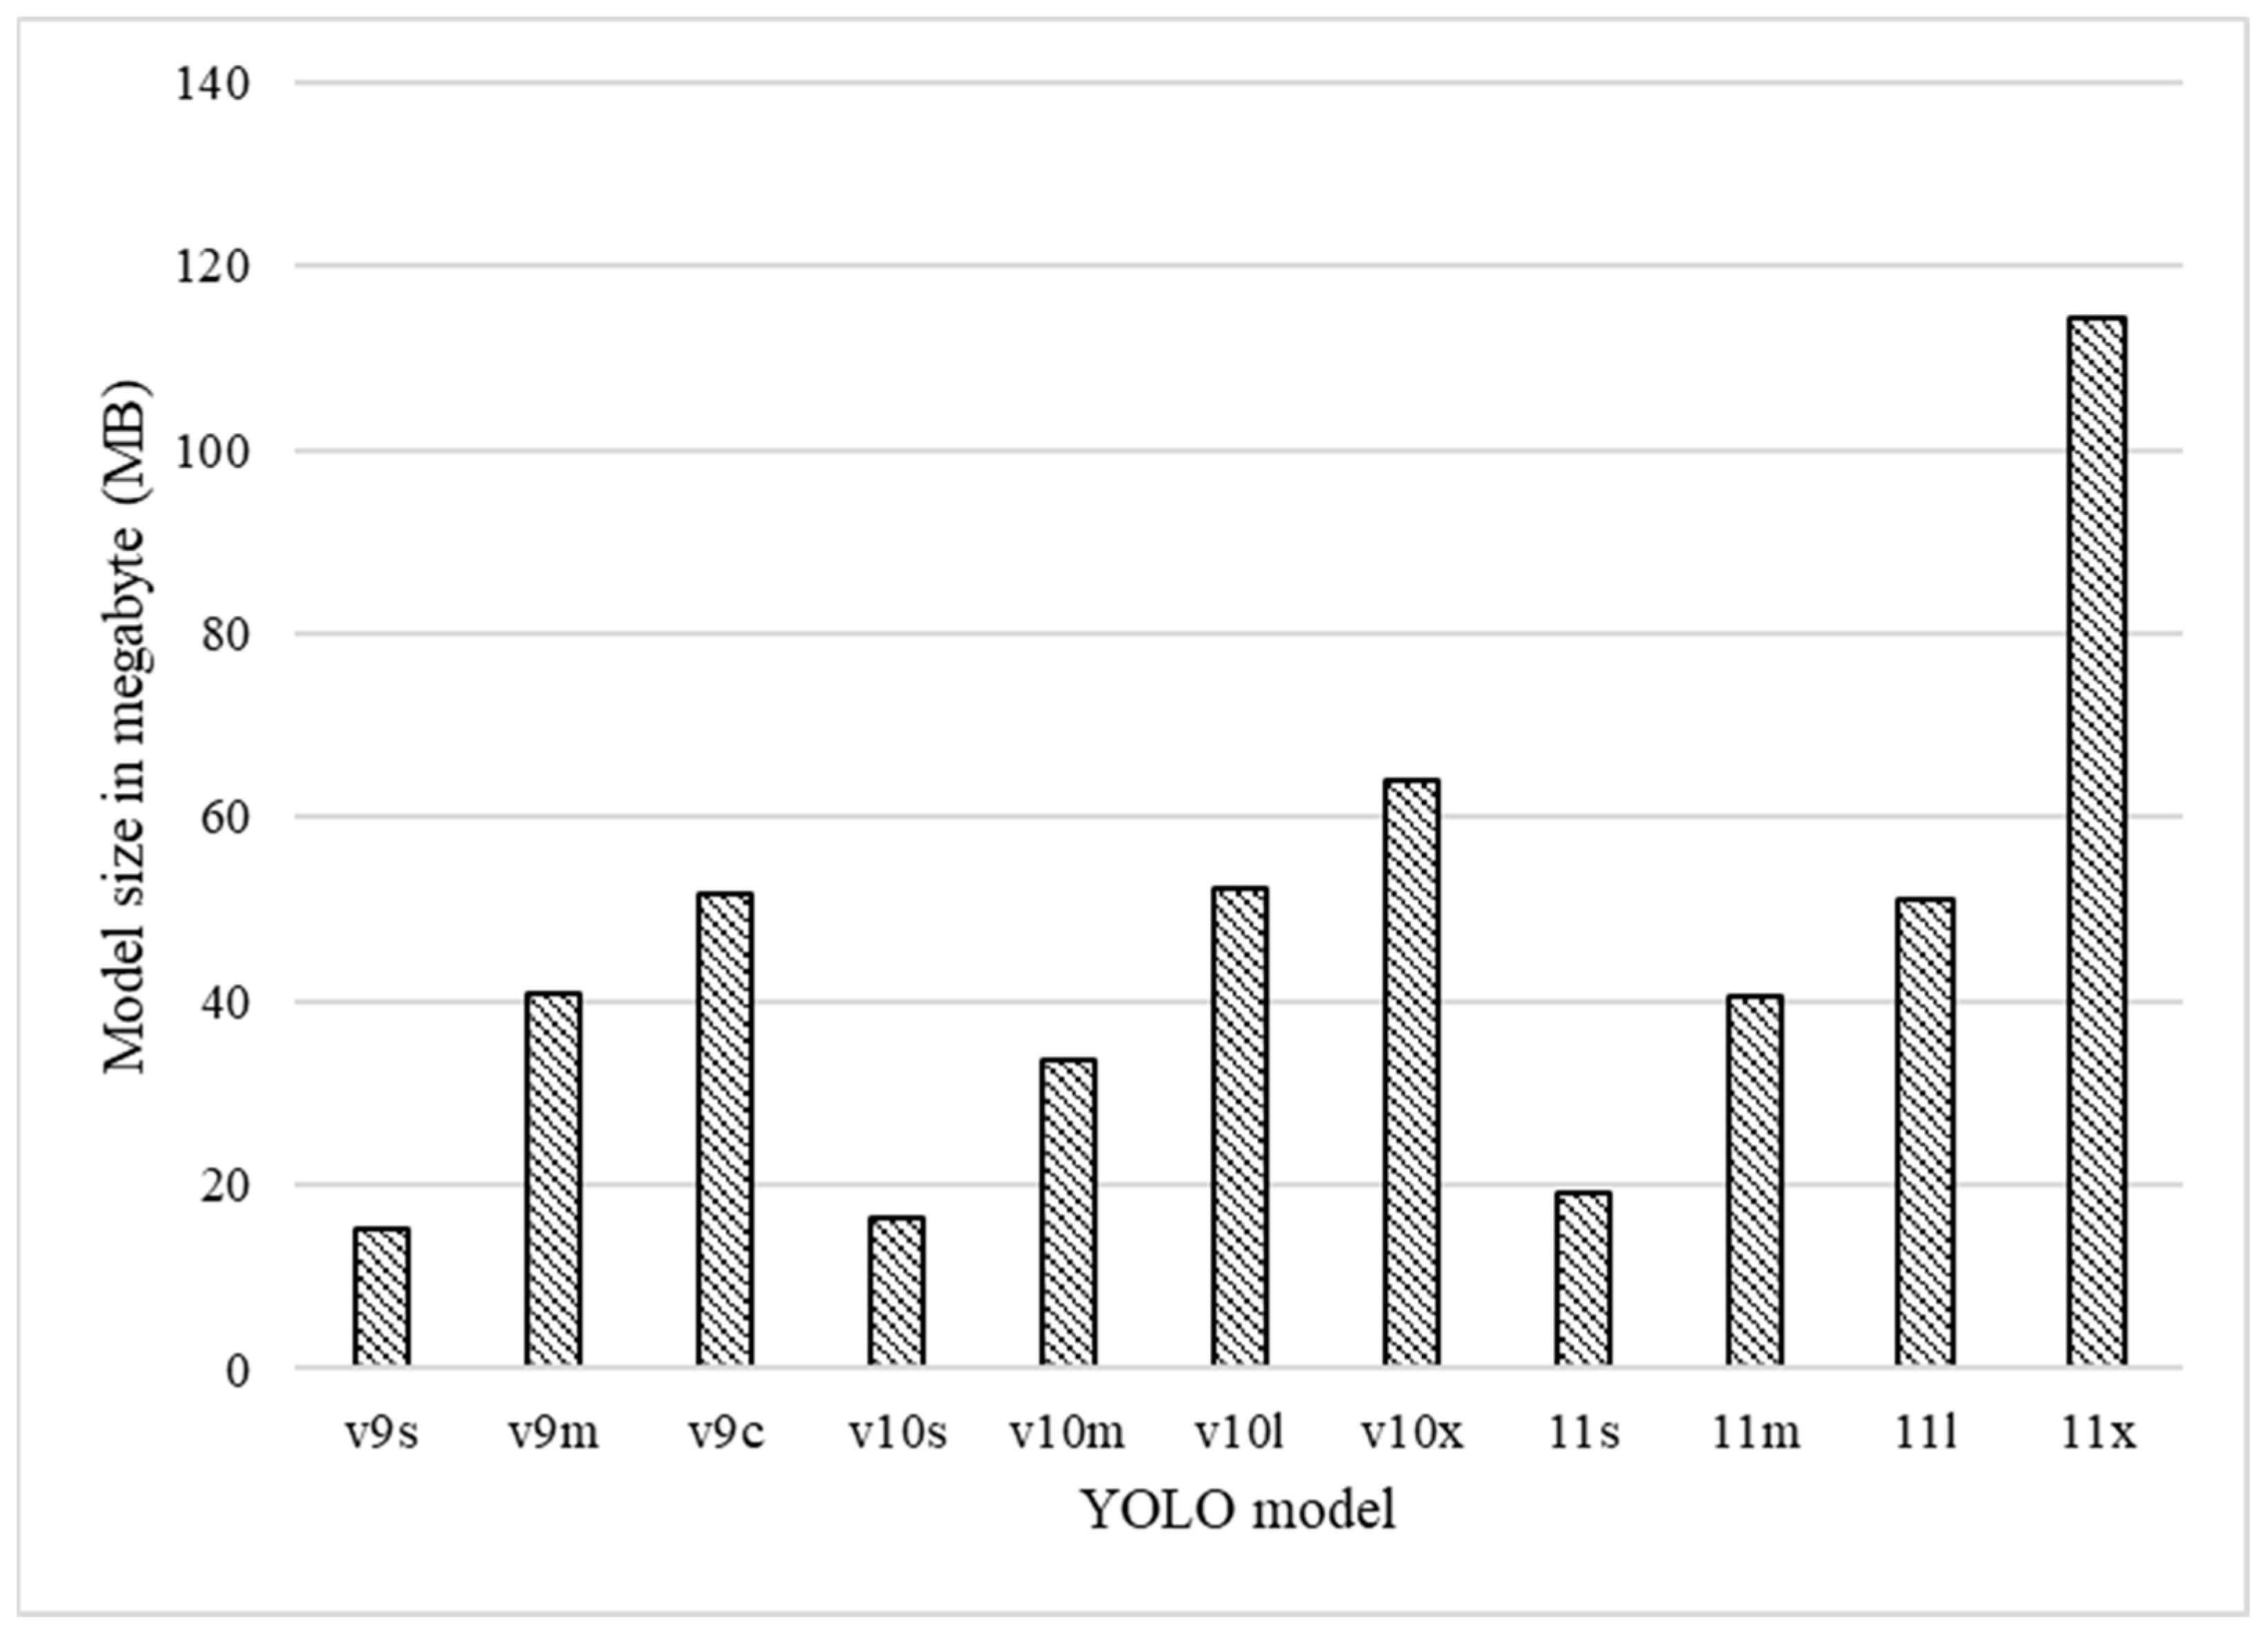
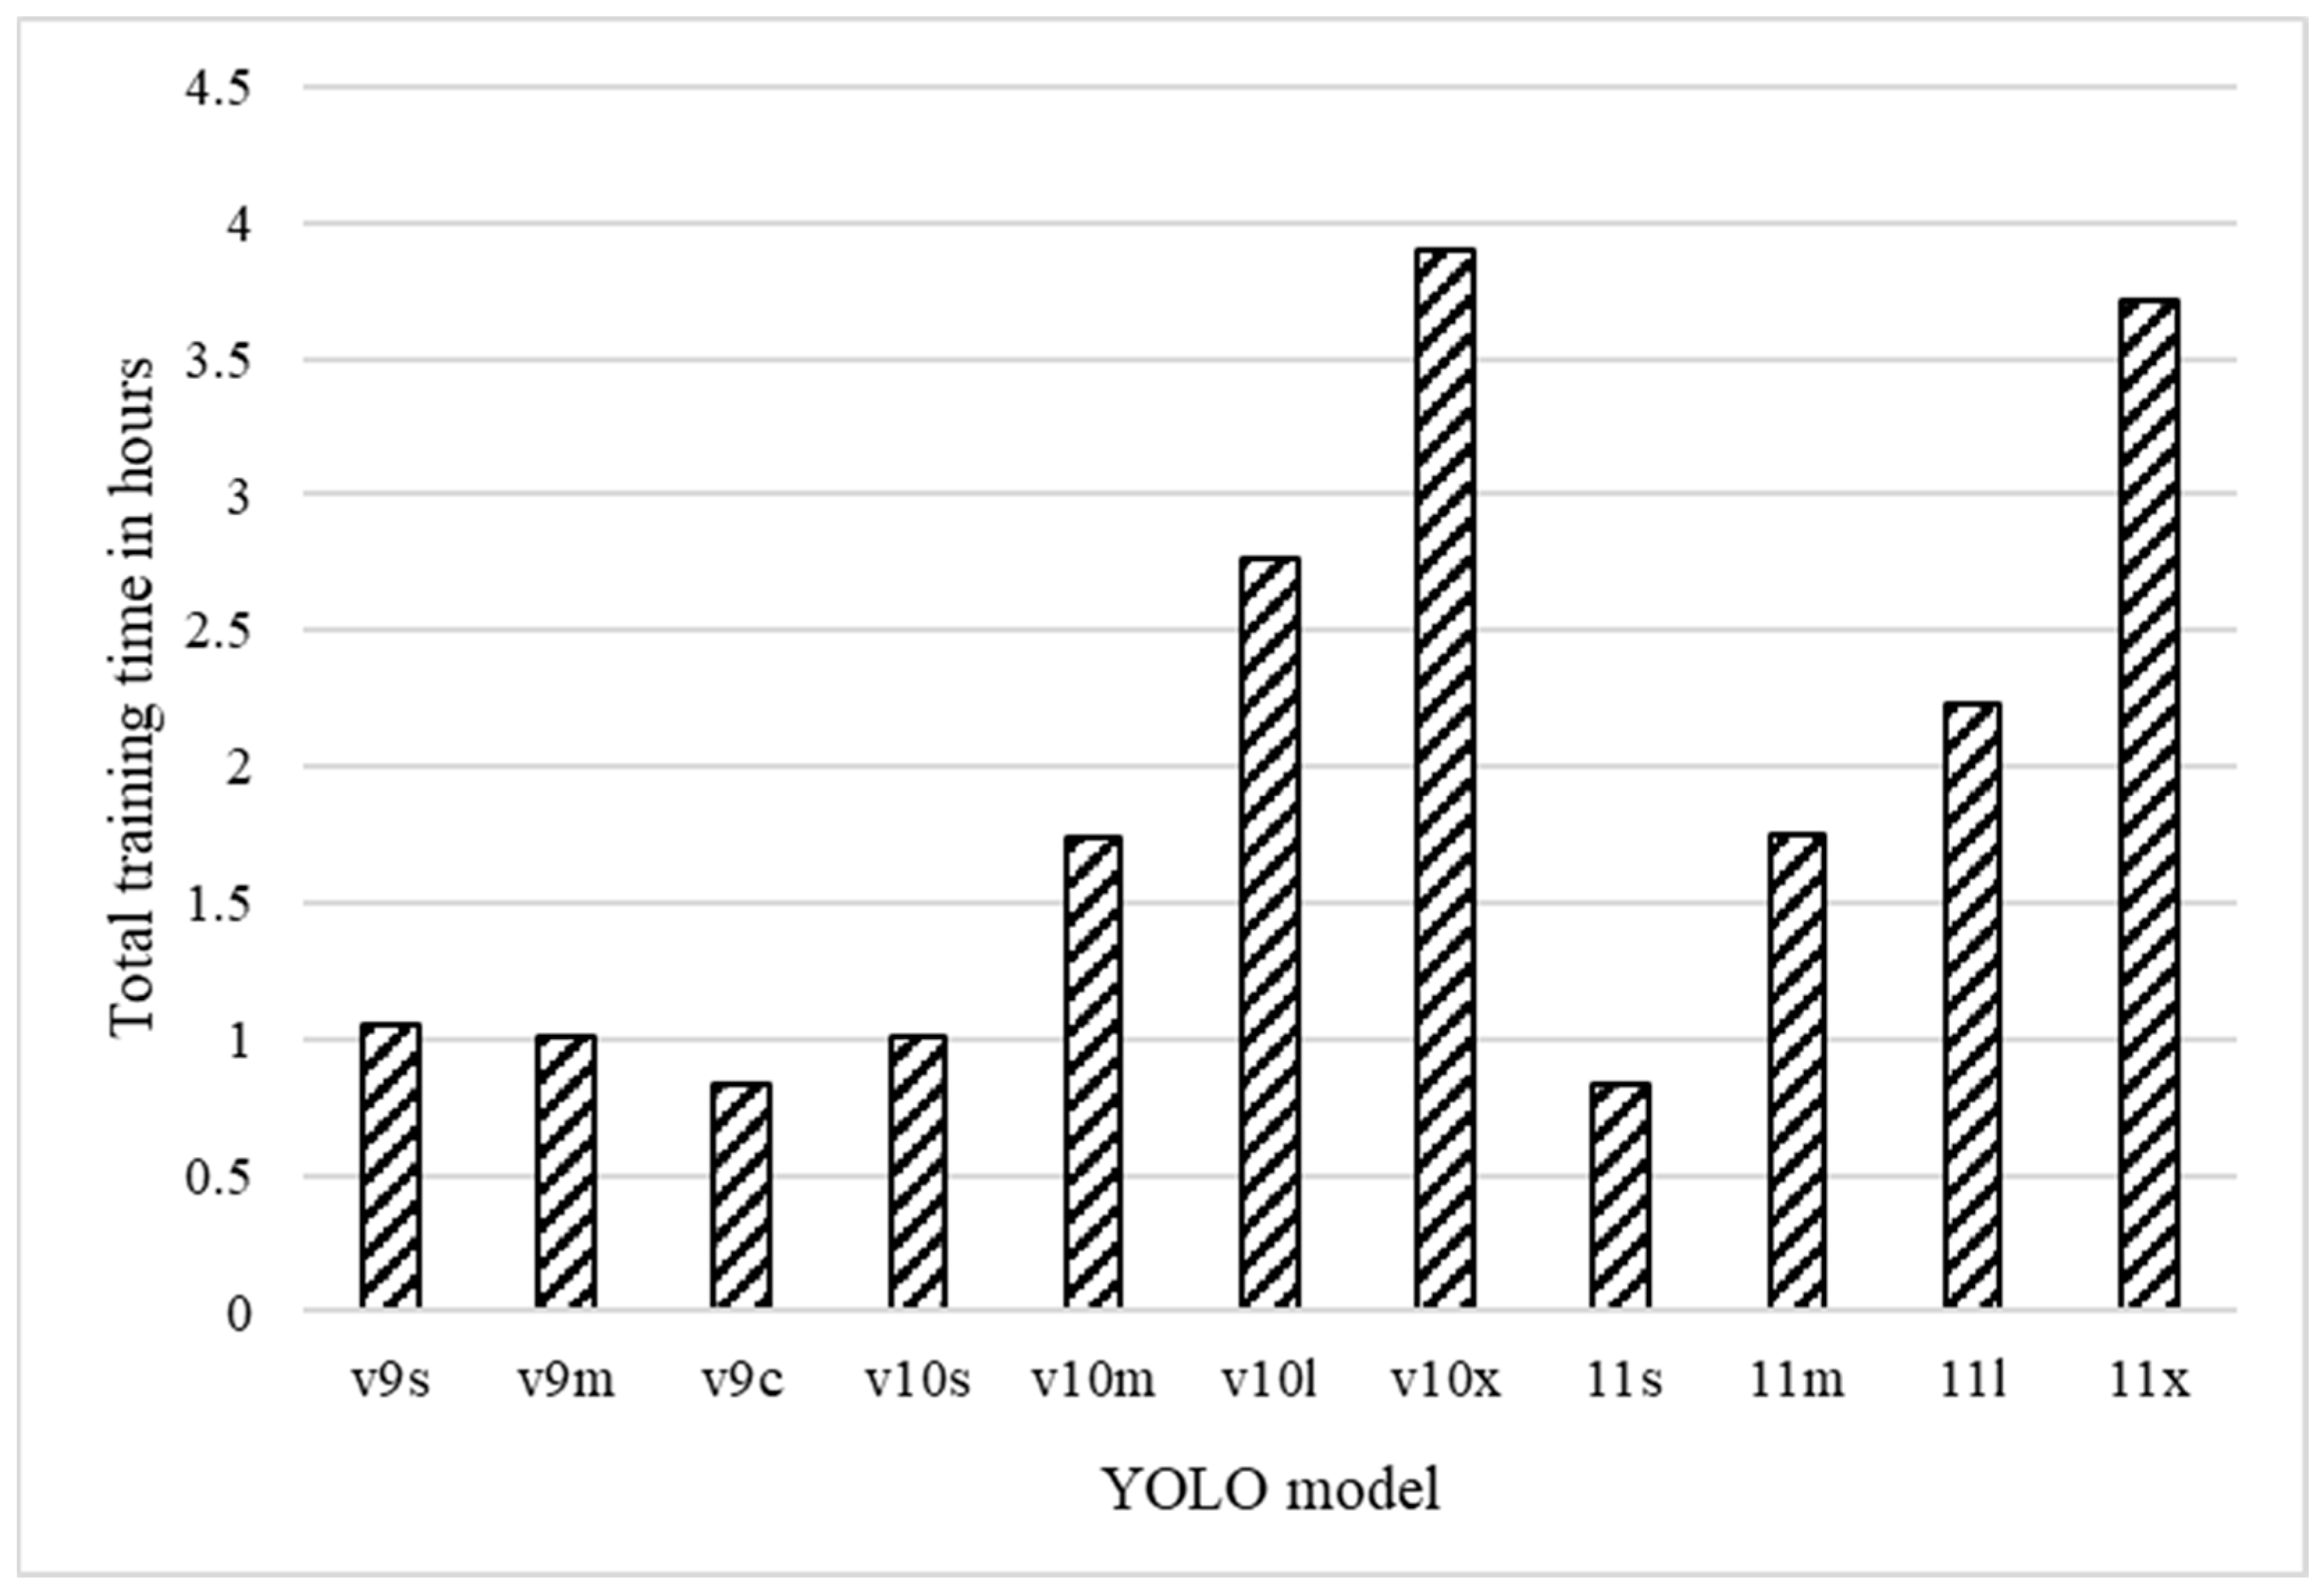
3.3. Computing Resource Use

Model size and training time were compared to evaluate the computing resource use of the trained models.

3.3.1. Model Size

Model size refers to the size of the saved best model’s weights after training. As shown in Figure 4, model size increased from smaller to larger variants (i.e., s < m < l < x) across the series. In the YOLOv9 series, YOLOv9c was the largest model trained by us, as l and x variants are not available. The YOLOv9m model size was larger than both YOLOv10m and YOLO11m. In addition, YOLOv10l was larger than YOLO11l. For all other variants, the latest series were larger (i.e., 11 > 10 > 9).
YOLOv9 models had the size of 15.2 MB, 40.8 MB, and 51.6 MB for YOLOv9s, YOLOv9m, and YOLOv9c, respectively. The YOLOv10 models had the size of 16.5 MB, 33.5 MB, 52.2 MB, and 64.1 MB for YOLOv10s, YOLOv10m, YOLOv10l, and YOLOv10x, respectively. YOLO11 models had the size of 19.2 MB, 40.5 MB, 51.2 MB, and 114.4 MB for YOLO11s, YOLO11m, YOLO11l, and YOLO11x, respectively. YOLOv9s was the smallest, while YOLO11x was the largest model trained for foraging detection.

3.3.2. Training Time

Figure 5 compares the total training time for foraging detection in each model. In the YOLOv10 and YOLO11 series, the larger versions trained slower than the smaller versions. However, for YOLOv9 series, the larger versions trained faster: YOLOv9c completed training in 0.83 h, followed by YOLOv9m in 1.01 h and YOLOv9s in 1.05 h, respectively. For the YOLOv10 series, YOLOv10s, YOLOv10m, YOLOv10l, and YOLOv11x completed the training in 1.01 h, 1.74 h, 2.76 h, and 3.9 h, respectively. Finally, for the YOLO11 series, YOLO11s, YOLO11m, YOLO11l, and YOLO11x completed the training in 0.83 h, 1.75 h, 2.23 h, and 3.71 h, respectively.

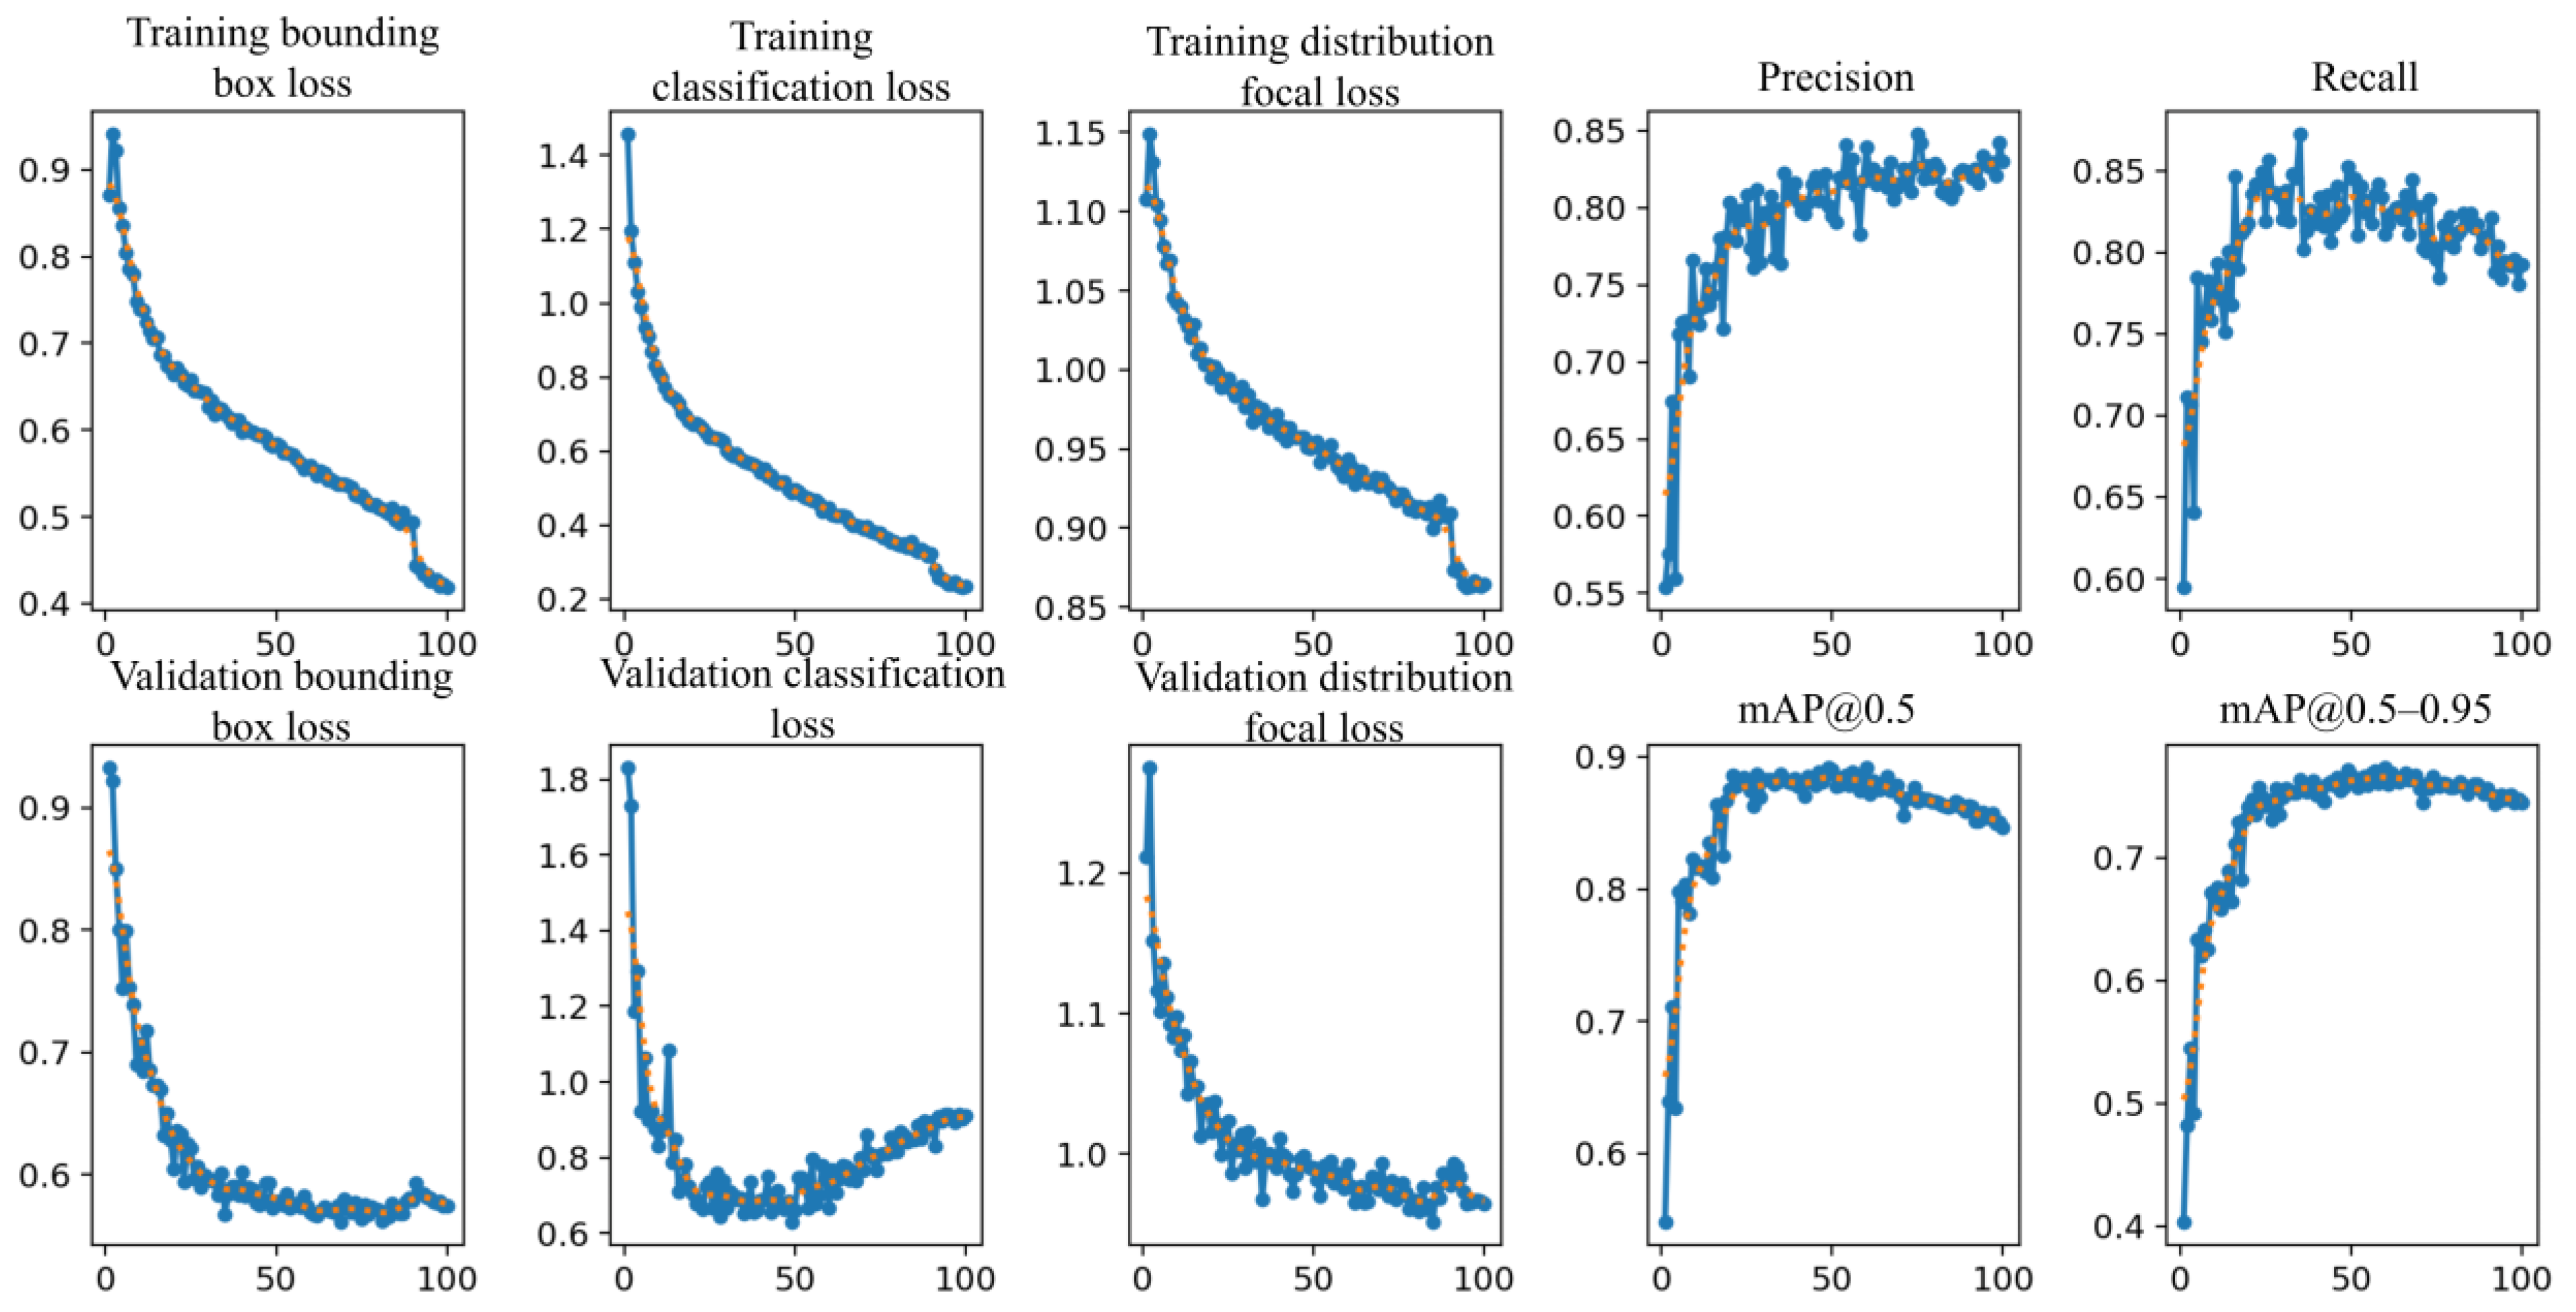
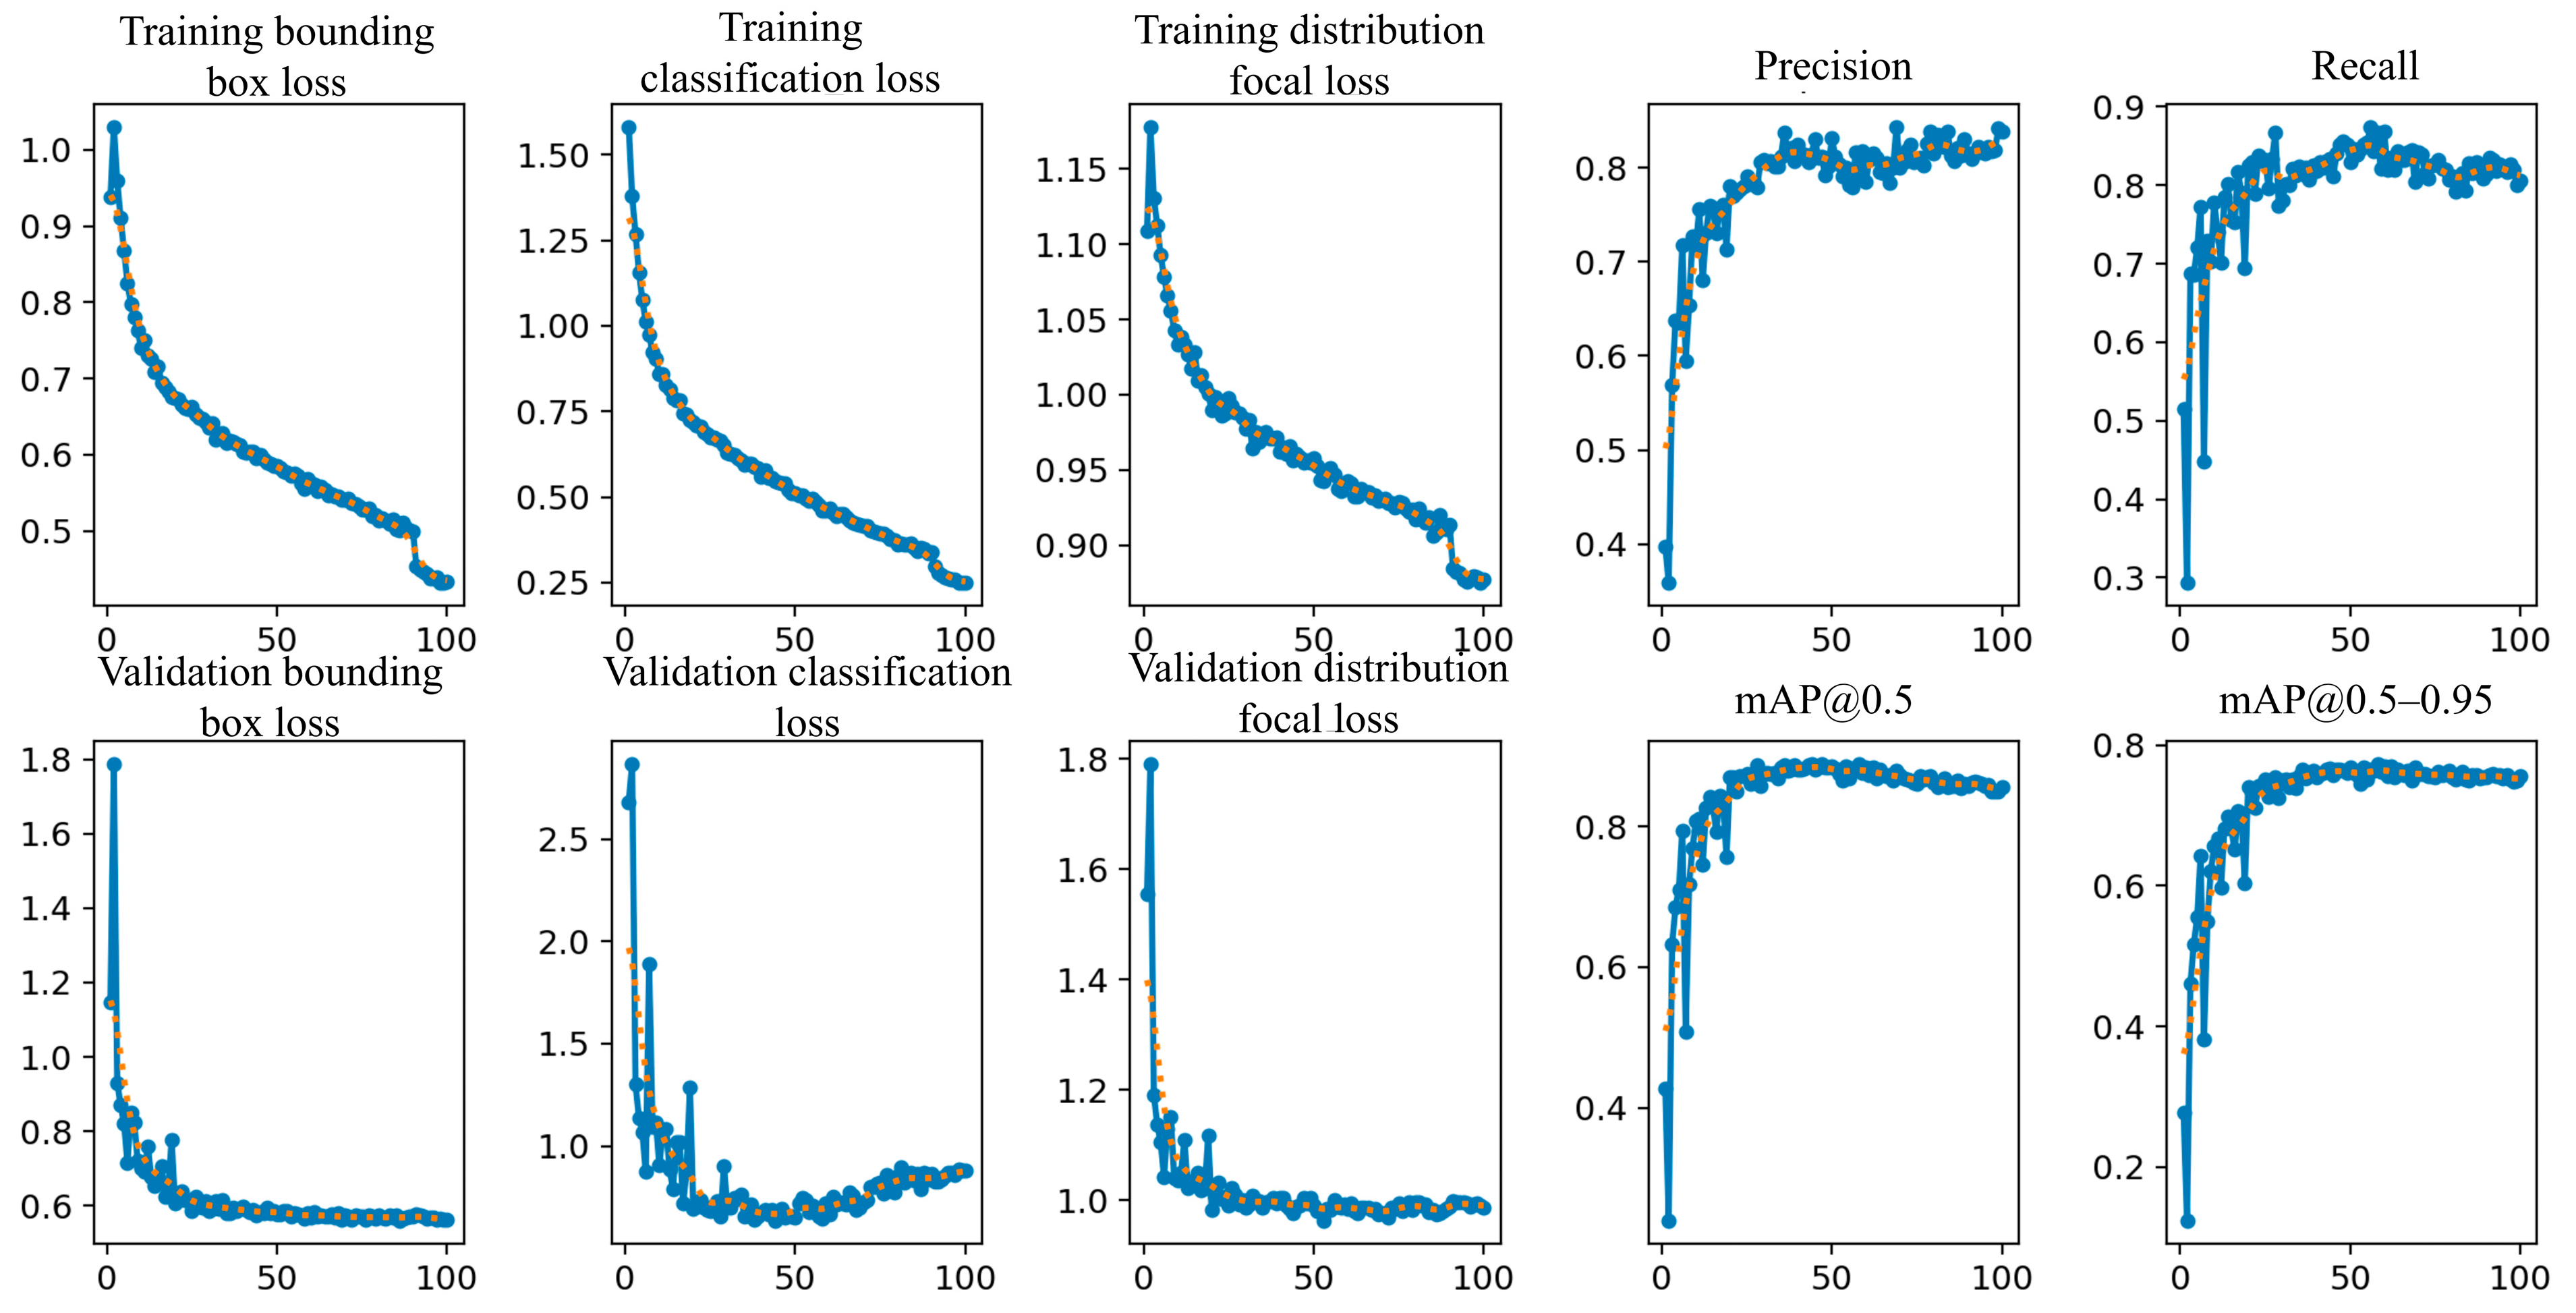
3.4. Model Training and Validation Evaluation

Evaluation of training and validation performance of the fine-tuned models for foraging detection was performed over 100 epochs. The results, obtained from three representative models—YOLOv9c, YOLO11m, and YOLO11x—are presented in Figure 6, Figure 7, and Figure 8, respectively.
Figure 6 shows the plots for the YOLOv9c model. The bounding box loss for training decreased from 0.87 to 0.42 steadily. The classification loss for training dropped from 1.46 to 0.23. The distribution focal loss for training decreased from 1.11 to 0.86. Initially, the losses decreased rapidly over the first 20 epochs, followed by a slower decline. We can again see a sudden decrease in losses around 90 epochs. Validation loss for bounding box decreased from 0.93 to 0.57. The validation classification loss decreased from 1.83 to 0.66 over the first 50 epochs but later increased to 0.91 by epoch 100. The validation distribution focal loss decreased from 1.21 to 0.96. The validation bounding box and distribution focal losses exponentially decreased for the first 20 epochs, then slowly declined until epoch 50, and then plateaued.
The precision increased from 0.55 to about 0.83, and recall increased from 0.59 to 0.79. mAP@0.5 increased from 0.40 to 0.89 by 50 epochs, then decreased to 0.85 by 100 epochs. mAP@0.5–0.95 increased from 0.40 to 0.74. Similar trends were observed across other models, as shown in Figure 7 and Figure 8 for YOLO11m and YOLO11x, respectively.

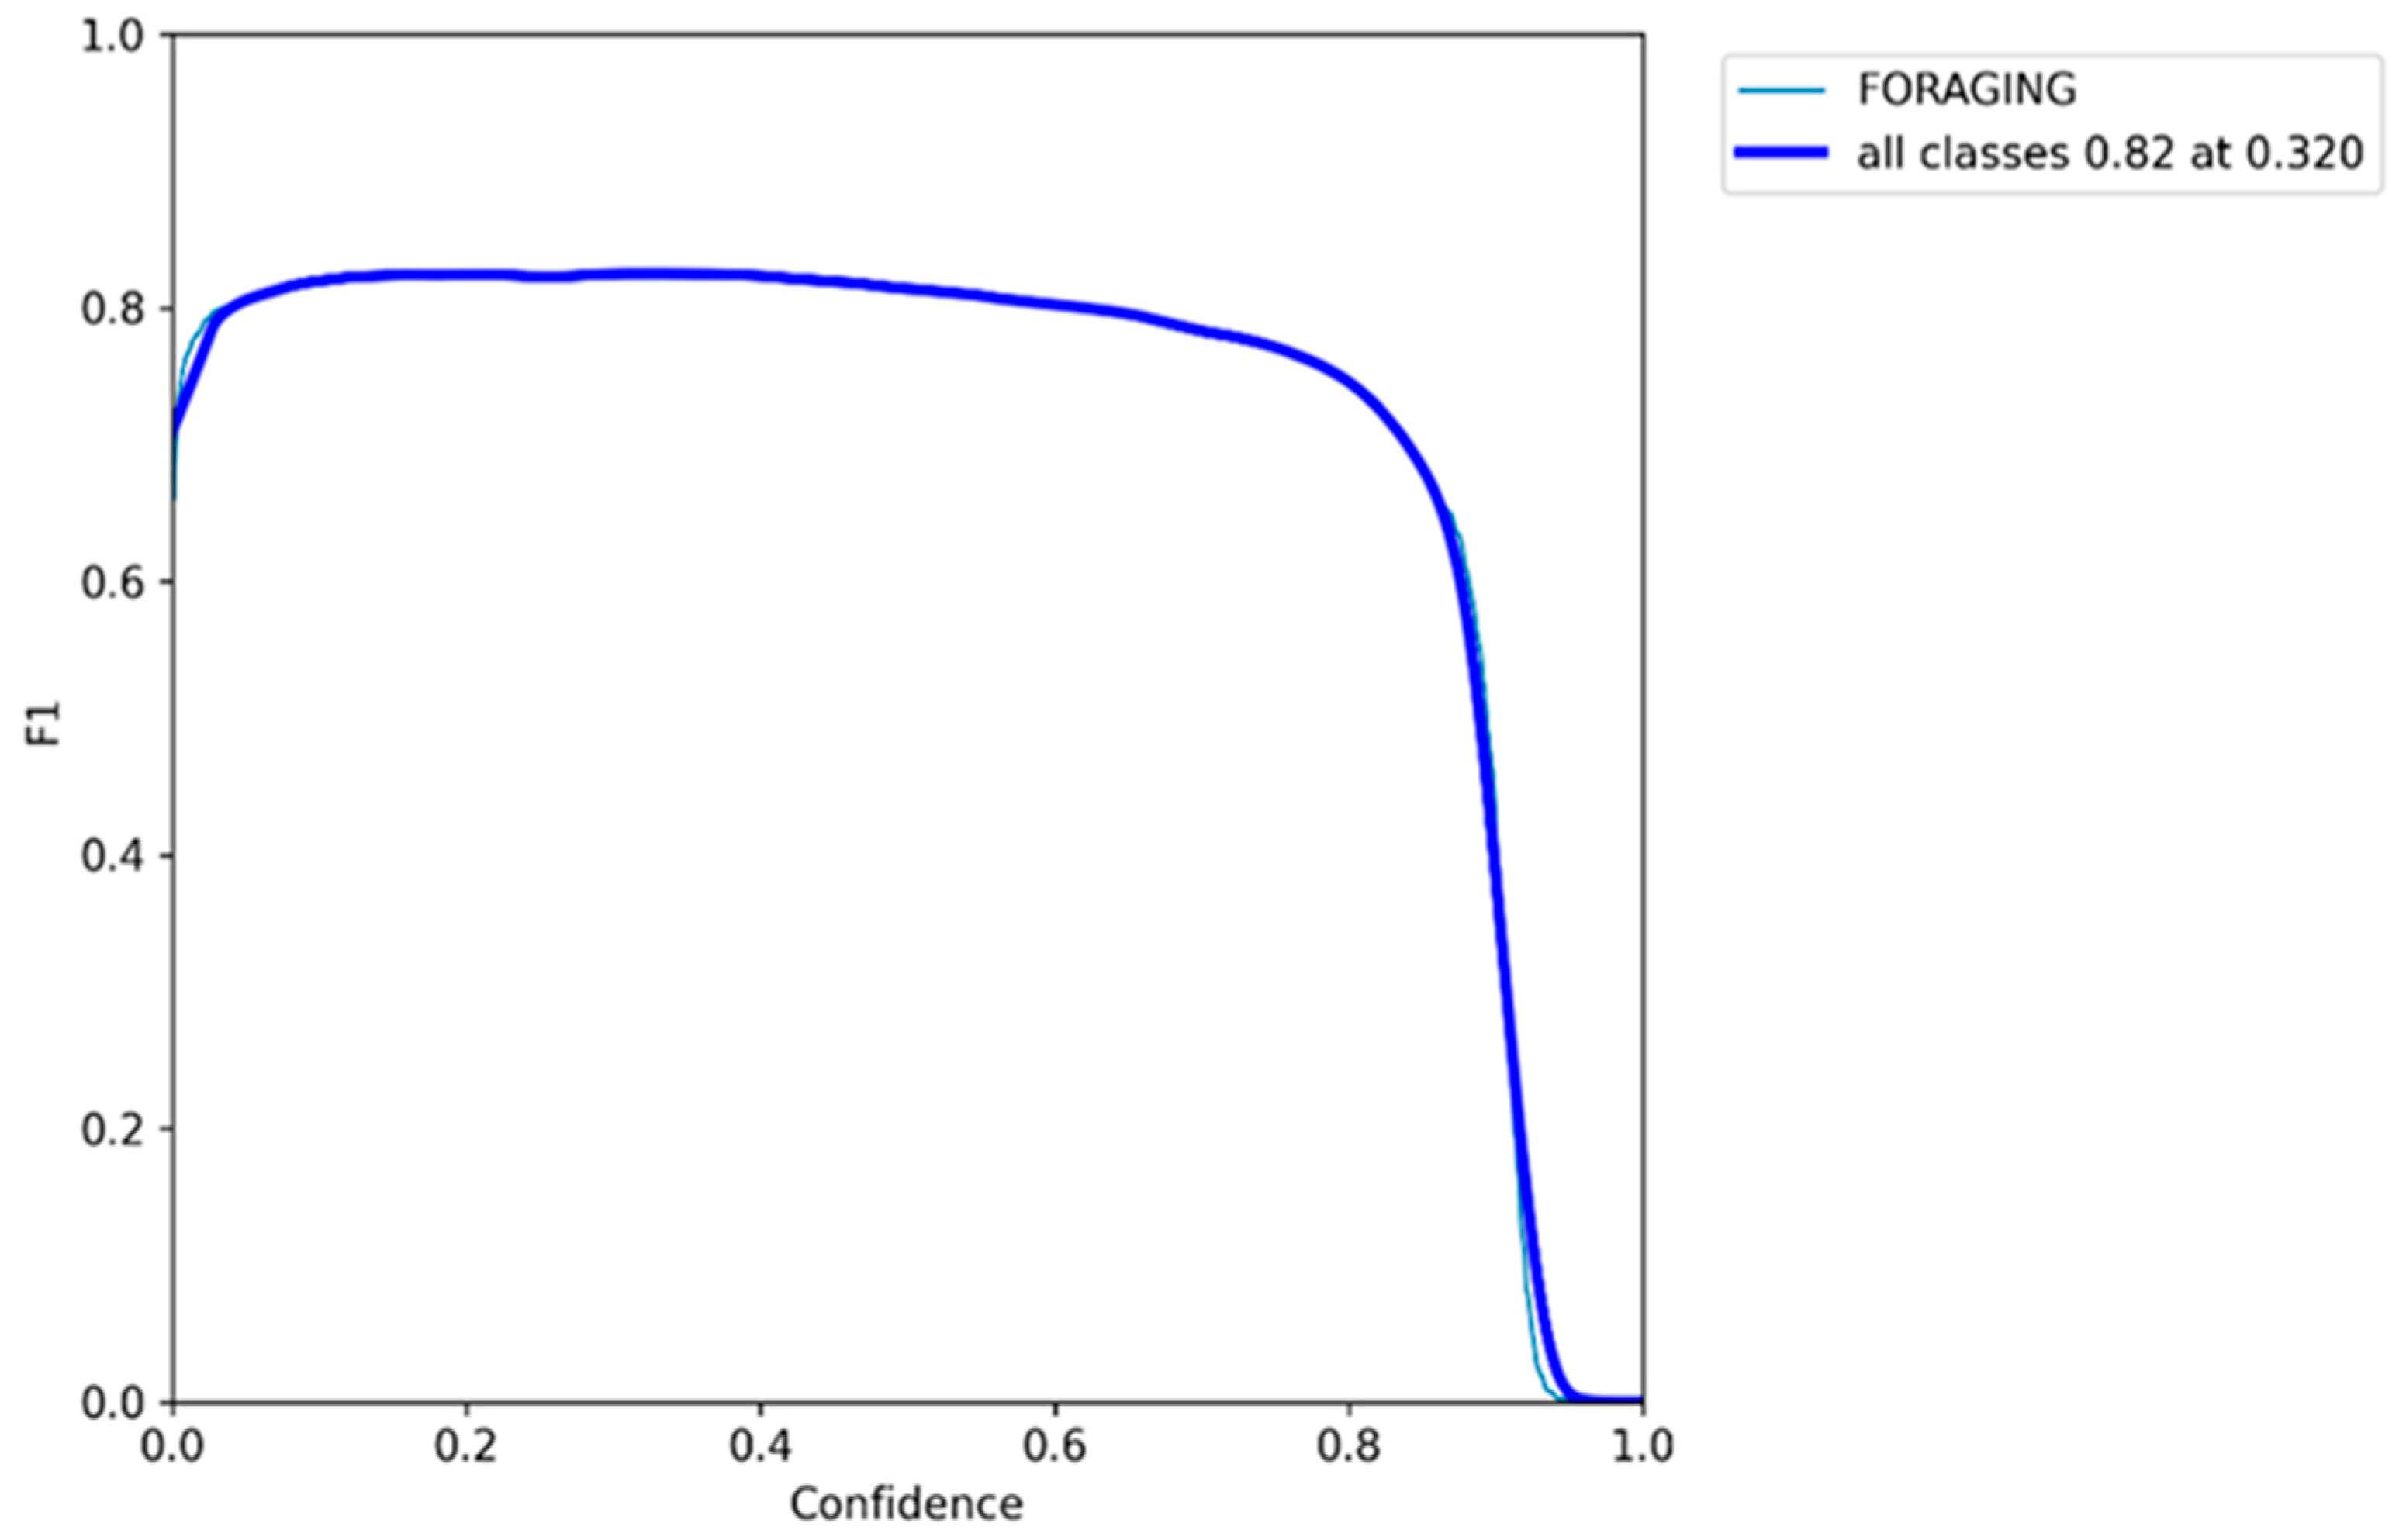
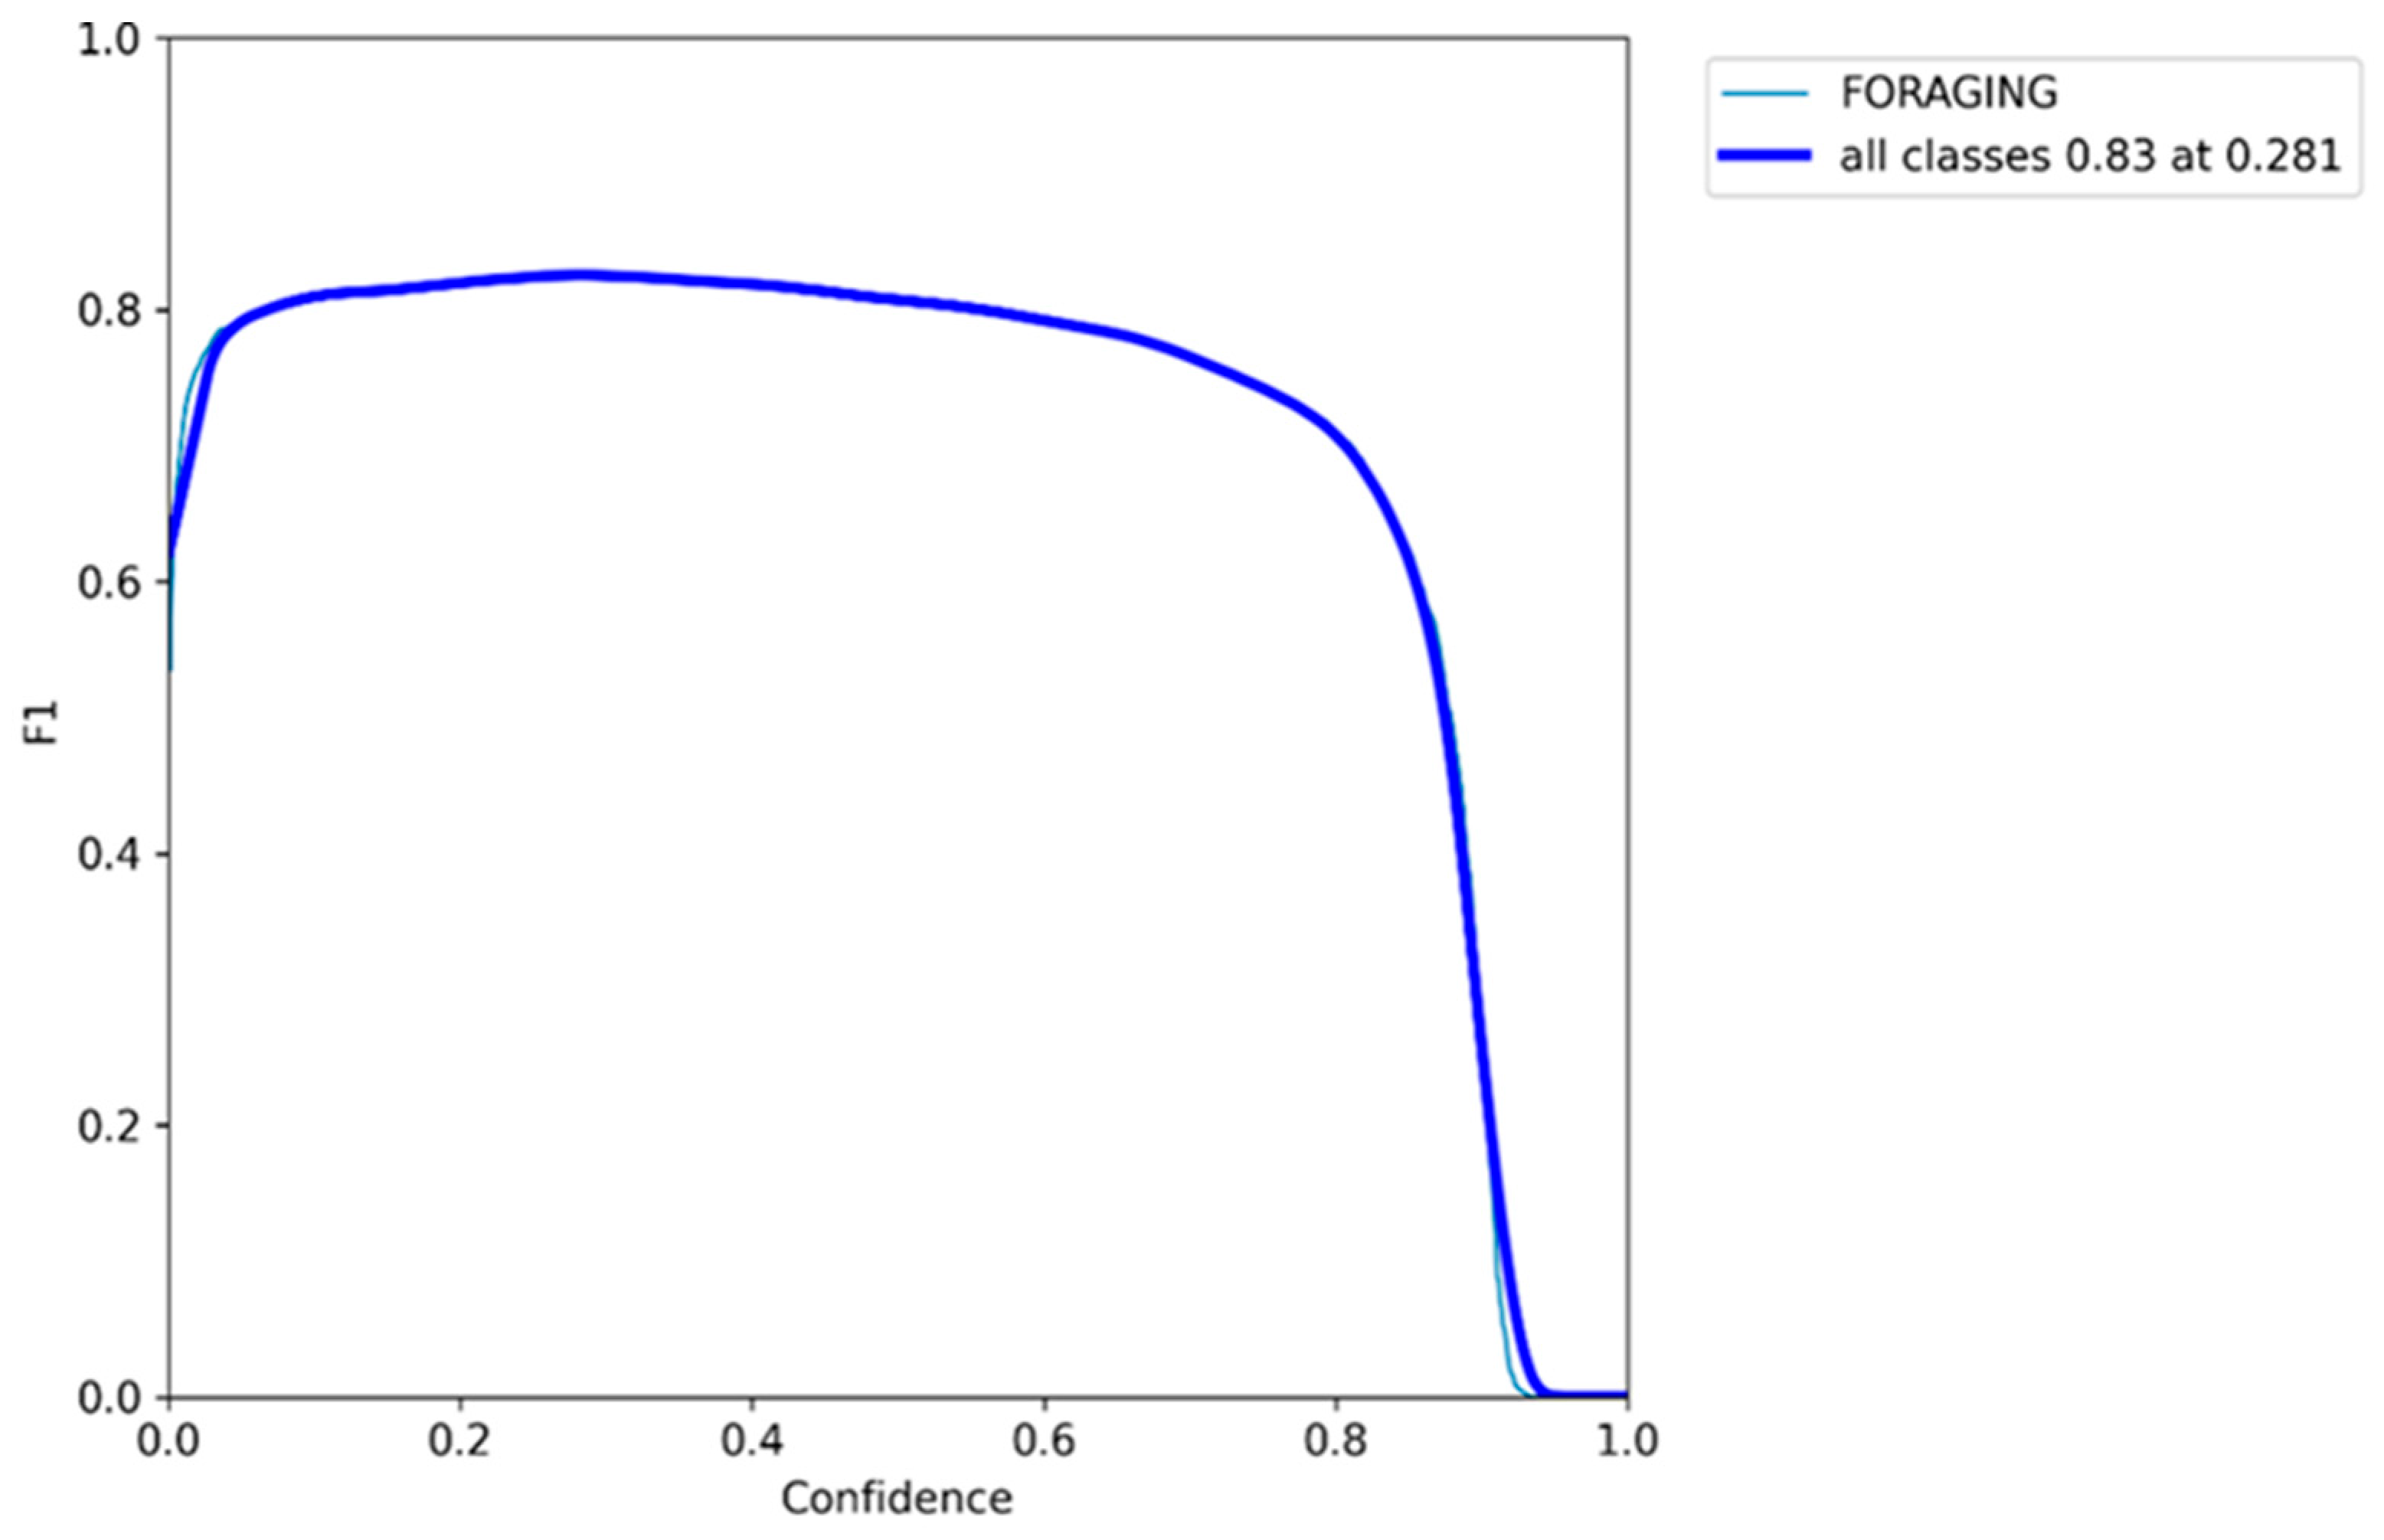
3.5. F1 Confidence Curve

F1 score represents the harmonic mean of precision and recall. The F1 confidence curve shows the F1 score across varying confidence thresholds. F1 scores peak at specific confidence thresholds and then decline with increasing confidence threshold, as shown in Figure 9, Figure 10, and Figure 11 for models YOLOv9c, YOLO11m, and YOLO11x, respectively. Across all the trained models, F1 scores initially peaked at lower confidence, remained stable at a higher confidence level up to around 0.8, and subsequently declined sharply. All the models achieved a peak F1 score greater than 0.8. In the YOLOv9 series, YOLOv9s achieved a peak F1 score of 0.83, while both YOLOv9m and YOLOv9c reached 0.82. In the YOLOv10 series, YOLOv10s achieved a peak F1 score of 0.82, YOLOv10x reached 0.83, while both YOLOv10m and YOLOv10l reached 0.81. For the YOLO11 series, all the models had a peak F1 score of 0.83, except for YOLO11s, which reached 0.84.

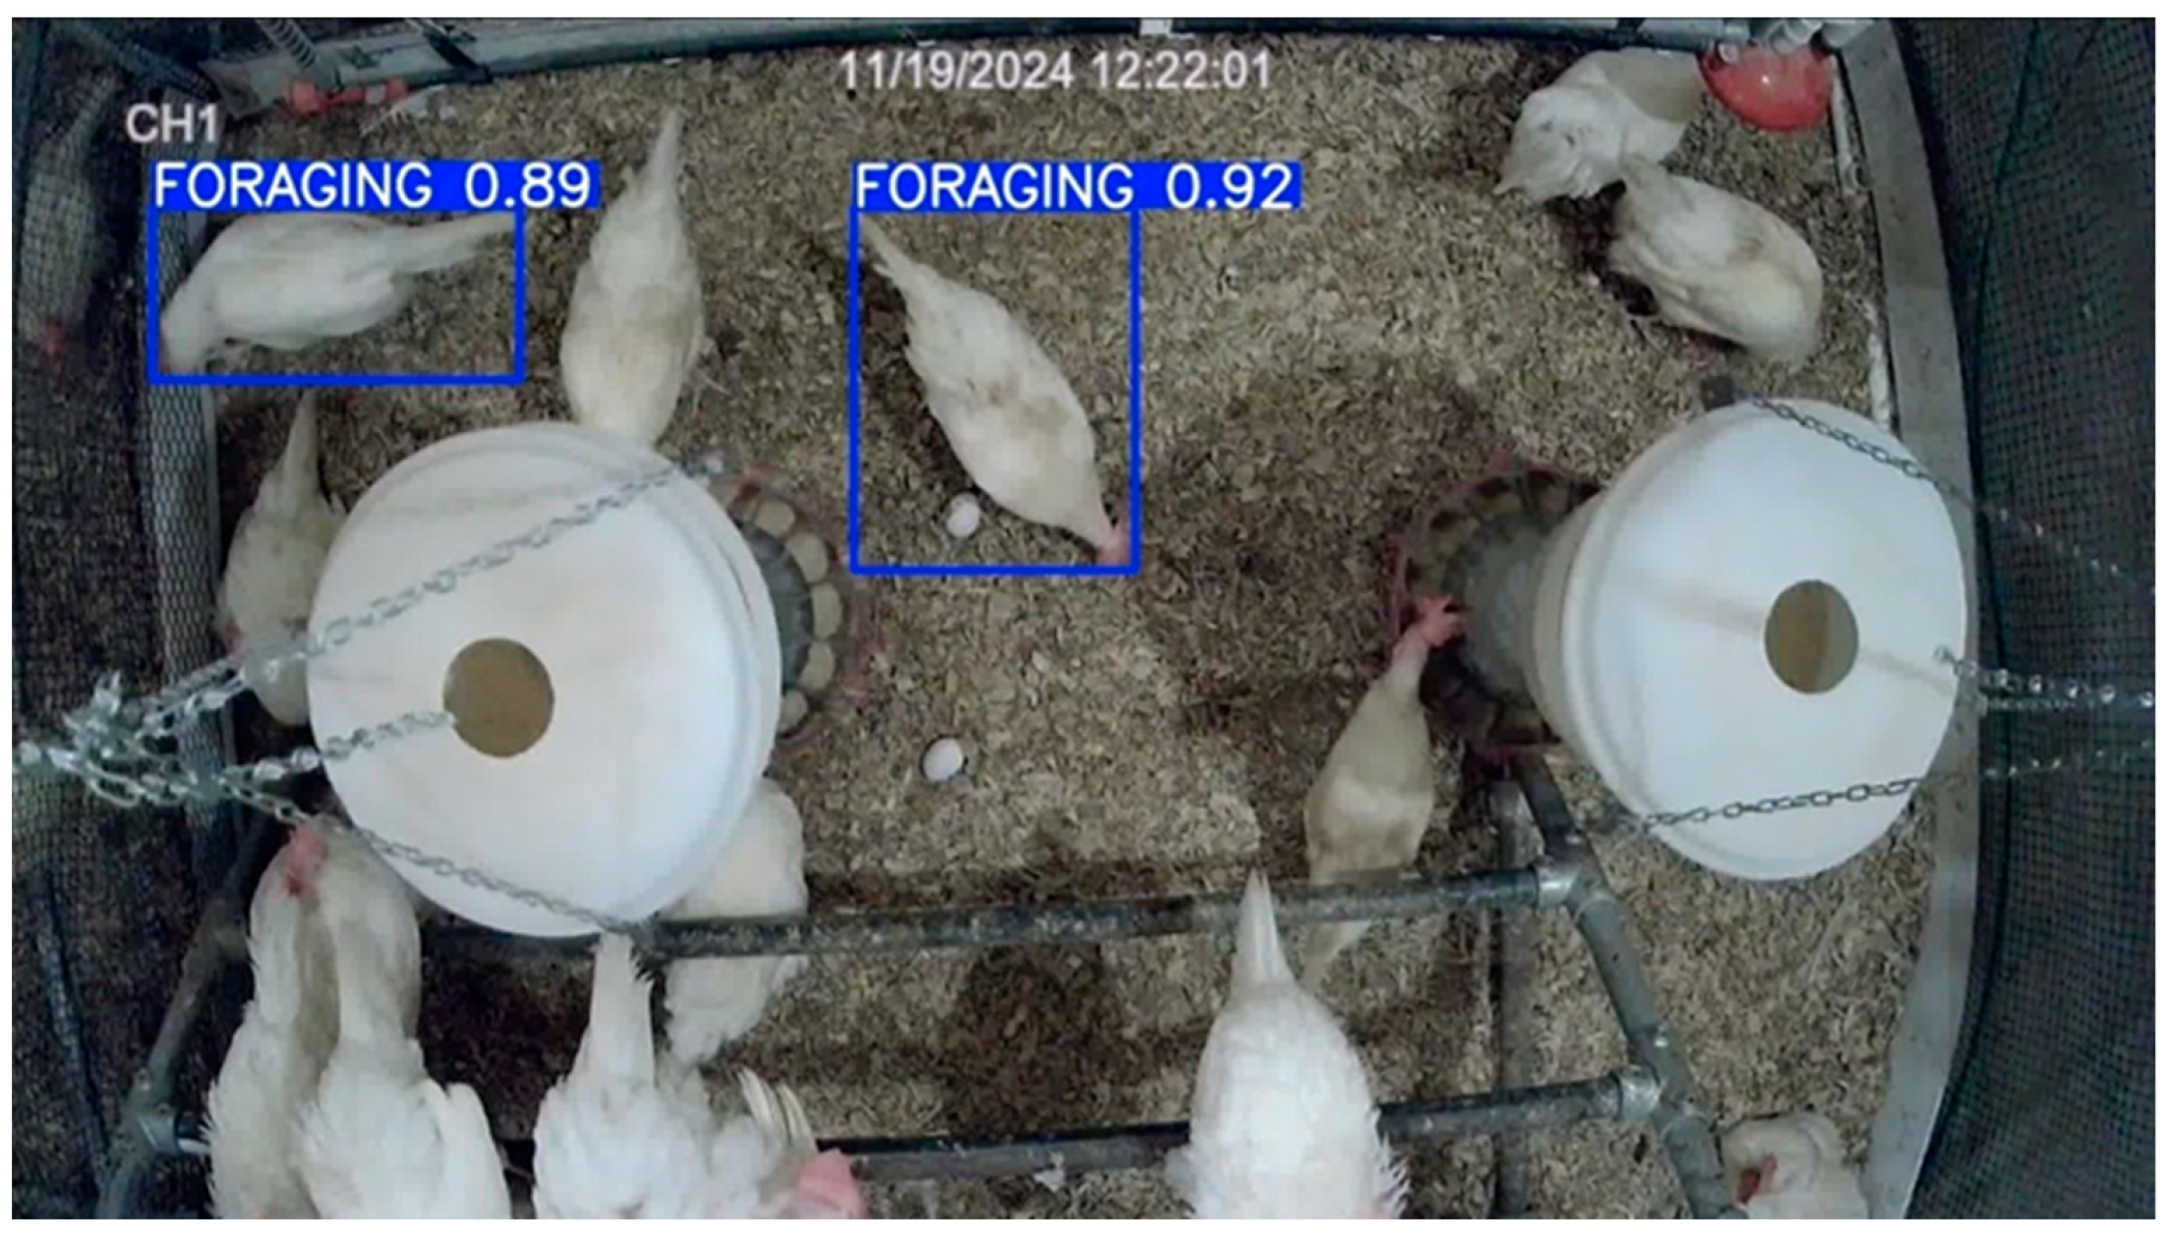
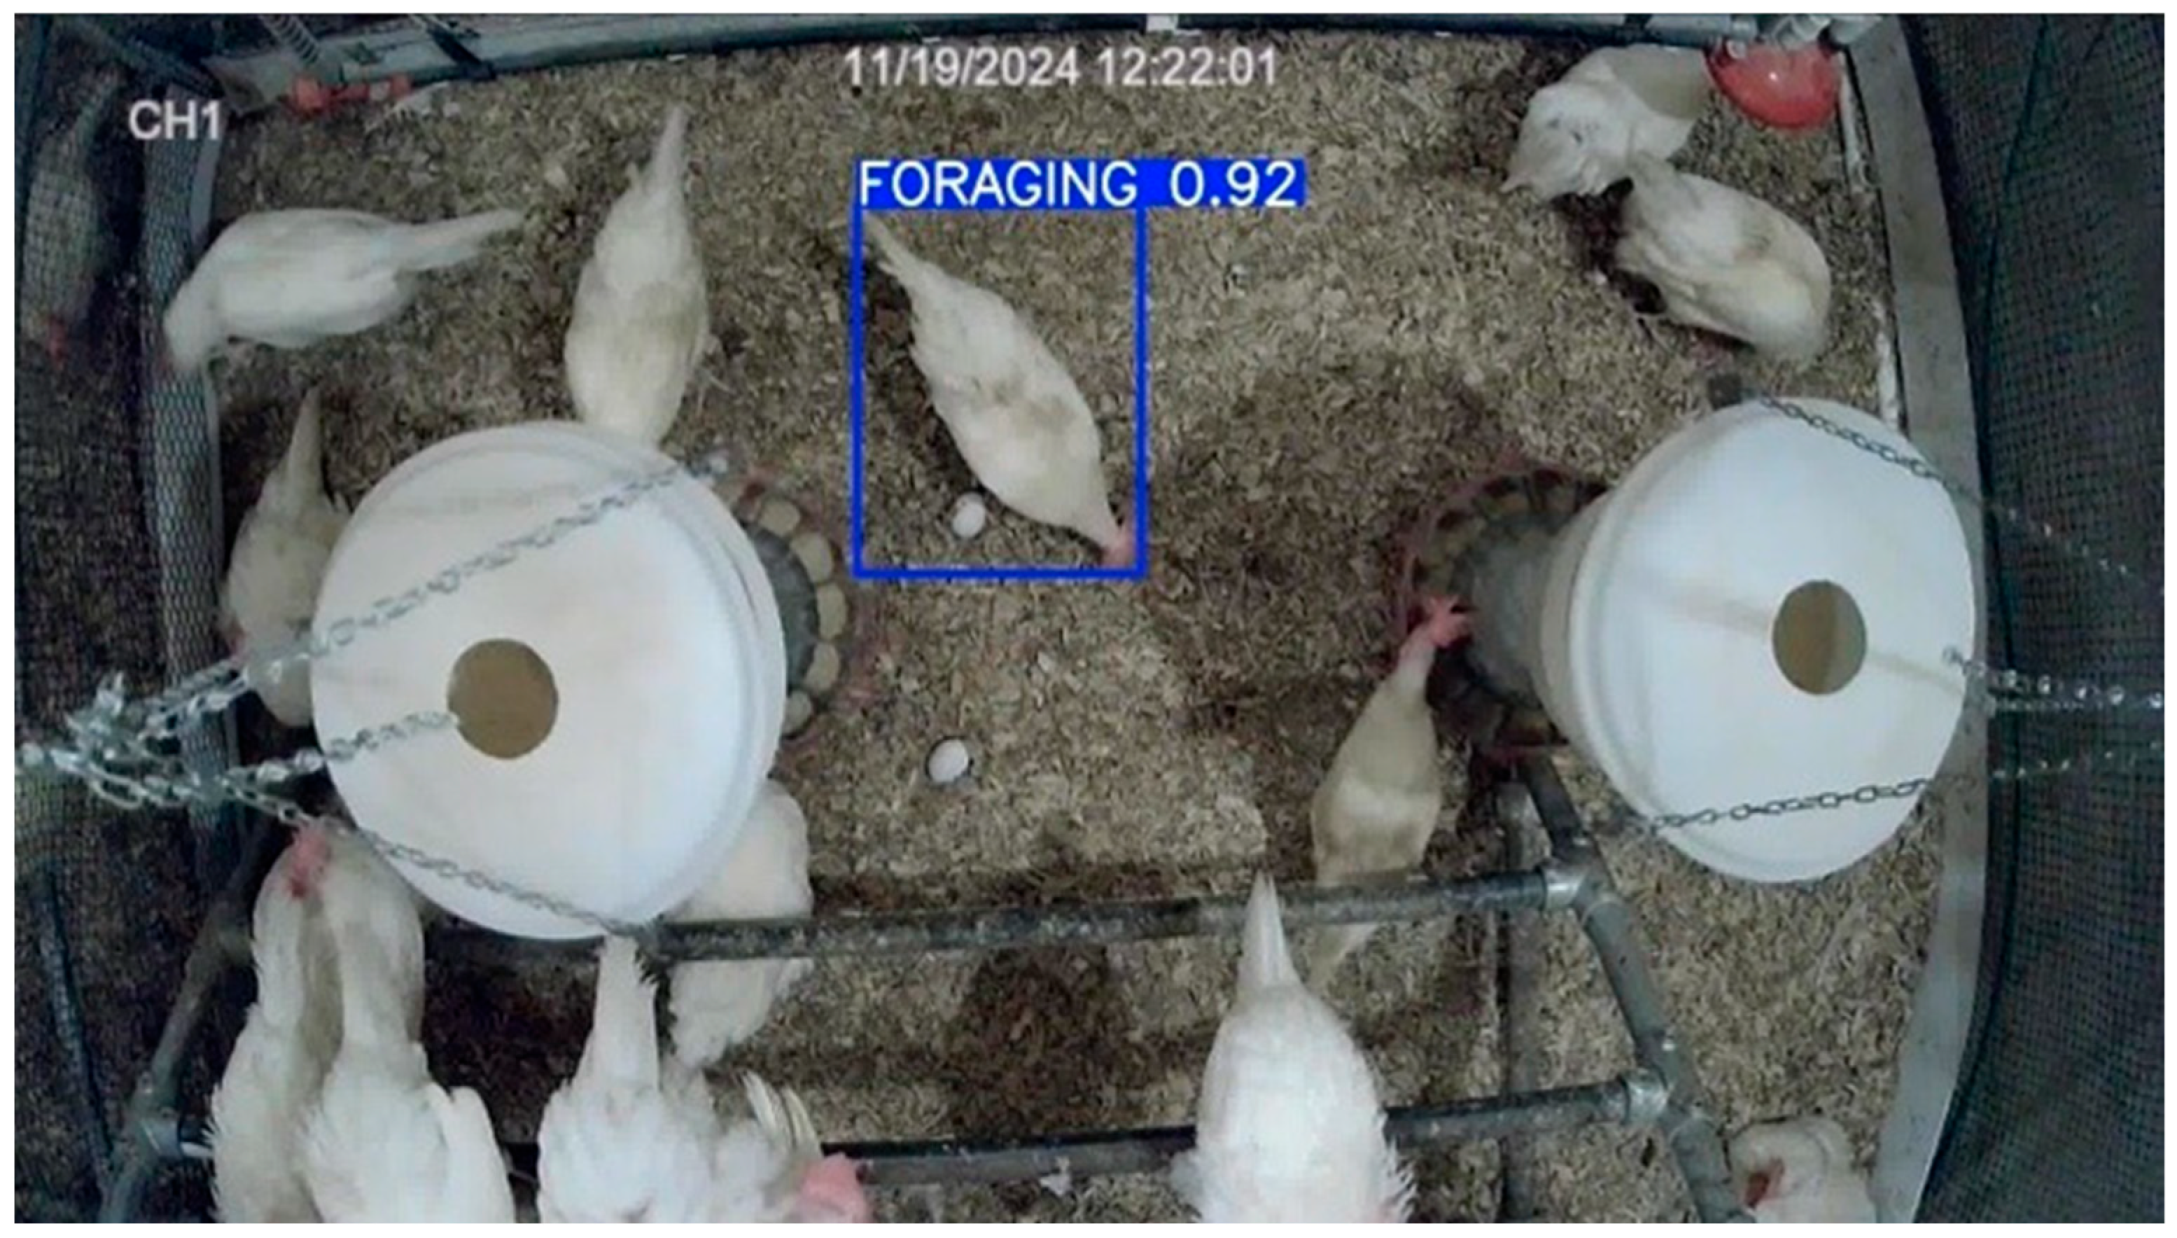
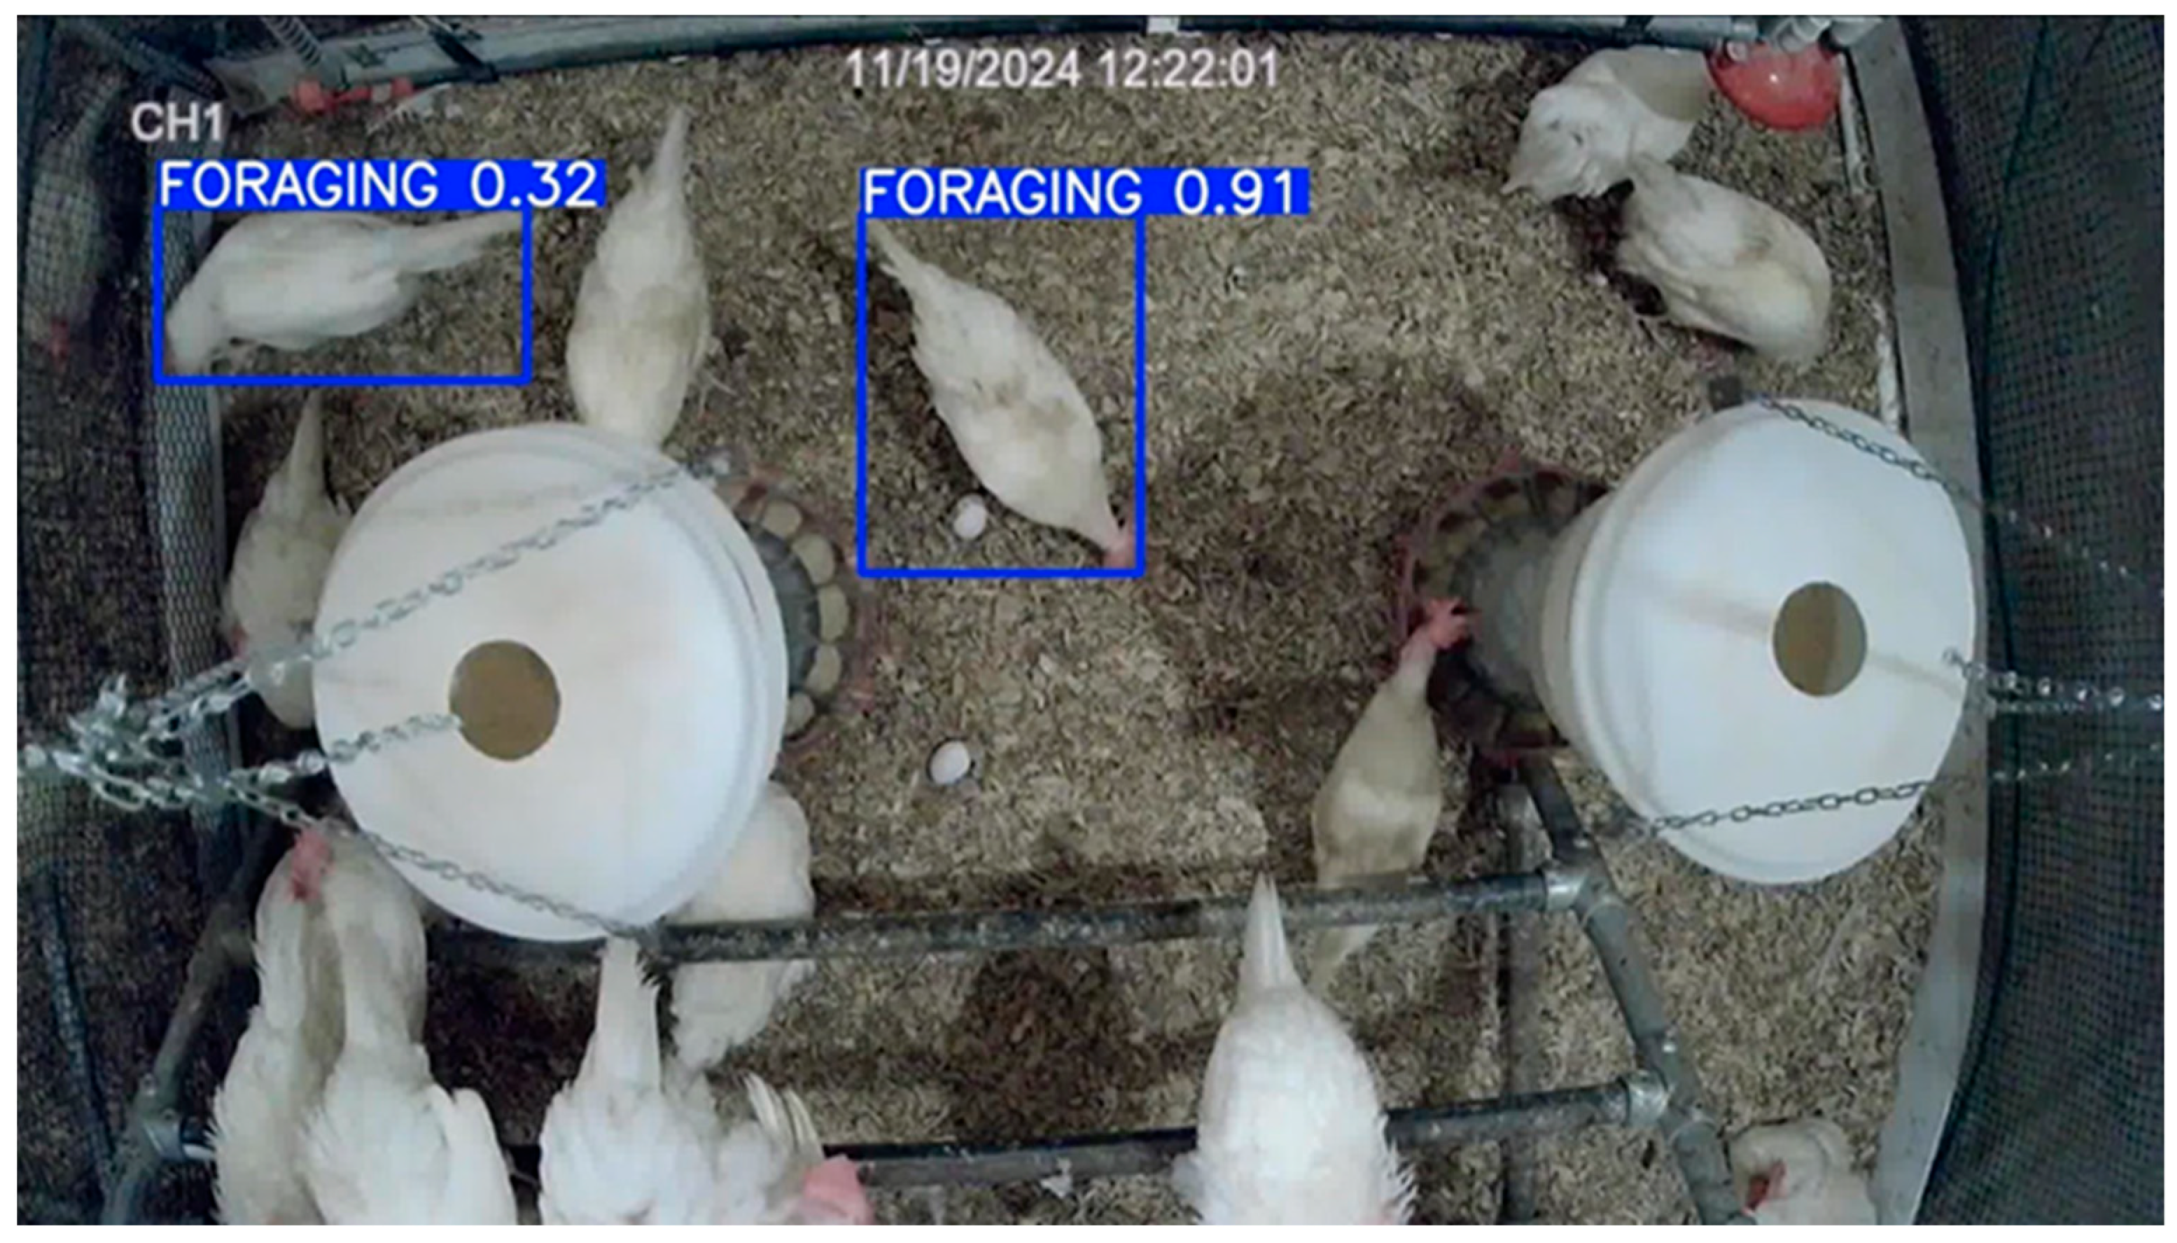
3.6. Model Deployment in Test Dataset

The models were tested on datasets not included in the training or validation dataset. Figure 12, Figure 13, and Figure 14 present examples of models detecting foraging instances in randomly selected images of hens for YOLOv9c, YOLO11m, and YOLO11x, respectively. We observed variations in predictions among models with differences in confidence score displayed above the bounding box. Bounding boxes are displayed only for predictions with a confidence score of 0.25 or higher.
In the test image used here as an example, there are three instances of foraging. In this specific frame, YOLOv9c produced relatively high-confidence predictions. However, none of the three models were able to predict all the foraging instances from this image. This shows that the detection robustness is still limited.

4. Discussion

Optimal models can be selected based on the specific aim, whether to reduce either the false positive or the false negative cases. According to the results obtained, YOLOv9c is the most reliable model when a hen is predicted to be foraging. Meanwhile, YOLO11x is the most reliable model to ensure that no foraging instance is missed. For an overall balanced approach, YOLO11m gave the best result.
The results from our study show improvements in foraging detection performance compared to the earlier approach. In a recent study, YOLOv5 and YOLOv7 models were trained to detect and classify multiple behaviors, including foraging [29]. However, the models performed poorly, achieving precision, recall, and mAP@0.5 below 70% for the foraging class, which might be due to the limited trained dataset (1500 images). Training datasets with fewer instances have been found to demonstrate poor performance [31]. In contrast, YOLOv7 and YOLOv8 models trained to detect dust bathing behavior in hens achieved precision and mAP@0.5 greater than 90% and recall greater than 85% [24]. These models were trained on 4200 images with more birds per room than in our study. Relatively lower performance of the models may reflect the complex nature of foraging behavior and its detection using still images, which can be explored further.
The false positive rate in the confusion matrix might seem to be one. However, this is because of the validation data being exclusively of the images with at least one instance of foraging. Similar object detection projects also had a false positive rate value of one [25,32]. In a study, YOLOv5 variants were trained to detect pecking in CF hens, but they obtained true positive rates below 65% [32]. This low performance might be due to the use of older YOLO models and a small training dataset of only 1300 images [28,31].
For different object detection tasks, a study trained various YOLO models, including the models used in our study, and reported the model sizes, which were comparable to the corresponding model sizes in our study [28]. Compared to the models trained to classify multiple behaviors, the models used in this study were generally smaller and trained faster [29]. This might be due to the differences in computational resources, training epochs, and the model used. Smaller models with short training times are more suited for real-time settings, as they lower the computational resources required.
Decreasing loss in the model training signifies that the model is learning and enhancing its predictability [33]. However, in our study, after 50 epochs, the validation loss curves decreased only slightly. Also, the classification loss began to increase, suggesting that the model is slightly overfitting for classification. Increasing the training dataset diversity may solve this problem and make the model more robust. In addition, we did not implement early stopping, which could have helped prevent overfitting. This study aimed to compare performance after training each of the models to a predetermined 100 epochs. Future work should incorporate early stopping to control overfitting and optimize the model.
All the models achieved their peak F1 scores at lower confidence thresholds. The highest confidence threshold for the peak F1 score was 0.32, which was for YOLOv9m, while the lowest was 0.11 for YOLOv10s. This shows that the models are calibrated for optimal overall performance at lower confidence thresholds [33]. A study for detection of perching behavior obtained peak F1 scores above 0.9 with the peaks at confidence threshold of 0.33 to 0.40 [25]. This exceptional F1 score from this model may be attributed to the presence of perches as visual cues in the images. In contrast, foraging does not have specific visual cues to help the models recognize the behavior easily.
The limitations of trained models might be due to various challenges of behavioral detection in poultry. Poultry houses are complex with frequent occlusions by feeders, drinkers, and other equipment. Some of the problems mentioned in other similar studies, like overlapping birds and dust, might have limited the efficiency of the model [25]. To overcome such challenges, linear and fitting restoration methods have been developed that can restore the occluded chicken area by more than 80% at a time [34]. Further work might incorporate this restoration technique.
Relying on overhead 2D images might have limited the model’s performance. This limitation was addressed by proposing a CNN-based classification method to recognize poultry flock behaviors using both color and depth images, reporting an impressive 99.17% accuracy [35]. This highlights the potential of depth imaging technology, which can enhance behavior detection models. Furthermore, behaviors can be hard to predict using a still frame or image as they are dictated by a sequence of actions. Using models like 3D CNNs for action recognition might be a better option to have a precise detection of poultry behaviors. The models were trained using images annotated by humans, which act as the ground truth. Such annotations can often vary according to people. Future work should focus on cross-validation in commercial settings to enhance the reliability of models.

5. Conclusions

This study demonstrates the use of computer vision to automatically detect foraging behavior in a CF research environment. In our study, YOLOv9c achieved the highest precision (83.9%), YOLLO11x achieved the highest recall (86.7%), and YOLO11m achieved the highest mAP@0.5 (89.5%). These models show potential for use in studies involving foraging observations. It can also be used to develop a real-time automatic system for detection and tracking of foraging behaviors in commercial CF hens after further work focusing on training diverse images, using depth imaging, and optimizing camera placement to enhance model robustness.

Author Contributions

Conceptualization, L.C.; methodology, S.D. and L.C.; formal analysis, S.D.; investigation, S.D., X.Y., B.P., A.D. and L.C.; resources, L.C.; writing—original draft preparation, S.D., X.Y., B.P., A.D. and L.C.; writing—review and editing, S.D., X.Y., B.P., A.D. and L.C.; visualization, S.D., X.Y., B.P., A.D. and L.C.; supervision, L.C.; project administration, L.C.; funding acquisition, L.C. All authors have read and agreed to the published version of the manuscript.

Funding

This research was funded by the USDA-NIFA AFRI (2023-68008-39853), Georgia Research Alliance (Venture Fund), and UGA Institute for Integrative Precision Agriculture.

Institutional Review Board Statement

Animal Care and Use Committee (IACUC) at the UGA approved all the animal use and management procedures of the study (AUP#: A2023 02-024), approved on 27 March 2023.

Informed Consent Statement

Not applicable.

Data Availability Statement

The original contributions presented in this study are included in the article. Further inquiries can be directed to the corresponding author.

Conflicts of Interest

The authors declare no conflicts of interest. The funders had no role in the design of the study; in the collection, analyses, or interpretation of data; in the writing of the manuscript; or in the decision to publish the results.

Abbreviations

The following abbreviations are used in this manuscript:
CFCage-free
CCConventional cages
CNNConvolutional Neural Network
YOLOYou Only Look Once
UGAUniversity of Georgia
IACUCInstitutional Animal Care and Use Committee
mAPMean average precision
IoUIntersection over union
mAP@0.5Mean average precision at 50% intersection over union

References

  1. Myers, M.; Ruxton, C.H.S. Eggs: Healthy or Risky? A Review of Evidence from High Quality Studies on Hen’s Eggs. Nutrients 2023, 15, 2657. [Google Scholar] [CrossRef] [PubMed]
  2. El-Sabrout, K.; Aggag, S.; Mishra, B.; Ortiz, L.T. Advanced Practical Strategies to Enhance Table Egg Production. Scientifica 2022, 2022, 1393392. [Google Scholar] [CrossRef] [PubMed]
  3. Gautron, J.; Réhault-Godbert, S.; Van de Braak, T.; Dunn, I. Review: What are the challenges facing the table egg industry in the next decades and what can be done to address them? Animal 2021, 15, 100282. [Google Scholar] [CrossRef] [PubMed]
  4. Cavero, D.; Schmutz, M.; Bessei, W. Welfare aspects in egg production. Lohmann Inf. 2022, 54, 20–32. [Google Scholar]
  5. Rodenburg, T.B.; Giersberg, M.F.; Petersan, P.; Shields, S. Freeing the hens: Workshop outcomes for applying ethology to the development of cage-free housing systems in the commercial egg industry. Appl. Anim. Behav. Sci. 2022, 251, 105629. [Google Scholar] [CrossRef]
  6. Lusk, J.L. Consumer preferences for cage-free eggs and impacts of retailer pledges. Agribusiness 2018, 35, 129–148. [Google Scholar] [CrossRef]
  7. Caputo, V.; Staples, A.J.; Tonsor, G.T.; Lusk, J.L. Egg producer attitudes and expectations regarding the transition to cage-free production: A mixed-methods approach. Poult. Sci. 2023, 102, 103058. [Google Scholar] [CrossRef] [PubMed]
  8. Dong, X. Why did U.S. food retailers voluntarily pledge to go cage-free with eggs? Eur. Rev. Agric. Econ. 2025, 52, 98–122. [Google Scholar] [CrossRef]
  9. Hartcher, K.M.; Jones, B. The welfare of layer hens in cage and cage-free housing systems. World’s Poult. Sci. J. 2017, 73, 767–782. [Google Scholar] [CrossRef]
  10. Appleby, M.C.; Hughes, B.O. Welfare of laying hens in cages and alternative systems: Environmental, physical and behavioural aspects. World’s Poult. Sci. J. 1991, 47, 109–128. [Google Scholar] [CrossRef]
  11. Dawkins, M.S. Time budgets in Red Junglefowl as a baseline for the assessment of welfare in domestic fowl. Appl. Anim. Behav. Sci. 1989, 24, 77–80. [Google Scholar] [CrossRef]
  12. Höhne, A.; Petow, S.; Bessei, W.; Schrader, L. Contrafreeloading and foraging-related behavior in hens differing in laying performance and phylogenetic origin. Poult. Sci. 2023, 102, 102489. [Google Scholar] [CrossRef] [PubMed]
  13. Blokhuis, H.J. Feather-pecking in poultry: Its relation with ground-pecking. Appl. Anim. Behav. Sci. 1986, 16, 63–67. [Google Scholar] [CrossRef]
  14. Huber-Eicher, B.; Wechsler, B. Feather pecking in domestic chicks: Its relation to dustbathing and foraging. Anim. Behav. 1997, 54, 757–768. [Google Scholar] [CrossRef] [PubMed]
  15. Wechsler, B.; Huber-Eicher, B. The effect of foraging material and perch height on feather pecking and feather damage in laying hens. Appl. Anim. Behav. Sci. 1998, 58, 131–141. [Google Scholar] [CrossRef]
  16. Newberry, R.C.; Keeling, L.J.; Estevez, I.; Bilčík, B. Behaviour when young as a predictor of severe feather pecking in adult laying hens: The redirected foraging hypothesis revisited. Appl. Anim. Behav. Sci. 2007, 107, 262–274. [Google Scholar] [CrossRef]
  17. Rudkin, C. Feather pecking and foraging uncorrelated–the redirection hypothesis revisited. Br. Poult. Sci. 2022, 63, 265–273. [Google Scholar] [CrossRef] [PubMed]
  18. Li, G.; Huang, Y.; Chen, Z.; Chesser, G.D., Jr.; Purswell, J.L.; Linhoss, J.; Zhao, Y. Practices and Applications of Convolutional Neural Network-Based Computer Vision Systems in Animal Farming: A Review. Sensors 2021, 21, 1492. [Google Scholar] [CrossRef] [PubMed]
  19. Okinda, C.; Nyalala, I.; Korohou, T.; Okinda, C.; Wang, J.; Achieng, T.; Wamalwa, P.; Mang, T.; Shen, M. A review on computer vision systems in monitoring of poultry: A welfare perspective. Artif. Intell. Agric. 2020, 4, 184–208. [Google Scholar] [CrossRef]
  20. Yang, X.; Bist, R.B.; Paneru, B.; Liu, T.; Applegate, T.; Ritz, C.; Kim, W.; Regmi, P.; Chai, L. Computer Vision-Based cybernetics systems for promoting modern poultry Farming: A critical review. Comput. Electron. Agric. 2024, 225, 109339. [Google Scholar] [CrossRef]
  21. Campbell, M.; Miller, P.; Díaz-Chito, K.; Hong, X.; McLaughlin, N.; Parvinzamir, F.; Del Rincón, J.M.; O’COnnell, N. A computer vision approach to monitor activity in commercial broiler chickens using trajectory-based clustering analysis. Comput. Electron. Agric. 2024, 217, 108591. [Google Scholar] [CrossRef]
  22. Nasiri, A.; Zhao, Y.; Gan, H. Automated detection and counting of broiler behaviors using a video recognition system. Comput. Electron. Agric. 2024, 221, 108930. [Google Scholar] [CrossRef]
  23. Fodor, I.; Taghavi, M.; Ellen, E.D.; van der Sluis, M. Top-view characterization of broiler walking ability and leg health using computer vision. Poult. Sci. 2025, 104, 104724. [Google Scholar] [CrossRef] [PubMed]
  24. Paneru, B.; Bist, R.; Yang, X.; Chai, L. Tracking dustbathing behavior of cage-free laying hens with machine vision technologies. Poult. Sci. 2024, 103, 104289. [Google Scholar] [CrossRef] [PubMed]
  25. Paneru, B.; Bist, R.; Yang, X.; Chai, L. Tracking perching behavior of cage-free laying hens with deep learning technologies. Poult. Sci. 2024, 103, 104281. [Google Scholar] [CrossRef] [PubMed]
  26. Vijayakumar, A.; Vairavasundaram, S. YOLO-based Object Detection Models: A Review and its Applications. Multimed. Tools Appl. 2024, 83, 83535–83574. [Google Scholar] [CrossRef]
  27. Hidayatullah, P.; Syakrani, N.; Sholahuddin, M.R.; Gelar, T.; Tubagus, R. YOLOv8 to YOLO11: A Comprehensive Architecture In-depth Comparative Review. arXiv 2025, arXiv:2501.13400v2. [Google Scholar]
  28. Jegham, N.; Koh, C.Y.; Abdelatti, M.F.; Hendawi, A. YOLO Evolution: A Comprehensive Benchmark and Architectural Review of YOLOv12, YOLO11, and Their Previous Versions. arXiv 2024, arXiv:2411.00201v3. [Google Scholar]
  29. Subedi, S.; Bist, R.B.; Yang, X.; Li, G.; Chai, L. Advanced Deep Learning Methods for Multiple Behavior Classification of Cage-Free Laying Hens. AgriEngineering 2025, 7, 24. [Google Scholar] [CrossRef]
  30. Jocher, G.; Qiu, J.; Chaurasia, A. Ultralytics YOLO. 2023. Available online: https://github.com/ultralytics/ultralytics (accessed on 10 June 2025).
  31. Diwan, T.; Anirudh, G.; Tembhurne, J.V. Object detection using YOLO: Challenges, architectural successors, datasets and applications. Multimed. Tools Appl. 2023, 82, 9243–9275. [Google Scholar] [CrossRef] [PubMed]
  32. Subedi, S.; Bist, R.; Yang, X.; Chai, L. Tracking pecking behaviors and damages of cage-free laying hens with machine vision technologies. Comput. Electron. Agric. 2023, 204, 107545. [Google Scholar] [CrossRef]
  33. Paramathma, M.K.; Kumar, I.B.; Karuppasamypandiyan, M. 2024YOLO Based Automatic Poultry Monitoring System. In Proceedings of the 2024 3rd International Conference for Advancement in Technology (ICONAT), Goa, India, 6–8 September 2024. [Google Scholar] [CrossRef]
  34. Guo, Y.; Aggrey, S.E.; Oladeinde, A.; Johnson, J.; Zock, G.; Chai, L. A machine vision-based method optimized for restoring broiler chicken images occluded by feeding and drinking equipment. Animals 2021, 11, 123. [Google Scholar] [CrossRef] [PubMed]
  35. Pu, H.; Lian, J.; Fan, M. Automatic Recognition of Flock Behavior of Chickens with Convolutional Neural Network and Kinect Sensor. Int. J. Pattern Recognit. Artif. Intell. 2018, 32, 1850023. [Google Scholar] [CrossRef]
Figure 1. Top view of the experimental setup for pens as captured by the overhead camera.
Poultry 04 00034 g001
Figure 2. Clustered bar graph comparing the precision, recall, and mean average precision at 50% intersection over union (mAP@0.5) of trained YOLOv9, YOLOv10, and YOLO11 foraging detection models.
Poultry 04 00034 g002
Figure 3. Combined normalized confusion matrices for the trained foraging detection models.
Poultry 04 00034 g003
Figure 4. Bar graph comparing the model size of each of the models.
Poultry 04 00034 g004
Figure 5. Bar graph comparing the training time for each of the models in foraging detection.
Poultry 04 00034 g005
Figure 6. YOLOv9c model training and validation evaluation plots: The first three columns represent the losses with training losses in the first row and the validation losses in the second row. The 4th and 5th columns of both rows illustrate the performance metrics change across epochs.
Poultry 04 00034 g006
Figure 7. YOLO11m model training and validation evaluation plots. The first three columns represent the losses with training losses in the first row and the validation losses in the second row. The 4th and 5th columns of both rows illustrate the performance metrics change across epochs.
Poultry 04 00034 g007
Figure 8. YOLO11x model training and validation evaluation plots. The first three columns represent the losses with training losses in the first row and the validation losses in the second row. The 4th and 5th columns of both rows illustrate the performance metrics change across epochs.
Poultry 04 00034 g008
Figure 9. YOLOv9c F1 confidence curve: The peak F1 score at its corresponding confidence threshold is indicated in the legend at the top-right corner.
Poultry 04 00034 g009
Figure 10. YOLO11m F1 confidence curve: The peak F1 score at its corresponding confidence threshold is indicated in the legend at the top-right corner.
Poultry 04 00034 g010
Figure 11. YOLO11x F1 confidence curve: The peak F1 score at its corresponding confidence threshold is indicated in the legend at the top-right corner.
Poultry 04 00034 g011
Figure 12. Foraging prediction of trained YOLOv9c on a test image. Predicted bounding boxes are shown in blue, with the predicted class label and confidence score displayed above each box.
Poultry 04 00034 g012
Figure 13. Foraging prediction of trained YOLO11m on a test image. Predicted bounding boxes are shown in blue, with the predicted class label and confidence score displayed above each box.
Poultry 04 00034 g013
Figure 14. Foraging prediction of trained YOLO11x on a test image. Predicted bounding boxes are shown in blue, with the predicted class label and confidence score displayed above each box.
Poultry 04 00034 g014
Table 1. Computational components with their respective specifications are used to train and test the models.
ComponentSpecification
GPUNVIDIA RTX 4000 (Ada Generation)
Parallel computing platform and APICUDA version: 12.5
RAM64 GB
Operating systemUbuntu 24.1
LibrariesPyTorch 2.7.0, Ultralytics, OpenCV
Disclaimer/Publisher’s Note: The statements, opinions and data contained in all publications are solely those of the individual author(s) and contributor(s) and not of MDPI and/or the editor(s). MDPI and/or the editor(s) disclaim responsibility for any injury to people or property resulting from any ideas, methods, instructions or products referred to in the content.

